
Investigating Delayed Rupture of Flow Diverter-Treated Giant Aneurysm Using Simulated Fluid–Structure Interactions


Abstract
1. Introduction
2. Methods
2.1. Patient Record
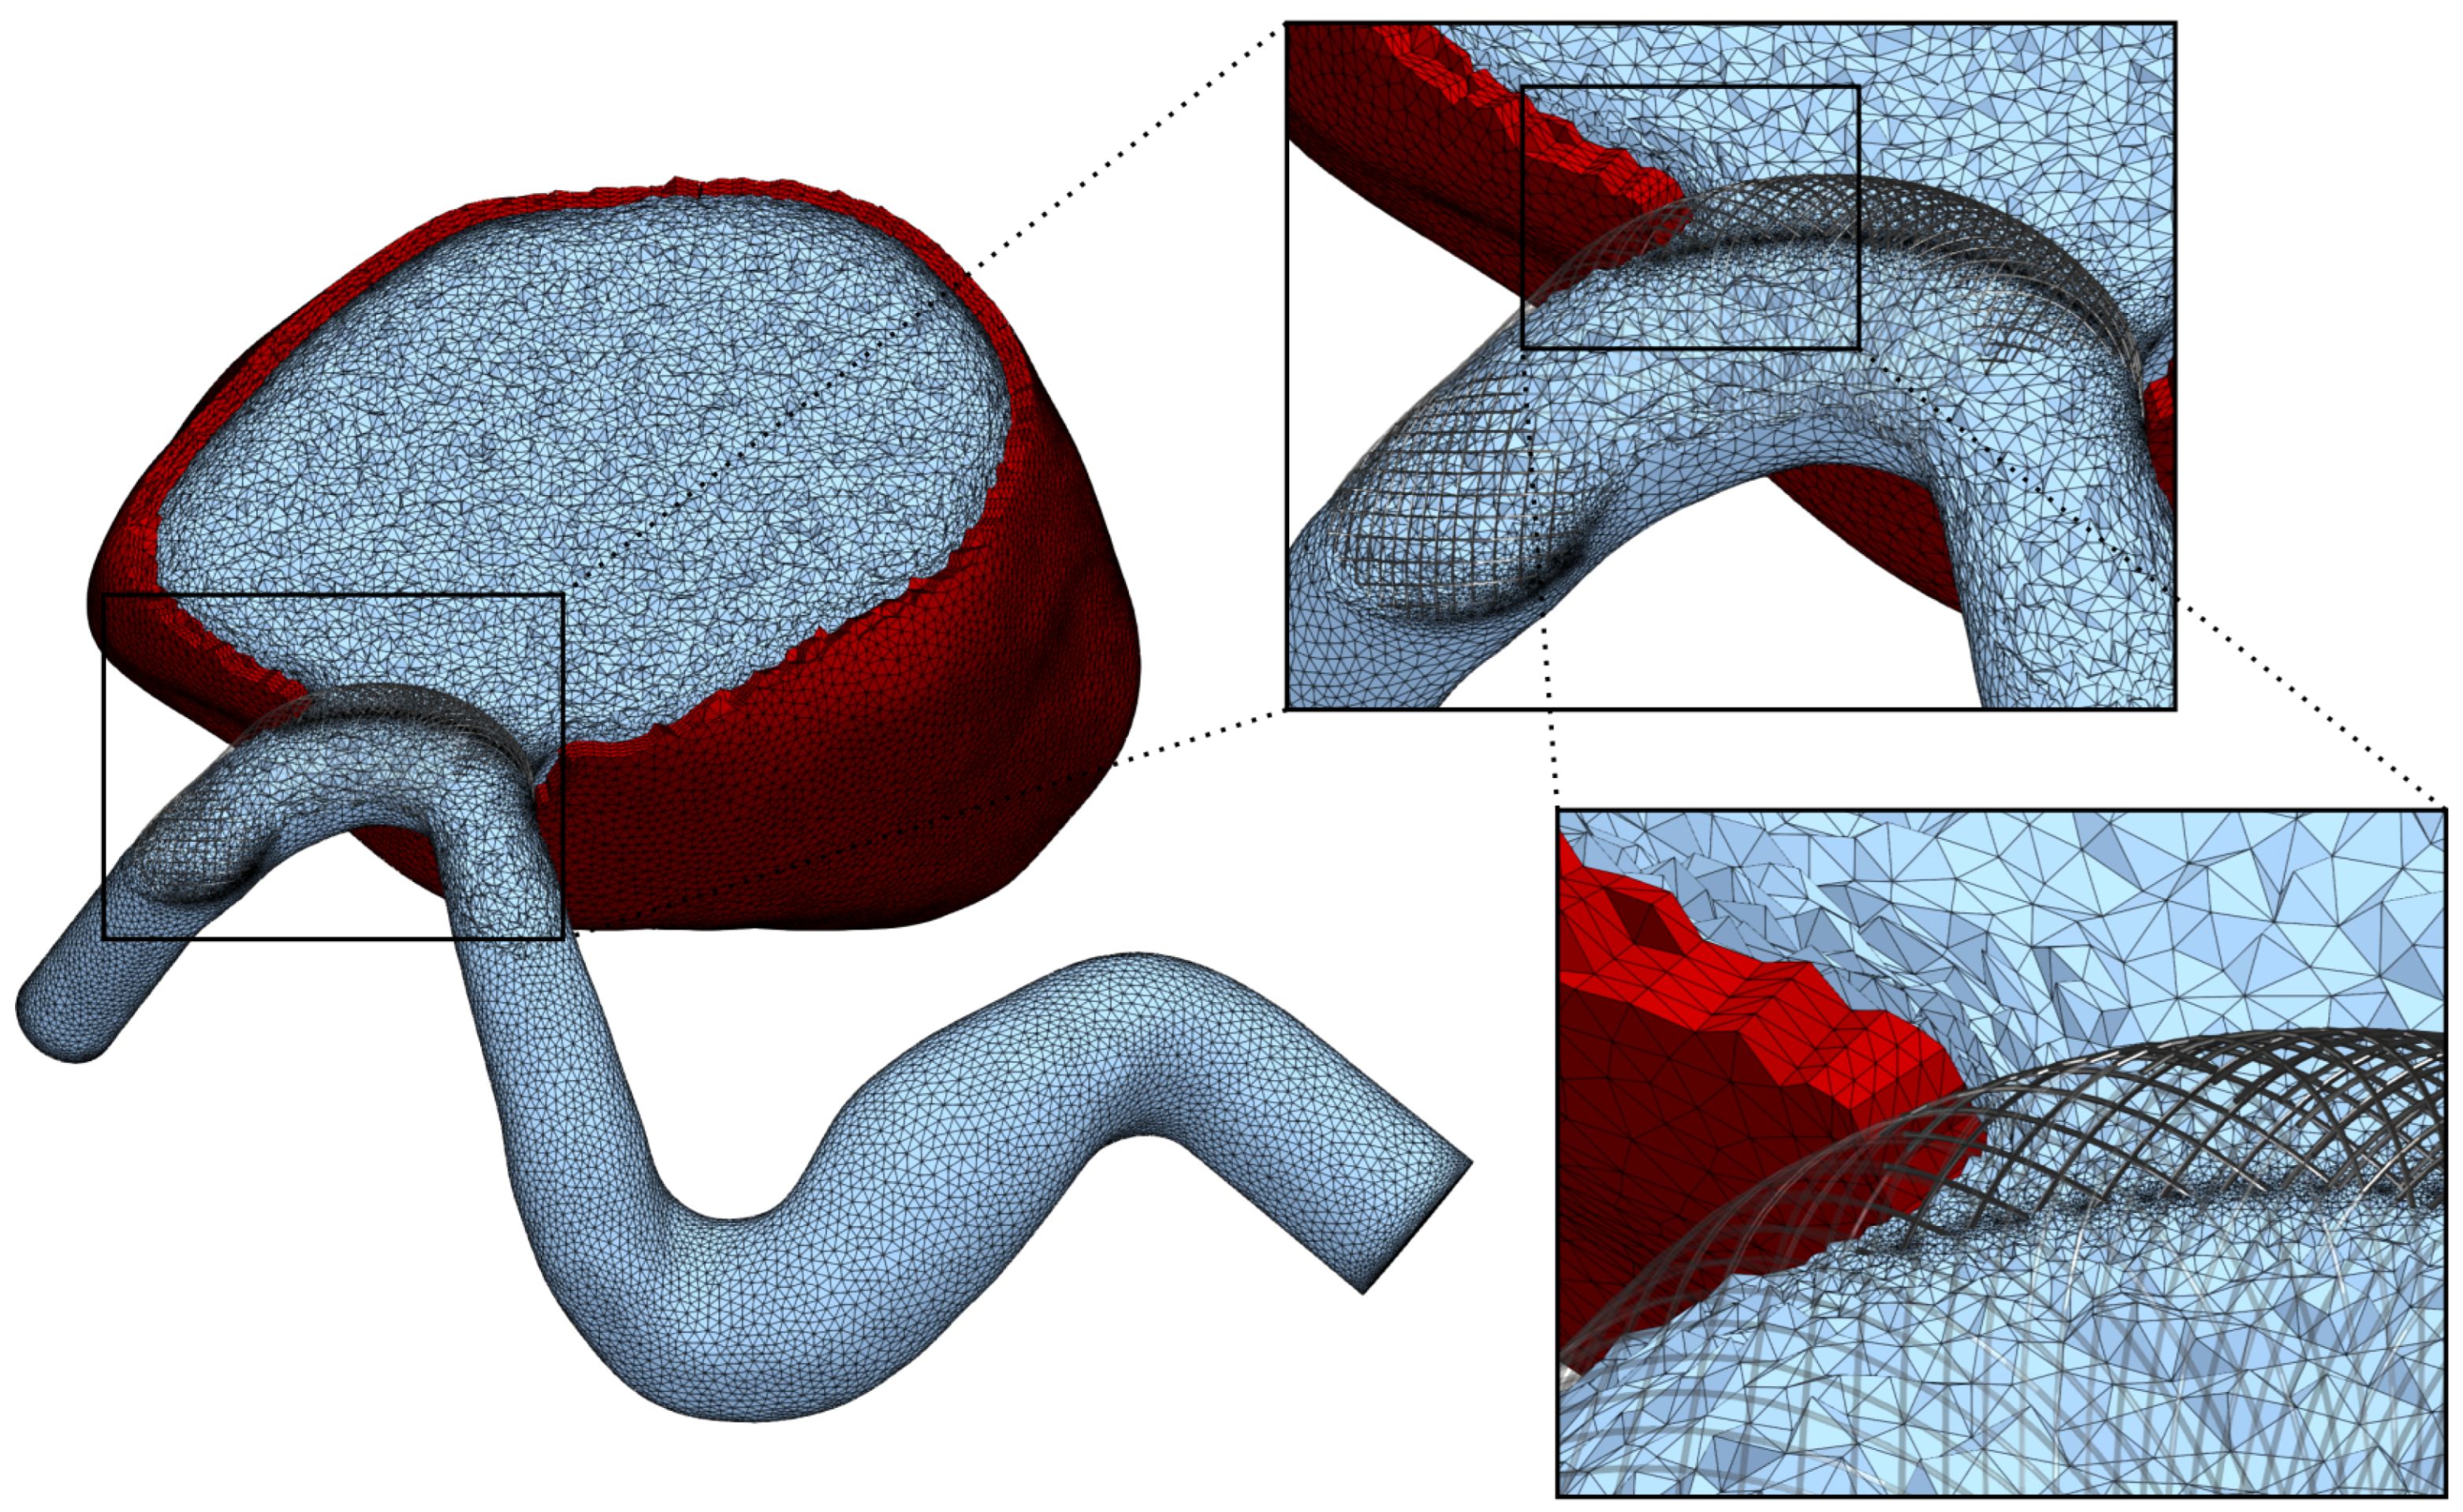
2.2. Mesh Generation
2.3. Fluid Dynamics
2.4. Coupled Solid Mechanics
3. Results
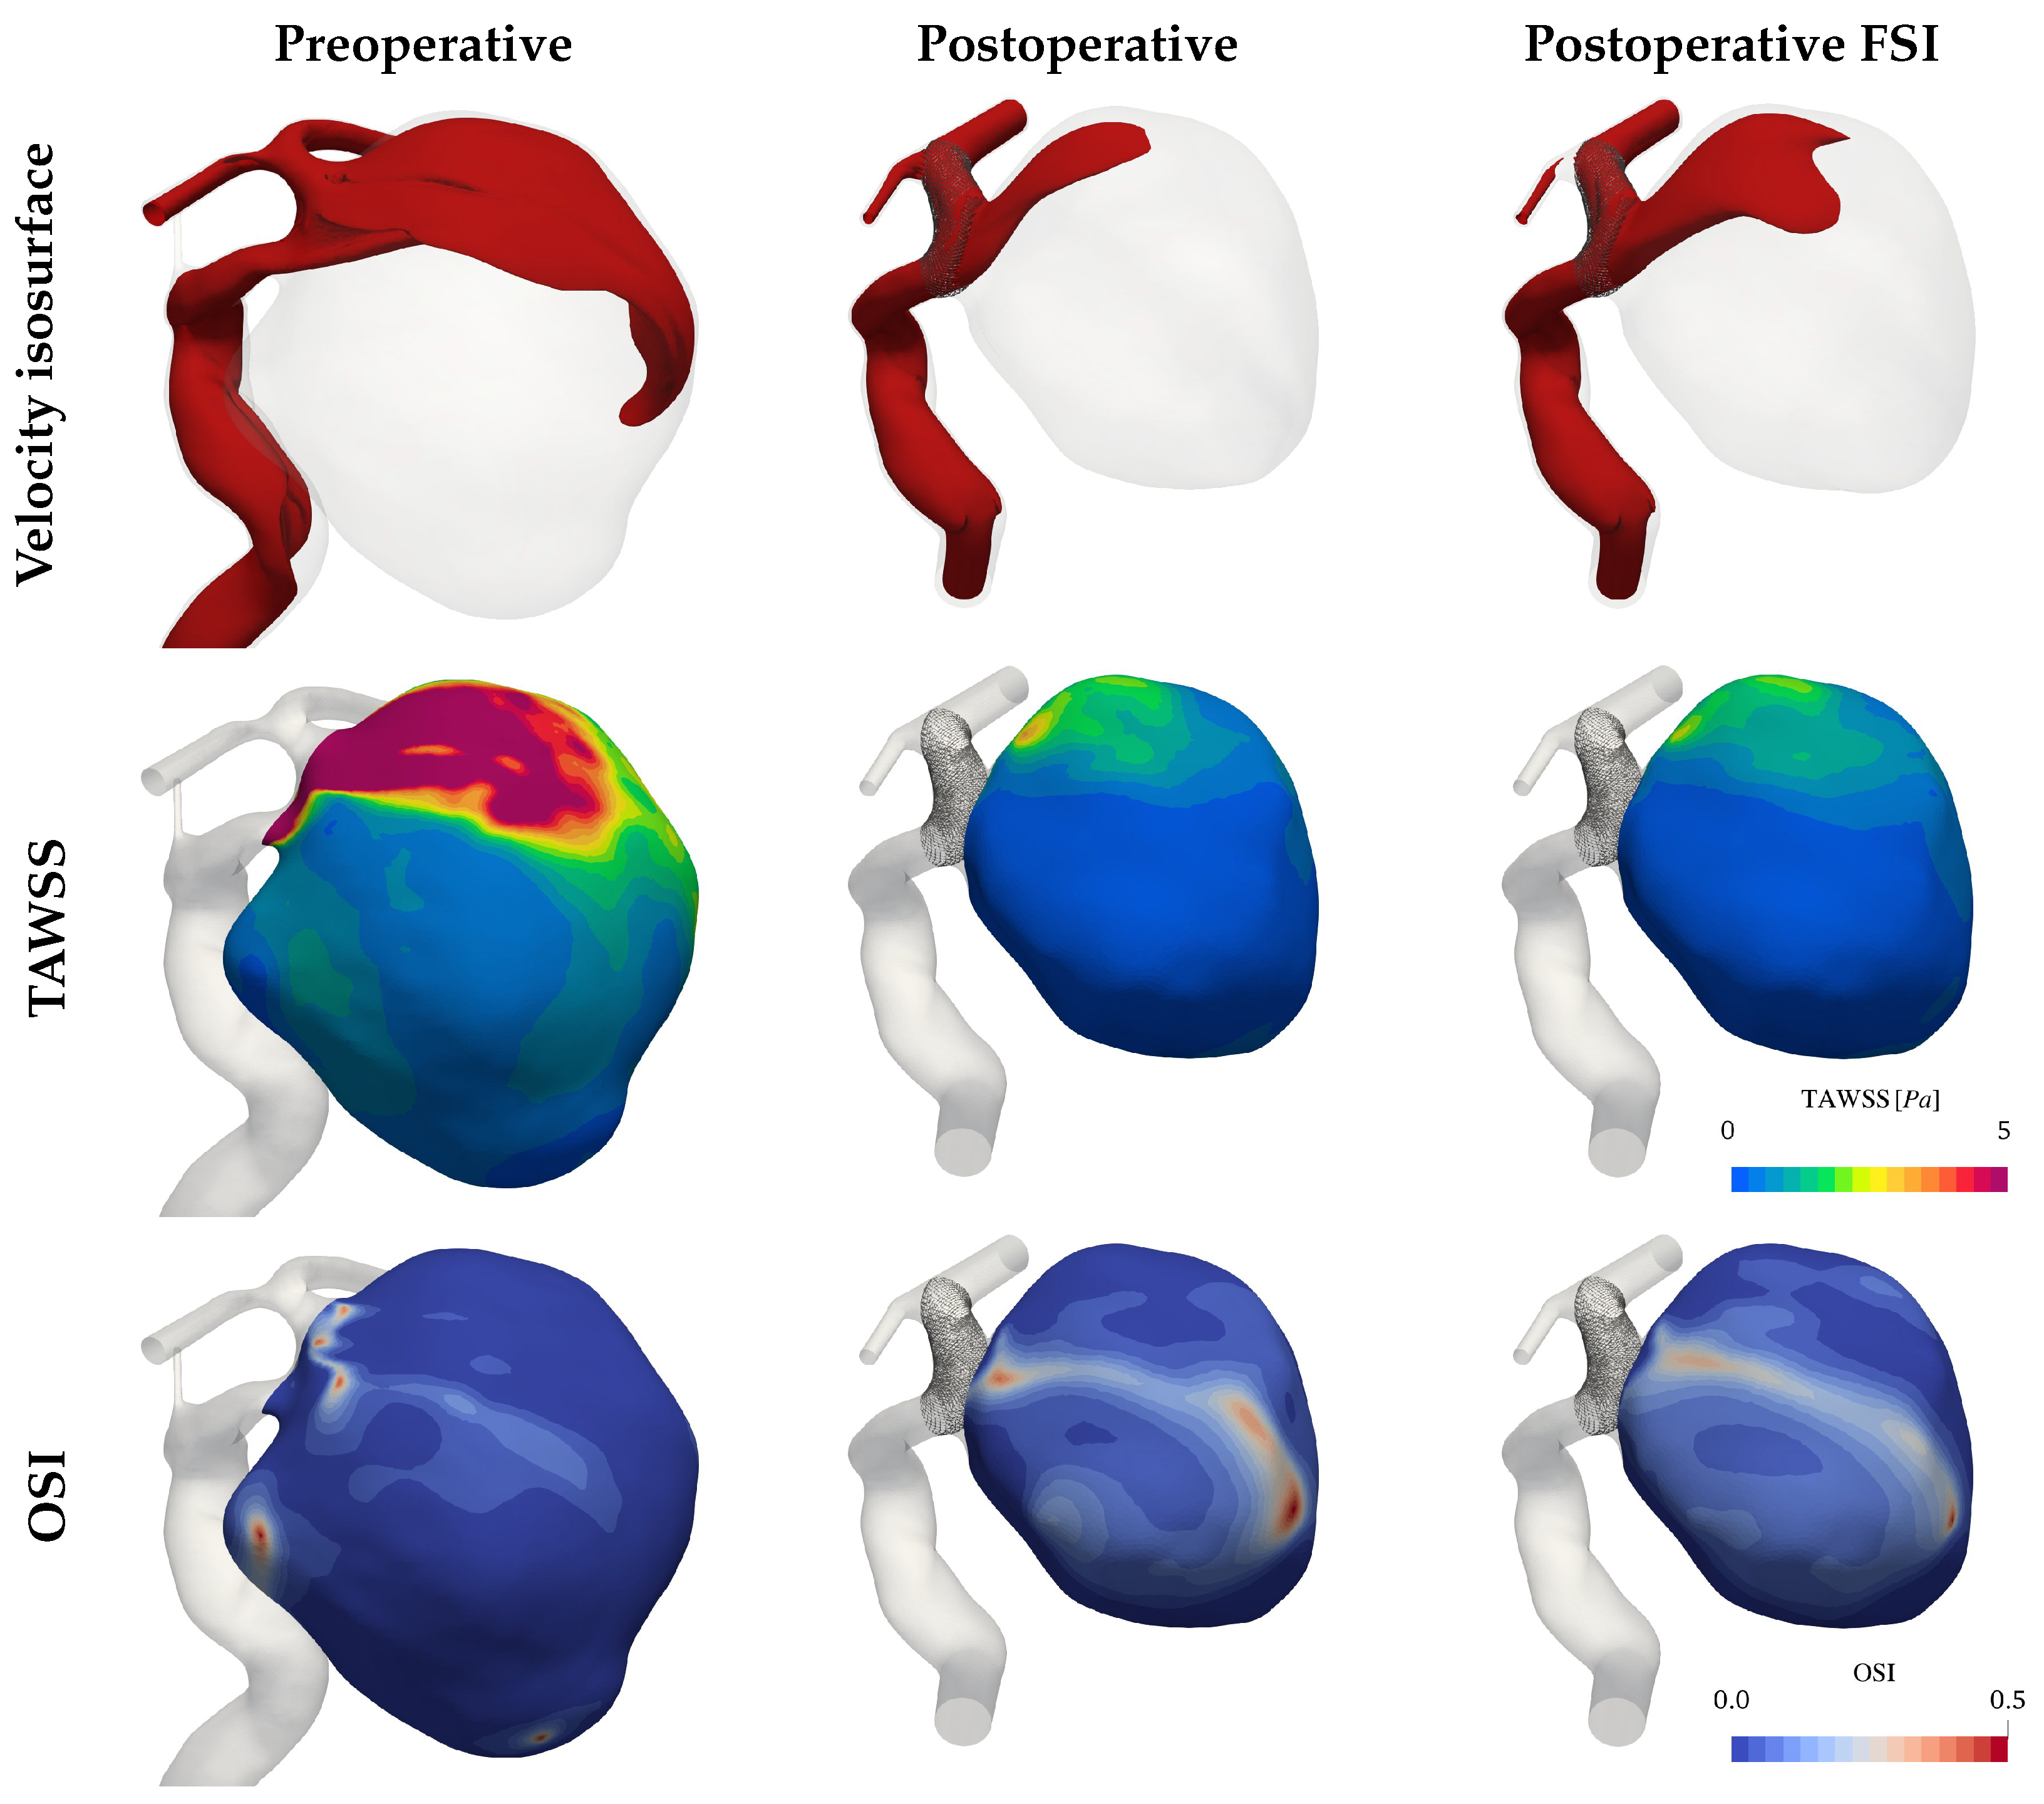
3.1. Hemodynamics
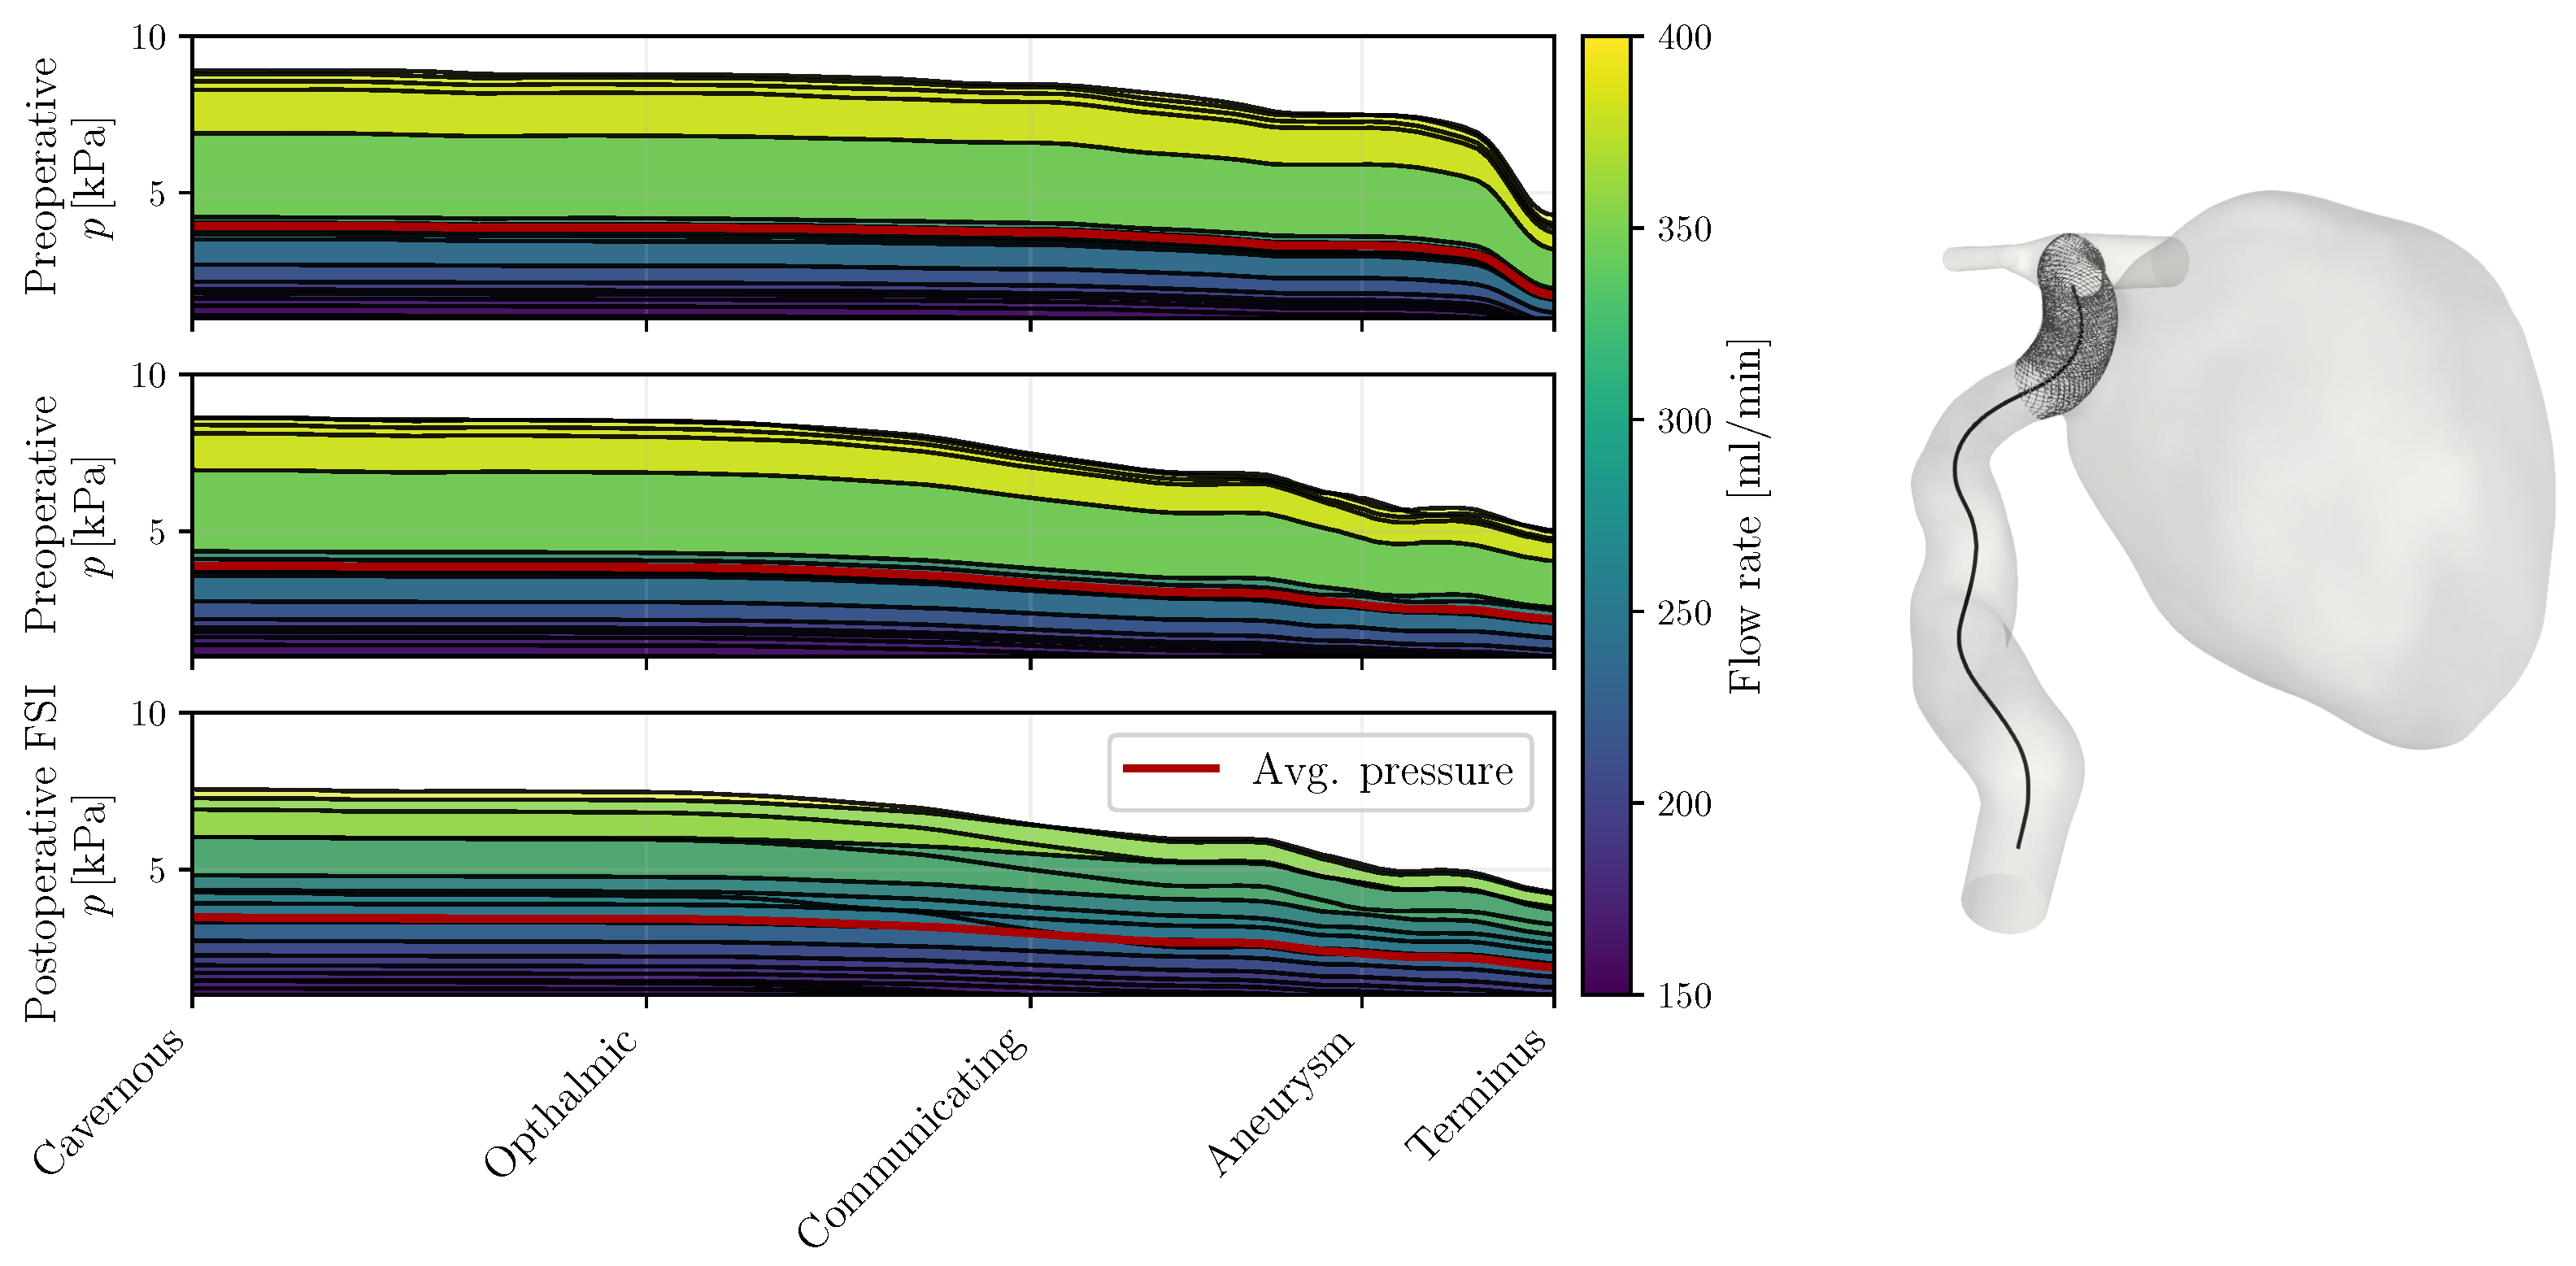
3.2. Pressure
4. Discussion
4.1. Pressure Hypothesis
4.2. Thrombosis Hypothesis
4.3. Complex Flow Hypothesis
4.4. Limitations
5. Conclusions
Author Contributions
Funding
Institutional Review Board Statement
Informed Consent Statement
Data Availability Statement
Acknowledgments
Conflicts of Interest
Abbreviations
| IA | Intracranial aneurysm |
| FD | Flow diverter |
| WSS | Wall shear stress |
| OSI | Oscillatory shear index |
| FSI | Fluid–structure interaction |
| ICA | Internal carotid artery |
| VMS | Variational multiscale method |
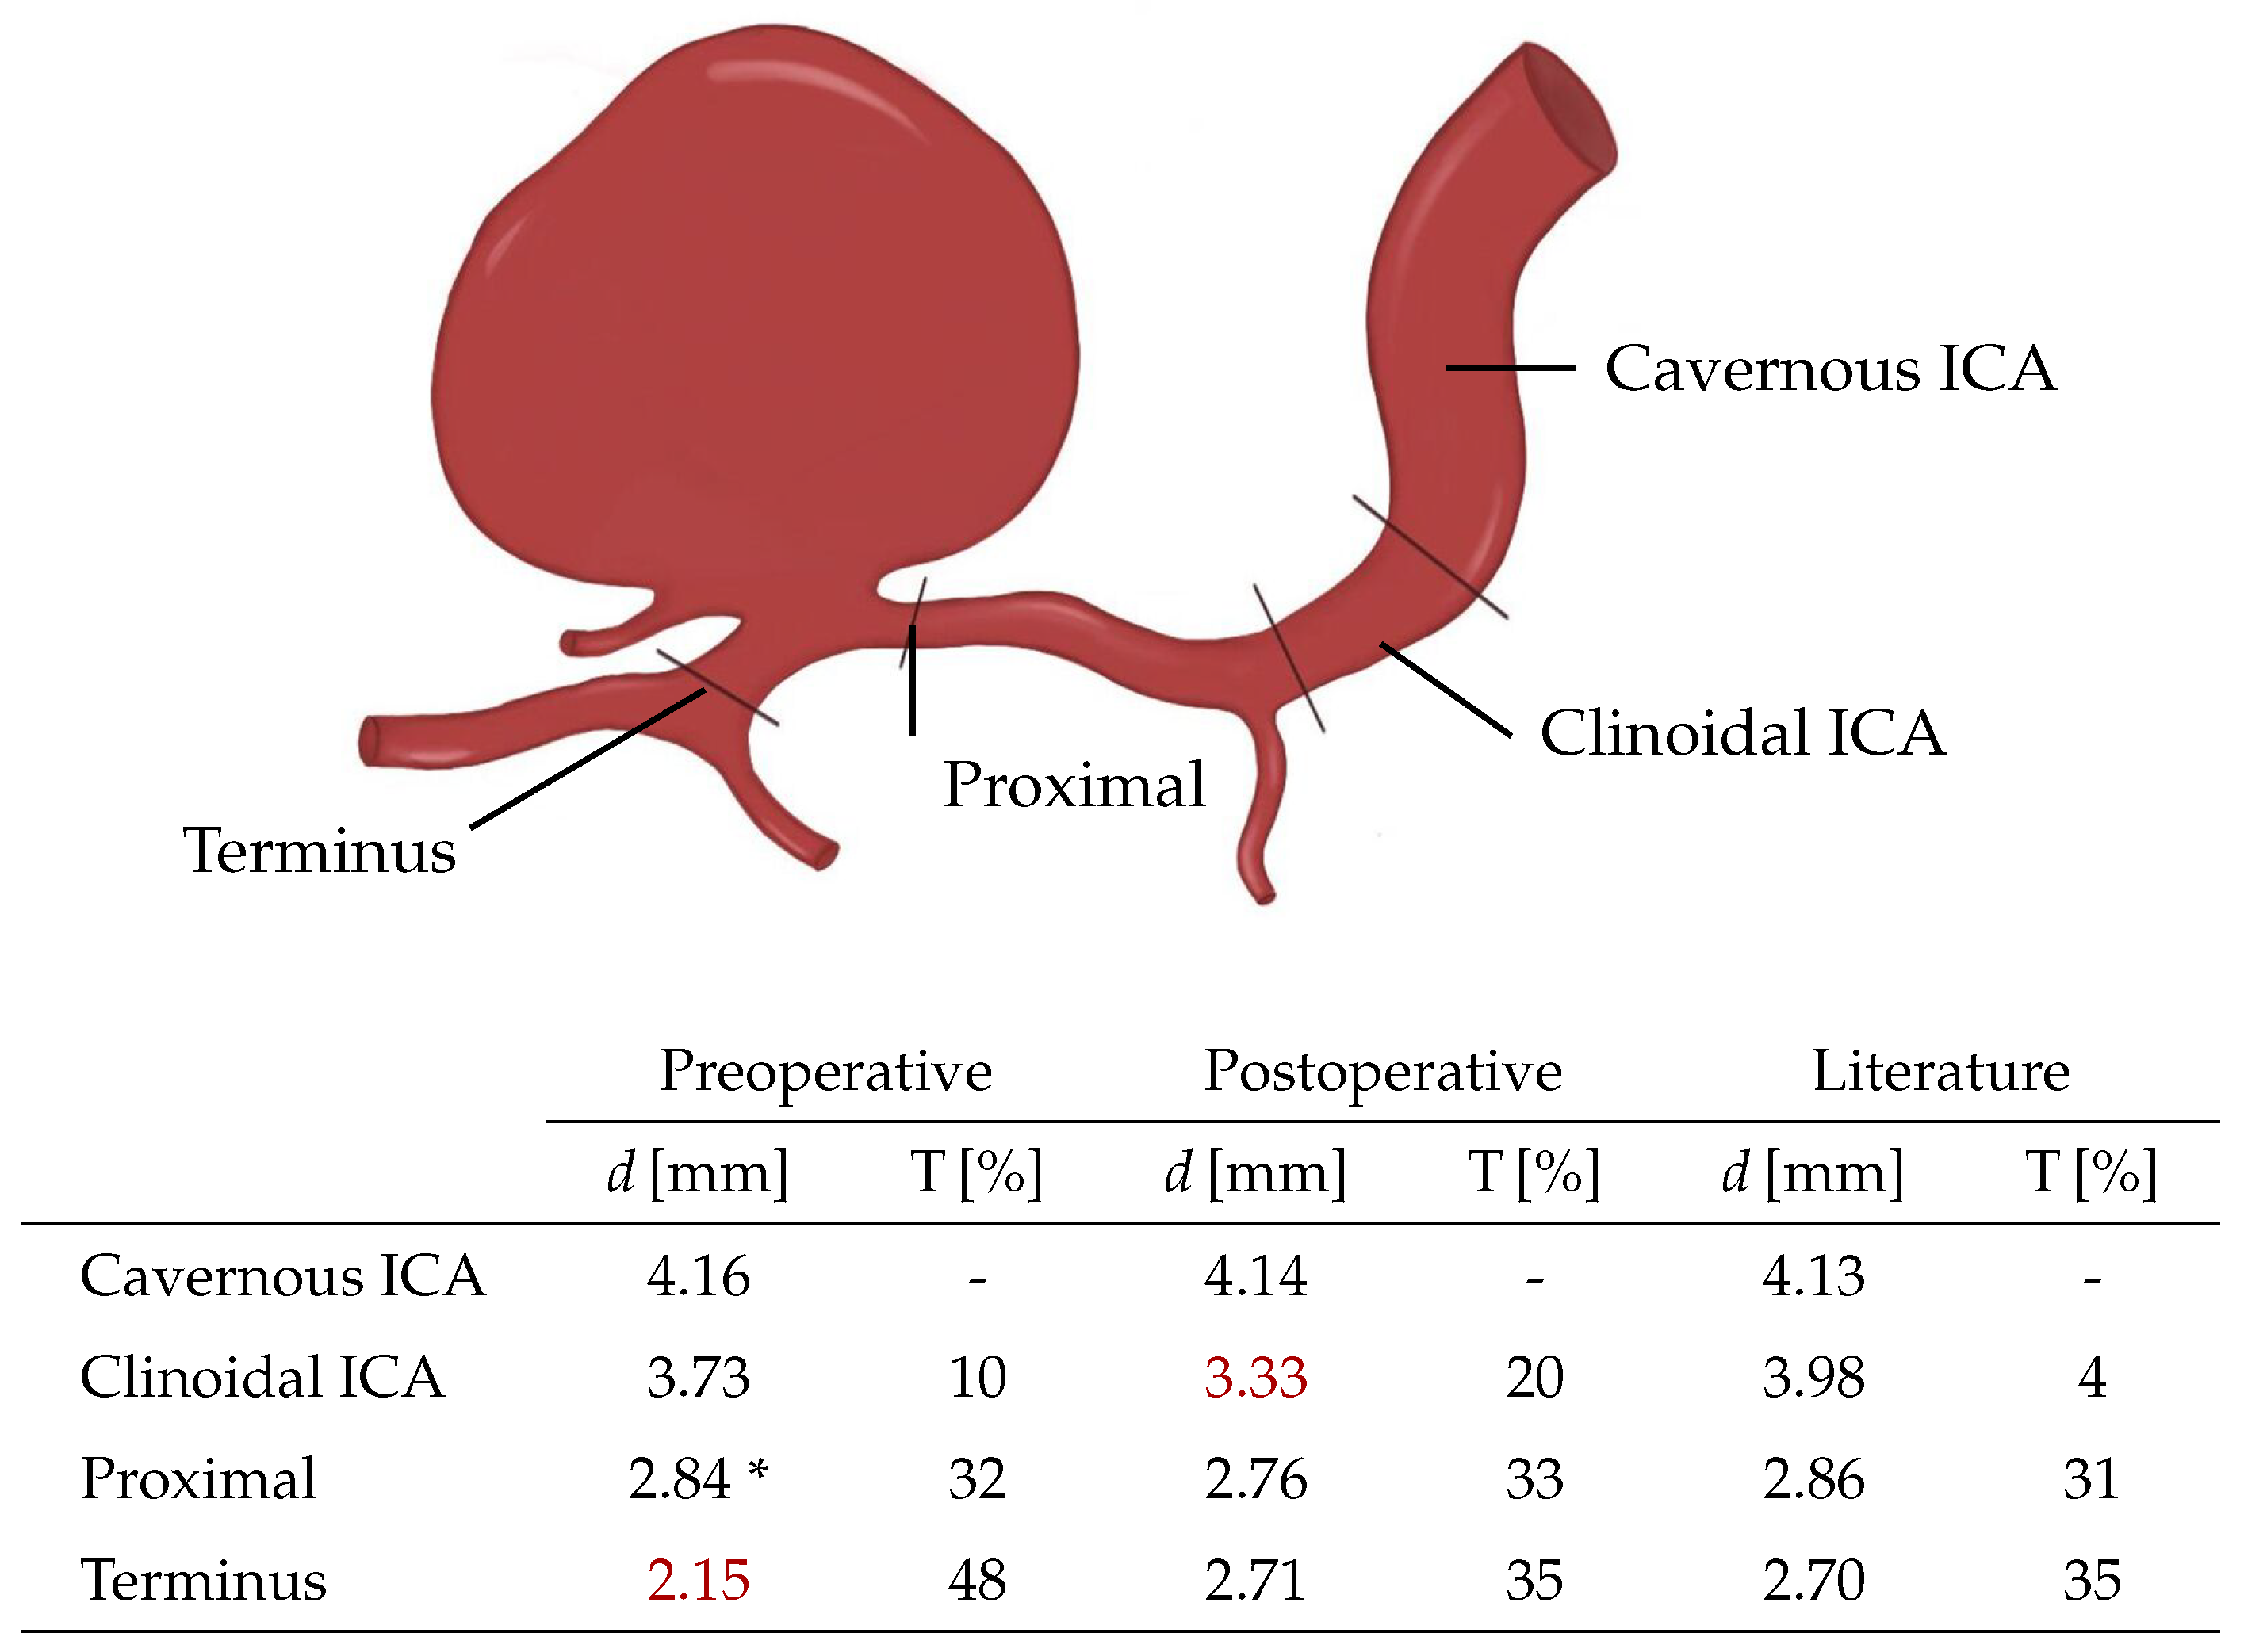
Appendix A. Tapering
Appendix B. Reduced Stent Model

References
- Lonjon, M.; Pennes, F.; Sedat, J.; Bataille, B. Epidemiology, genetic, natural history and clinical presentation of giant cerebral aneurysms. Neurochirurgie 2015, 61, 361–365. [Google Scholar] [CrossRef] [PubMed]
- Etminan, N.; Rinkel, G.J. Unruptured intracranial aneurysms: Development, rupture and preventive management. Nat. Rev. Neurol. 2016, 12, 699–713. [Google Scholar] [CrossRef] [PubMed]
- Chalouhi, N.; Tjoumakaris, S.; Gonzalez, L.F.; Dumont, A.S.; Starke, R.M.; Hasan, D.; Wu, C.; Singhal, S.; Moukarzel, L.A.; Rosenwasser, R.; et al. Coiling of large and giant aneurysms: Complications and long-term results of 334 cases. Am. J. Neuroradiol. 2014, 35, 546–552. [Google Scholar] [CrossRef]
- Sluzewski, M.; Menovsky, T.; van Rooij, W.J.; Wijnalda, D. Coiling of Very Large or Giant Cerebral Aneurysms: Long-Term Clinical and Serial Angiographic Results. Am. J. Neuroradiol. 2003, 24, 257–262. [Google Scholar]
- Lobsien, D.; Clajus, C.; Behme, D.; Ernst, M.; Riedel, C.H.; Abu-Fares, O.; Götz, F.G.; Fiorella, D.; Klisch, J. Aneurysm treatment in acute SAH with hydrophilic-coated flow diverters under single-antiplatelet therapy: A 3-center experience. Am. J. Neuroradiol. 2021, 42, 508–515. [Google Scholar] [CrossRef] [PubMed]
- Hou, K.; Li, G.; Lv, X.; Xu, B.; Xu, K.; Yu, J. Delayed rupture of intracranial aneurysms after placement of intra-luminal flow diverter. Neuroradiol. J. 2020, 33, 451–464. [Google Scholar] [CrossRef]
- Rouchaud, A.; Brinjikji, W.; Lanzino, G.; Cloft, H.J.; Kadirvel, R.; Kallmes, D.F. Delayed hemorrhagic complications after flow diversion for intracranial aneurysms: A literature overview. Neuroradiology 2016, 58, 171–177. [Google Scholar] [CrossRef]
- Cebral, J.R.; Mut, F.; Raschi, M.; Scrivano, E.; Ceratto, R.; Lylyk, P.; Putman, C.M. Aneurysm rupture following treatment with flow-diverting stents: Computational hemodynamics analysis of treatment. Am. J. Neuroradiol. 2011, 32, 27–33. [Google Scholar] [CrossRef]
- Kulcsár, Z.; Houdart, E.; Bonafé, A.; Parker, G.; Millar, J.; Goddard, A.J.; Renowden, S.; Gál, G.; Turowski, B.; Mitchell, K.; et al. Intra-aneurysmal thrombosis as a possible cause of delayed aneurysm rupture after flow-diversion treatment. Am. J. Neuroradiol. 2011, 32, 20–25. [Google Scholar] [CrossRef]
- Li, W.; Tian, Z.; Zhu, W.; Zhang, Y.S.; Wang, K.; Zhang, Y.; Wang, Y.; Yang, X.; Liu, J. Hemodynamic analysis of postoperative rupture of unruptured intracranial aneurysms after placement of flow-diverting stents: A matched case-control study. Am. J. Neuroradiol. 2019, 40, 1916–1923. [Google Scholar] [CrossRef]
- Steinman, D.A.; Milner, J.S.; Norley, C.J.; Lownie, S.P.; Holdsworth, D.W. Image-Based Computational Simulation of Flow Dynamics in a Giant Intracranial Aneurysm. Am. J. Neuroradiol. 2003, 24, 559–566. [Google Scholar] [PubMed]
- Zhou, J.; Guo, Q.; Chen, Y.; Lin, B.; Ding, S.; Zhao, H.; Pan, Y.; Wan, J.; Zhao, B. Irregular Pulsation of Intracranial Aneurysm Detected by Four-Dimensional CT Angiography and Associated with Small Aneurysm Rupture: A Single-Center Prospective Analysis. Front. Neurol. 2022, 13, 1–9. [Google Scholar] [CrossRef]
- Vanrossomme, A.; Eker, O.; Thiran, J.P.; Courbebaisse, G.; Zouaoui Boudjeltia, K. Intracranial Aneurysms: Wall Motion Analysis for Prediction of Rupture. Am. J. Neuroradiol. 2015, 36, 1796–1802. [Google Scholar] [CrossRef] [PubMed]
- Stam, L.B.; Aquarius, R.; de Jong, G.A.; Slump, C.H.; Meijer, F.J.; Boogaarts, H.D. A review on imaging techniques and quantitative measurements for dynamic imaging of cerebral aneurysm pulsations. Sci. Rep. 2021, 11, 2175. [Google Scholar] [CrossRef]
- Voß, S.; Glaßer, S.; Hoffmann, T.; Beuing, O.; Weigand, S.; Jachau, K.; Preim, B.; Thévenin, D.; Janiga, G.; Berg, P. Fluid-Structure Simulations of a Ruptured Intracranial Aneurysm: Constant versus Patient-Specific Wall Thickness. Comput. Math. Methods Med. 2016, 2016, 9854539. [Google Scholar] [CrossRef]
- Goetz, A.; Jeken-Rico, P.; Chau, Y.; Sédat, J.; Larcher, A.; Hachem, E. Analysis of Intracranial Aneurysm Haemodynamics Altered by Wall Movement. Bioengineering 2024, 11, 269. [Google Scholar] [CrossRef]
- Kikinis, R.; Pieper, S.D.; Vosburgh, K.G. 3D Slicer: A Platform for Subject-Specific Image Analysis, Visualization, and Clinical Support. In Intraoperative Imaging and Image-Guided Therapy; Springer: New York, NY, USA, 2014; Chapter 3; pp. 277–289. [Google Scholar] [CrossRef]
- Jeken-Rico, P.; Goetz, A.; Meliga, P.; Larcher, A.; Özpeynirci, Y.; Hachem, E. Evaluating the Impact of Domain Boundaries on Hemodynamics in Intracranial Aneurysms within the Circle of Willis. Fluids 2023, 9, 1. [Google Scholar] [CrossRef]
- Jeken-Rico, P.; Chau, Y.; Goetz, A.; Lannelongue, V.; Sédat, J.; Hachem, E. Virtual Flow Diverter Deployment and Embedding for Hemodynamic Simulations. Comput. Biol. Med. 2024, 180, 109023. [Google Scholar] [CrossRef] [PubMed]
- Hachem, E.; Rivaux, B.; Kloczko, T.; Digonnet, H.; Coupez, T. Stabilized finite element method for incompressible flows with high Reynolds number. J. Comput. Phys. 2010, 229, 8643–8665. [Google Scholar] [CrossRef]
- Hoi, Y.; Wasserman, B.A.; Xie, Y.J.; Najjar, S.S.; Ferruci, L.; Lakatta, E.G.; Gerstenblith, G.; Steinman, D.A. Characterization of volumetric flow rate waveforms at the carotid bifurcations of older adults. Physiol. Meas. 2011, 31, 291–302. [Google Scholar] [CrossRef]
- Suzuki, T.; Takao, H.; Suzuki, T.; Hataoka, S.; Kodama, T.; Aoki, K.; Otani, K.; Ishibashi, T.; Yamamoto, H.; Murayama, Y.; et al. Proposal of hematocrit-based non-Newtonian viscosity model and its significance in intracranial aneurysm blood flow simulation. J. Non-Newton. Fluid Mech. 2021, 290, 104511. [Google Scholar] [CrossRef]
- Jain, K.; Roller, S.; Mardal, K.A. Transitional flow in intracranial aneurysms—A space and time refinement study below the Kolmogorov scales using Lattice Boltzmann Method. Comput. Fluids 2016, 127, 36–46. [Google Scholar] [CrossRef]
- Rivlin, R.S. Large Elastic Deformations of Isotropic Materials. IV. Further Developments of the General Theory. Philos. Trans. R. Soc. Lond. Ser. A 1948, 241, 379–397. [Google Scholar] [CrossRef]
- Simo, J.; Taylor, R.; Pister, K. Variational and projection methods for the volume constraint in finite deformation elasto-plasticity. Comput. Methods Appl. Mech. Eng. 1985, 51, 177–208. [Google Scholar] [CrossRef]
- Küttler, U.; Wall, W. Fixed-point fluid-structure interaction solvers with dynamic relaxation. Comput. Mech. 2008, 43, 61–72. [Google Scholar] [CrossRef]
- Breuer, M.; De Nayer, G.; Münsch, M.; Gallinger, T.; Wüchner, R. Fluid-structure interaction using a partitioned semi-implicit predictor-corrector coupling scheme for the application of large-eddy simulation. J. Fluids Struct. 2012, 29, 107–130. [Google Scholar] [CrossRef]
- Habchi, C.; Russeil, S.; Bougeard, D.; Harion, J.L.; Lemenand, T.; Ghanem, A.; Valle, D.D.; Peerhossaini, H. Partitioned solver for strongly coupled fluid-structure interaction. Comput. Fluids 2013, 71, 306–319. [Google Scholar] [CrossRef]
- Shamanskiy, A.; Simeon, B. Mesh moving techniques in fluid-structure interaction: Robustness, accumulated distortion and computational efficiency. Comput. Mech. 2021, 67, 583–600. [Google Scholar] [CrossRef]
- Larrabide, I.; Geers, A.J.; Morales, H.G.; Bijlenga, P.; Rüfenacht, D.A. Change in aneurysmal flow pulsatility after flow diverter treatment. Comput. Med Imaging Graph. 2016, 50, 2–8. [Google Scholar] [CrossRef]
- Sarrami-Foroushani, A.; Lassila, T.; MacRaild, M.; Asquith, J.; Roes, K.C.; Byrne, J.V.; Frangi, A.F. In-silico trial of intracranial flow diverters replicates and expands insights from conventional clinical trials. Nat. Commun. 2021, 12, 3861. [Google Scholar] [CrossRef]
- Steinman, D.A.; Hoi, Y.; Fahy, P.; Morris, L.; Walsh, M.T.; Aristokleous, N.; Anayiotos, A.S.; Papaharilaou, Y.; Arzani, A.; Shadden, S.C.; et al. Variability of computational fluid dynamics solutions for pressure and flow in a giant aneurysm: The ASME 2012 summer bioengineering conference CFD challenge. J. Biomech. Eng. 2013, 135, 021016. [Google Scholar] [CrossRef] [PubMed]
- Baz, R.A.; Scheau, C.; Niscoveanu, C.; Bordei, P. Morphometry of the entire internal carotid artery on ct angiography. Medicina 2021, 57, 832. [Google Scholar] [CrossRef] [PubMed]
- Berg, P.; Saalfeld, S.; Voß, S.; Beuing, O.; Janiga, G. A review on the reliability of hemodynamic modeling in intracranial aneurysms: Why computational fluid dynamics alone cannot solve the equation. Neurosurg. Focus 2019, 47, E15. [Google Scholar] [CrossRef] [PubMed]
- Hirato, M.; Tsumoto, T.; Kobayashi, Y.; Aiura, R.; Hirose, E.; Umesaki, A.; Nakayama, S. Delayed rupture of a large intracranial internal carotid artery aneurysm after flow diverter placement. Surg. Neurol. Int. 2023, 14, 446. [Google Scholar] [CrossRef]
- Cebral, J.; Mut, F.; Weir, J.; Putman, C. Association of Hemodynamic Characteristics and Cerebral Aneurysm Rupture. Am. J. Neuroradiol. 2010, 32, 264–270. [Google Scholar] [CrossRef]


Disclaimer/Publisher’s Note: The statements, opinions and data contained in all publications are solely those of the individual author(s) and contributor(s) and not of MDPI and/or the editor(s). MDPI and/or the editor(s) disclaim responsibility for any injury to people or property resulting from any ideas, methods, instructions or products referred to in the content. |
© 2025 by the authors. Licensee MDPI, Basel, Switzerland. This article is an open access article distributed under the terms and conditions of the Creative Commons Attribution (CC BY) license (https://creativecommons.org/licenses/by/4.0/).
Share and Cite
Jeken-Rico, P.; Chau, Y.; Goetz, A.; Sedat, J.; Hachem, E. Investigating Delayed Rupture of Flow Diverter-Treated Giant Aneurysm Using Simulated Fluid–Structure Interactions. Bioengineering 2025, 12, 305. https://doi.org/10.3390/bioengineering12030305
Jeken-Rico P, Chau Y, Goetz A, Sedat J, Hachem E. Investigating Delayed Rupture of Flow Diverter-Treated Giant Aneurysm Using Simulated Fluid–Structure Interactions. Bioengineering. 2025; 12(3):305. https://doi.org/10.3390/bioengineering12030305
Chicago/Turabian StyleJeken-Rico, Pablo, Yves Chau, Aurèle Goetz, Jacques Sedat, and Elie Hachem. 2025. "Investigating Delayed Rupture of Flow Diverter-Treated Giant Aneurysm Using Simulated Fluid–Structure Interactions" Bioengineering 12, no. 3: 305. https://doi.org/10.3390/bioengineering12030305
APA StyleJeken-Rico, P., Chau, Y., Goetz, A., Sedat, J., & Hachem, E. (2025). Investigating Delayed Rupture of Flow Diverter-Treated Giant Aneurysm Using Simulated Fluid–Structure Interactions. Bioengineering, 12(3), 305. https://doi.org/10.3390/bioengineering12030305