Abstract
Tissue engineering technology has been advanced and applied to various applications in the past few years. The presence of a bioreactor is one key factor to the successful development of advanced tissue engineering products. In this work, we developed a programmable bioreactor with a controlling program that allowed each component to be automatically operated. Moreover, we developed a new pH sensor for non-contact and real-time pH monitoring. We demonstrated that the prototype bioreactor could facilitate automatic cell culture of L929 cells. It showed that the cell viability was greater than 80% and cell proliferation was enhanced compared to that of the control obtained by a conventional cell culture procedure. This result suggests the possibility of a system that could be potentially useful for medical and industrial applications, including cultured meat, drug testing, etc.
1. Introduction
Tissue engineering has been developed with the aim of increasing the opportunity of substituted tissue production for restoring or regenerating tissue and organ function. In recent years, development in tissue engineering technology has grown rapidly, and it has been widely applied to various fields apart from the medical area, such as organs-on-chip, bioelectronic devices, cultured meat, etc. [1,2]. The production of tissue engineering mainly relies on the cell culture process. Therefore, quality control of cell culture conditions is essential for tissue engineering research [3]. The critical factors for mammalian cell culture include temperature, pH, O2 and CO2 concentrations, humidity, nutrition and growth factor content, etc. [4,5,6]. In a laboratory, the cell culture process is time-consuming and laborious. Therefore, in order to increase cell production capacity and reduce human error, an automatic and programmable bioreactor for tissue engineering equipped with cell condition monitoring could reduce time and workload for researchers. Also, the monitoring system could provide useful data for profiling cell growth and enhancing the productivity of the process [7,8].
Nowadays, automation of analytical systems has been utilized in many areas, such as in clinical, pharmaceutical, and biomedical applications [9,10,11]. The automatic system has played an important role in both qualitative and quantitative analysis. Various analytical techniques have been employed (for example, electrochemical, optical, and mass spectroscopic methods). The robotic automation could offer high precision and high system throughput while reducing analysis costs. A study of integrated measurement tools or sensors for cell metabolism monitoring through cell culture procedures has been widely of interest for a decade. There are several types of sensors integrated into general cell cultivation, bioreactors, and labs on a chip, such as oxygen sensors, pH sensors, and glucose-lactate biosensors [12]. The role of a cell culture monitoring tool indicates the viability of the cells, the consumption of nutrients, the nutrient yield in fermentation media, and the effect of drugs [13,14,15].
There have been several lab-on-chip developments for cell culture and other biomedical applications. In organ-on-chip, the microfluidic platforms allowed co-culture of different cells to mimic the organ systems for drug testing [16]. Many studies involved real-time monitoring of cell activity and gene expression [17,18,19]. They provided a useful platform for cellular investigation. However, the number of cells on the lab-on-chip is limited and the results from microscopic experiments could be different, so scale-up could be challenging [20]. Moreover, there are limitations concerning the complications and availability of fabrication technology for general research laboratories.
In this work, an automatic programmable bioreactor with a pH monitoring system was developed. All system components were made in-house with computer-aided design (CAD) and 3D-printing techniques. The bioreactor consists of cell culture chamber, syringe pump, selector, pH sensor, and a controlling program. The developed system was customizable for different cell types, and the program was customizable for different culture conditions.
Two types of 3D printing techniques were used. The main 3D printing technology used is liquid crystal display (LCD)-based stereolithography (SLA) that is based on photopolymerization of monomer and oligomer resin layer by layer [21]. This 3D printing technique has the advantage of high-resolution printing, but the size of printing object is limited by the LCD size, so it was chosen for making small and detailed components such as selector and pH sensor case. On the other hand, fused deposition modeling (FDM) 3D printing was employed for large and less-detailed components such as a syringe pump.
The obtained data from the pH monitoring system could also be tracked for inspection. The developed system was demonstrated with cell culture of the L929 cell line in comparison with the conventional cell culture procedure.
2. Materials and Methods
2.1. Design and Construction of Bioreactor
The bioreactor consists of cell culture chamber, syringe pump, selector, pH sensor and controlling program as shown in Figure 1. The hardware parts were designed using a CAD program (Fusion 360, Autodesk Incorporation, San Rafael, CA, USA). The details of each component were described here.
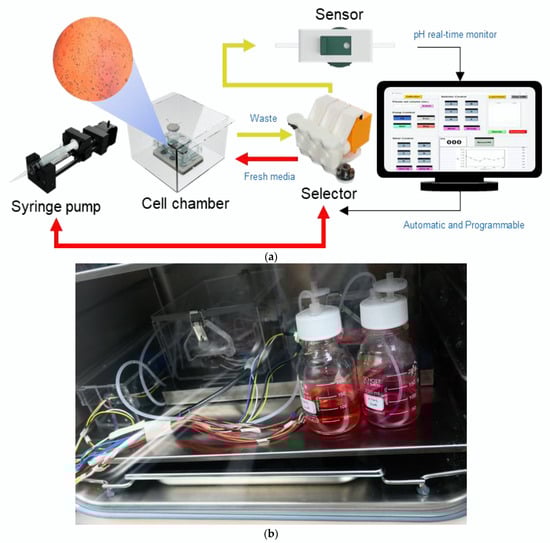
Figure 1.
A bioreactor with a pH monitoring system: (a) a schematic diagram showing components of the bioreactor; (b) a photo of the bioreactor inside an incubator.
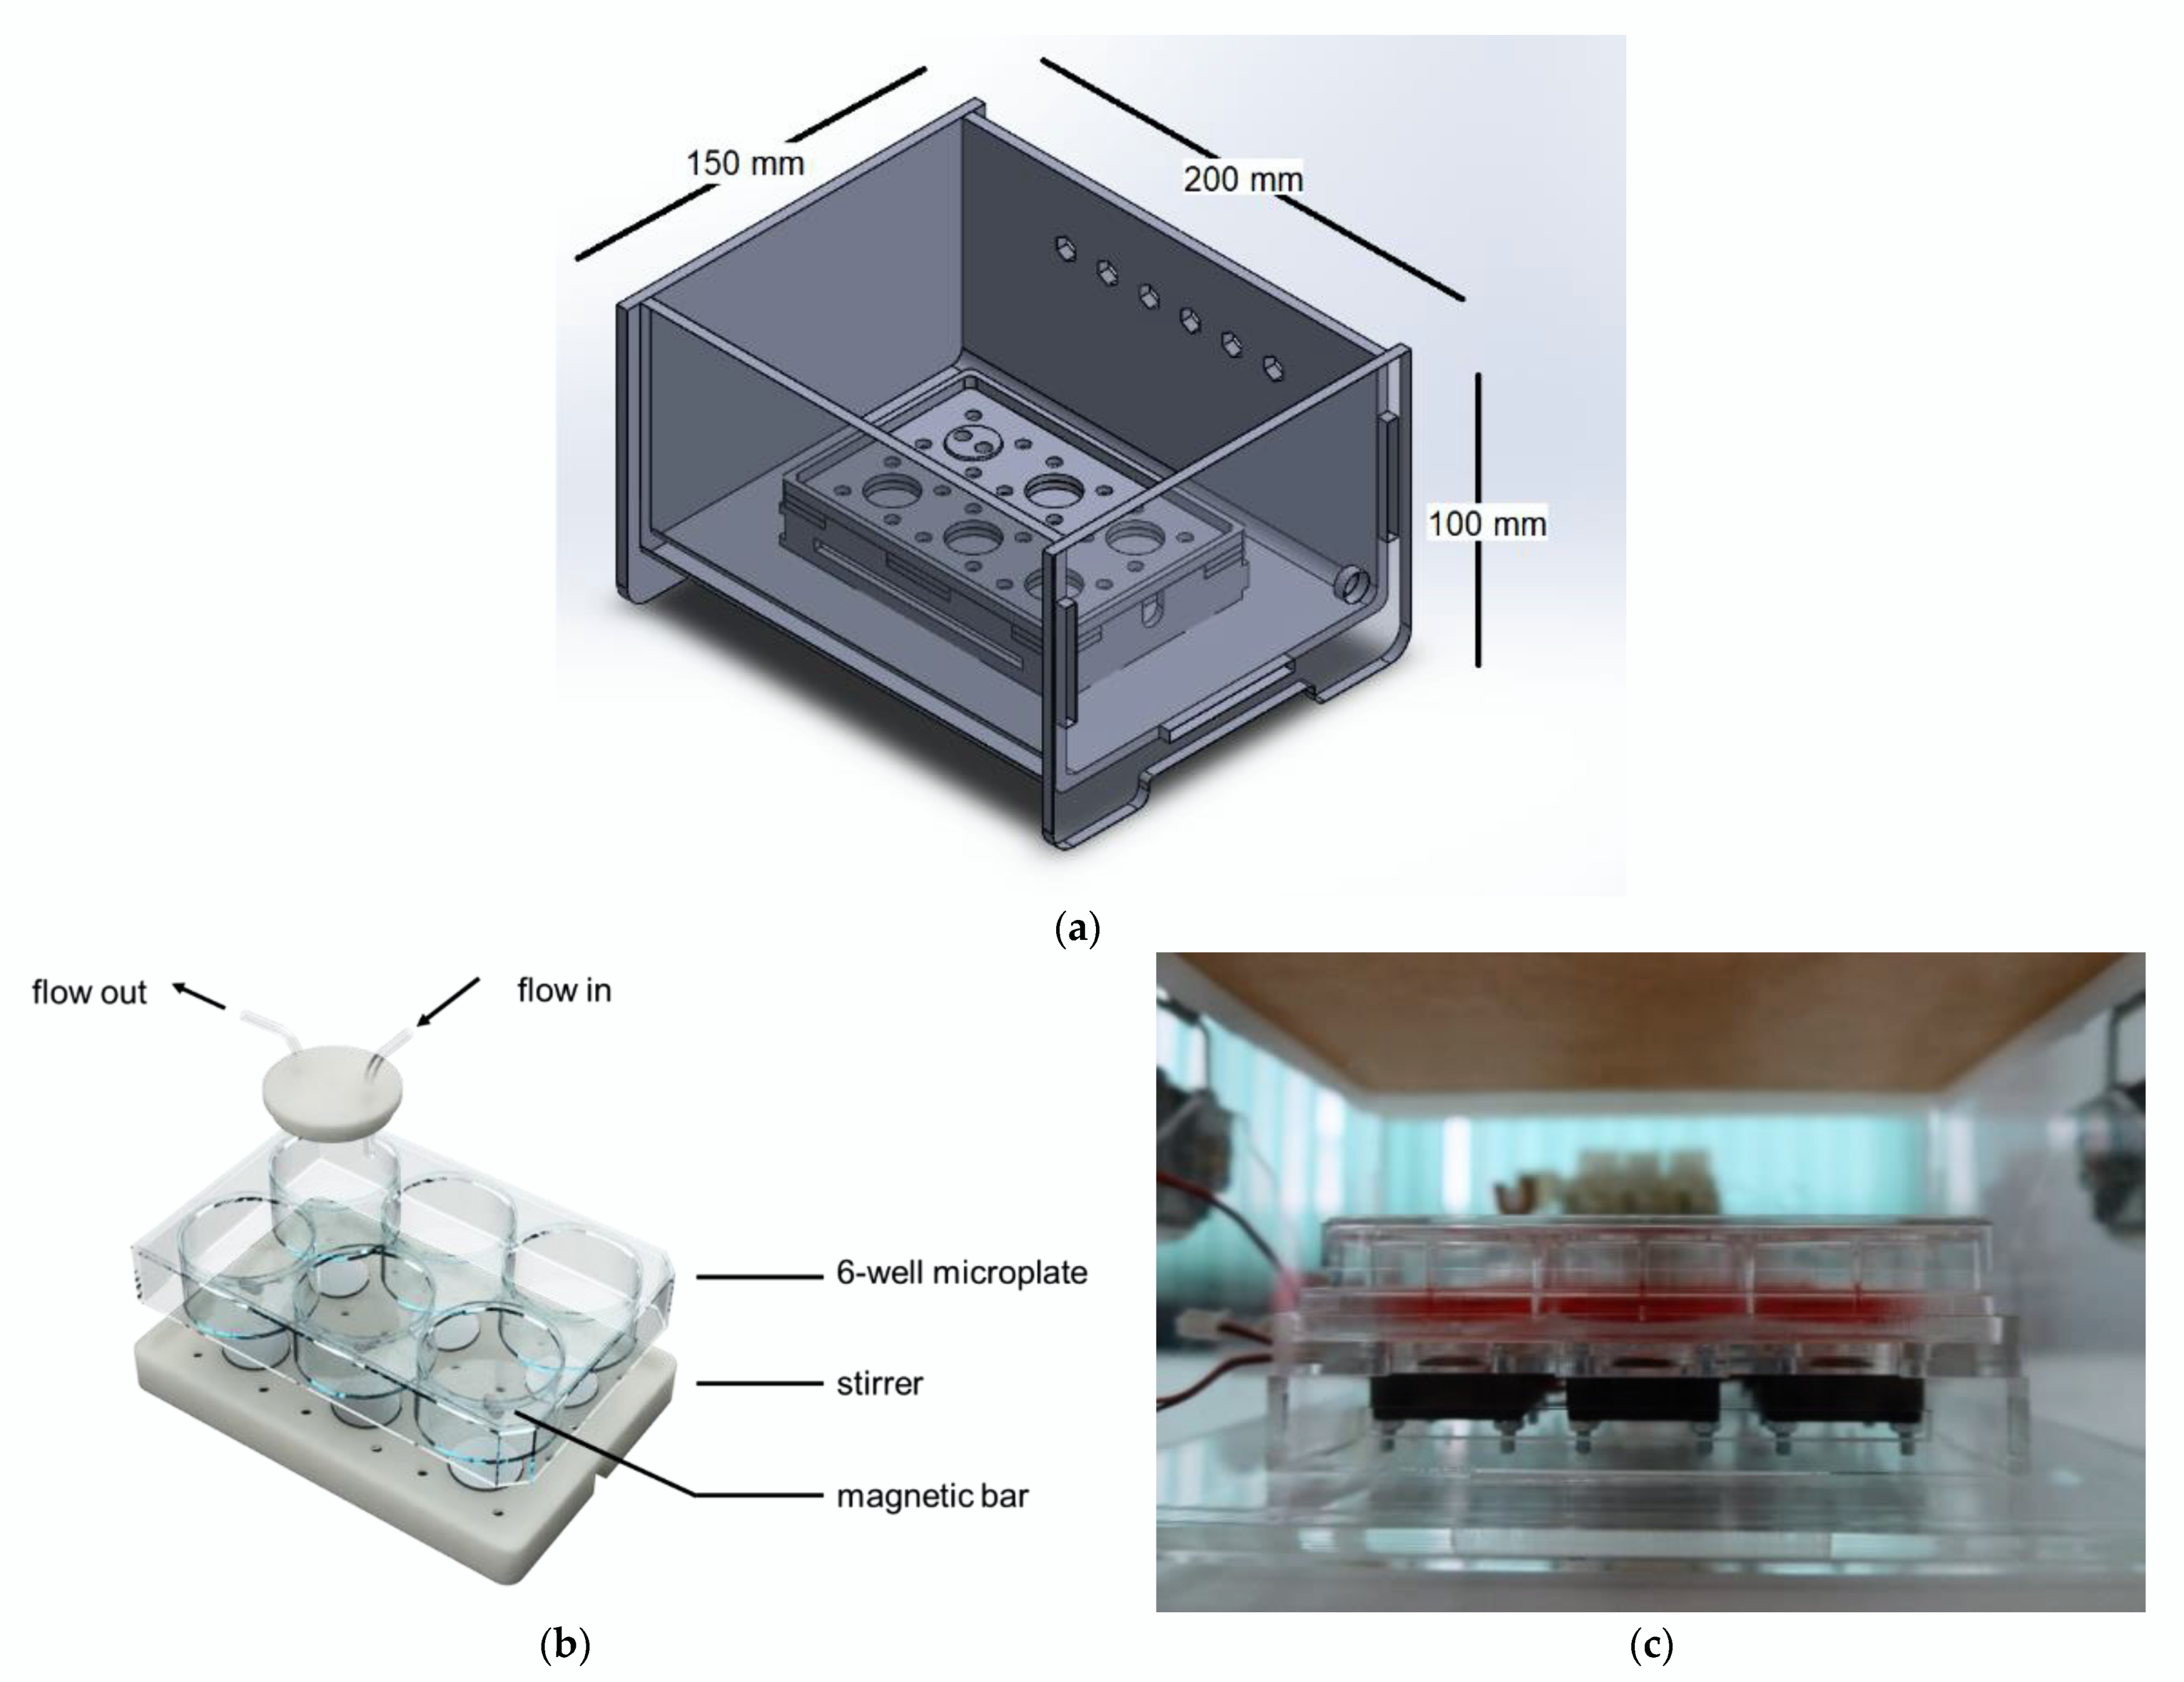
2.1.1. Cell Culture Chamber
A cell culture chamber was designed to accommodate one standard cell culture well plate size of 128 mm × 86 mm (length × width). For a prototype, a 6-well plate was used as a model, as shown in Figure 2. The main body and lid of the chamber were made of transparent acrylic with a thickness of 5 mm that was sterilized with ethanol and UV radiation before use. Each well was covered with a piece of polydimethylsiloxane (PDMS; Dow Inc., Midland, MI, USA) and a flow channel was connected to a selector outside of the chamber via a luer connector. The cell culture chamber is also equipped with 6 micro-stirrers that can be used for suspension cell culture.
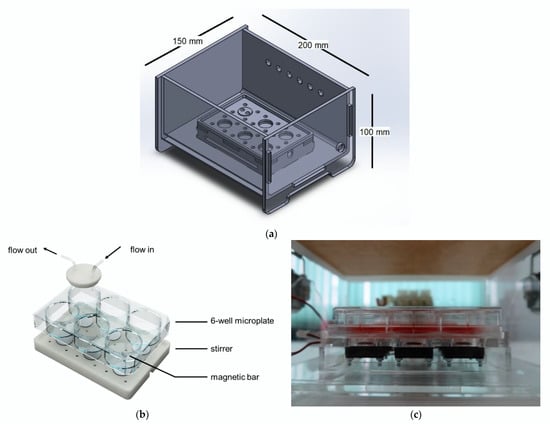
Figure 2.
Cell culture chamber: (a) a CAD file of a cell culture chamber design with a well plate holder; (b) a CAD file showing 6-well plate with PDMS lids and 6 micro-stirrers; (c) a side view of a cell culture on a 6-well plate inside a cell culture chamber.
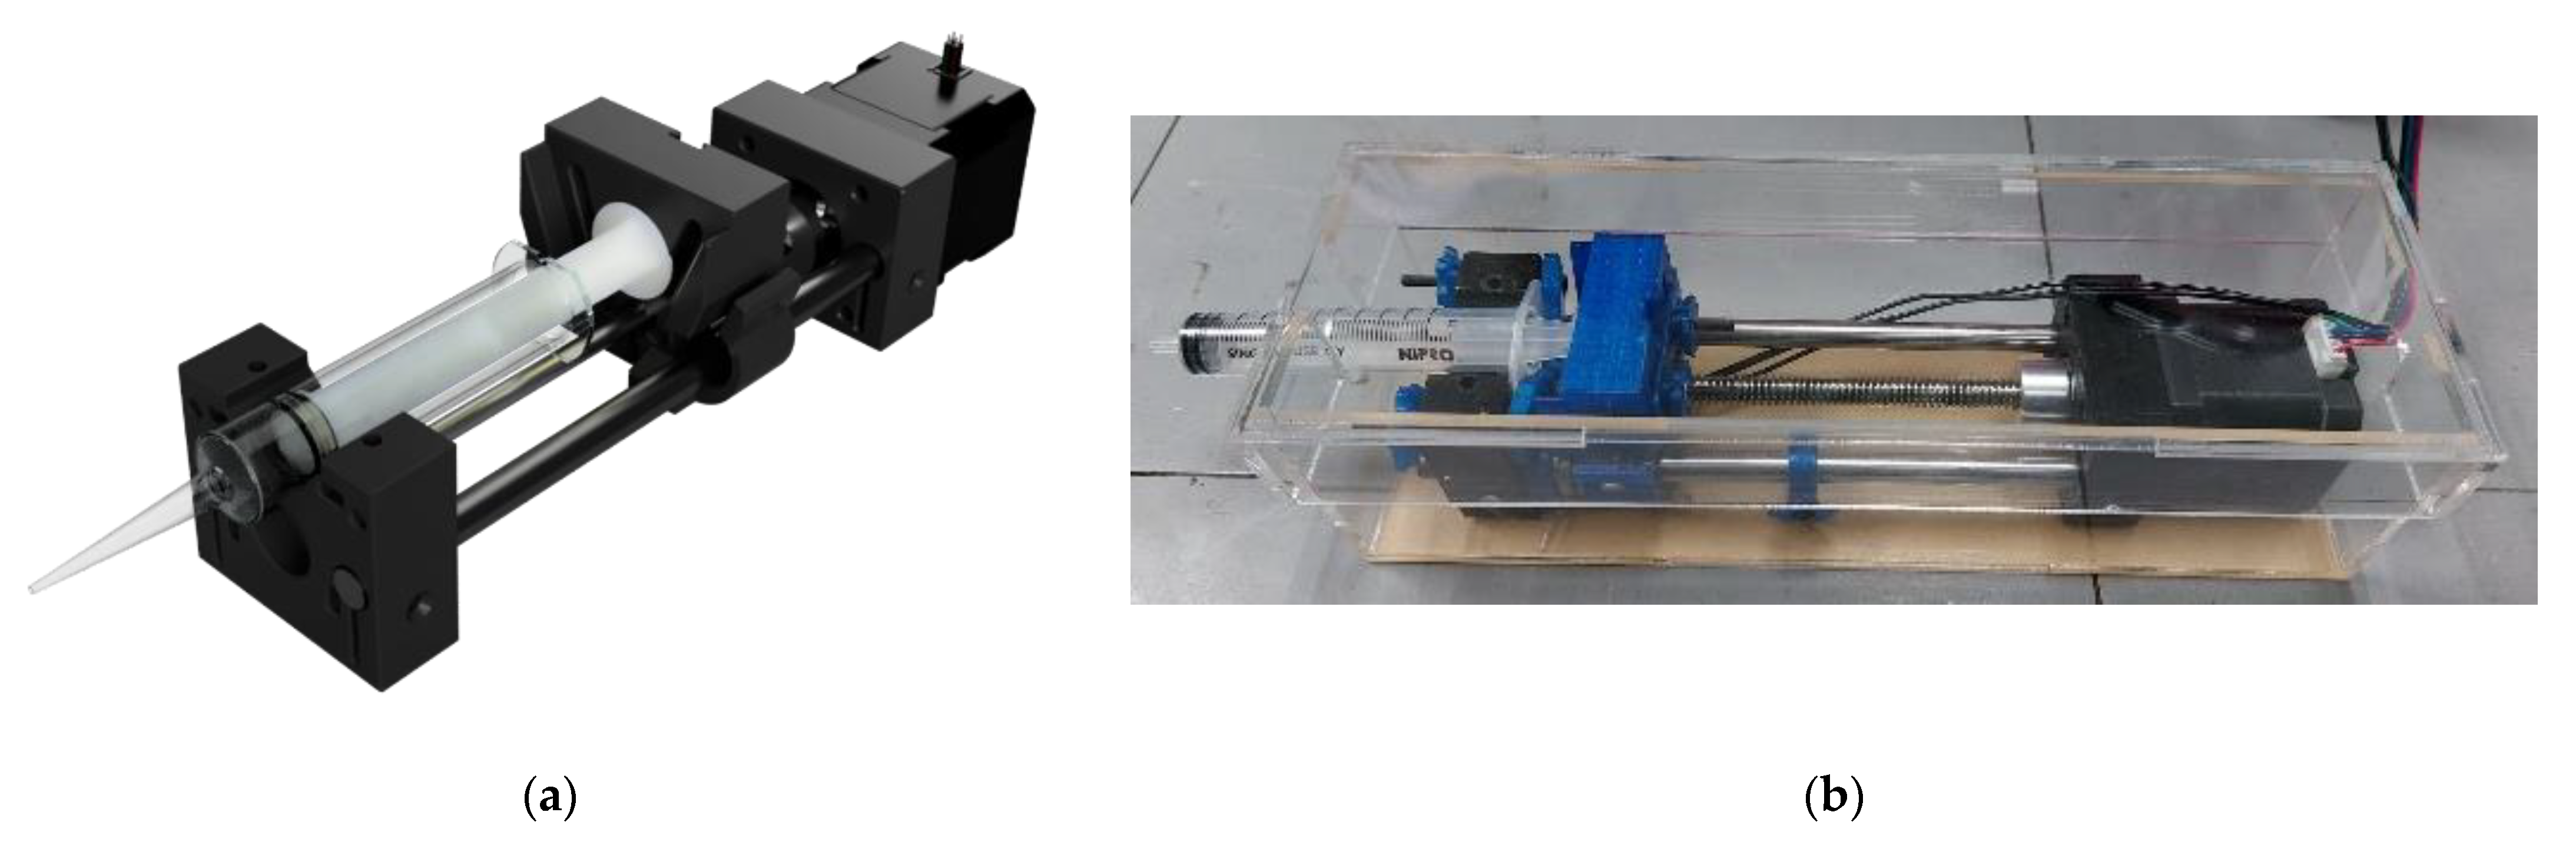
2.1.2. Syringe Pump
A syringe pump consists of a stepper motor and a syringe holder. A stepper motor (NEMA17, Shenzhen, China) was employed, as shown in Figure 3. A syringe holder was constructed using fused deposition modeling (FDM) 3D printing (in-house) with acrylonitrile butadiene styrene (ABS) filament (eeSun, Shenzhen, China). The syringe pump was designed to house a disposable sterile 10-mL syringe (Nipro (Thailand) Co Ltd., Ayutthaya, Thailand) that connected with a female luer adaptor and a silicone tubing (inner diameter of 2 mm, Runze Fluid, Nanjing, China). The syringe pump was placed in a clear acrylic box and sterilized with ethanol and UV radiation before use.
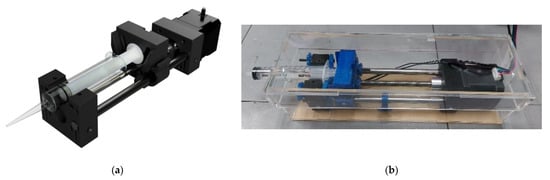
Figure 3.
Syringe pump: (a) a CAD file of syringe pump design; (b) a photo of syringe pump with a 10-mL syringe in an acrylic box.
2.1.3. Selector
A selector acts as a media flow switch between a syringe pump, a cell culture well, a media reservoir, and sensors. It has 3 servo motors (MG996R, Shenzhen, China) that rotate to open and close the desired channel as illustrated in Figure 4. The rotating parts and flow channels were constructed using LCD-based 3D printing (ANYCUBIC Photon Mono X, Hong Kong Anycubic Technology, Hong Kong, China) with acrylic-based resin (eResin PLA biophotopolymer resin, eSun, Shenzhen, China). The outlet was fitted with PTFE flangeless fittings and TPFE tubing (inner diameter of 1 mm, Runze fluid, Nanjing, China). The selector was placed in a clear acrylic box and sterilized with ethanol and UV radiation before use.
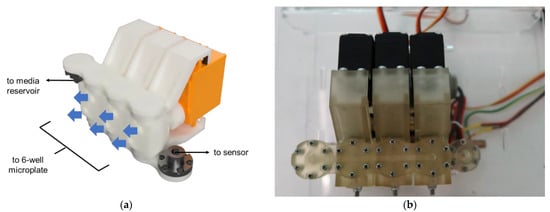
Figure 4.
Selector: (a) a CAD file of a selector design; (b) a photo of a selector with 3D-printed channels.
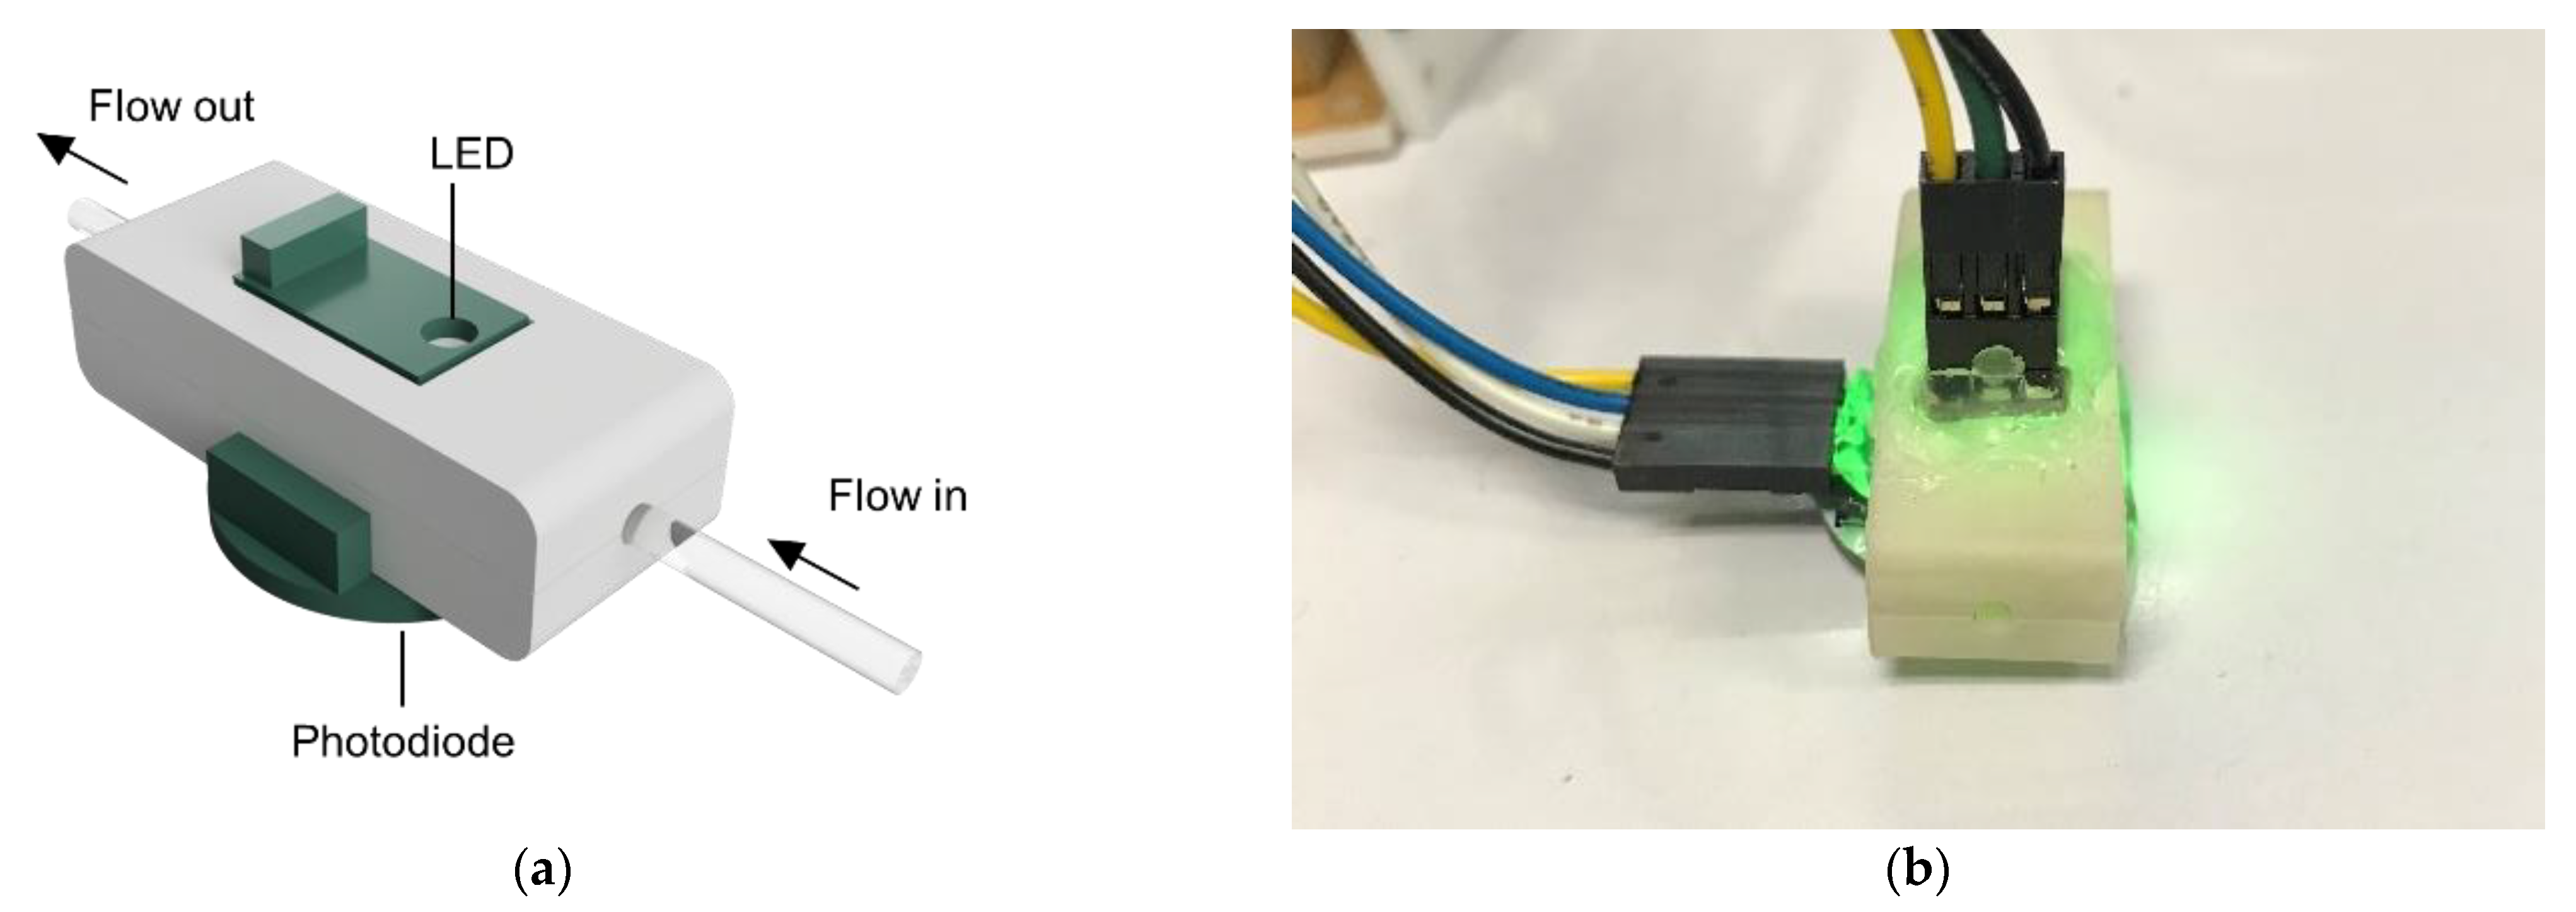
2.1.4. pH Monitoring System
An on-line pH monitoring system was based on colorimetric measurement of cell culture media containing phenol red indicator. As shown in Figure 5, a pH monitoring system consists of an LED light source, an ambient light sensor (TEMT 6000, Vishay Intertechnology, Malvern, PA, USA), and a tubing holder that allows for non-contact measurement. The tubing holder is designed to fit a PTFE tube and was constructed using LCD-based 3D printing (ANYCUBIC Photon Mono X, Hong Kong Anycubic Technology, China) with opaque acrylic-based resin (eResin PLA biophotopolymer resin, eSun, Shenzhen, China).
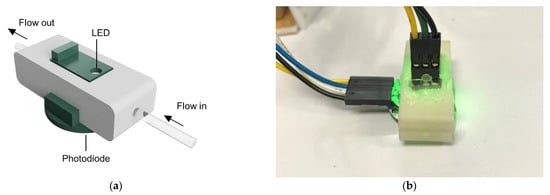
Figure 5.
On-line pH monitoring system. (a) a CAD file of a pH sensor; (b) a photo of a pH sensor with green LED.
2.1.5. Controlling Program
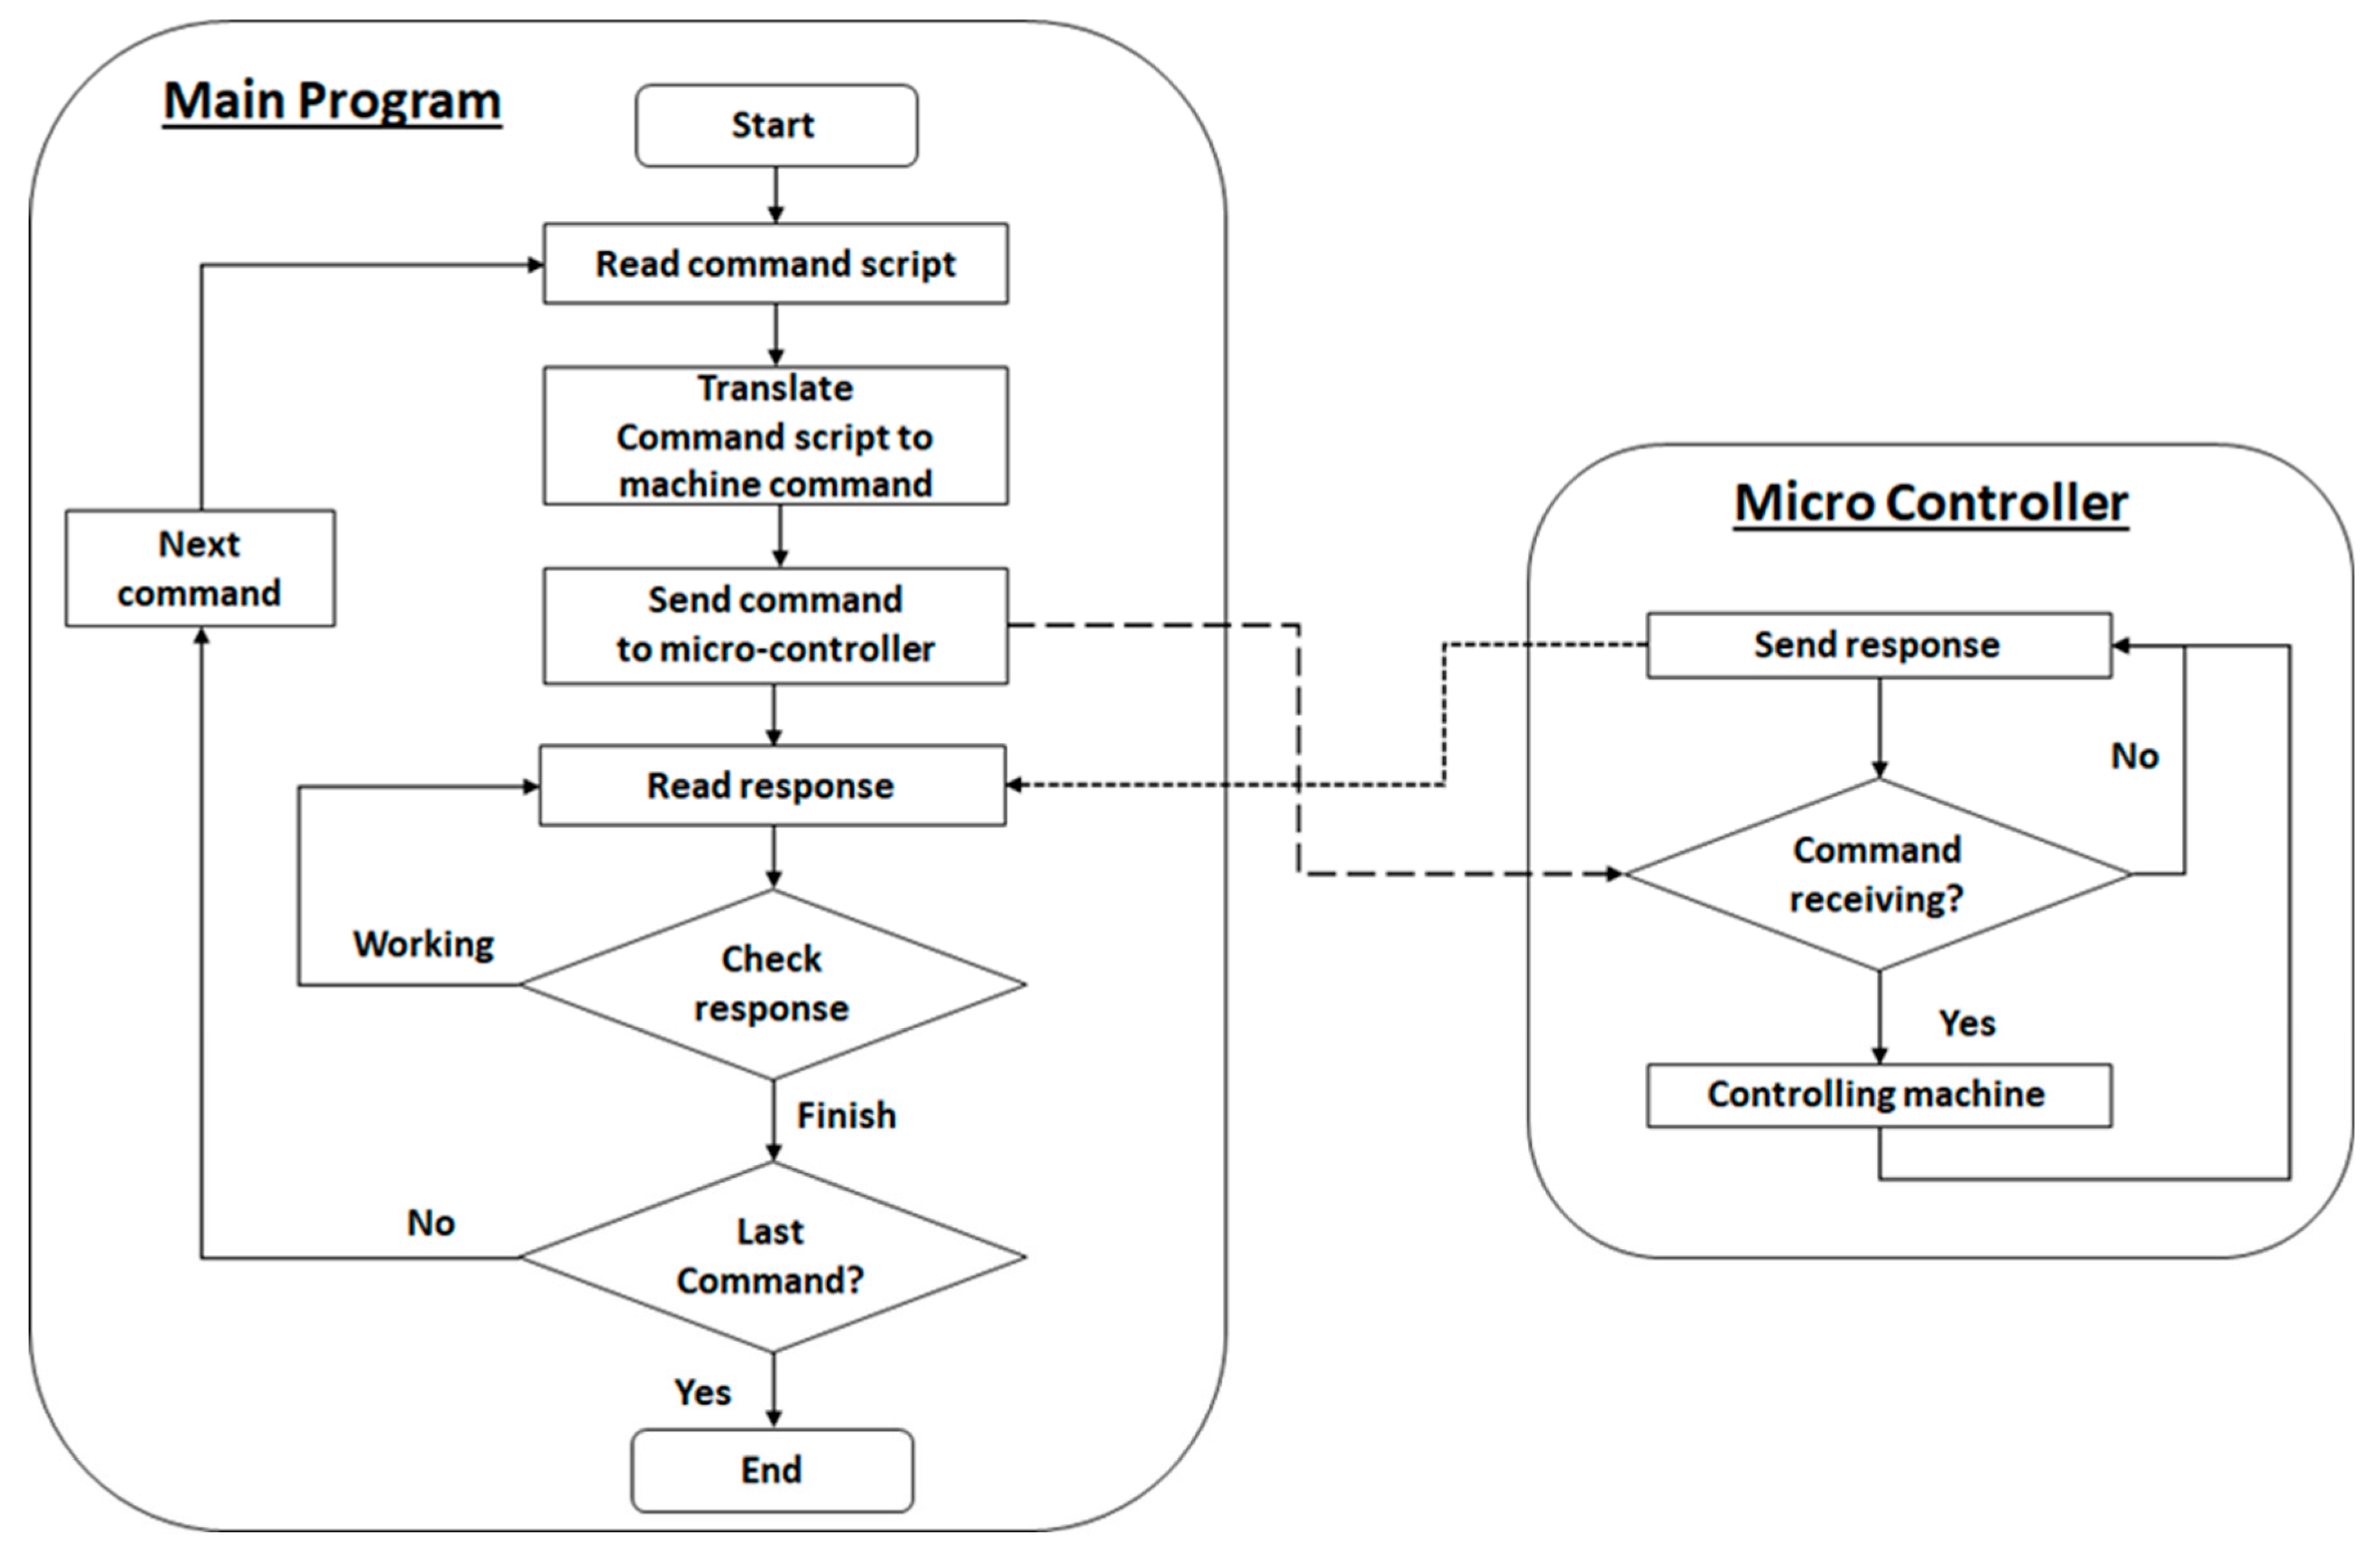
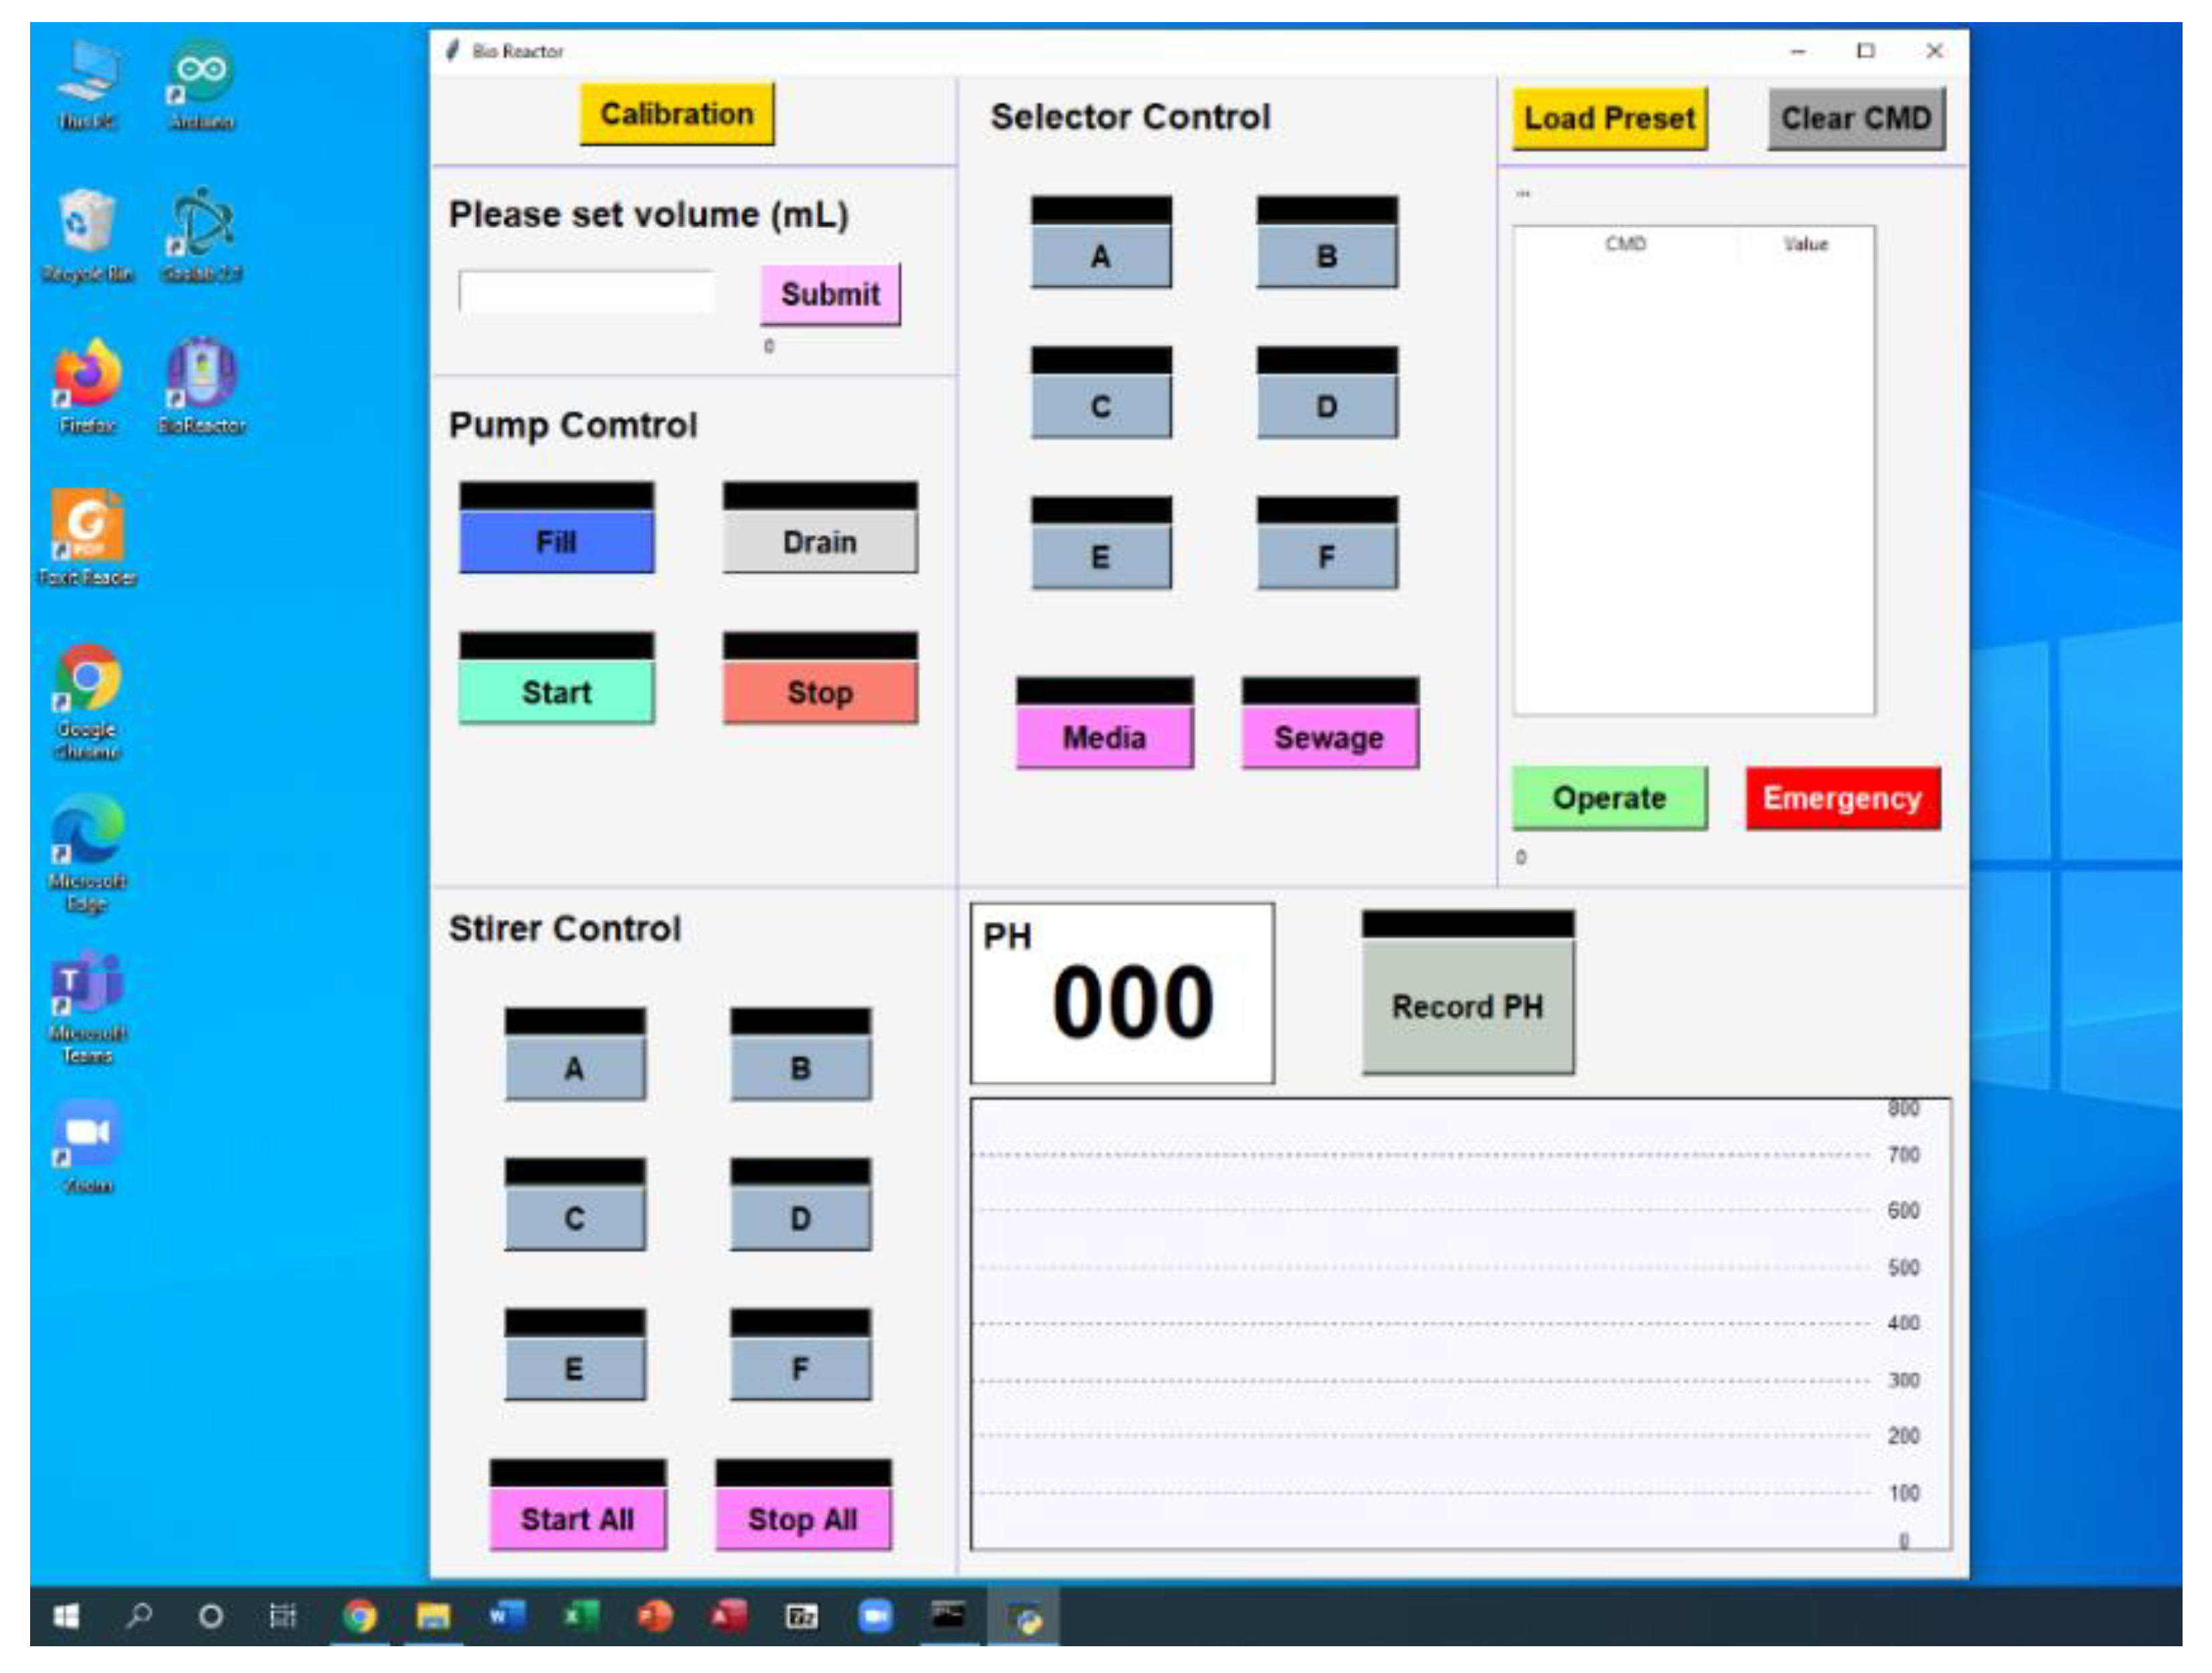
The bioreactor is controlled by simple software as shown in Figure 6 and Table 1. We developed software for controlling syringe pump, which can set the volume of culture media fed into and out of the culture chamber. For the selector, the software can control the selector to select the channel of each culture well, fresh media, and waste. Also, this software can control the stirrer of each well plate for mixing solution in each well. The pH monitoring system readings are recorded and a graph was plotted on the graphic user interface (GUI). In addition, we can write the preset script of the culture condition in advance and this software can control the bioreactor automatically. The GUI of this software is shown in Figure 7.
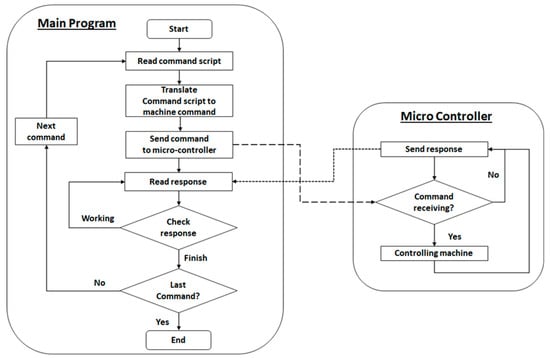
Figure 6.
Schematic diagram showing workflow of controlling program.

Table 1.
List of commands for controlling bioreactor.

Figure 7.
A screenshot of user interface of controlling program.
2.2. Bioreactor Setup
Before using the developed bioreactor, a syringe pump was calibrated by weighting water flew out at different flow rates using a four-digit balance. A pH monitoring system was calibrated using culture media with different pH values, which were predetermined with a laboratory pH meter.
A set of PDMS lids, containers for fresh media and waste, and silicone tubing were sterilized using an autoclave beforehand.
All components except a microcontroller and a notebook with a controlling program were sterilized with ethanol and then UV radiation for 15 min in a biosafety cabinet before use. A 6-well plate containing cell culture was placed in a chamber and a media reservoir and waste container were connected to a selector in a biosafety cabinet. A bioreactor with cell culture was then placed in an incubator.
2.3. Bioreactor Performance Test
The performance of the developed bioreactor was tested by measuring the cell viability and cell proliferation rate of cells cultured in the bioreactor compared with that of a conventional cell culture procedure. A mouse fibroblast cell line (L929: NCTC clone 929, JCRB cell bank, Osaka, Japan) was used as a model for this test. The cells were cultured in Dulbecco’s modified Eagle medium (DMEM, Thermo Fisher Scientific, Waltham, MA, USA) with 10% fetal bovine serum (FBS, Thermo Fisher Scientific, USA) and 1% antibiotic-antimycotic (100X, Thermo Fisher Scientific, USA).
2.3.1. Cell Viability Testing
The L929 cells were seeded in a 6-well plate at 1 × 10⁵ cells per well. The well plate was then placed in the bioreactor and was incubated at 37 °C with 5% CO2 and a humidified atmosphere for 48 h. The control group was place in the same incubator. The cell viability was measured using an MTT assay [22].
2.3.2. Cell Proliferation Assay
The L929 cells were seeded in a 6-well plate at 7 × 10⁴ cells per well with 5 mL of complete media and then cultured automatically in the bioreactor for 72 h using a pre-set program where 2 mL of cultured media was disposed of and refilled every 6 h. At 24 h and 72 h, the cells were trypsinized using 0.25% trypsin-EDTA solution (Thermo Fisher Scientific, USA) and the number of cells was counted with an automated cell counter (Countess II, Thermo Fisher Scientific, USA). The obtained proliferation rate was compared to that obtained from conventional cell culture with the same starting cell numbers.
2.4. pH Monitoring System Test
The pH monitoring system was tested during the incubation of L929 cells for 48 h. The program was set to refresh 2 mL of cell culture media every 6 h.
3. Results
3.1. Syringe Pump Calibration
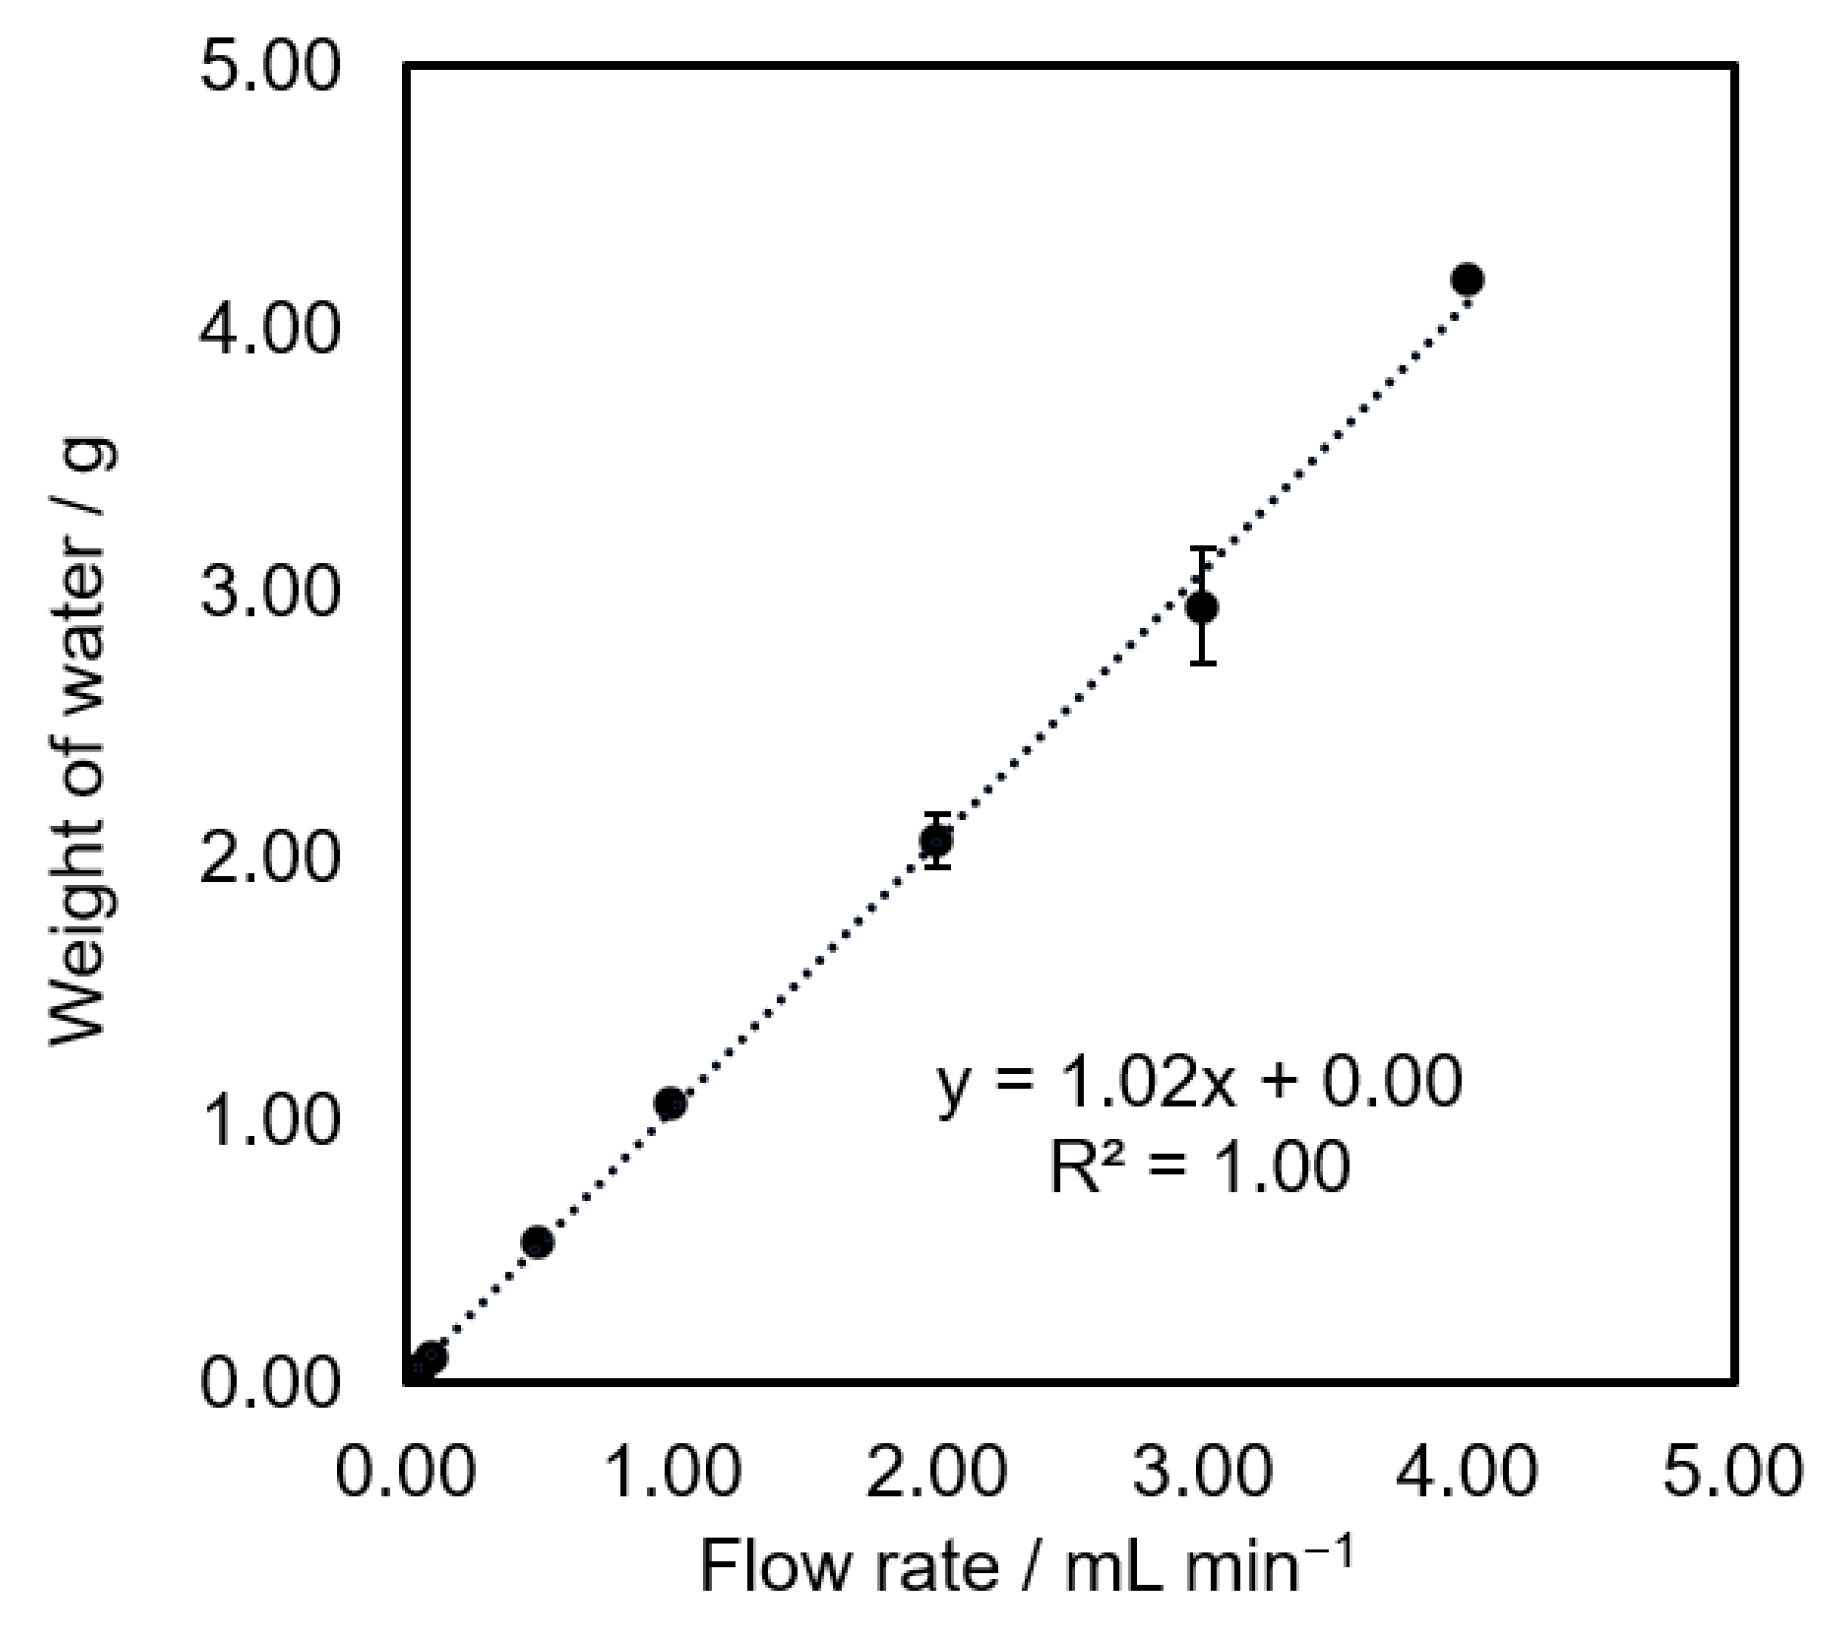
A calibration of the syringe pump with a 10 mL syringe was performed. The different flow rates were set for one minute and the flow out water was collected and precisely weighted. In Figure 8, the calibration plot showed that the mass of flow out water is correlated with the set flow rate. This result indicates that the flow rate of the calibrated syringe pump was accurate.

Figure 8.
A calibration graph of an in-house syringe pump, n = 3.
3.2. pH Calibration
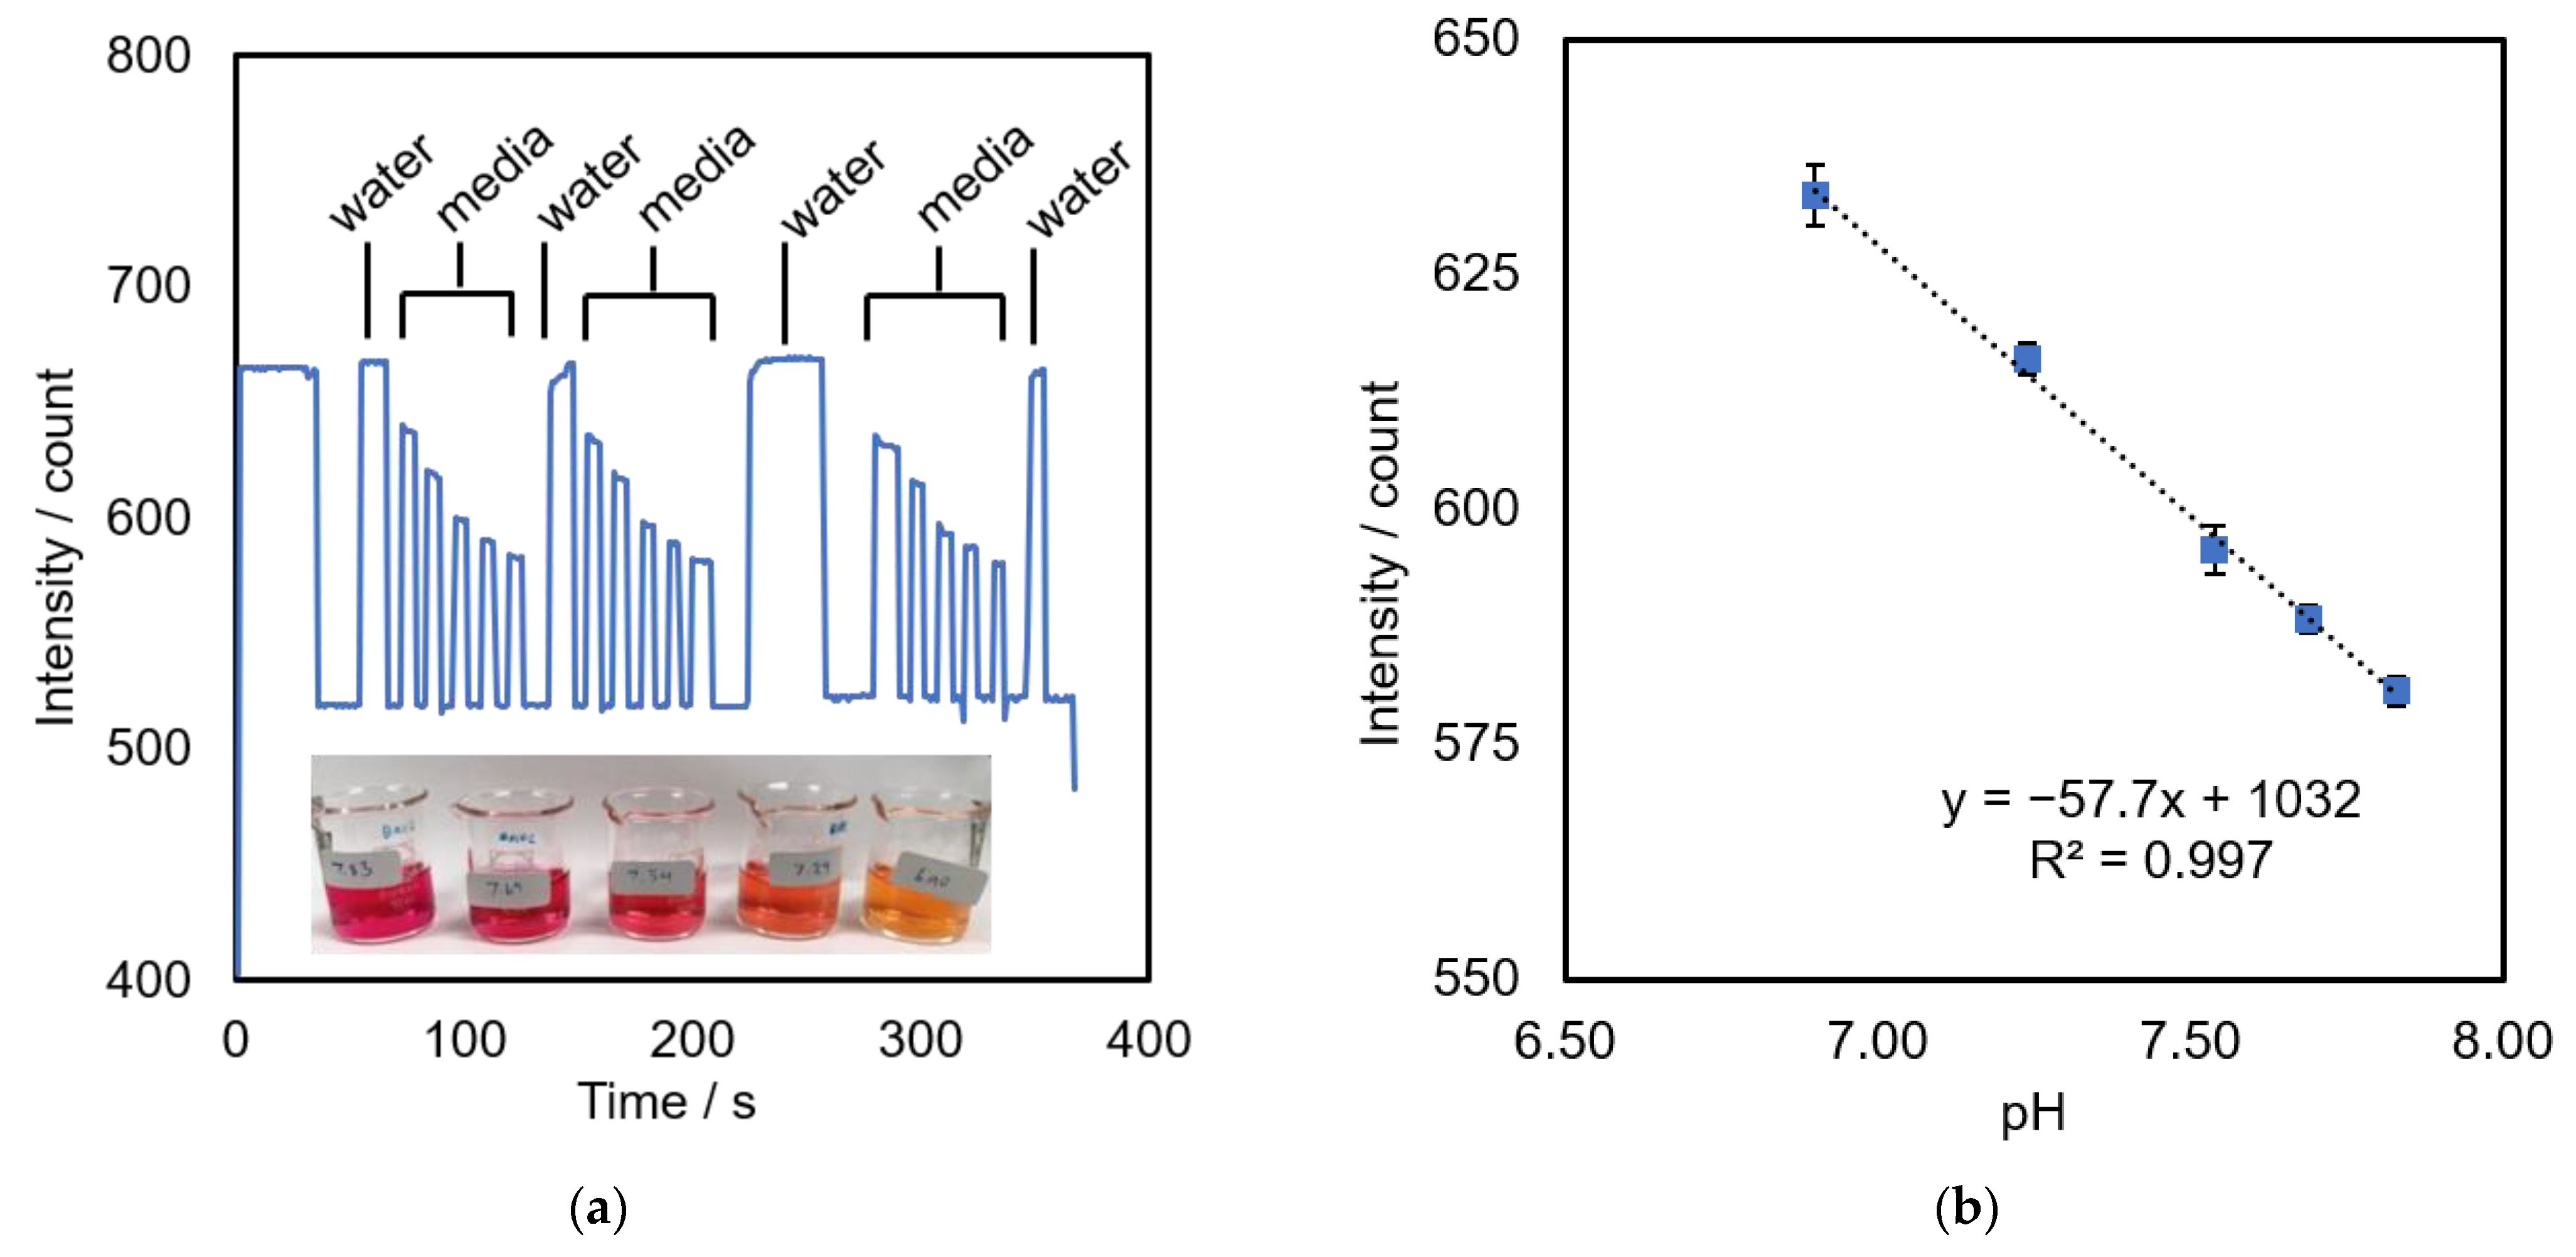
The pH monitoring system was calibrated with DMEM media, which is used for the culture of the L929 cell model. The media contains a phenol red indicator that changes color in the range of 6.8–8.2 from yellow to pink, respectively, as shown in Figure 9a. An increase in the pH of the media caused an increase in the red color intensity, which absorbed more green light and will be detected by the sensor. Figure 9b shows a calibration plot obtained from DMEM at a pH range between 6.90 and 7.83; green intensity = −57.7 (pH) + 1032, n = 3.
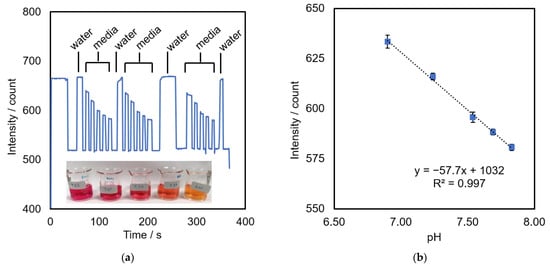
Figure 9.
Optical pH sensor: (a) effect of pH on green intensity measured by flowing DMEM media at various pH (shown in inset) thought a sensor; (b) a calibration plot between pH of DMEM media and green intensity, n = 3.
3.3. Cell Viability—MTT Assay
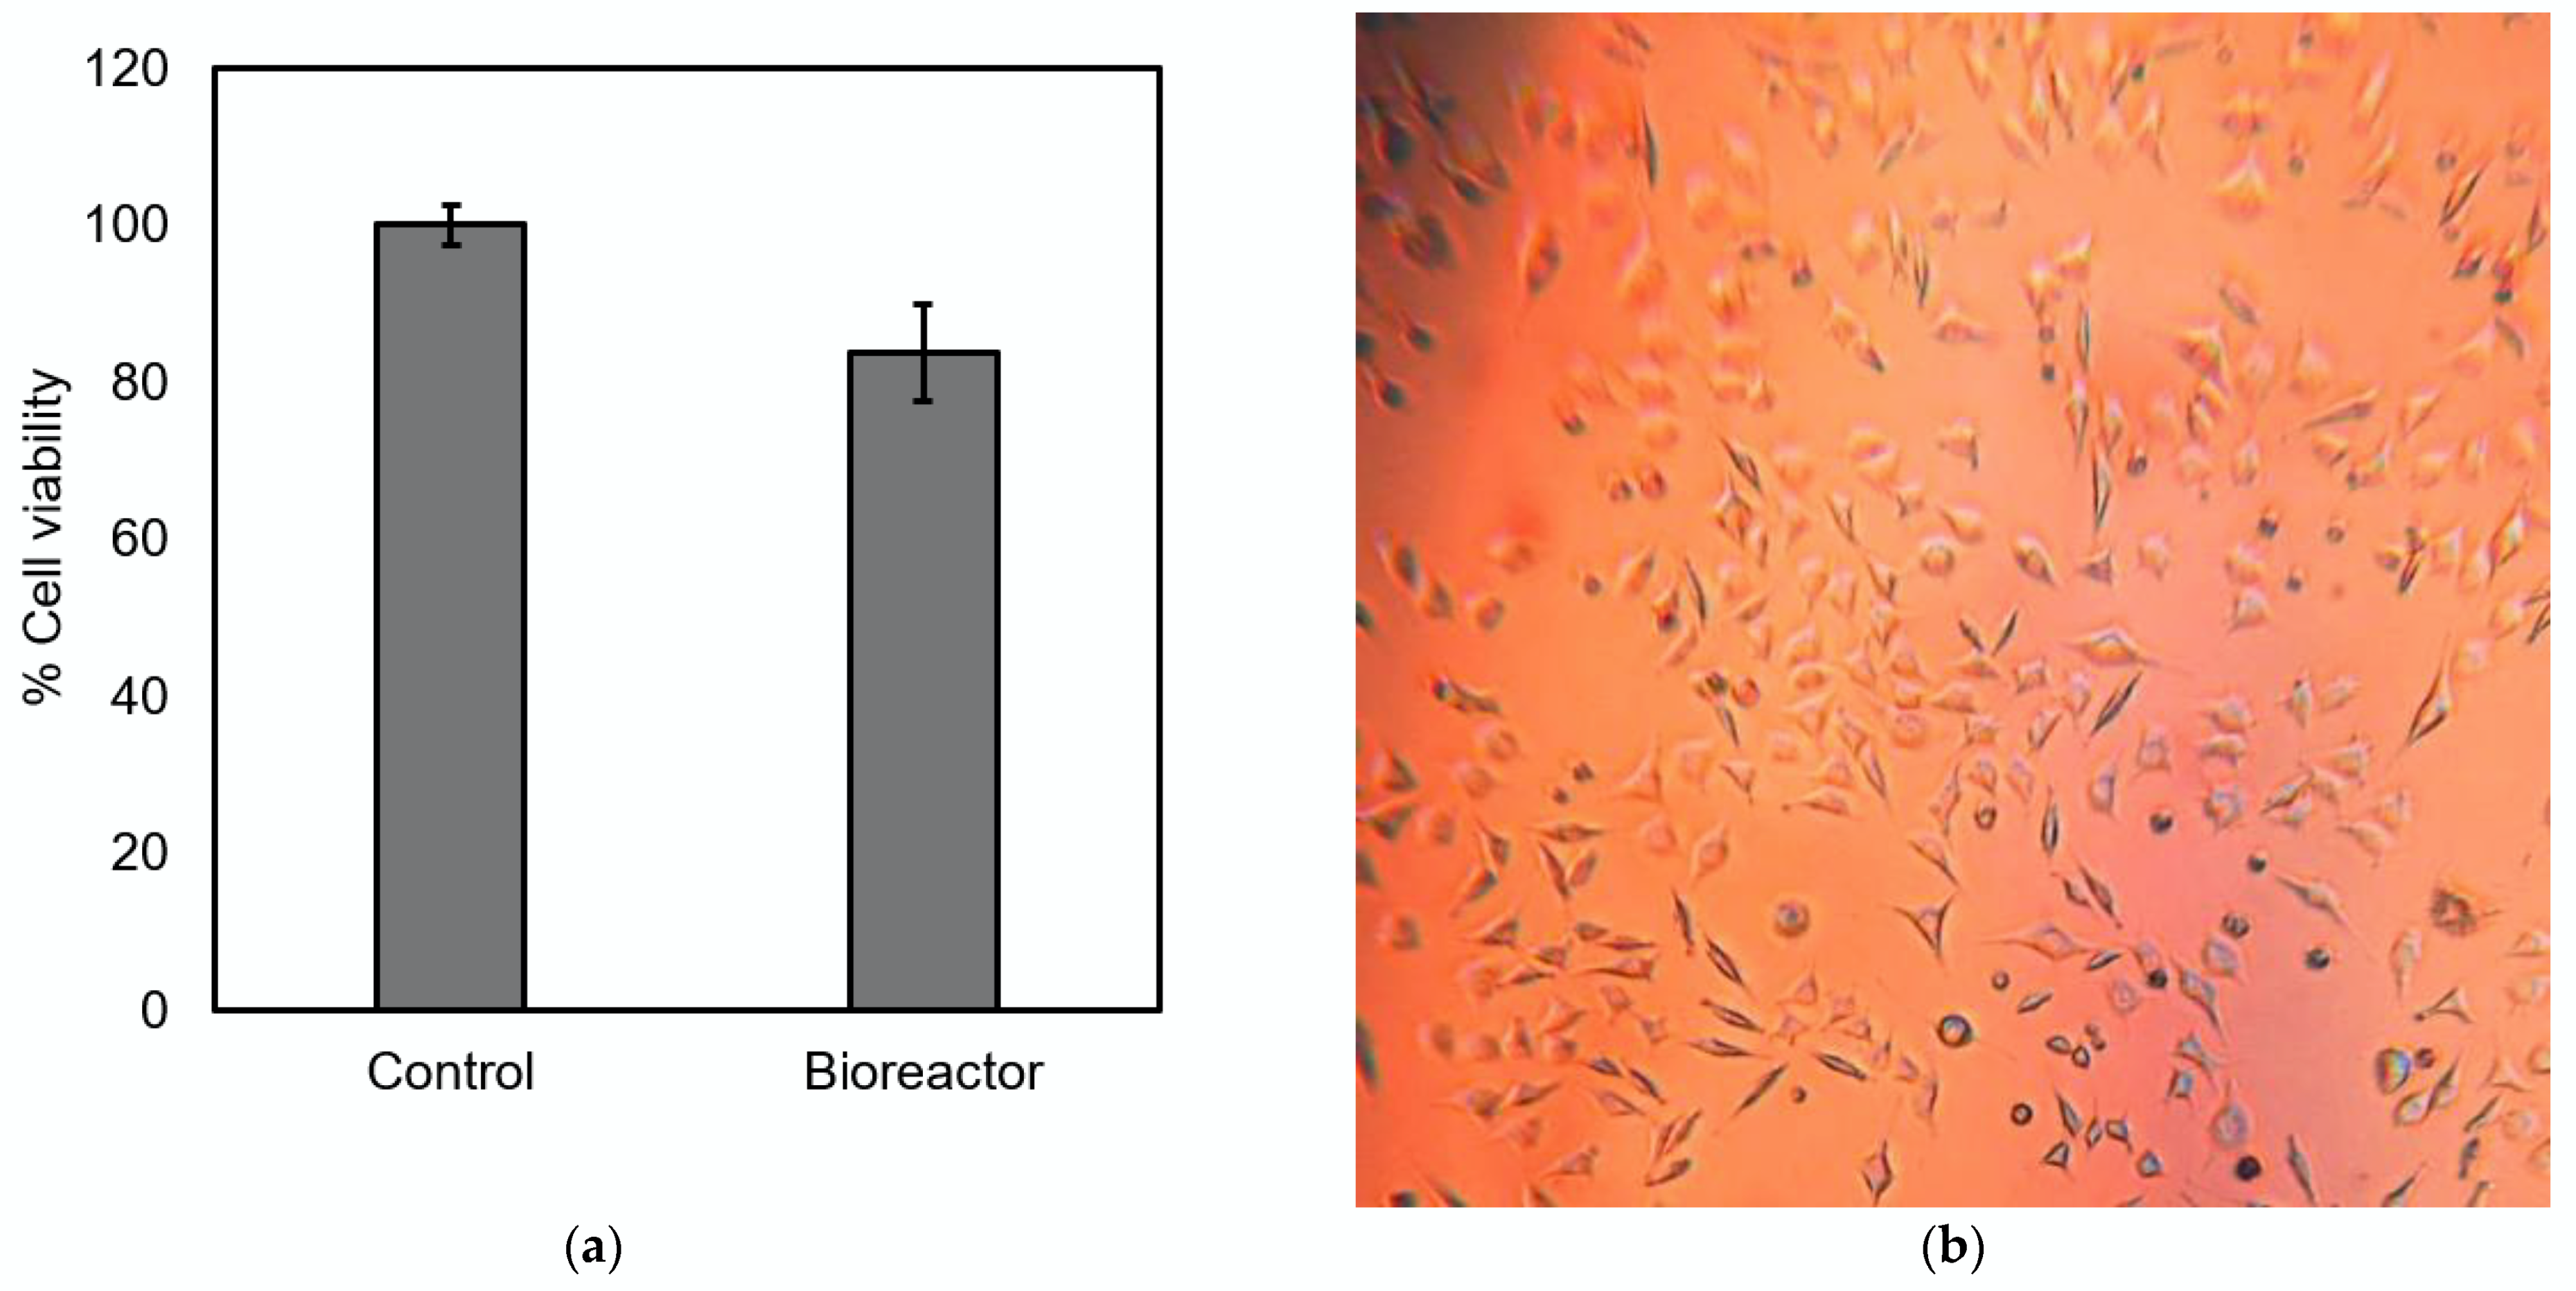
The cell viability of L929 cells was measured after incubation in the developed bioreactor for 48 h. Figure 10a shows that the cell viability of the L929 cell in the bioreactor was greater than 80% when compared to the control obtained through conventional cell culture. In addition, no morphologic change was observed, as shown in Figure 10b. These results suggest that the developed bioreactor including setup conditions and sterilization process did not cause a cytotoxic effect on the cells.
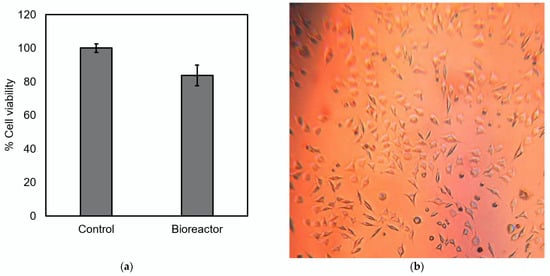
Figure 10.
Cell viability of L929 incubated in the developed bioreactor: (a) percent cell viability obtained from MTT assay with respected to control group (n = 6); (b) a microscopic image of cells after incubation in the bioreactor for 48 h.
3.4. Cell Proliferation Assay
An automatic cell culture in the developed bioreactor was demonstrated. Figure 11 shows cell proliferation from L929 cells cultured in the bioreactor with the program to refresh the media every 6 h automatically compared to that cultured parallelly in a conventional manner (no media changed). It was found that the number of cells in the bioreactor increased significantly at 72 h in comparison with the number of cells in the control plate. The results suggested that the automation of regular partial media change could help enhance the cell growth in the bioreactor.
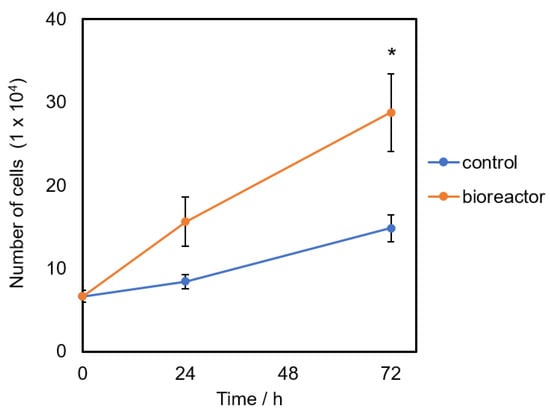
Figure 11.
Cell proliferation of L929 incubated in the developed bioreactor. The number of cells was counted at 24 and 72 h after incubation and the data were analyzed by two-way ANOVA and post-hoc using R program. * Statistical significance was set at p < 0.05, n = 3.
3.5. pH Monitoring Results
The pH measurement of the cultured media was displayed in real-time and recorded as .CSV file for further analysis. The pH was measured by the pH sensor located on the channel before the waste container, indicating the pH of the used media. In general, acidic conditions could inhibit cell growth. A change in pH could reflect the cell condition, such as a lower pH suggesting cell death or bacterial contamination.
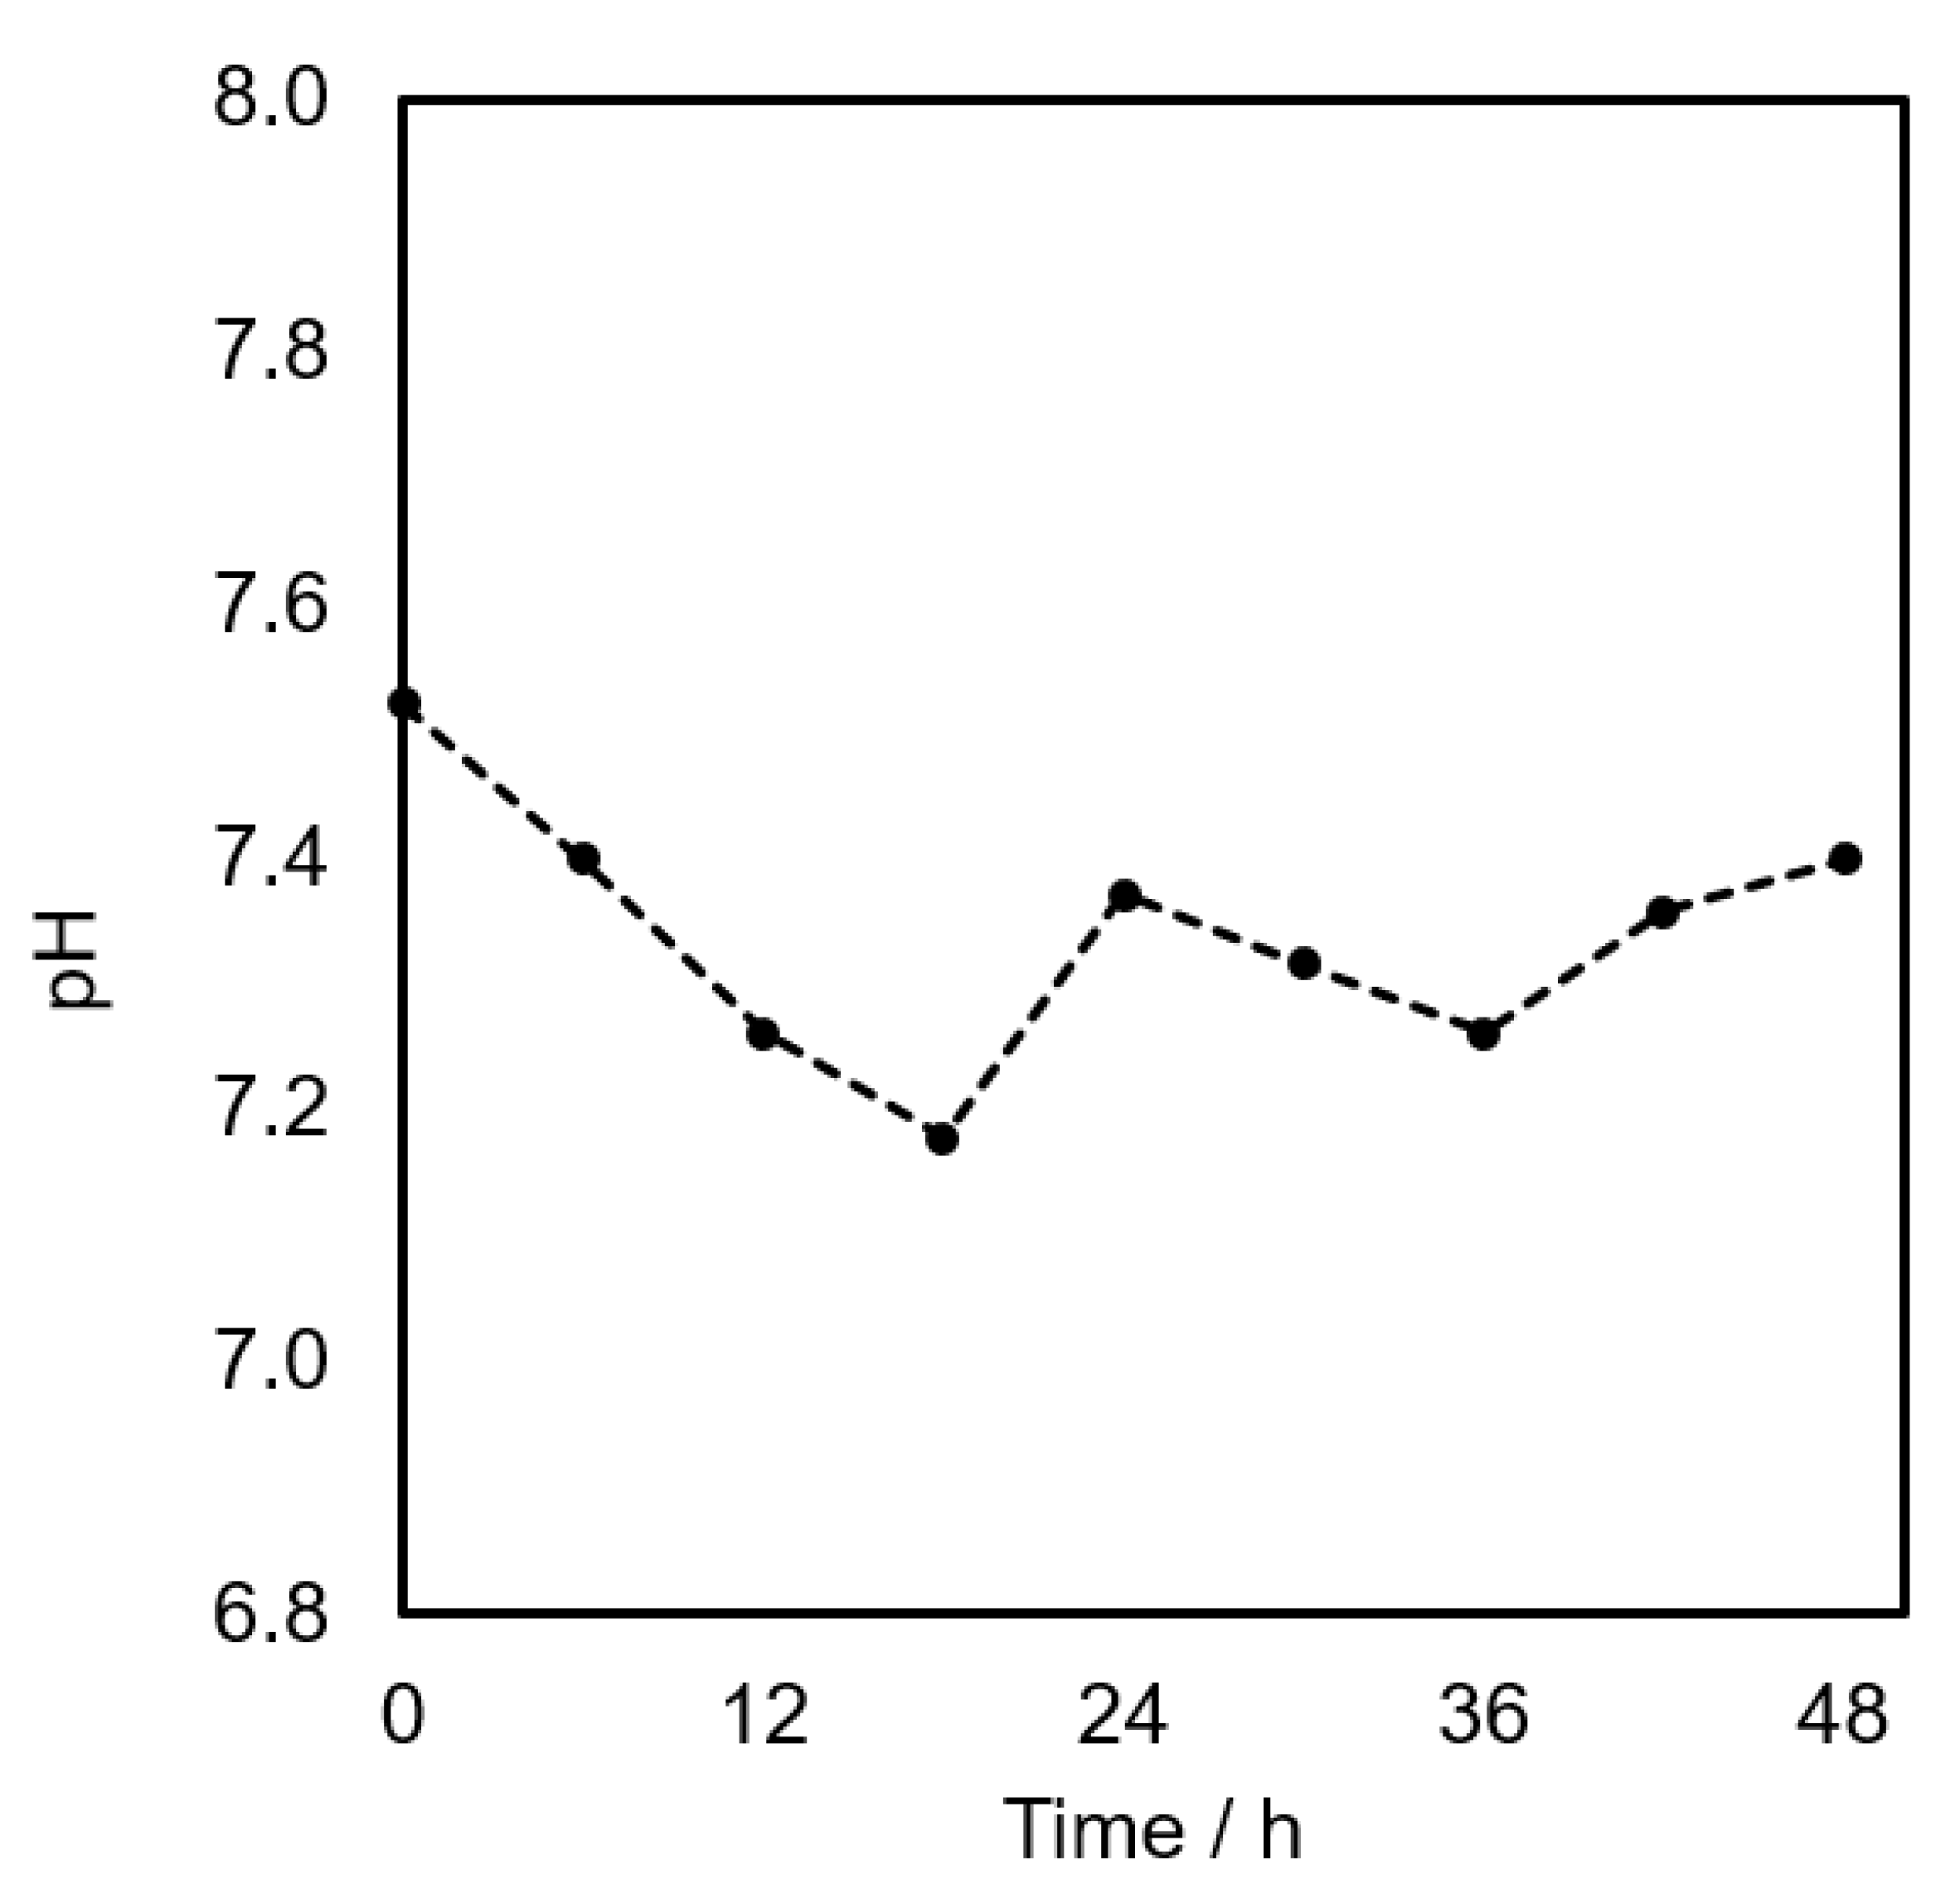
Figure 12 shows a plot of the pH change with time during a 48-h cell culture of L929 cells in the developed bioreactor. It was found that a program set for regular media change was able to maintain the pH of the cell culture within 7.4 ± 0.2, which is suitable for fibroblast cell line [23]. This could be related to the higher cell proliferation rate in the bioreactor observed in Figure 11.

Figure 12.
pH changes during L929 cell incubation in the developed bioreactor.
4. Discussion
In this work, we developed an automatic programmable bioreactor with a pH monitoring system that was suitable for tissue engineering cell culture. This bioreactor’s components can be controlled via programable script to the desired cell culture condition, and this system can operate automatically. This system helps to reduce time and labor compared to manual cell culture.
For pH sensor, we applied a colorimetry technique to monitor the pH of the cell culture on-line. This sensor was compact and easy to use. In addition, non-contact measurement has an advantage in real-time monitoring, and there is no contamination to cell culture. The data were collected and can be analyzed for cell culture condition scripts next time. In future work, we plan to use machine learning methods, for example, the deep learning method [24,25], to optimize and find the suitable parameters in controlling bioreactors in order to enhance the productivity of the cell culture in the bioreactor.
Furthermore, this prototype can be applied to culture cells for a long period to study cell differentiation and tissue formation, which could be potentially useful for medical and industrial applications, including cultured meat, drug testing, etc. For example, this system could be used to study muscle cell differentiation and determine optimal conditions for cultured meat production. For drug testing, the bioreactor could be programmed to vary the dose or frequency of the treatment. In the future, an additional analytical system could be added to the bioreactor to detect disease-specific biomarkers or to monitor other biomolecules such as glucose and lactate dehydrogenase, which would indicate cells’ activity.
Author Contributions
Conceptualization, S.U., S.A. and N.T.-U.; methodology, S.U., A.B., C.W., P.S., P.B., C.M. and P.P.; software, A.B.; validation, S.U., C.M. and P.P.; formal analysis, S.U., P.B. and P.P.; investigation, P.P.; resources, N.T.-U.; data curation, S.U., A.B., C.W., C.M., P.B. and P.P.; writing—original draft preparation, S.U., P.B. and P.P.; writing—review and editing, S.U., P.P., S.A. and N.T.-U.; visualization, S.U., A.B., P.S., P.B. and P.P.; supervision, S.A. and N.T.-U.; project administration, N.T.-U.; funding acquisition, S.A. and N.T.-U. All authors have read and agreed to the published version of the manuscript.
Funding
This research project is supported by TSRI (71717).
Institutional Review Board Statement
Not applicable.
Informed Consent Statement
Not applicable.
Data Availability Statement
The data presented in this study are available on request from the corresponding author.
Acknowledgments
The authors acknowledge the Biomedical Engineering Institute and Chiang Mai University for facility and financial support. We are thankful to Sarawut Kumphune for his advice on cell culture technique. We would like to thank Patipat Kamdenlek and Sirapat Boonsirijarungradh for their assistance in sample preparation.
Conflicts of Interest
The authors declare no conflict of interest.
References
- Chandra, P.K.; Soker, S.; Atala, A. Chapter 1—Tissue engineering: Current status and future perspectives. In Principles of Tissue Engineering; Lanza, R., Langer, R., Vacanti, J.P., Atala, A., Eds.; Academic Press: London, UK, 2020; pp. 1–35. ISBN 978-0-12-818422-6. [Google Scholar]
- Khademhosseini, A.; Langer, R. A decade of progress in tissue engineering. Nat. Protoc. 2016, 11, 1775–1781. [Google Scholar] [CrossRef] [PubMed]
- O’Mara, P.; Farrell, A.; Bones, J.; Twomey, K. Staying alive! Sensors used for monitoring cell health in bioreactors. Talanta 2018, 176, 130–139. [Google Scholar] [CrossRef]
- Kropp, C.; Kempf, H.; Halloin, C.; Robles-Diaz, D.; Franke, A.; Scheper, T.; Kinast, K.; Knorpp, T.; Joos, T.O.; Haverich, A.; et al. Impact of Feeding Strategies on the Scalable Expansion of Human Pluripotent Stem Cells in Single-Use Stirred Tank Bioreactors. Stem Cells Transl. Med. 2016, 5, 1289–1301. [Google Scholar] [CrossRef] [Green Version]
- Abbasalizadeh, S.; Larijani, M.R.; Samadian, A.; Baharvand, H. Bioprocess Development for Mass Production of Size-Controlled Human Pluripotent Stem Cell Aggregates in Stirred Suspension Bioreactor. Tissue Eng. Part C Methods 2012, 18, 831–851. [Google Scholar] [CrossRef] [PubMed]
- Gaydhane, M.K.; Mahanta, U.; Sharma, C.S.; Khandelwal, M.; Ramakrishna, S. Cultured meat: State of the art and future. Biomanufacturing Rev. 2018, 3, 1. [Google Scholar] [CrossRef]
- Choi, J.; Mathew, S.; Oerter, S.; Appelt-Menzel, A.; Hansmann, J.; Schmitz, T. Online Measurement System for Dynamic Flow Bioreactors to Study Barrier Integrity of hiPSC-Based Blood–Brain Barrier In Vitro Models. Bioengineering 2022, 9, 39. [Google Scholar] [CrossRef]
- Lee, B.; Jung, S.; Hashimura, Y.; Lee, M.; Borys, B.S.; Dang, T.; Kallos, M.S.; Rodrigues, C.A.; Silva, T.P.; Cabral, J.M. Cell Culture Process Scale-Up Challenges for Commercial-Scale Manufacturing of Allogeneic Pluripotent Stem Cell Products. Bioengineering 2022, 9, 92. [Google Scholar] [CrossRef]
- Alexovič, M.; Dotsikas, Y.; Bober, P.; Sabo, J. Achievements in robotic automation of solvent extraction and related approaches for bioanalysis of pharmaceuticals. J. Chromatogr. B 2018, 1092, 402–421. [Google Scholar] [CrossRef]
- Elpa, D.P.; Prabhu, G.R.D.; Wu, S.-P.; Tay, K.S.; Urban, P.L. Automation of mass spectrometric detection of analytes and related workflows: A review. Talanta 2020, 208, 120304. [Google Scholar] [CrossRef]
- Alexovič, M.; Urban, P.L.; Tabani, H.; Sabo, J. Recent advances in robotic protein sample preparation for clinical analysis and other biomedical applications. Clin. Chim. Acta 2020, 507, 104–116. [Google Scholar] [CrossRef]
- Djisalov, M.; Knežić, T.; Podunavac, I.; Živojević, K.; Radonic, V.; Knežević, N.Ž.; Bobrinetskiy, I.; Gadjanski, I. Cultivating Multidisciplinarity: Manufacturing and Sensing Challenges in Cultured Meat Production. Biology 2021, 10, 204. [Google Scholar] [CrossRef]
- Tric, M.; Lederle, M.; Neuner, L.; Dolgowjasow, I.; Wiedemann, P.; Wölfl, S.; Werner, T. Optical biosensor optimized for continuous in-line glucose monitoring in animal cell culture. Anal. Bioanal. Chem. 2017, 409, 5711–5721. [Google Scholar] [CrossRef] [PubMed]
- Mross, S.; Zimmermann, T.; Winkin, N.; Kraft, M.; Vogt, H. Integrated Multi-sensor System for Parallel In-situ Monitoring of Cell Nutrients, Metabolites and Cell Mass in Biotechnological Processes. Procedia Eng. 2015, 120, 372–375. [Google Scholar] [CrossRef]
- Weltin, A.; Slotwinski, K.; Kieninger, J.; Moser, I.; Jobst, G.; Wego, M.; Ehret, R.; Urban, G.A. Cell culture monitoring for drug screening and cancer research: A transparent, microfluidic, multi-sensor microsystem. Lab Chip 2014, 14, 138–146. [Google Scholar] [CrossRef]
- Park, D.; Lee, J.; Chung, J.J.; Jung, Y.; Kim, S.H. Integrating Organs-on-Chips: Multiplexing, Scaling, Vascularization, and Innervation. Trends Biotechnol. 2020, 38, 99–112. [Google Scholar] [CrossRef]
- Xue, Y.; Seiler, M.J.; Tang, W.C.; Wang, J.Y.; Delgado, J.; McLelland, B.T.; Nistor, G.; Keirstead, H.S.; Browne, A.W. Retinal organoids on-a-chip: A micro-millifluidic bioreactor for long-term organoid maintenance. Lab Chip 2021, 21, 3361–3377. [Google Scholar] [CrossRef]
- Moya, A.; Ortega-Ribera, M.; Guimerà, X.; Sowade, E.; Zea, M.; Illa, X.; Ramon, E.; Villa, R.; Gracia-Sancho, J.; Gabriel, G. Online oxygen monitoring using integrated inkjet-printed sensors in a liver-on-a-chip system. Lab Chip 2018, 18, 2023–2035. [Google Scholar] [CrossRef] [Green Version]
- Rojas, D.; Hernández-Rodríguez, J.F.; Della Pelle, F.; Escarpa, A.; Compagnone, D. New trends in enzyme-free electrochemical sensing of ROS/RNS. Application to live cell analysis. Microchim. Acta 2022, 189, 102. [Google Scholar] [CrossRef]
- Coluccio, M.L.; Perozziello, G.; Malara, N.; Parrotta, E.; Zhang, P.; Gentile, F.; Limongi, T.; Raj, P.M.; Cuda, G.; Candeloro, P.; et al. Microfluidic platforms for cell cultures and investigations. Microelectron. Eng. 2019, 208, 14–28. [Google Scholar] [CrossRef]
- Huang, J.; Qin, Q.; Wang, J. A Review of Stereolithography: Processes and Systems. Processes 2020, 8, 1138. [Google Scholar] [CrossRef]
- International Standardization Organization. ISO 10993-5:2009, Geneva. Available online: https://www.iso.org/standard/36406.html. (accessed on 10 March 2022).
- Freshney, R.I. Defined Media and Supplements. In Culture of Animal Cells: A Manual of Basic Technique, 5th ed.; Wiley-Liss: New York, USA, 2005. [Google Scholar] [CrossRef]
- Treloar, N.J.; Fedorec, A.J.H.; Ingalls, B.; Barnes, C.P. Deep reinforcement learning for the control of microbial co-cultures in bioreactors. PLoS Comput. Biol. 2020, 16, e1007783. [Google Scholar] [CrossRef] [PubMed] [Green Version]
- Ng, W.L.; Chan, A.; Ong, Y.S.; Chua, C.K. Deep learning for fabrication and maturation of 3D bioprinted tissues and organs. Virtual Phys. Prototyp. 2020, 15, 340–358. [Google Scholar] [CrossRef]


Publisher’s Note: MDPI stays neutral with regard to jurisdictional claims in published maps and institutional affiliations. |
© 2022 by the authors. Licensee MDPI, Basel, Switzerland. This article is an open access article distributed under the terms and conditions of the Creative Commons Attribution (CC BY) license (https://creativecommons.org/licenses/by/4.0/).