Abstract
The international wine trade plays a crucial role in the global economy, and an effective method for wine sensory analysis is essential. The International Organization of Vine and Wine (OIV) has issued a review document on wine sensory analysis, but further specialization and development remain indispensable. Our research team adopted standardized methodologies from the organoleptic evaluation of olive oil and the sensory analysis of milk and dairy products, which served as the foundation for creating a robust and repeatable methodology for the recruitment, selection, training, and monitoring of assessors for wine sensory analysis. A statistically validated method for wine sensory analysis was developed during this study. Simultaneously, a comparative study involving two distinct groups of candidate assessors was conducted, with one group trained in the organoleptic evaluation of olive oil and another untrained in this area, aiming to compare the effectiveness of untrained and trained assessors in further training for wine evaluation. Finally, the developed method was applied to sensorially evaluate 25 PDO Nemea wine products. Based on the results, it appears that the proposed method for recruiting, training, and selecting assessors is reliable and leads to sensory panels with excellent reproducibility. Furthermore, it establishes that assessors from an olive oil organoleptic evaluation panel have a higher likelihood of being selected as assessors for a wine sensory analysis panel.
1. Introduction
Wine plays a crucial role in international trade, with its global export value reaching EUR 36 billion in 2023—the second highest ever recorded. This trade primarily occurs between developed economies. Specifically, the top three wine-exporting countries by volume are Italy, Spain, and France. Additionally, significant wine exports come from Chile, Australia, South Africa, Germany, Portugal, Canada, the USA, Argentina, and New Zealand.
Conversely, the leading wine-importing nations, based on volume, are Germany, the United Kingdom, and the USA. Following closely are France, the Netherlands, Russia, Canada, Belgium, Portugal, China, Japan, Italy, and Sweden [1].
The importance of wine as a consumer product is evident from numerous studies conducted in the field of consumer research [2,3,4]. These studies often focus on the organoleptic characteristics of wine, evaluated by experienced assessors [5]. Interestingly, the process of comparing organoleptic evaluations between consumers and trained assessors extends beyond wine and applies to other products as well [6].
The significance of the organoleptic evaluation and sensory analysis of wine extends beyond the market; it also plays a crucial role in the wine’s production. The organoleptic characteristics of a wine can be influenced by several factors, including grape variety [7], grape-growing region, harvest conditions, soil type, and winemaking practices [8,9]. Numerous research publications have illustrated the use of sensory science in comparing winemaking parameters. For example, researchers have conducted studies on the organoleptic properties of wines with varying proanthocyanidin contents [10], as well as wines aged using oak chips [11,12] and during bottle aging [13]. Additionally, studies have successfully categorized wines based on their organoleptic characteristics related to specific growing regions [13,14]. Clearly, sensory analysis is useful for oenologists and winemakers, as winemaking practices [15,16] and cultivation regions significantly influence the organoleptic characteristics. Additionally, organoleptic analysis could become a useful tool during the final blending of wines to create the final product.
Numerous organoleptic test methods have been applied to wine research. More specifically, this includes triangular tests [16]; rank rating [8]; sensory descriptive profiling using discontinuous 3-point, 5-point, and 7-point scales [11,13]; the frequency of attribute citation method [7]; and sensory descriptive profiling using a continuous scale of 0–10 [10,17,18]. In research with discontinuous scales or with a continuous scale, the average is the most widespread methodology for calculating the value of each attribute [10,11,13,17]. These methods are mostly employed by experienced wine tasters who undergo further training during the research process. Although the training methodology is briefly described, detailed information is usually not provided. For the statistical validation of the citation frequency-based descriptive methods that have been developed, the reproducibility index (Ri) is mainly used [19,20,21,22]. This index utilizes the number of descriptors chosen by the judge in both replicates, as well as the number of descriptors chosen by the judge in the first and second replicates. The composition of the organoleptic panel significantly influences its performance. In order to explore this, researchers have conducted comparative studies involving different groups of assessors. Specifically, they have compared two distinct groups: professional sommeliers and trained assessors, both of which are engaged in descriptive analysis [23]. These studies extend beyond the realm of wine tasting. For instance, in the field of organoleptic analysis of complex odors, researchers have compared the performance of trained and untrained assessors [24]. Additionally, similar studies have been applied to food evaluation, where the performance of a group of trained assessors was compared to that of consumers [6].
The great importance of sensory analysis is demonstrated by the multitude of standards issued by the International Organization for Standardization (ISO) in this field. These standards describe general guidelines for the selection of assessors, using tests for color vision, ageusia, and anosmia, as well as for the training and monitoring of selected assessors [25]. In addition, instructions are provided for determining perception thresholds [26], the methods related to investigating the sensitivity of taste [27], and the methodology for training assessors in the detection and recognition of odors [28]. Simultaneously, the standards outline the subsequent stages after training, including instructions for establishing a sensory profile [29] and guidelines for monitoring the performance of a quantitative sensory panel [30]. These standards have been assimilated from the standards, official documents, or EU Regulations on the sensory analysis of specific products.
The International Organization of Vine and Wine (OIV) has created a document as a review of the sensory analysis of wine [31], in which many elements from the ISO standards have been assimilated. This document represents the consensus reached by the members of the group of experts called the Subcommission Methods of Analysis of the OIV and is a proposal for the selection and training of tasters for the organoleptic analysis of wine. It provides very detailed and precise instructions for a series of tests, including tests to detect disabilities and determine sensory awareness. The document covers various topics, such as describing odors, identifying defects in wine using solutions, and addressing the most common defects in wine. Additionally, it includes guidelines for the sensory evaluation of different types of tannins, as well as instructions for assessing both assessor and panel performance. Specifically, this document presents a list of the main visual, olfactory, tactile, and taste-altered characteristics of wines, which are intended for use in taster training. Although the document provides detailed guidance in some areas, such as the initial training, much of it offers general guidance, necessitating specialization and expansion. Furthermore, it draws a connection between the accreditation for sensory analysis of wines and related works conducted in the field of olive oil.
The International Olive Council (IOC) has published a series of standards on the sensory analysis of olive oil. These standards describe the method of organoleptic testing for virgin olive oil [32], and additionally, they provide very detailed guidelines for meeting the requirements of ISO 17025 for sensory testing laboratories for virgin olive oil [33]. The IOC has also issued a guide for the selection and training of tasters, which includes specific objectives for assessing candidate tasters and determining their acceptance or rejection [34]. Furthermore, internal quality control guidelines for sensory laboratories [35] cover detailed instructions and examples for evaluating individual tasters and panel performance. This evaluation involves using duplicates and calculating metrics, such as the precision number and deviation number, with specific acceptance criteria for each parameter. The accompanying standards include a general basic vocabulary [36] and a method for the organoleptic assessment of extra virgin olive oil, which is applied to the designation of the origin [37].
Further, the literature on sensory analysis in milk and milk products has also been particularly developed. For this product category, the International Organization for Standardization (ISO) has issued three standards. These standards provide general guidance for the recruitment, selection, training, and monitoring of assessors [38]. Additionally, they recommend methods for sensory evaluation for each category of product, proposing attributes for each product [39]. Furthermore, the ISO standards offer guidance on a method for evaluating compliance with product specifications, including instructions for creating a relevant test report [40]. In more detail, the standard on assessors [38] provides comprehensive tests for basic odor and taste recognition, as well as the training and evaluation of assessors across different product categories. Specific scoring targets are set for the selection or rejection of each assessor. The evaluation tests cover both olfactory and gustatory aspects, including positive attributes and defects.
In the realm of wine, the imperative to establish comparable panels and achieve methodological harmonization in wine sensory analysis has prompted research efforts. These studies aim to furnish a guide on selecting and training tasters, with a specific focus on the taste attributes of wines bearing a Protected Designation of Origin (PDO) rating [18]. The study provides meticulous instructions for training assessors in the utilization of a continuous scale, employing standards to assess certain taste parameters and their corresponding concentrations.
The purpose of the present study is to develop a standardized method for the organoleptic analysis of wine by employing visual, olfactory, and taste attributes. This method is based on the proposals of the OIV. This study not only implements and refines the specific OIV proposals but also extends them by incorporating standards from other domains, such as virgin olive oil, milk, and milk products, as well as drawing upon relevant research in the field of wine.
The present study outlines a detailed process for training, selecting, and monitoring assessors. It provides an in-depth description of the analysis method and a comprehensive quality control methodology for both the sensory team and individual assessors. The detailed procedures include descriptions of the solutions used, a defined scoring system for assessor selection, and specific performance acceptance criteria. The ultimate goal is to create a standardized method that can be easily applied and replicated by other sensory panels.
At the same time, the two groups of candidate assessors for the developed method are compared: an accredited group for the organoleptic evaluation of virgin olive oil, which has not received training in the organoleptic analysis of wine, and an untrained group of candidate assessors, with no experience in sensory analysis, known as the “virgin” group. The aim is to evaluate whether the groups involved in the organoleptic evaluation of virgin olive oil can serve as a pool of candidate assessors that can be leveraged for the organoleptic analyses of wine, potentially increasing their chances of final selection.
Finally, the developed method is applied to the analysis of 25 commercial wine PDO Nemea products made from the Agiorgitiko variety. The results are used to investigate the discrimination ability of the standardized sensory method. Additionally, the study explores whether there is any correlation between the retail price of Nemea products and specific organoleptic attributes.
The main purpose of this specific study is to offer a sensory analysis method that is easily applicable and produces repeatable results. This method will serve as a valuable tool for oenologists and winemakers during the wine production process and in the international trade of these products.
2. Materials and Methods
2.1. Wines
A total of 25 commercial Nemea wines purchased by the Nemea Winemakers Association were analyzed. The price of the wines ranged from EUR 5 to 30 per bottle. The vintages for these wines were 2015 and 2016.
For the reproducibility and monitoring tests of panel performance and taster performance, seven wine products were purchased from the market. These wines were produced from Greek grape varieties, specifically Moschofilero, Assyrtiko, Savvatiano, Malagouzia, Agiorgitiko, and Xinomavro. The vintages for these wines were 2017 and 2018.
2.2. Chemicals and Reagents
A total of 22 compounds were purchased from commercial sources: vanillin, 4-ethylphenol, cis-3-hexen-1-ol, and isoamyl acetate were purchased from Acros Organics (Geel, Belgium); caffeine was purchased from Alfa Aesar (Ward Hill, MA, USA); butyric acid, citric acid, sodium chloride, and tannic acid were purchased from Honeywell Fluka (Charlotte, NC, USA); 2,4,6-trichloroanisole (TCA) was purchased from HPC Standards (Borsdorf, Germany); potassium disulfite was purchased from Merck (Darmstadt, Germany); acetic acid and ethyl acetate were purchased from Penta (Prague, Czech Republic); and 2-phenyl ethanol, 4-ethyl guajacol, benzyl-acetate, citral, ethanal, monosodium L-glutamate, sucrose, and tartaric acid were purchased from Sigma Aldrich (St. Louis, MO, USA). Grape tannin and “Qualitan Grape” were purchased from Dolmar (La Rioja, Spain). D(+)-Glucose was purchased from Panreac Applichem (Barcelona, Spain). The list of the standards, Chemical Abstracts Service Number (CAS Registry Number), molecular formula, purity, and company are shown in Table A1.
2.3. Equipment and Software
For the present organoleptic tests, wine-tasting glasses were used, which complied with the requirements of ISO 3591 [41]. During the training, whenever deemed necessary, the specified glassware was black to hide the color of the sample. Watch glasses were used to close the rim of each glass.
The Fizz sensory software “Acquisition”, v.2.47B from (Biosystemes, Couternon, France) was employed to generate the assessor sheet, determine the order of sample presentation, and assign three-digit codes to each sample. After the tests, data entry for further processing was performed using Fizz Calculations software, v.2.47B (Biosystemes, Couternon, France).
2.4. Panelists
A total of 20 candidate assessors were recruited for basic training in sensory analysis. The goal was to create a sensory panel of 10 assessors. In order to achieve this, twice the number of individuals actually required to constitute the final panel [25] were recruited. The age range of the 20 candidates was between 25 and 80, with an average age of 41.4 years. Thirteen of the candidate assessors were female, and seven were male.
The candidate assessors were divided into two groups, each consisting of 10 people. Group A comprised those candidates who had received training in the organoleptic evaluation of virgin olive oil and participated in an accredited panel for evaluating olive oil by the Hellenic Accreditation System (E.SY.D.). In contrast, Group B consisted of candidates who had not received training in the organoleptic evaluation of olive oil. Importantly, neither Group A nor Group B candidates had prior experience in sensory wine analysis.
During the selection process, candidates completed an initial questionnaire regarding their interest in organoleptic testing and availability. The selection criteria included consideration of the candidates’ interest in products of vitivinicultural origin and their experience in sensory evaluation activities [31]. Additionally, factors such as availability, motivation, ability to communicate, good health, and the ability to isolate themselves from external stimuli were taken into account [25]. Data were obtained from a relevant questionnaire and personal interviews with each candidate assessor.
2.5. Training Process
In total, 28 training sessions were conducted over a period of 6 months. The training started with theoretical training, which was based on international standards [25]. The theoretical training encompassed a broad range of subject matter, including the types of assessors, panel leader responsibilities, recruitment methods, screening tests, applications of sensory profiling, and general test conditions.
2.5.1. Tests to Detect Organoleptic Inabilities
Candidate assessors were then tested for their ability to accurately perform organoleptic analysis by conducting an ageusia test for three basic flavors and astringent sensation, as well as an anosmia test using four volatile substances involved in wine aroma [25], as presented in detail in Table A2. For these compounds and concentrations, it is generally accepted that candidates with less than 80% successful results should not be selected as assessors.
Subsequently, tests for stimulus detection [25] were conducted, employing triangular tests [42] with three taste parameters and one odor parameter. The materials and concentrations utilized are detailed in the Appendix A (Table A3).
The selection section for detecting inabilities in organoleptic tests was completed with a color blindness test, where each tester underwent evaluation using the Ishihara method.
2.5.2. Threshold of Perception
The perception threshold for each candidate assessor, as well as for the group as a whole regarding the five basic tastes, was determined using a method based on international standards [26]. Specifically, each taster was presented with three solutions by employing the three alternative forced choice (3-AFC) methodology. In this approach, one of the three solutions contained the substance to be examined dissolved in water, while the other two samples consisted of water alone. The taster’s task was to select the sample in which they perceived taste. This procedure was repeated for increasing concentrations. Subsequently, the perception threshold was calculated for each individual candidate assessor and for the entire group using the “Shortcut procedure using Best Estimate Threshold (BET)”. Notably, the perceptual threshold was assessed for the five basic tastes: sweet, sour, salty, bitter, and umami.
2.5.3. Tests to Determine Sensory Awareness
Tests to Detect a Stimulus
Tests to determine organoleptic perception were conducted. During the process of detecting taste stimuli, the five basic tastes—sweet, sour, salty, umami, and bitter—were thoroughly examined, along with astringency. These tests were carried out using aqueous solutions containing characteristic substances for each of the six flavors, employing triangular tests [31]. Detailed information regarding the substances and their concentrations are shown in Table A4.
In addition, the process of identifying tastes was carried out. Solutions were created for the five basic tastes, with the substances and concentrations described in international standards [26]; these are shown in Table A5. Candidate assessors received a sample of each type and were given the necessary time to familiarize themselves with it. They were then presented with a series of the same materials, including one or two glasses containing water. More specifically, they were given 10 glasses corresponding to one of the five flavors, as well as 2 glasses of water. After each trial, the tasters had to identify the characteristic taste of each sample.
Discrimination Tests between the Levels of Intensity of a Stimulus—Ranking Tests
The next training session involved ranking tests, which assessed the discrimination ability of each candidate. These tests were applied to color, odor, and taste [31]. The CIELAB color coordinates and the substances for odor discrimination, taste discrimination, and astringency discrimination, along with the concentrations for each level, are presented in Table A6. During the tests, samples were presented to the candidates following a Latin square design. The evaluation of the ranking tests was carried out with a scoring system from 0 to 4 points [38], as presented in Table A7.
2.5.4. Tests of Aroma Description
A series of solutions was presented to the candidate assessors, each possessing a characteristic odor above the perception threshold. These selected odors were intentionally associated with the aromas found in wines. The tests were conducted using ISO 3591 black wine glasses, ensuring that the color of the solution remained hidden from the tester. During the testing process, the samples were presented individually, and each candidate was asked to record the odor they perceived. Following the candidate’s initial reaction, the instructor had the opportunity to discuss the sample further, exploring the candidate’s ability to describe the sensory stimulus. The solutions chosen and their basic aroma descriptions are detailed in Table A8. The selected odors are commonly found in wines, including vanilla, caramel, and lemon [31]. Simultaneously, we considered the proposed aromatic compounds described in milk assessors training, which are also relevant to wine, during the aroma selection process [38]. The concentrations for the solution of each substance were based on international standards [28]. For those substances without relevant reports, a solution was created with a concentration 10 to 20 times higher than the perception threshold. In such cases, the trainer evaluated the solution and its odor intensity, and any necessary adjustments were made.
The candidates’ performance was scored as follows: 3 points for a correct identification or description of the most frequent association, 2 points for a description in general terms, 1 point for a distant association identification or description, and 0 points for a non-response or a completely incorrect response. Examples of the scoring method for the selected substances are presented in Table A8.
2.5.5. Evaluation of Training—Selection of Assessors
After the basic training, the candidate assessors were evaluated on three tests: basic taste recognition, ranking tests, and aroma recognition.
Basic Taste Recognition
Five solutions of the five basic tastes were prepared at selected concentrations, as shown in Table A9. These five solutions, along with a water sample, were presented to the candidate assessors using three-digit random codes. The order of presentation was randomized but consistent for all testers. Each tester was then asked to identify the base taste represented by each solution. Candidates’ responses were scored on a scale of 1 to 6 points, as indicated in Table A10.
Ranking Tests
The candidate assessors were presented with four groups of solutions. Each group consisted of four solutions with a characteristic taste or aroma. The testers were asked to rank each group’s four solutions in order of increasing intensity. The solutions were presented with three-digit codes and a Latin square design. The groups and concentrations of each solution are shown in Table A11. The candidate assessors’ performance was scored from 0 to 4 points, as indicated in Table A7.
Odor Recognition
A series of nine solutions were presented to the candidate assessors—each with a characteristic odor associated with the aroma of wines—at a concentration above the perception threshold. The tests were carried out in ISO 3591 black glass wine glasses, ensuring that the color of the solution was not visible to the tester. The solutions selected, along with a basic description of their fragrance and the scoring method for each tester, are shown in Table A12.
Evaluation of Basic Training
In the tests described in Sections “Basic Taste Recognition”, “Ranking Tests”, and “Odor Recognition” in Section 2.5.5, the maximum number of points that a candidate could collect is 53. A tester’s training is considered successful if the score they collect is higher than 65% (more than 35 points). The ranking of the candidates’ scores was taken into account in their final selection.
2.5.6. Training and Identification of Wine Defects Using Aqueous Solutions
Aqueous solutions were created to train tasters on wine defects. The solutions were presented to the candidate assessors, and the instructor explained each aroma. For each defect, three solutions were prepared at low, medium, and high intensities. Testers were then asked to rank the samples within each triad based on increasing intensity. The substances used and the concentrations corresponding to low, medium, and high intensities are shown in Table A13.
2.5.7. Identification of Wine Defects and Wine Characteristics Using Spiked Wine
Five different wine defects and three additional wine characteristics were selected, consisting of samples with varying fruit intensities, different tannin intensities, and whether they were aged in barrels or not. A triangle test was performed for each group of samples. These triangle tests were conducted in duplicate to determine whether the candidate assessors could replicate their results consistently. The sample sets and the method of presentation were based on international standards [38], with necessary adaptations from the OIV recommendations [31], as shown in Table A14.
The candidate assessors were rated according to the following scale: each tester received 6 points if they provided a correct response for both sample set #1 and sample set #2, 4 points if they had a correct response for either sample set #1 or sample set #2, 0 points if they had an incorrect response for both sample set #1 and sample set #2, and 0.5 points if they accurately described the difference.
2.5.8. Sensory Evaluation of Different Types of Tannins
The candidates were asked to taste solutions of anthocyanidic tannins (from grape skin), gallic tannins, and ellagic tannins (from oak) at a concentration of 0.1 g/L. They were instructed to evaluate these solutions and write down all the descriptive words that could characterize the samples. The training leader then judged whether the descriptions were correct or incorrect. The responses of the testers were rated on a scale from 0 to 2 points for each type of tannin, resulting in a maximum score of 6.
2.5.9. Ranking Test of Wines with Different Intensities of Oak Barrel Aroma
The candidate assessors were asked to rank four wine solutions appropriately spiked to create solutions of varying oak barrel aroma intensities. This was achieved by spiking a wine sample with a mixture of vanillin and whiskey lactone (50–50% w/v). The concentrations of these substances in the final sample are detailed in Table A11. Detailed information about the compounds is shown in Table A1. Each tester’s score ranged from 0 to 4 points, as specified in Table A7.
2.5.10. Marking the Schedule Summary
The maximum score of all the above tests when examining the testers is shown in Table A15. Guidelines for the selection of panel members, according to the marking schedule, are listed in Table A16 and are as follows:
- (a)
- An overall score of 65% or greater in a combination of odor recognition, basic taste recognition, ranking of basic taste, and ranking of barrel flavor.
- (b)
- An overall score of 50% or greater for the descriptive tests.
- (c)
- If the panel members obtained correct scores in at least 65% of the triangle tests.
- (d)
- Those candidates who achieve less than 65% of the total score are considered unsuitable as sensory evaluators and require additional training [38].
2.5.11. Assessors’ Selection—Creation of New Panels
The results of the candidates’ scores were evaluated to create two new sensory panels. The candidate assessors were ranked in descending order of score, and subsequently, two new panels were formed: Panel C comprised the 10 highest-scoring assessors, while Panel D consisted of the 10 lowest-scoring assessors.
2.6. Wine’s Sensory Analysis Method
2.6.1. General Instructions
The instructions provided to the assessors and the general rules followed are outlined below.
The optimal time for conducting a sensory analysis is between 10:00 and 12:00 in the morning. In order to ensure the best possible performance, assessors should refrain from wearing perfumes, be in good physical and psychological condition, and avoid smoking for at least half an hour before the test.
The sensory analyses take place in a dedicated test room designed according to the specifications outlined in the relevant standard documents [43,44]. The testing environment is well ventilated and air-conditioned, maintaining a temperature range of 20–25 °C. During the tests, the samples are presented at a consistent temperature of 15 °C, each labeled with a random three-digit number. ISO 3591 tasting glasses, sealed with watch glasses, are used for the analysis. Mineral water serves as a palate cleanser, and each session accommodates a maximum of four samples, with a limit of three sessions per day.
2.6.2. Sensory Analysis Methodology
The wine sensory analysis method developed includes 3 negative attributes and 11 positive attributes. The three negative qualities are appearance defect, aroma defect, and taste defect. The appearance defects include a hazy appearance, browning, and a pinking effect. Aroma disadvantage and taste disadvantage encompass characteristics such as moldy/earthy, acetic, reduced, oxidized, animal, lactic, and TCA. On the other hand, the 11 positive qualities consist of turbidity, color, hue, fruity aroma, barrel aroma, flavor intensity, sour, sweet, bitter, astringency, and aftertaste duration.
In order to assess these attributes, a tester sheet was employed for all attributes, where each attribute was linked to a continuous scale of 0–10. The assessors were instructed to mark an “x” or a vertical line on the corresponding scale position to indicate the perceived intensity of the attribute. The profile sheet is provided in the appendix (Figure A1).
The sensory analysis process begins with a prolonged visual observation, focusing on parameters such as appearance defect, turbidity, color, and hue. Subsequently, the assessor evaluates the olfactory parameters (including aroma defect, fruity aroma, and barrel aroma) by inhaling without swirling the glass and then inhaling after swirling it. Finally, after taking the first mouthful, the wine is allowed to warm briefly while being moved around the mouth. The assessor then inhales through the nose and spits. The taste attributes (including taste defect, flavor intensity, sour, sweet, bitter, astringency, and aftertaste duration) are recorded. When assessing negative attributes, the assessor notes the intensity of the most significant defect (if multiple exist) and selects the corresponding defect characterization from the profile sheet. If the defect is not described on the sheet, the term “other” is chosen.
2.6.3. Use of the Data by Panel Leader
The panel leader measures the intensities of each property to one decimal place and enters the data into a computer program. For each sample, the median value (Me) and the robust coefficient of variation (CVR%) are calculated. Specifically, the robust coefficient of variation for a potential defect, a fruity aroma, and sourness must not exceed 20.0%. If it does, the panel leader must repeat the evaluation of the specific sample in another tasting session [32].
In this study, data entry into the computer program utilized specialized software for the organoleptic analysis (Fizz Calculations, Biosystemes, Couternon, France). The calculations for the median value and robust coefficient of variation were performed using the calculation program of the International Olive Oil Council (IOC).
2.6.4. Assessors’ Training on the Profile Sheet
The panel leader proceeded to train the two test groups, C and D, in the use of the profile sheet. Four sessions were conducted, involving the analysis of wine samples and references. In order to prepare the assessors for using the continuous scale, training instructions from the organoleptic evaluation of olive oil [34] were employed for the aromatic attributes. Additionally, recent studies [18] were utilized to train the testers on the continuous scale for taste parameters (sour, sweet, and astringent), and concentrations for bitter were also incorporated, as indicated in Table A17.
2.7. Validation of the Method
For method validation and to check the performance of each assessor and each team, we selected characteristic defects (such as “animal” defects, with the use of 4-ethylphenol), an olfactory parameter (fruity), and a taste parameter (sour). Seven wines derived from Greek grape varieties were utilized for the calculations. The process unfolded as follows: Each day, a set of four samples was provided to the tasters. Among these, two were identical (duplicate), one sample was repeated daily (to evaluate reproducibility), and the fourth sample was randomly chosen. Each sample was assigned a unique three-digit code, and the presentation followed the principles of the Latin square design.
2.7.1. Checking the Performance of Each Taster
In order to assess the performance of each tester, we employed the replicate analysis method. In this approach, a sample intended for analysis is presented to the testers twice during the same session, each time with distinct three-digit codes. The taster’s performance is influenced by two key factors:
Deviation from itself: This refers to any variation observed when analyzing the same sample at two different time points.
Deviation from the group (the panel): This accounts for differences in performance compared to the overall panel during the same session.
In order to measure these differences, the precision number (PN) and the deviation number (DN) were used.
Checking the Taster’s Precision
The precision (repeatability and in-laboratory intermediate precision) of all tasters was determined using the replicate analysis method. Repeatability for each taster was assessed by comparing the intensity scores when analyzing duplicate samples.
Intermediate precision was evaluated over time using the precision number (PN), which considers the intensities assigned by the taster to a set of six duplicate samples on different days. The PN is defined as
where xi,1 and xi,2 are the values given by the taster to the first and second assessment of a duplicated sample, and n is the number of differences (xi,1 − xi,2), corresponding to the number of duplicated samples analyzed.
The criterion of acceptance of the taster was PNt ≤ 2.0.
Checking the Taster’s Trueness
Trueness refers to the agreement between the average value of a large series of measurements and the accepted reference value or the “true value”. In our specific case, where no reference materials or interlaboratory proficiency testing data were available, we considered the panel median for the specific attribute as the true value.
In order to estimate trueness, the deviation number (DN) was calculated based on the analysis of six duplicate samples on different days.
The DN is defined as
where DNt is the deviation number of a taster for the specific attribute in the first replicate of the duplicate sample “I”, xi is the intensity score given by the taster for the specific attribute, Mei is the value of the panel median for the specific attribute, and n is the number of differences considered for the calculation (n = 6 in this calculation).
The criterion of acceptance of the taster was DNt ≤ 2.0.
Checking the Panel’s Precision
The repeatability of the panel was evaluated by comparing the pair of medians obtained by analyzing a sample in duplicate with the calculation of the normalized error (En).
The precision of the panel was checked by comparing the pairs of medians obtained by analyzing six duplicate samples (12 samples analyzed in total) with the calculation of the precision number for the panel (PNp).
More specifically, the En was calculated according to the following formula:
where En is the normalized error of the panel for the specific attribute; Me1 and Me2 are the medians obtained by the panel for the specific attribute in the first and second assessment of a sample, respectively; U1 and U2 are the respective expanded uncertainties calculated as c × s1 and c × s2, with c = 1.96 for a 95% probability; and s1 and s2 are the experimental robust standard deviation values of the medians Me1 and Me2, respectively, for the attribute.
The criterion of the acceptance of the panel was En ≤ 1.0.
The precision number for the panel (PNp) was calculated according to the following formula:
where PNp is the indicator of the consistency of a panel “p” for a specific attribute in evaluating a sample in duplicate; Me1 and Me2 are the medians of the panel for the specific attribute in the first and second assessment of the duplicated sample, respectively; and n is the number of duplicated samples taken into account (in this case, six duplicate samples, n = 6).
The criterion of acceptance was PNp ≤ 2.0.
Calculation of Reproducibility
In order to evaluate the reproducibility of the sensory analysis method, six analyses were performed on different days using the same red dry wine from the Agiorgitiko variety, which had matured in oak barrels. Based on the results obtained by the panel, the median, standard deviation, and relative standard deviation were calculated.
2.8. Sensory Analysis of Nemea Wines—Statistical Analysis
Panel C applied the developed method to sensorially analyze the 25 commercial wines from AOC Nemea. Each sample was analyzed in duplicate, and the median value was calculated for each organoleptic attribute. Subsequently, the average of the two values for each sensory attribute was calculated.
Additionally, the data underwent a one-way analysis of variance (ANOVA) for the products to assess the discriminatory ability of each attribute [25]. Finally, principal component analysis (PCA) was performed using JMP software 18.0.1. version(SAS, Campus Drive Cary, NC, USA).
3. Results
3.1. Taster’s Performance during Basic Training
For the ageusia tests, all tasters in Team A had a pass rate of 80 to 100%. The average successful responses of Team A were 90%. The Team B tasters had a success rate of 60% to 90%. More specifically, two candidate assessors had a percentage of less than 80%. The average of the successful responses of Team B was 78%. For the two candidate assessors who had a percentage of less than 80%, a repetition of the test was carried out, in which they had a percentage of successful answers greater than or equal to 80%.
For the anosmia tests, the Team A tasters had a success rate of 63 to 100%. The average of the successful responses of Team A was 93%. The Team B tasters had a success rate of 38 to 100%. More specifically, two candidate assessors from Team A and six from Team B had a percentage of less than 80%. The average of the successful responses of Team B was 75%. The candidate assessors who had a percentage of less than 80% were retested and given a short training session by the team leader, in which they had a percentage of successful responses greater than or equal to 80%.
In the Ishihara test, the two teams had exactly the same results. All candidates had 100% success results, except two—one from Team A and one from Team B—who had 94% success.
Team A had a lower perception threshold than Team B in all five basic tastes, as shown in Table 1.

Table 1.
The perception threshold of each team in the five basic tastes.
In the tests that determined organoleptic awareness, during the process of detecting taste stimuli using triangle tests, all but one taster in Team A achieved success, resulting in a total of 59 correct answers out of 60. Similarly, all tasters in Team B were successful, except for two tasters, yielding a total of 55 correct answers out of 60.
In the taste identification tests, each taster had to identify 10 flavored solutions. For each correct identification, the taster received 1 point, resulting in a maximum score of 10 points per taster. Team A scored 87 points, and Team B scored 78 points.
In the ranking tests, all tasters successfully identified the color of red wines, leading to identical performances for Teams A and B. For odor discrimination, which involved four aromatic substances (acetic acid, TCA, ethyl acetate, and ethyl phenol), each taster could earn up to 16 points. Team A had four tasters with perfect scores (16/16) and an average score of 14.6. In contrast, Team B had no tasters with a perfect pass and an average score of 12.4.
For taste and astringency discrimination, which included the five basic tastes and astringency, each candidate assessor had the opportunity to earn 24 points. Team A had four tasters with perfect scores (24/24) and an average score of 22.8, while Team B also had four tasters with a perfect pass (24/24) and an average score of 22.1.
Finally, in the odor description tests, each candidate assessor could earn up to 30 points (10 aromas with a maximum score of 3 points per aroma). The scores of Team A ranged from 12 to 30 points, with an average of 19.2, while those for Team B ranged from 9 to 19 points, averaging 14.0.
3.2. Evaluation of Training
In the evaluation of basic training (“recognition and ranking tests”), there were 53 available points. Successful training was considered when the percentage was greater than or equal to 65%, equivalent to 35 points. All the tasters in Team A achieved successful results. The minimum score observed was 35 (65%), and the maximum score reached 53 (100%), resulting in an average of 44.8 points (84%). In contrast, Team B had five tasters with successful outcomes, while the remaining five tasters did not perform well. The minimum score for Team B was 24 (45%), the maximum was 38 (72%), and the average score stood at 33.5 points (63%). These results are presented in Table 2.
Table 2.
Taster scores for each stage of basic training, total score, average score for both teams, evaluation of each training stage, and overall taster evaluation.
When identifying wine defects and wine characteristics using spiked wine, the number of available points for each candidate assessor was 48, with a minimum score for successful results set at 32 points. All tasters in Team A achieved successful results, with an average score of 43.0 points. The lowest individual taster score in Team A was 32 points, while the highest reached 48 points. In Team B, seven tasters achieved successful results, while the remaining three tasters did not perform well. The mean score for Team B was 36.4 points, with a minimum individual candidate assessor score of 26 points and a maximum of 46 points, as shown in Table 2.
In the descriptive tests, which focused on the accurate identification of positive or negative wine aromas, as well as the description of different tannins, the maximum achievable score was 10 points. Results equal to or greater than 5 points were considered successful. In Team A, all tasters achieved successful results, with an average score of 8.5 points. In Team B, eight tasters succeeded, while two tasters did not, resulting in an average score of 6.1 points, as shown in Table 2.
In the total evaluation of each candidate assessor’s training, the training was considered successful if the candidate had successful results in all three areas: the recognition and ranking tests, the triangle test for wine, and the descriptive tests. According to this criterion, all 10 candidate testers from Group A achieved successful results, while only 3 candidate testers from Group B met the criteria. Subsequently, a ranking of the total scores was conducted for the 13 successful candidate testers to facilitate the final selection process. The top 10 assessors formed Panel C, comprising 8 tasters from Group A and 2 from Group B. The remaining tasters constituted Panel D, which served the research purposes of this study.
3.3. Validation of the Method
3.3.1. Checking the Panel’s Performance
Panel C yielded successful results in all duplicate sample measurements, both for normalized error and precision number, across all three organoleptic parameters tested. However, Panel D exhibited unsuccessful precision number results in three duplicate measurements, specifically for the defect (animal) parameter. Notably, all other duplicate measurements in Panel D were successful, demonstrating consistent performance in terms of both normalized error and precision number for the three organoleptic parameters, as detailed in Table 3.
Table 3.
Normalized error and precision values for each panel in each duplicate analysis of the three organoleptic parameters.
The overall performance of the panel was assessed using the precision number (PNp). Panel C achieved successful results (PNp ≤ 2.00) across all three organoleptic parameters. In contrast, Panel D exhibited an unsuccessful outcome in defect determination but achieved successful results for the other two organoleptic parameters. Notably, the precision number for Panel C was lower than that of Panel D across all three organoleptic parameters, as shown in Table 4.
Table 4.
Panel performance and taster performance for the three sensory attributes.
3.3.2. Checking the Taster’s Performance
Among the 10 tasters in Panel C, successful results were observed for all three organoleptic parameters. Specifically, the precision number (PN) remained consistently at or below 2.00, and the deviation number (DN) also met the same criterion, as shown in Table 4. In contrast, none of the 10 tasters in Panel D achieved successful results across all three organoleptic parameters. For the fruity attribute, seven tasters failed to meet the precision number threshold, and eight tasters fell short in terms of the deviation number. Regarding the animal defect, six tasters did not achieve the required precision number, while seven tasters exceeded the acceptable deviation number. Finally, for the sour attribute, three tasters failed to meet the precision number requirement, and an equal number of tasters fell short in terms of the deviation number, as shown in Table 4.
3.3.3. Reproducibility
Panel C exhibited a relative standard deviation (RSD) significantly below 10%, spanning a range from 3.6% to 5.8% across the three organoleptic parameters tested. In contrast, Panel D displayed a RSD of approximately 20%, with values ranging from 18.4% to 24.5% for the same set of organoleptic parameters, as indicated in Table 5.
Table 5.
Descriptive statistics for each panel and sensory attribute.
3.3.4. Sensory Analysis of Wines
A total of 25 commercial Nemea wines were sensorially analyzed by Panel C. The results of the median values for each organoleptic parameter, as well as the retail price, are shown in Table 6.
Table 6.
Sensory analysis results and retail prices of Nemea wines.
Five wines exhibited organoleptic aroma defects at a low intensity. The range of organoleptic defects spanned from 1.1 to 3.2. The tasters characterized two defects as animal, two as oxidized, and one as reductive.
The two samples displaying an animal defect underwent analysis using GC-MS/MS to determine the aroma compounds. The detailed analysis methodology, including the extraction method, GC-MS/MS operating conditions, and selected mass transitions for each compound, was described in a previous study by the authors [45]. In the first sample, with a sensory aroma defect intensity of 3.2, the following concentrations were observed: 4-ethylphenol (223 μg/L), 4-ethylguajacol (90 μg/L), and 4-vinylphenol (1119 μg/L). In the second sample, with a sensory aroma defect intensity of 1.1, the concentrations were as follows: 4-ethylphenol (127 μg/L), 4-ethylguajacol (31 μg/L), and 4-vinylphenol (314 μg/L).
Regarding the appearance organoleptic parameters, both color and hue exhibited substantial variations. Specifically, color ranged from 3.9 to 8.3, with an average value of 6.8, while hue ranged from 1.8 to 7.6, with an average value of 5.0.
For the aroma attributes, fruity aroma spanned between 3.2 and 6.0, with an average value of 4.5, and barrel aroma ranged from 0.0 to 4.9, with an average value of 3.3. Notably, seven samples showed higher barrel aroma intensity than fruity aroma.
The flavor intensity varied between 2.6 and 4.8, with an average value of 3.9. In terms of taste attributes, sour varied from 3.6 to 5.0, with an average value of 4.1; sweet ranged from 0.4 to 2.0, with an average value of 0.9; bitter exhibited similar values to sweet, ranging from 0.5 to 1.9, with an average value of 0.9; astringent values ranged between 2.8 and 4.1, with a mean value of 3.3; and aftertaste spanned from 3.7 to 5.1, with a mean value of 4.6.
3.3.5. Data Analysis
A one-way analysis of variance (ANOVA) revealed that all 11 organoleptic parameters were statistically significant at a significance level of p < 0.0001 in product differentiations. Additionally, principal component analysis (PCA) demonstrated a robust positive correlation between the retail price and the organoleptic parameter “barrel aroma”, as evidenced by the results presented in Table 7. At the same time, the retail price exhibited a negative correlation with the organoleptic parameters “fruity aroma” and “bitter”.
Table 7.
Correlations between retail prices and sensory attributes.
Interestingly, the retail price exhibited a negative correlation with both the bitter and fruity aroma parameters. These findings are visually depicted in Figure 1.
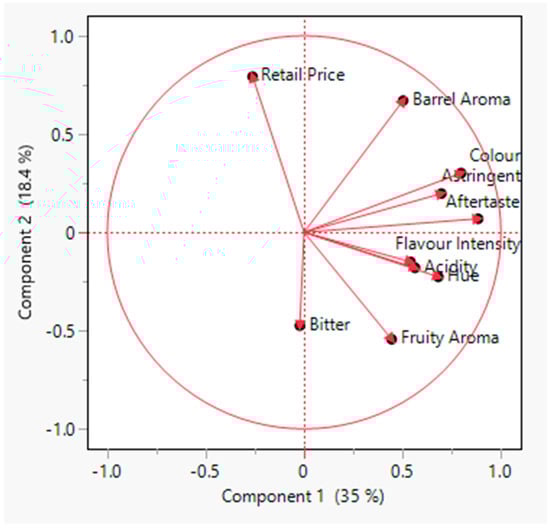
Figure 1.
PCA for the retail prices and sensory attributes of Nemea wines.
4. Discussion
In the basic training stage, both teams exhibited identical performance concerning the appearance parameters, specifically for the Ishihara test and the red wine color classification test. However, significant differences emerged concerning the olfactory and taste parameters. Team A outperformed Team B in the olfactory domain, while Team A also performed better than Team B in the taste parameters, albeit with minor discrepancies.
During the subsequent training evaluation, Team A demonstrated markedly superior results compared to Team B. Notably, the disparity in olfactory performance between the two groups was much greater than their differences in taste parameters.
The findings from the basic training and evaluation tests highlight the advantage of candidate assessors participating in an accredited olive oil organoleptic evaluation panel. Members of such panels undergo a rigorous selection process distinct from that of non-participating testers [34]. This difference in performance can also be attributed to the ability of candidate assessors from accredited panels for olive oil evaluation to concentrate better during assessments, as opposed to new candidate assessors.
Interestingly, the similar performance of Teams A and B in terms of visual parameters can be explained by the fact that olive oil organoleptic evaluation does not incorporate any visual attributes [32]. In order to eliminate any potential psychological influence from sample appearance, an appropriate glass is used to conceal the color of the olive oil [46]. Conversely, the focus of olive oil organoleptic evaluation lies in olfactory parameters, which accounts for the substantial performance gap observed between Team A and Team B in this domain.
While candidate assessors from an accredited panel for olive oil evaluation generally excelled, some individuals from Team B outperformed their counterparts in Team A during the training assessments. Specifically, two Team B candidate assessors surpassed two tasters from Team A. Consequently, the selection process for sensory wine analysis (Panel C) included eight assessors from Team A and two from Team B. The unselected tasters formed Panel D, continuing the tests to evaluate the reliability of the selection method.
The evaluation of panel performance and individual taster performance was based on three key sensory attributes: a defect, an odor, and a taste attribute. These parameters were selected following the philosophy of the organoleptic evaluation of olive oil, where a defect and fruity attribute are used to monitor the team and taster performance [35].
This study’s results unequivocally demonstrate the appropriateness of the assessor selection process. Panel C outperformed Panel D by a significant margin. Although Panel D had several results falling outside the acceptance criteria, it performed slightly better for the taste attributes than the olfactory parameters. Notably, Panel C exhibited a remarkably low relative standard deviation compared to other studies involving trained and untrained panels [24], providing additional evidence of effective training, evaluation, and final selection.
In the context of Nemea wine samples, the sensory analysis identified five samples with aroma defects. These effects were estimated to be of low intensity, as their values were below 3.5 [32]. Two samples exhibited an oxidized defect, possibly resulting from chemical aging or storage conditions. Another sample showed a reductive defect, likely arising from random errors introduced by a bottle or batch. Additionally, two samples exhibited an animal defect, which was confirmed through GC-MS/MS analysis. Previous research has demonstrated that the presence of 4-ethylguajacol, 4-ethylphenol, and 4-vinylphenol contributes to the phenolic, animal, and stable characteristics of wine [47]. The detection of 4-ethylphenol, 4-ethylguajacol, and 4-vinylphenol in both samples suggests potential Brettanomyces growth. Specifically, Brettanomyces bruxellensis can produce 4-ethylguajacol from ferulic acid, as well as 4-ethylphenol and 4-vinylphenol from p-coumaric acid [48]. Furthermore, the confirmation of the organoleptic defect via the GC-MS/MS results underscores the effectiveness of the panel’s training in identifying specific defects.
In seven wine samples, the barrel aroma intensity surpassed the fruity aroma intensity. Interestingly, the average retail price of all the surveyed products was EUR 11.8, but these seven specific products commanded an average retail price of EUR 16.7, representing a substantial 42% increase.
Principal component analysis (PCA) revealed that barrel aroma exhibited the only positive, strong correlation with retail price. Simultaneously, fruity aroma and bitter demonstrated a negative correlation with retail price. The interpretation of this specific correlation centers around the aging process of wines in oak barrels. Evidently, this particular aging process leads to an increase in barrel aroma, a decrease in fruity aroma, and a reduction in bitterness, attributed to the polymerization of tannins. The specific pricing policy is explained by the fact that barrel usage results in increased production costs, which are then passed on to consumers through higher retail prices. Interestingly, our findings diverge slightly from other studies conducted in different countries, where higher astringency, fruity character, and oak influence were associated with more expensive products [5].
From the one-way analysis of variance (ANOVA) of the sensory descriptive data for the 25 wines, it was found that all 11 attributes differed significantly across the wines. More specifically, all 11 organoleptic parameters exhibited a p-value of less than or equal to 0.0001 (p ≤ 0.0001). This result underscores the correct choice of sensory attributes and the panel’s adequate training. Specifically, only two olfactory parameters—fruity aroma and barrel aroma—were chosen. This choice aligns with previous studies, which highlight that humans have limited ability to evaluate the intensities of various odors within complex aroma compositions [24,49]. For the same reason, in 1992, the International Olive Council (IOC) revised its method to enhance the consistency of panel assessments, limiting the number of olfactory parameters in fruitiness and aroma defects [50].
5. Conclusions
In our current study, a sensory analysis method for wine was developed that encompassed four essential components: (1) the training of candidate assessors, (2) the selection of assessors, (3) a method for sensory analysis, and (4) a methodology for monitoring tasters’ performance and the panel’s performance.
The method for the selection of assessors was demonstrated to be highly effective based on the extremely satisfactory results obtained during method validation. These results were characterized by a very low relative standard deviation while simultaneously meeting the criteria for precision number and deviation number.
The analysis method involves attributes that exhibit significant differences from one another, as demonstrated through the one-way analysis of variance (ANOVA) tests.
Additionally, the findings of this study revealed that candidate assessors who actively participate in an accredited olive oil sensory evaluation panel exhibit superior performance during the training process. Consequently, they have a significantly higher likelihood of being selected for the final sensory analysis panel compared to candidate assessors who did not engage in olive oil sensory evaluations.
Lastly, the present investigation established a robust positive correlation between the retail price of Nemea wine products and the sensory attribute of barrel aroma while also identifying a negative correlation between the sensory attributes of bitter and fruity aromas.
Author Contributions
Conceptualization, I.L.; methodology, I.L.; software, I.L.; validation, I.L.; formal analysis, I.L.; investigation, I.L.; resources, I.L.; data curation, I.L.; writing—original draft preparation, I.L.; writing—review and editing, I.L. and Y.K.; visualization, I.L.; supervision, I.L. and Y.K.; project administration, I.L.; funding acquisition, I.L. All authors have read and agreed to the published version of the manuscript.
Funding
This research received no external funding.
Institutional Review Board Statement
We declare that the research entitled “Introducing a Standardized Sensory Analysis Method for Wine: A Methodology for the Recruitment, Selection, Training, and Monitoring of Assessors—Implementation on the Greek Variety “Agiorgitiko”” does not constitute medical research. Therefore, the Agricultural University of Athens considers that ethical approval was not required and provided an exemption for working with this kind of panel.
Data Availability Statement
The data that support the findings of this study are available upon reasonable request from the authors.
Acknowledgments
We appreciate the assistance of the Cadmion Laboratory in providing the necessary instrumentation and the tasters of the accredited panel for olive oil evaluation for this study.
Conflicts of Interest
The authors declare no conflicts of interest. We hereby declare that all candidate assessors voluntarily participated in this study. They were fully informed about the principles of the study, including matters related to personal safety and the confidentiality of private information. Prior to their participation, they provided written informed consent to the authors.
Appendix A
Table A1.
List of standards, Chemical Abstracts Service Number (CAS Registry Number), molecular formula, relative formula mass (Mr), purity, and company.
Table A1.
List of standards, Chemical Abstracts Service Number (CAS Registry Number), molecular formula, relative formula mass (Mr), purity, and company.
| a/a | Name | CAS | Molecular Formula | Mr | Purity | Company |
|---|---|---|---|---|---|---|
| 1 | 2,4,6 trichloroanisole (TCA) | 87-40-1 | C7H5Cl3O | 211.47 | 99.5% | HPC Standards (Borsdorf, Germany) |
| 2 | 2-Phenylethanol | 60-12-8 | C8H120 | 122.16 | 99.3% | Sigma Aldrich (St. Louis, MO, USA) |
| 3 | 4-ethylguajacol | 2785-89-9 | C9H1202 | 152.19 | 98.0% | Sigma Aldrich (St. Louis, MO, USA) |
| 4 | 4-ethylphenol | 123-07-9 | C8H100 | 122.17 | 99.2% | Acros Organics (Geel, Belgium) |
| 5 | Acetic acid | 64-19-7 | C2H4O2 | 60.05 | 99.8% | Penta (Prague, Czech Republic) |
| 6 | Benzyl-acetate | 140-11-4 | C9H1002 | 150,17 | 99.9% | Sigma Aldrich (St. Louis, MO, USA) |
| 7 | Butyric acid | 107-92-6 | C4H8O2 | 88.11 | 99.9% | Honeywell Fluka (Charlotte, NC, USA) |
| 8 | Caffeine | 58-08-2 | C8H10N4O2 | 194.19 | 99.7% | Alfa Aesar (Ward Hill, MA, USA) |
| 9 | cis-3-hexen-1-ol | 928-96-1 | C6H12O | 100.16 | 98.6% | Acros Organics (Geel, Belgium) |
| 10 | Citral | 5392-40-5 | C10H160 | 152.23 | 96.0% | Sigma Aldrich (St. Louis, MO, USA) |
| 11 | Citric acid | 77-92-9 | C6H8O7 | 192.12 | 98.0% | Honeywell Fluka (Charlotte, NC, USA) |
| 12 | D(+)-Glucose | 50-99-7 | C6H12O6 | 180.16 | 99.0% | Panreac Applichem (Barcelona, Spain) |
| 13 | Ethanal | 64-17-5 | C2H4O | 44.05 | 99.0% | Sigma Aldrich (St. Louis, MO, USA) |
| 14 | Ethyl acetate | 141-78-6 | C4H8O2 | 88.11 | 99.7% | Penta (Prague, Czech Republic) |
| 15 | Ethyl caproate | 123-66-0 | C8H1602 | 144.21 | 99.7% | Acros Organics (Geel, Belgium) |
| 16 | Isoamyl acetate | 123-92-2 | C7H1402 | 130.19 | 99.0% | Acros Organics (Geel, Belgium) |
| 17 | Monosodium L-glutamate | 142-47-2 | C5H8NO4Na | 187.13 | 98.0% | Sigma Aldrich (St. Louis, MO, USA) |
| 18 | Sodium chloride | 7647-14-5 | NaCl | 58.44 | 99.5% | Honeywell Fluka (Charlotte, NC, USA) |
| 19 | Sucrose | 57-50-1 | C12H22O11 | 342.30 | 99.5% | Sigma Aldrich (St. Louis, MO, USA) |
| 20 | Potassium disulfite | 16731-55-8 | K2S2O5 | 222.33 | 99.0% | Merck (Darmstadt, Germany) |
| 21 | Tannic acid | 1401-55-4 | C76H52O46 | 1701.20 | 99.0% | Honeywell Fluka (Charlotte, NC, USA) |
| 22 | Tartaric acid | 87-69-4 | C4H6O6 | 150.09 | 99.5% | Sigma Aldrich (St. Louis, MO, USA) |
| 23 | Vanillin | 121-33-5 | C8H803 | 152.15 | 99.5% | Acros Organics (Geel, Belgium) |
| 24 | Whiskey lactone | 39212-23-2 | C9H16O2 | 156.22 | 99.4% | Sigma Aldrich (St. Louis, MO, USA) |
Table A2.
List of standards and concentrations for the ageusia and anosmia tests.
Table A2.
List of standards and concentrations for the ageusia and anosmia tests.
| Taste or Odor | Material | Concentration in Water at Room Temperature g/L | Concentration in Ethanol at Room Temperature mg/L |
|---|---|---|---|
| Taste | |||
| Sweet | Sucrose | 10 | |
| Acid | Citric acid | 0.3 | |
| Bitter | Caffeine | 0.3 | |
| Astringent | Tannic acid | 1 | |
| Odor | |||
| Lemon, Fresh | Citral | 1 | |
| Vanilla | Vanillin | 1 | |
| Floral | Benzyl acetate | 1 | |
| Tropical fruits | Isoamyl acetate | 1 | |
Table A3.
List of standards and concentrations for stimulus detection.
Table A3.
List of standards and concentrations for stimulus detection.
| Material | Taste | Mass Concentration or Volume Fraction in Water at Room Temperature |
|---|---|---|
| Caffeine | Bitter | 0.2 g/L |
| Citric acid | Sour | 0.2 g/L |
| Sucrose | Sweet | 1.3 g/L |
| (Z)-Hex-3-en-1-ol | Green, grassy, unripe | 0.4 mL/L |
Table A4.
List of standards and concentrations to detect a stimulus.
Table A4.
List of standards and concentrations to detect a stimulus.
| Taste | Material | Concentration in Water at Room Temperature |
|---|---|---|
| Sweet | Sucrose | 10 g/L |
| Sour | Tartaric acid | 0.5 g/L |
| Salty | Sodium chloride | 2 g/L |
| Bitter | Caffeine | 0.3 g/L |
| Umami | Monosodium L-glutamate | 0.6 g/L |
| Astringent | Tannic acid | 1 g/L |
Table A5.
List of standards and concentrations for the identification of tastes.
Table A5.
List of standards and concentrations for the identification of tastes.
| Taste | Material | Concentration in Water at Room Temperature g/L |
|---|---|---|
| Sour | Citric acid | 0.28 |
| Bitter | Caffeine | 0.195 |
| Salty | Sodium chloride | 1.19 |
| Sweet | Sucrose | 5.76 |
| Umami | Monosodium L-glutamate | 0.29 |
Table A6.
List of standards and concentrations for tests to discriminate between the intensity levels of a stimulus.
Table A6.
List of standards and concentrations for tests to discriminate between the intensity levels of a stimulus.
| Level 1 | Level 2 | Level 3 | Level 4 | |
|---|---|---|---|---|
| Color discrimination for red wines | ||||
| Chromatic co-ordinates a: | 30 | 40 | 50 | 60 |
| Chromatic co-ordinates L: | 60 | 50 | 40 | 30 |
| Odor discrimination | ||||
| Acetic acid | 0.10 g/L | 0.30 g/L | 0.50 g/L | 0.70 g/L |
| 2,4,6 trichloroanisole (TCA) | 1 ng/L | 3 ng/L | 5 ng/L | 7 ng/L |
| Ethyl acetate | 10 mg/L | 40 mg/L | 70 mg/L | 100 mg/L |
| 4-ethylphenol | 0.05 mg/L | 0.15 mg/L | 0.30 mg/L | 0.45 mg/L |
| Taste discrimination | ||||
| Sucrose | 2 g/L | 6 g/L | 10 g/L | 14 g/L |
| Tartaric acid | 0.25 g/L | 0.50 g/L | 0.75 g/L | 1.00 g/L |
| Sodium chloride | 0.5 g/L | 2.0 g/L | 3.5 g/L | 5 g/L |
| Caffeine | 0.05 g/L | 0.20 g/L | 0.40 g/L | 0.60 g/L |
| Monosodium L-glutamate | 0.05 g/L | 0.30 g/L | 0.60 g/L | 0.90 g/L |
| Astringency discrimination | ||||
| Tannic acid | 0.50 g/L | 0.75 g/L | 1.00 g/L | 1.25 g/L |
Table A7.
Gradation scale for ranking the tests.
Table A7.
Gradation scale for ranking the tests.
| Points | Result |
|---|---|
| 4 | Four correct |
| 3 | Adjacent switch |
| 2 | Two correct without adjacent switch |
| 1 | One correct |
| 0 | None correct |
Table A8.
Olfactory materials for the odor description test and marking schedule for odor recognition.
Table A8.
Olfactory materials for the odor description test and marking schedule for odor recognition.
| Material | Characteristic Odor 3 Points | 2 Points | 1 Point |
|---|---|---|---|
| Isoamyl acetate | Banana | Tropical fruits | Fruity |
| 2-Phenyl ethanol | Rose | Jasmine | Floral |
| Caramel syrup | Caramel | Vanilla, malt, toasted | Sweet |
| cis-3-hexen-1-ol | Green grass | Green beans | Green vegetable |
| Butyric acid | Rancid butter | Parmesan cheese | Vomit, baby burp |
| Vanillin | Vanilla | Custard, dessert | Sweets, candy |
| Citral | Lemon | Orange | Citrus, fruity |
| Ethyl caproate | Apple | Pear | Fruity |
| Fresh orange juice | Orange | Lemon | Citrus, fruity |
| Acetic acid | Acetic acid | Vinegar | Sour/off wine |
Table A9.
Materials and concentrations for basic taste recognition.
Table A9.
Materials and concentrations for basic taste recognition.
| Taste | Material | Concentration in Water at Room Temperature g/L |
|---|---|---|
| Sweet | Sucrose | 10.0 |
| Salty | Sodium chloride | 2.0 |
| Sour | Citric acid | 0.3 |
| Bitter | Caffeine | 0.3 |
| Umami | Monosodium L-glutamate | 0.6 |
Table A10.
Gradation scale for taste recognition.
Table A10.
Gradation scale for taste recognition.
| Points | Result |
|---|---|
| 6 | All correct |
| 5 | Four correct |
| 4 | Three correct |
| 3 | Two correct |
| 2 | One correct |
| 1 | None correct |
Table A11.
Materials and concentrations for the ranking tests.
Table A11.
Materials and concentrations for the ranking tests.
| Taste | Material | Level 1 | Level 2 | Level 3 | Level 4 |
|---|---|---|---|---|---|
| Sweet | Sucrose | Water | 5 g/L | 10 g/L | 15 g/L |
| Sour | Citric acid | Water | 0.10 g/L | 0.30 g/L | 0.50 g/L |
| Salty | Sodium chloride | Water | 1.0 g/L | 1.5 g/L | 2 g/L |
| Bitter | Caffeine | Water | 0.10 g/L | 0.30 g/L | 0.50 g/L |
| Odor | |||||
| Barrel | Wine spiked with Vanillin and Whiskey lactone mix (50–50% w/v) | Wine | 0.25 mg/L | 0.50 mg/L | 0.75 mg/L |
Table A12.
Olfactory materials and marking schedule for odor recognition.
Table A12.
Olfactory materials and marking schedule for odor recognition.
| Material | Characteristic Odor 3 Points | 2 Points | 1 Point |
|---|---|---|---|
| Citral | Lemon | Orange | Citrus, fruity |
| Ethyl caproate | Apple | Pear | Fruity |
| Fresh orange juice | Orange | Lemon | Citrus, fruity |
| Caramel syrup | Caramel | Vanilla, malt, toasted | Sweet |
| Butyric acid | Rancid butter | Parmesan cheese | Vomit, baby burp |
| Acetic acid | Acetic acid | Vinegar | Sour/off wine |
| cis-3-hexen-1-ol | Green grass | Green beans | Green vegetable |
| TCA | Musty, Moldy | Cork taint | Chlorine |
| Vanillin | Vanilla | Custard, dessert | Sweets, candy |
Table A13.
The substances used and the concentrations corresponding to low, medium, and high intensities for the training and identification of wine defects using aqueous solutions.
Table A13.
The substances used and the concentrations corresponding to low, medium, and high intensities for the training and identification of wine defects using aqueous solutions.
| Attributes | Descriptor Examples | Material | Low Intensity | Medium Intensity | High Intensity |
|---|---|---|---|---|---|
| Sulfur dioxide | Sulfur dioxide | Sulfur dioxide | 0.1 g/L | 0.2 g/L | 0.3 g/L |
| Acetic | Acescent (glue, nail, polish, solvent) | Ethyl acetate | 0.25 mg/L | 0.50 mg/L | 0.75 mg/L |
| Moldy/Earthy | Dusty, musty, damp cellar | Trichloroanisole (TCA) | 5 ng/L | 15 ng/L | 25 ng/L |
| Oxidized | Stale, rancid, overripe apple | Ethanal | 0.1 g/L | 0.2 g/L | 0.3 g/L |
| Animal | Stale, rancid, overripe apple | Mix 4-ethylphenol/4-ethylguajacol | 0.5 mg/L | 1.0 mg/L | 1.5 mg/L |
Table A14.
The substances used and the concentrations for the identification of wine defects and wine characteristics using spiked wine.
Table A14.
The substances used and the concentrations for the identification of wine defects and wine characteristics using spiked wine.
| a/a | Group Characterization | Batch 1 | Batch 2 | Different Sample out of the Three |
|---|---|---|---|---|
| 1 | Fresh wine—Wine with barrel | Fresh wine | Fresh Wine spiked with 500 mg/L Vanillin | Batch 2 |
| 2 | Oxidized wine | Fresh wine | Wine spiked with 0.5 g/L Ethanal | Batch 2 |
| 3 | Different intensity of fruity | Fresh wine | Wine diluted with water (80% v/v) | Batch 2 |
| 4 | Animal defect | Fresh wine | Wine spiked with 700 mg/L 4-ethylphenol and 0.070 mg/L 4-ethylguajacol | Batch 2 |
| 5 | Acetic | Fresh wine | Wine spiked with 1.2 g/L acetic acid | Batch 2 |
| 6 | Different tannins | Fresh red wine | Wine spiked with 1.5 g/L oak tannin | Batch 2 |
| 7 | Sulfur dioxide | Fresh wine | Wine spiked with 200 mg/L potassium disulfite | Batch 2 |
| 8 | TCA | Fresh wine | Wine spiked with 15 ng/L TCA | Batch 2 |
Table A15.
Maximum test scores for the evaluation of training and the selection of assessors.
Table A15.
Maximum test scores for the evaluation of training and the selection of assessors.
| Test No. | Paragraph | Title | Maximum Score Possible |
|---|---|---|---|
| 1 | Section 2.5.5. “Odor Recognition” | Odor recognition | 27 |
| 2 | Section 2.5.5. “Basic Taste Recognition” | Basic taste recognition | 6 |
| 3 | Section 2.5.5. “Ranking Tests” | Ranking of basic taste | 16 |
| 4 | Section 2.5.9. | Ranking of barrel flavor | 4 |
| 5 | Section 2.5.7. | Triangle test—flavor | 48 |
| 6 | Section 2.5.7. | Triangle test—Description | 4 |
| 7 | Section 2.5.8. | Descriptive different tannins | 6 |
Table A16.
Marking schedule for assessor selection.
Table A16.
Marking schedule for assessor selection.
| Test No. | Title | Maximum Score Possible | Recommended Pass Mark | Pass Score |
|---|---|---|---|---|
| 1 + 2 + 3 + 4 | Recognition and ranking tests | 53 | 65% | ≥35/53 |
| 7 + 8 + 9 | Descriptive tests | 10 | 50% | ≥5/10 |
| 7 + 8 | Triangle test—Wine | 48 | 65% | ≥32/48 |
Table A17.
The substances used and the concentrations for training with the continuous scale.
Table A17.
The substances used and the concentrations for training with the continuous scale.
| Concentration in Water at Room Temperature g/L | ||||||
|---|---|---|---|---|---|---|
| Taste | Material | Level 1 | Level 2 | Level 3 | Level 4 | Level 5 |
| Sweet | D(+)-Glucose | 15.6 | 46,9 | 78.1 | 109.3 | 156.3 |
| Sour | Tartaric acid | 4.0 | 5.0 | 6.0 | 7.0 | 8.0 |
| Astringent | Grape tannin | 0.5 | 2.2 | 3.6 | 5.0 | 6.0 |
| Bitter | Caffeine | 0.05 | 0.30 | 0.50 | 0.70 | 1.00 |
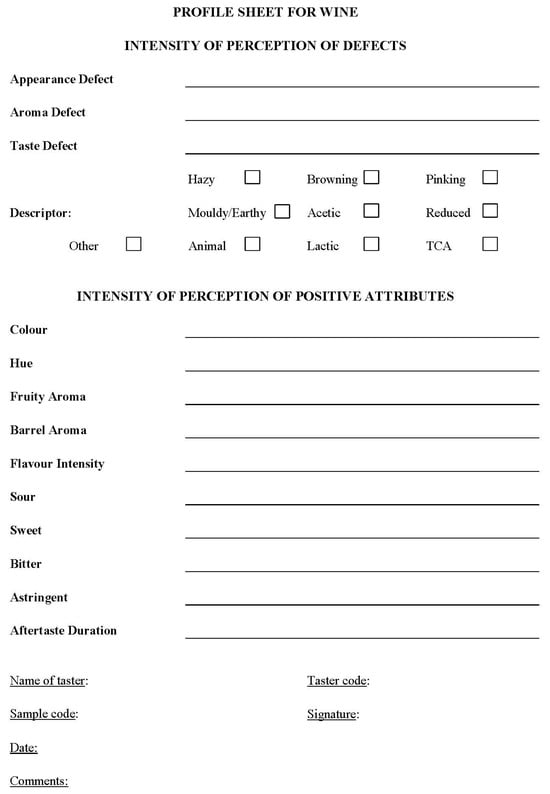
Figure A1.
Profile sheet for wine.
References
- International Organisation of Vine and Wine. State of the World Vitivinicultural Sector in 2023. Available online: https://www.oiv.int/sites/default/files/2024-04/OIV_STATE_OF_THE_WORLD_VINE_AND_WINE_SECTOR_IN_2023.pdf (accessed on 30 April 2024).
- Bruwer, J.; Saliba, A.; Miller, B. Consumer behaviour and sensory preference differences: Implications for wine product marketing. J. Consum. Mark. 2011, 28, 5–18. [Google Scholar] [CrossRef]
- Ristic, R.; Danner, L.; Johnson, T.E.; Meiselman, H.L.; Hoek, A.C.; Jiranek, V.; Bastian, S.E.P. Wine-related aromas for different seasons and occasions: Hedonic and emotional responses of wine consumers from Australia, UK and USA. Food Qual. Prefer. 2018, 71, 250–260. [Google Scholar] [CrossRef]
- Mezei, L.V.; Johnson, T.E.; Goodman, S.; Collins, C.; Bastian, S.E.P. Meeting the demands of climate change: Australian consumer acceptance and sensory profiling of red wines produced from non-traditional red grape varieties. OENO One 2021, 55, 29–46. [Google Scholar] [CrossRef]
- Lattey, K.A.; Bramley, B.R.; Francis, I.L. Consumer acceptability, sensory properties and expert quality judgements of Australian Cabernet Sauvignon and Shiraz wines. Aust. J. Grape Wine Res. 2010, 16, 189–202. [Google Scholar] [CrossRef]
- Alexi, N.; Nanou, E.; Lazo, O.; Guerrero, L.; Grigorakis, K.; Byrne, D.V. Check-All-That-Apply (CATA) with semi-trained assessors: Sensory profiles closer to descriptive analysis or consumer elicited data? Food Qual. Prefer. 2018, 64, 11–20. [Google Scholar] [CrossRef]
- Nanou, E.; Mavridou, E.; Milienos, F.; Papadopoulos, G.; Tempère, S.; Kotseridis, G. Odor Characterization of WhiteWines Produced from Indigenous Greek Grape Varieties Using the Frequency of Attribute Citation Method with Trained Assessors. Foods 2020, 9, 1396. [Google Scholar] [CrossRef] [PubMed]
- Koussissi, E.; Paterson, A.; Paraskevopoulos, Y. Factors influencing sensory quality in red wines of the variety Aghiorghitiko (Vitis vinifera L.) from Nemea. Eur. Food Res. Technol. 2008, 226, 745–753. [Google Scholar] [CrossRef]
- Kallithraka, S.; Arvanitoyannis, I.; Kefalas, P.; El-Zajouli, A.; Soufleros, E.; Psarra, E. Instrumental and sensory analysis of Greek wines; implementation of principal component analysis (PCA) for classification according to geographical origin. Food Chem. 2001, 73, 501–514. [Google Scholar] [CrossRef]
- Basalekou, M.; Kyraleou, M.; Pappas, C.; Tarantilis, P.; Kotseridis, Y.; Kallithraka, S. Proanthocyanidin content as an astringency estimation tool and maturation index in red and white winemaking technology. Food Chem. 2019, 299, 125135. [Google Scholar] [CrossRef]
- Kyraleou, M.; Kallithraka, S.; Chira, K.; Tzanakouli, E.; Ligas, I.; Kotseridis, Y. Di_erentiation of Wines Treated with Wood Chips Based on Their Phenolic Content, Volatile Composition, and Sensory Parameters. J. Food Sci. 2015, 80, C2701–C2710. [Google Scholar] [CrossRef] [PubMed]
- Koussissi, E.; Dourtoglou, V.G.; Ageloussis, G.; Paraskevopoulos, Y.; Dourtoglou, T.; Paterson, A.; Chatzilazarou, A. Influence of toasting of oak chips on red wine maturation from sensory and gas chromatographic headspace analysis. Food Chem. 2009, 114, 1503–1509. [Google Scholar] [CrossRef]
- Kallithraka, S.; Kotseridis, Y.; Kyraleou, M.; Proxenia, N.; Tsakiris, A.; Karapetrou, G.; Stamatina, K.; Yorgos, K.; Maria, K.; Niki, P.; et al. Analytical phenolic composition and sensory assessment of selected rare Greek cultivars after extended bottle ageing. J. Sci. Food Agric. 2015, 95, 1638–1647. [Google Scholar] [CrossRef] [PubMed]
- Koussissi, E.; Paterson, A.; Piggott, J.R. Sensory flavour discrimination of Greek dry red wines. J. Sci. Food Agric. 2003, 83, 797–808. [Google Scholar] [CrossRef]
- Nisiotou, A.; Mallouchos, A.; Tassou, C.; Banilas, G. Indigenous Yeast Interactions in Dual-Starter Fermentations May Improve the Varietal Expression of MoschofileroWine. Front. Microbiol. 2019, 10, 1712. [Google Scholar] [CrossRef] [PubMed]
- Kechagia, D.; Paraskevopoulos, Y.; Symeou, E.; Galiotou-Panayotou, M.; Kotseridis, Y. Influence of Prefermentative Treatments to the Major Volatile Compounds of Assyrtiko Wines. J. Agric. Food Chem. 2008, 56, 4555–4563. [Google Scholar] [CrossRef] [PubMed]
- Siebert, T.; Barker, A.; Pearson, W.; Barter, S.; Lopes, M.; Darriet, P.; Herderich, M.; Francis, L. Volatile Compounds Related to ‘Stone Fruit’ Aroma Attributes in Viognier and Chardonnay Wines. J. Agric. Food Chem. 2018, 66, 2838–2850. [Google Scholar] [CrossRef] [PubMed]
- Gomis-Bellmunt, A.; Claret, A.; Puig-Pujol, A.; Pérez-Elortondo, F.J.; Guerrero, L. Development of a Descriptive Profile and References for the Assessment of Taste and Mouthfeel Descriptors of Protected Designation of Origin Wines. Foods 2022, 11, 2970. [Google Scholar] [CrossRef] [PubMed]
- Brand, J.; Valentin, D.; Kidd, M.; Vivier, M.A.; Næs, T.; Nieuwoudt, H.H. Comparison of pivot profile© to frequency of attribute citation: Analysis of complex products with trained assessors. Food Qual. Prefer. 2020, 84, 103921. [Google Scholar] [CrossRef]
- Campo, E.; Do, B.V.; Ferreira, V.; Valentin, D. Aroma properties of young Spanish monovarietal white wines: A study using sorting task, list of terms and frequency of citation. Aust. J. Grape Wine Res. 2008, 14, 104–115. [Google Scholar] [CrossRef]
- Campo, E.; Ballester, J.; Langlois, J.; Dacremont, C.; Valentin, D. Comparison of conventional descriptive analysis and a citation frequency-based descriptive method for odor profiling: An application to Burgundy Pinot noir wines. Food Qual. Prefer. 2010, 21, 44–55. [Google Scholar] [CrossRef]
- Jaeger, S.R.; Chheang, S.L.; Yin, J.; Bava, C.M.; Giménez, A.; Vidal, L.; Ares, G. Check-all-that-apply (CATA) responses elicited by consumers: Within-assessor reproducibility and stability of sensory product characterizations. Food Qual. Prefer. 2013, 30, 56–67. [Google Scholar] [CrossRef]
- Pearson, W.; Schmidtke, L.; Francis, I.L.; Blackman, J.W. An investigation of the Pivot© Profile sensory analysis method using wine experts: Comparison with descriptive analysis and results from two expert panels. Food Qual. Prefer. 2020, 83, 103858. [Google Scholar] [CrossRef]
- Lawless, H. Descriptive analysis of complex odors: Reality, model or illusion? Food Qual. Prefer. 1999, 10, 325–332. [Google Scholar] [CrossRef]
- ISO 8586:2012; Sensory Analysis—General Guidelines for the Selection, Training and Monitoring of Selected Assessors and Expert Sensory Assessors. International Organization for Standardization: Geneva, Switzerland, 2012.
- ISO 13301:2002; Sensory Analysis—Methodology—General Guidance for Measuring Odour, Flavour and Detection Thresholds by a Three-Alternative Forced Choice (3-AFC) Procedure. International Organization for Standardization: Geneva, Switzerland, 2002.
- ISO 3972:2011; Sensory Analysis—Methodology—Method of Investigating Sensitivity of Taste. International Organization for Standardization: Geneva, Switzerland, 2011.
- ISO 5496:2006; Sensory Analysis—Methodology—Initiation and Training of Assessors in the Detection and Recognition of Odours. International Organization for Standardization: Geneva, Switzerland, 2006.
- ELOT EN ISO 13299:2012; Sensory Analysis—Methodology—General Guidance for Establishing a Sensory Profile. International Organization for Standardization: Geneva, Switzerland, 2012.
- ISO 11132:2012; Sensory Analysis—Methodology—Guidelines for Monitoring the Performance of a Quantitative Sensory Panel. International Organization for Standardization: Geneva, Switzerland, 2012.
- International Organisation of Vine and Wine. Review Document on Sensory Analysis. Available online: https://www.oiv.int/public/medias/3307/review-on-sensory-analysis-of-wine.pdf (accessed on 30 April 2015).
- COI/T.28/Doc. No 15/Rev. 10; Method for the Organoleptic Assessment of Virgin Olive Oil. International Olive Council: Madrid, Spain, 2018.
- COI/T.28/Doc. No 1/Rev. 8; Guidelines for the Accomplishment of Requirements of Standard ISO 17025 of Sensory Testing Laboratories with Particular Reference to Virgin Olive Oil. International Olive Council: Madrid, Spain, 2023.
- COI/T.28/Doc. No 14/Rev. 8; Guide for the Selection, Training and Quality Control of Virgin Olive Oil Tasters—Qualifications of Tasters, Panel Leaders and Trainers. International Olive Council: Madrid, Spain, 2023.
- COI/T.28/Doc. No 17/Rev. 1; Internal Quality Control Guidelines for Sensory Laboratories. International Olive Council: Madrid, Spain, 2023.
- COI/T.28/Doc. No 4/Rev. 1; Sensory Analysis: General Basic. International Olive Council: Madrid, Spain, 2007.
- COI/T.28/Doc. No 22; Method for the Organoleptic Assessment of Extra Virgin Olive Oil Applying to Use a Designation of Origin. International Olive Council: Madrid, Spain, 2005.
- ISO 22935-1:2023; Milk and Milk Products—Sensory Analysis—Part 1: General Guidance for the Recruitment, Selection, Training and Monitoring of Assessors. International Organization for Standardization: Geneva, Switzerland, 2023.
- ISO 22935-2:2023; Milk and Milk Products—Sensory Analysis—Part 2: Methods for Sensory Evaluation. International Organization for Standardization: Geneva, Switzerland, 2023.
- ISO 22935-3:2023; Milk and Milk Products—Sensory Analysis—Part 3: Methods for Evaluation of Compliance with Product Specifications for Sensory Properties by Scoring. International Organization for Standardization: Geneva, Switzerland, 2023.
- ISO 3591:1977; Sensory Analysis—Apparatus—Wine Tasting Glass. International Organization for Standardization: Geneva, Switzerland, 1977.
- ISO 4120:2021; Sensory Analysis—Methodology—Triangle Test. International Organization for Standardization: Geneva, Switzerland, 2021.
- ELOT EN ISO 8589:2012; Sensory Analysis—General Guidance for the Design of Test Rooms. International Organization for Standardization: Geneva, Switzerland, 2012.
- COI/T.28/Doc. No 6/Rev. 1; Guide for the Installation of a Test Room. International Olive Council: Madrid, Spain, 2007.
- Ligas, I.; Goulioti, E.; Tarantilis, P.; Kotseridis, Y. A new simple method for the determination of complex wine aroma compounds using GC-MS/MS—The case of the Greek variety “Agiorgitiko”. AppliedChem 2024, 4, 122–139. [Google Scholar] [CrossRef]
- COI/T.28/Doc. No 5/Rev. 2; Glass for Oil Tasting. International Olive Council: Madrid, Spain, 2020.
- Chatonnet, P.; Dubourdieu, D.; Boidron, J.N.; Pons, M. The Origin of Ethylphenols in Wines. J. Sci. Food Agric. 1992, 60, 165–178. [Google Scholar] [CrossRef]
- Agnolucci, M.; Tirelli, A.; Cocolin, L.; Toffanin, A. Brettanomyces bruxellensis yeasts: Impact on wine and winemaking. World J. Microbiol. Biotechnol. 2017, 33, 180. [Google Scholar] [CrossRef]
- Laing, D.G.; Glemarec, A. Selective attention and the perceptual analysis of odor mixtures. Physiol. Behav. 1992, 52, 1047–1053. [Google Scholar] [CrossRef] [PubMed]
- International Olive Council. The Organoleptic Assessment of Virgin Olive Oil. Available online: https://www.internationaloliveoil.org/the-organoleptic-assessment-of-virgin-olive-oil/ (accessed on 9 January 2020).
Disclaimer/Publisher’s Note: The statements, opinions and data contained in all publications are solely those of the individual author(s) and contributor(s) and not of MDPI and/or the editor(s). MDPI and/or the editor(s) disclaim responsibility for any injury to people or property resulting from any ideas, methods, instructions or products referred to in the content. |
© 2024 by the authors. Licensee MDPI, Basel, Switzerland. This article is an open access article distributed under the terms and conditions of the Creative Commons Attribution (CC BY) license (https://creativecommons.org/licenses/by/4.0/).