Review

Application of Life Cycle Assessment in Beer Production: Systematic Review

Department of Management, Sapienza University of Rome, Via del Castro Laurenziano 9, 00161 Rome, Italy
*
Authors to whom correspondence should be addressed.
Beverages 2024, 10(3), 86; https://doi.org/10.3390/beverages10030086
Submission received: 2 August 2024 / Revised: 31 August 2024 / Accepted: 5 September 2024 / Published: 10 September 2024

Abstract

:
The production of beer, a beverage of global cultural and industrial importance, has a significant impact on the environment due to the use of natural resources and the emissions generated during the various stages of the production process. Therefore, this article examines the sustainability of beer production through a review of literature articles that have used Life Cycle Assessment (LCA) to assess its environmental impacts. A systematic literature review was conducted by selecting peer-reviewed articles published between 2001 and July 2024 using databases such as Scopus and Google Scholar. The search included studies analyzing different stages of the beer life cycle, from raw material production to packaging and distribution, using specific keywords related to LCA and brewing. The results showed that energy use and packaging are the two critical aspects identified in the review, which represent a significant part of the environmental footprint. However, it is important to note that the available studies on the subject are few and heterogeneous and they use different methodologies, impact categories, and functional units, which complicates the comparison and synthesis of results, limiting the ability to draw definitive conclusions. Recommendations were made to improve sustainability, including the adoption of more efficient technologies, the use of recycled materials for packaging, and the implementation of sustainable agricultural practices. These strategies could aim to significantly reduce the overall environmental impact of beer production.

1. Introduction

Beer is a key product both industrially and culturally at the global level. It is widespread in different regions of the planet, and its impact on the international economy is significant. In 2022, global beer production increased by 1.3% year-on-year, reaching 1.89 billion hectoliters. The main beer-producing countries, including China, the United States, Brazil, Mexico, and Germany, contribute 49% of global production [1]. The consumption of this beverage has become so popular that it is the fifth most consumed beverage in the world, preceded only by tea, carbonated drinks, milk, and coffee [2]; among alcoholic beverages, it is the most consumed and often established in the cultural roots of many nations [3]. In an increasingly globalized world, consumers today are accustomed to consuming mainly standardized and industrialized products that can be commonly purchased in bars or supermarkets. Despite this, there has always been interest in craft beers in several countries. According to the Brewer Association of the United States, a craft brewery is defined as small, independent, and traditional when it does not produce more than 700 million liters of beer per year, no more than 25% of the company is owned by an industrial brewery, and the ingredients used must be linked to the history of the brewing processes [4]. Beer is composed of four main ingredients: water, fermented cereals, especially barley and corn, hops, and yeast. In addition, to customize the characteristics of the beer, other types of ingredients can be added (e.g., fruit, herbs, honey, etc.), which provide particular aromas and flavors [5]. Producing beer is a complex process that includes several phases. The brewing process begins with malting, followed by the formation of the wort, which is then boiled with hops and left to ferment to produce alcohol and develop an aroma. Finally, the fermented wort is filtered, packaged, and distributed to consumers. Depending on the style of beer produced, different ingredients are used, but the four most common cereals are barley, wheat, oats, and rye [6,7]. Given the complexity of the stages involved in the production and consumption of beer, its production process can have a significant impact on the environment. This involves the use of natural resources and the generation of emissions at various stages [7,8,9]. Sustainability assessment is, therefore, an increasingly important issue in a global context, which requires industrial activities to reduce their environmental impact. Life Cycle Assessment (LCA) is essential to assess the environmental impact of a product or process—from raw material extraction to disposal (cradle to grave) [10,11,12]. Over time, LCA has undergone significant methodological improvements, including an expansion of the impact categories to be considered and a greater complexity in the methods used. Furthermore, the concept has evolved to include social and economic aspects (Social Life Cycle Assessment and Life Cycle Costing), becoming a tool oriented to sustainable development known as Life Cycle Sustainability Assessment [13,14,15]. Therefore, this study aims to conduct a review of the scientific literature on the sustainability of brewing to provide a detailed overview of LCA methods applied to brewing, including setting goals and objectives, life cycle inventory, impact assessment, and interpretation of results. In addition, the study aims to highlight hotspots in the brewing process and highlight possible strategies that can enable a reduction in the environmental impact of the entire production process. It also aims to recommend improvements for the sustainability of the brewing industry based on the results of the reviewed studies.

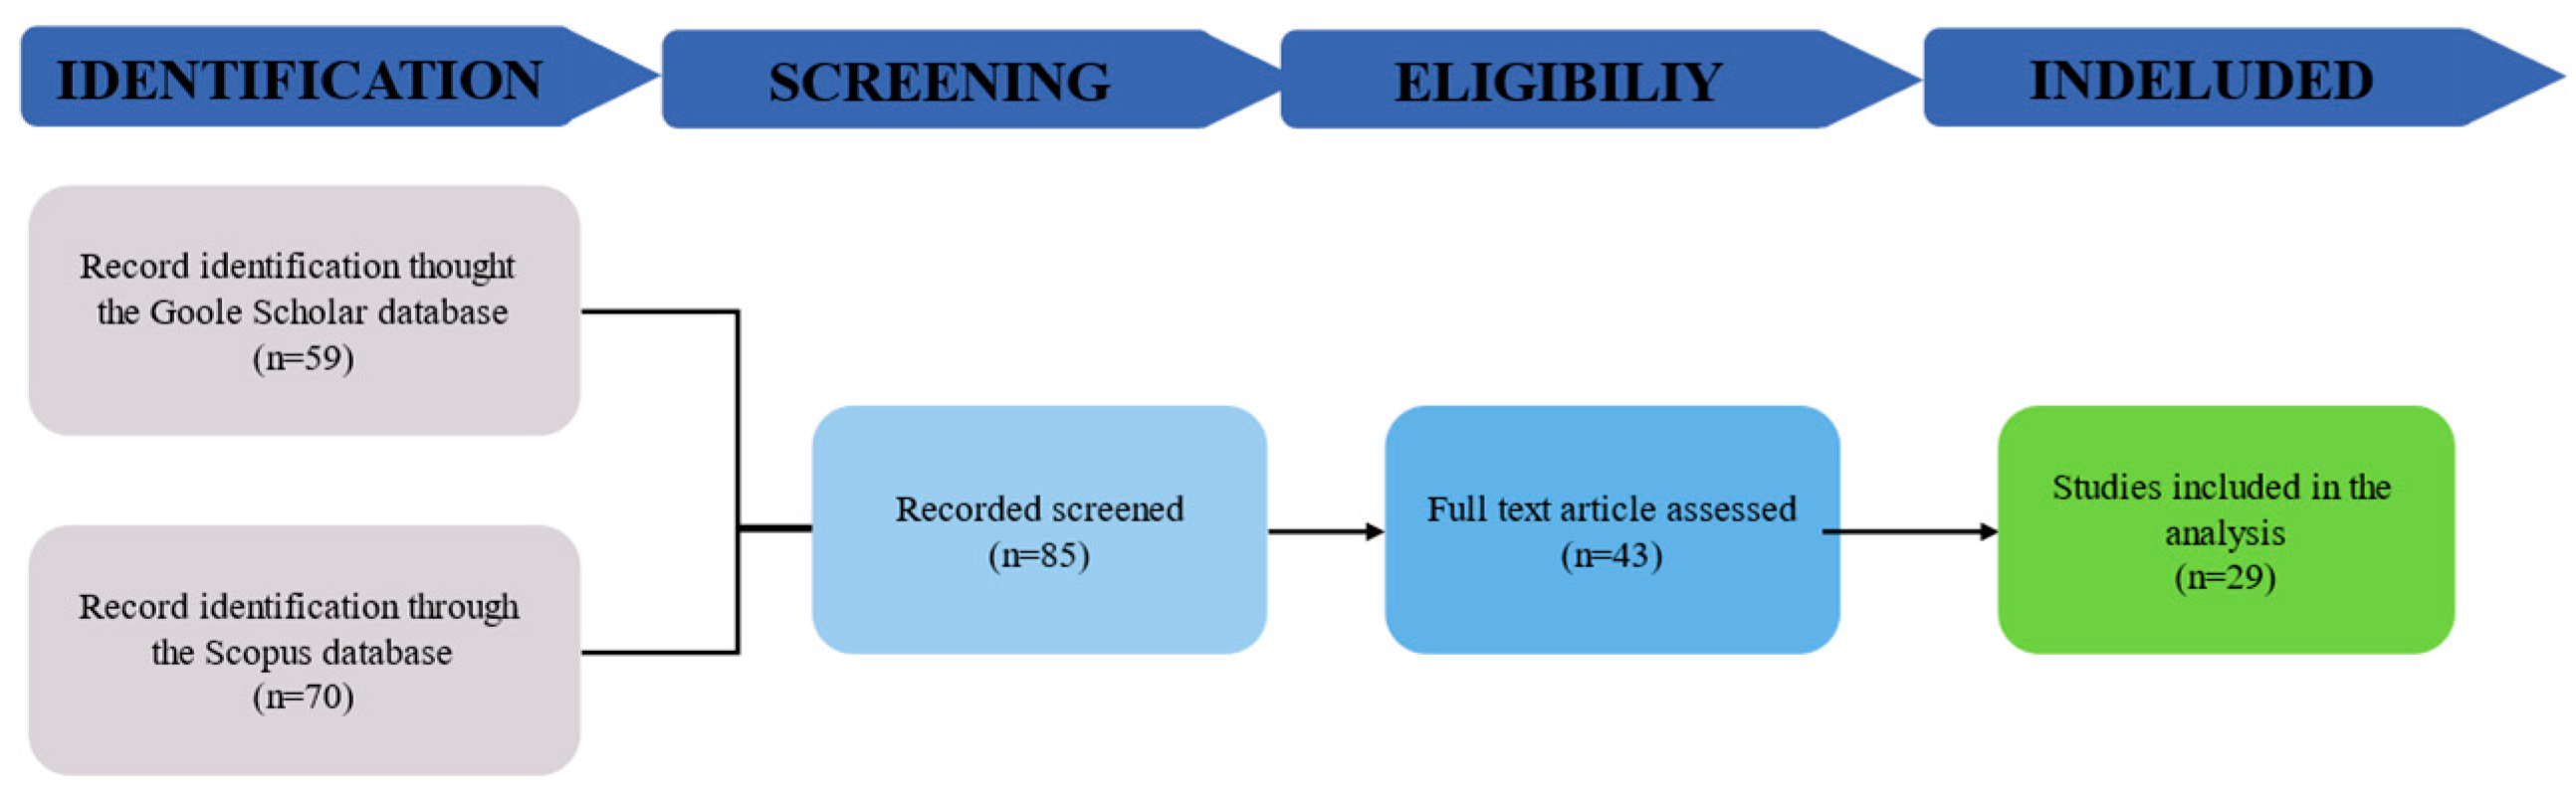
2. Literature Review Methodologies

The methodology of the literature review is important to ensure that the research is comprehensive and accurate. In this research, we took a systematic approach to collect and analyze relevant studies on the sustainability of brewing that used the Life Cycle Assessment. This approach allowed us to identify and critically evaluate studies covering different stages of the beer life cycle, from extraction of raw materials to disposal of the finished product. In this article, the literature review was conducted following a line of research that already sees additional literature review studies concerning the application of LCA in the agri-food sector. For example, Wang and Dong (2024) studied the application of LCA in the cocoa sector [16]. On the other hand, Ferrara and De Feo (2018) [17] reviewed literature articles about LCA in the wine sector. Zingale et al. (2022) [18] then evaluated authors who applied LCA in the wheat sector, as did Vinci et al. (2023) [19], who did so in the rice sector. This section details the criteria for selecting the studies, the data sources used, and the analysis methods adopted to synthesize the available evidence. Figure 1 shows in detail the LCA studies selection following Anees et al. (2023) [20] indications.
The review only considered LCA studies, including those on the brewing process. This included both the production phase of raw materials and packaging such as bottles, cans, and kegs. Only studies that assessed at least one stage of the brewing process were considered. Articles that only dealt with the LCA of beer packaging were not considered in the review. Articles published from 2001 to July 2024 were considered. In addition, only articles from peer-reviewed journals were included in the review, as the aim of the review was to focus on studies that had undergone an independent review. Books and book chapters were excluded as it could not be determined whether they had been subject to the same level of peer review. However, this represents a limitation of the review as relevant LCA studies may have been overlooked. Review articles and methodological articles were also excluded as the focus was on LCA studies. The literature search was conducted using Scopus and Google Scholar. The search included the following keywords in combination with the word “Beer”: LCA, life cycle assessment, and carbon footprint (“Beer AND LCA”, “Beer AND Life Cycle Assessment”, and “Beer AND Carbon Footprint”). From the literature search, only 70 potential articles were retrieved. After screening based on topic and publication text, 36 studies remained. The studies were mainly from Western Europe (Spain, Italy, Greece, Sweden, the UK, Finland) and the USA.

3. LCA Methodology

Life Cycle Assessment is a methodology comprising four main steps: (i) Goal and scope definition; (ii) Life cycle inventory (LCI); (iii) Life cycle impact assessment (LCIA); (iv) Interpretation. This methodology is based on the ISO 14040 standards, first released in 1997 and updated in 2006 [11,13,15,21]. The initial phase, that of defining the objectives and scope, focuses on the reasons for conducting the study, the target audience, and the intended application. It also includes a description of the boundaries of the study system and the definition of the functional unit, which is a quantitative measure of the function provided by the product or service. In the inventory analysis phase, a list of the inputs and outputs of a product is compiled about the functional unit [18,19]. Then, in the life cycle impact assessment, the calculated flows are translated into environmental impacts using emission factors [22]. Finally, in the interpretation phase, the results are evaluated against objectives and scope to derive conclusions and recommendations [23,24]. Its fields of application are numerous; the three main areas in which this methodology is applied are highlighted below [25,26,27]:
  • Food industry: LCA is used to assess the environmental impact of food products, from production to distribution and consumption. For example, in the brewing industry, LCA can identify the production steps that contribute most to greenhouse gas emissions and suggest ways to reduce these impacts.
  • Energy Sector: LCA is used to compare different energy sources, such as fossil fuels and renewable energies, providing a comprehensive assessment of their environmental performance.
  • Construction: In the construction industry, LCA helps assess the environmental impact of building materials and construction processes, promoting the use of sustainable materials and environmentally friendly construction techniques.
LCA is a robust methodology for assessing the environmental impacts of products and processes comprehensively and holistically. By providing an overview of environmental performance across the entire life cycle of a product, LCA is an essential tool for promoting sustainability and defining effective environmental policies. With the continuous development of new databases and the harmonization of methods, LCA plays a crucial role in supporting sustainability-based decisions in various industries [13,28].

4. Results and Discussion

Different methodological aspects of LCA applied to beer production have been identified in the literature, which will be discussed and dealt with according to the four development phases of an LCA study: Goal and scope (goal, functional unit, and system boundaries), life cycle inventory (LCI), life cycle impact assessment (LCIA), and Interpretation [13,29]. Table 1 shows the main methodological aspects and parameters that mainly influence the application of LCA and the environmental results of the studies, representative of the main impact categories examined.

4.1. Goal and Scope

The objective and scope-setting phase of an LCA involves the design of the study according to the set objectives. These objectives and scope establish a series of methodological decisions, which influence the assumptions and intensity of work in the subsequent phases. According to ISO 14000, the objectives and scope of LCA studies must be clearly defined at the outset so that they are consistent with the intended application of the study [13,30,31]. In the studies examined, the objectives were generally well-defined, and although they focused on assessing the environmental performance of the entire beer production cycle, they also focused on packaging, which shows the versatility of LCA as an analysis tool (Table 1). Often, these studies were aimed at identifying critical points and/or comparing alternative methods—in particular about the use of fertilizers and pesticides during cultivation, electricity use, and packaging. In addition, all studies aimed to identify opportunities to improve the environmental performance of beer production [32,33,34].
Table 1. Representation of the principle LCA study on beer production (N/A, not applicable; N/S, not specified; white space is non-present in the study).
StudyPublication YearsGeographical AreaGoal and ScopeFunctional UnitSystem BoundariesLcia MethodImpact Categories
NameUnitResult
[35]2010N/AEvaluate the environmental impact of manufacturing and disposing of the most common packaging options for three beverage products: juice, beer, and water.packaging required to contain 1 L of beverageGate to Grave-GWPg CO2 eq826
Evaluate the contribution of packaging to the environmental profile of a product’s life cycle. This includes an analysis of the impact of beverage production, transport (local), packaging production, and packaging disposal.CEDMj19.06
[36]2018NAEvaluate the
potentialities of a series of mitigation opportunities in order to
minimize the cradle-to-grave carbon footprint of 1 hL of beer produced
in three large-(LS), medium-(MS) and small-(SS) sized
breweries and packed in 66-cL glass or PET bottles
1 hL of beer produced in three large-(LS), medium-(MS), and small-(SS) sized breweries and packed in 66-cL glass or polyethylene terephthalate (PET) bottlesGate to graveCarbon Footprint (IPCC 2007)GWPKg CO2 eq127 to 192
[37]2022N/AEvaluate the influence of different packaging and distribution options on the environmental footprint of beer produced by seven small-scale breweries, often referred to as “microbreweries”1 L of packaged beer at the point of retail to consumerCradle to graveEuropean Product Environmental Footprint (PEF)GWPg CO2 eq727 to 1336
APMol H+ eq0.00952 to 0.0103
FRDPMj13.55 to 19.66
[38]2018Western EuropeAssess the carbon footprint of
a lager beer made of malted barley and hop pellets and produced from
industrial and craft breweries
1 hL of lager beer packaged in 66-cL glass bottlesGate to graveCarbon Footprint (IPCC 2007)GWPKg CO2 eq90
[32]2005GreeceIdentify key
issues associated with the life cycle of beer production
The functional unit is one bottle of beer (combined
weight of beer and glass 1.066 kg)
Cradle to graveCarbon Footprint (IPCC 2007)GWPKg CO2 eq392.46
N/SODkg CFC11-eq0.00234
APkg SO2-eq0.00015
[39]2016ItalyDevelop an LCA model to assess
the carbon footprint of a pale lager beer, which is made of malted barley,
maize grits, and hop pellets, produced by the Italian brewery
Birra Peroni Srl (Rome, Italy), and consumed in Italy, as well as to
identify its life-cycle hot spots.
1 hL of
lager beer packaged in different packaging formats and selling
units
Cradle to gateEcoindicator 99GWPKg CO2 eq68.91
[33]2017N/ADevelopment of the basket of products method that responds to
the need to analyze and monitor European consumption patterns
and their global influence to shift to more resource-efficient
consumption practices that have a lower impact on the
environment
average food consumption per person in the EU in terms of
food categories (including the food losses at each stage)
Cradle to gateILCD 2011CCKg CO2 eq80
ODkg CFC-
11eq
0.000015
APmol Hþ
eq
0.88
POFkg
NMVOCeq
0.32
[40]2018Swedenestimated
the GHG emissions related to alcoholic beverages that
are representative of Swedish consumption
kg of carbon dioxide equivalents (CO2e) per liter of specific alcoholic beverageCradle to gateIPCC 2007GWPkg
NMVOCeq
0.73
N/SAPkg SO2-eqN/S
POFKg NMOCN/S
[2]2021N/Aevaluate the environmental impact of craft beer production, in particular at a small scale in microbreweriesproduction of 1 L of beer, packaged according to individual brewery specifications and delivered to the retailerCradle to grave (end-of-life)European product Environmental Footprint (PEF)GWPg CO2 eq760 to 1900
FRDPMj12 to 30
APg Sb eq0.0024 to 0.0067
ACmolc H + eq0.0067 to 0.013
ODg CFC 11 eq0.00013 to 0.00037
[41]2022N/AEvaluate the environmental impact of barley beer with respect to traditional beerone 330 mL filled beer bottle at
the brewery in Edinburgh
Cradle to gateEuropean product environmental footprint (PEF)CCg CO2 eqN/S
MEkg P eq
ACmol H+ eq
FEmol H+ eq
LUpt
[42]2010SwedenEvaluate the GWP of beverages about nutritional valueN/SN/S GWPg CO2 eq per 100 g101
[10]2001N/Aassess the
potential environmental effects of the different stages of the
beer life cycle and to also obtain new and updated information
for establishing the new facility.
505 multi-packs of bottled
beer (10 hi of beer) in the shop
Cradle to gateEcoindicator 95GWPg CO2 eqN/S
[43]2001Portugalassess the environmental impacts
through the life cycle of returnable and non-returnable glass
beer bottles comparing different reuse percentages
is “the delivery of 330 liters of beer to
the consumer” which corresponds to 1000 bottles
Cradle to gateN/SGWPKg CO2 eqN/S
ODg CFC 11 eq
POFKg NVMOC
APKg SO2 eq
[44]2023South VietnamEstablishing criteria for advancing circular economy practices in the beer industry1 cubic meter (m3) of beer producedGate to graveN/SCCTon CO2 eq57.45
APKg SO2 eqN/S
FEKg P eq
MEKg n eq
LUm2
WSm3 eq
[45]2019ItalyEstablish the carbon footprint of beer production1 hL of malt beerCradle to grave GHGkg CO2e hL−1127.2
[46]2007Norwayanalyze the environmental and resource efficiency and effectiveness of the beverage sector in Norwaymount of beverage products consumed per capita in Norway in the year 2000Cradle to graveN/SGWPKg CO2 eq per L22
CEDMJ per L8.0
[27]2022 packaging of 1 l of kegged beer in a 30-L kegCradle to graveRecipe Midpoint (H)GWPKg CO2 eq per L0.15 to 0.35
WDm3N/S
FDkg oil-eq
MDkg Fe-eq
[47]2023USAanalyze the environmental profile of
the brewing process of craft beer and compare the environmental performance of ale and lager
brewing in a microbrewing facility
1 bbl of beer brewed.Gate to gateRecipe Midpoint (E)GWPKg CO2 eq per L104 to 126
APkg SO2 eq0.647 to 0.739
FWEPkg P eq0.113 to 0.125
MEPkg N eq0.092 to 0.061
WUm350.2 to 53.3
GWP, Global warming potential; CED, Cumulative energy demand; FRDP, fossil resource depletion potential; AP, Acidification potential; MEP, Marine eutrophication potential; OD, Ozone depletion; POF, photochemical ozone formation; AC, Acidification, CC, climate change; LU, Land Use; FE, Freshwater eutrophication; ME, marine eutrophication, WS, Water Scarcity, GHG, greenhouse gas; WD, water depletion; FD, fossil depletion; MD, metal depletion; FWEP, freshwater eutrophication potential; WU, Water Use.

4.1.1. System Boundaries

System boundaries delimit the system studied through the inclusion and exclusion of unit processes. Defining the boundaries is crucial to delimit the scope of the study and to compare different LCAs in time or space. The decision on which processes to include within the system boundaries should be based on clearly defined and well-justified exclusion criteria, which include criteria such as mass, energy, or environmental importance [48]. However, these criteria are not always applied [49]. The studies examined presented a variety of definitions of system boundaries depending on the purpose of the study. In general terms, the following life cycle phases are recognized in an LCA study of beer (Figure 2) [10,27,32,36,45,50]:
-
Raw materials and auxiliaries: barley and hop cultivation, barley malt production, production of sodium hydroxide, sulphuric acid, carbon dioxide, and other auxiliary materials.
-
Beer Production: electricity and materials for beer production, including preparation and milling of malt, fermentation, carbonation, storage, filtration, and bottling.
-
Packaging: materials and energy to produce glass bottles (with metal caps and multi-packaging cardboard boxes in which bottled beer is typically sold), aluminum, and steel cans.
-
Retail and consumption: refrigerated beer storage at the retailer (only as part of the sensitivity analysis) and post-consumer waste generated after consumption.
However, not all studies include all six of these phases but only focus on some of them [10,35,39,41,43,44,50]. Most of the studies considered the raw material cultivation phase [2,23,28,35,39,42,47,48]. However, some studies only focused on the industrial brewing process [47]. Furthermore, the packaging or waste disposal phase or the transport phase of the product and its consumption are frequently considered [2,27,32,35,36,37,38,44,51].

4.1.2. Functional Unit

The functional unit (FU) is the reference unit that quantifies the performance of a product system and defines a reference flow, i.e., it measures the outputs of the system required to fulfill the function defined by the FU and is used as a tool for comparing systems [48]. It represents the function provided by the system studied and can be used to compare it with alternative systems offering the same function. The functional unit often only measures the primary function of the product system under investigation [44,45]. The functional units chosen were heterogeneous, varying widely among the investigated studies (Table 1). Most of them favored FU, the unit intended for the consumer, i.e., 1 L beer [2,37]. Occasionally, packaging material was included in the functional unit [36,38]. However, 1 hL of beer [38,39], the per capita consumption of beer [33], the consumption of 1kWh of electricity [52], 1 barrel/keg of beer [47], and the packaging required to contain 1 L of beer were also considered as functional units [2,10,35,37,47].

4.2. Life Cycle Inventory

Life cycle inventories (LCIs) are compiled by collecting data on the environmental inputs and outputs belonging to each unitary process within the system boundaries. These data must quantitatively and qualitatively describe material and energy inputs and outputs as well as emissions to air, soil, and water [48]. LCI data are compiled and often reported about the reference flow (e.g., 1 L of beer bottled in 66-cL glass bottles). After the inventory is compiled, when necessary, the allocation of resources and emissions between co-products (allocation) is carried out [47,49,53].
Table 2 highlights the main inputs and outputs considered in the literature for the inventory analysis. Most studies use both primary and secondary data, with a significant number of primary data (data collected directly from breweries or through experiments). This indicates a high degree of accuracy in the evaluations. The studies examined presented inventory data collected directly from small, medium, and large breweries, suppliers of equipment and supplies for barley growing and processing operations (primary data), government statistics, reports, databases such as Ecoinvent, Agri footprint, ILCD, and previous publications (secondary data) [39,54]. The most commonly used database for beer LCA studies is Ecoinvent, which includes numerous unit processes, including energy (electricity, fuels), transport, building materials, biomass, wood and fiber, metals, chemicals, electronics, mechanical engineering, packaging, waste treatment and agricultural products [33,55]. Primary data collection was mainly carried out through interviews or questionnaires sent to companies. Ecoinvent was used when other primary or system-specific data were unavailable and to obtain background processes (e.g., supply of fossil fuels, fertilizers, pesticides, and chemicals) [39,43]. The number of inventory items included (Table 2) varied between the studies examined, as did the detail of their chemical composition (e.g., coolant used, type of diesel examined). The levels of detail in the data collected for LCIs appear to be highly heterogeneous and often briefly documented. However, some studies report detailed and well-contextualized data collected for LCA [39,50,56].
Table 2. Life cycle inventory of beer’s LCA; X = considered, blank space = excluded.
INVENTORY ITEMSTUDY
[35][36][2][38][32][39][33][40][57][37][41][42][58][10][43][44][45][55][46][32][1][47]
DATA ACQUISITION N/A
Primaryxxx xx x x xxxxxx xxx
Secondaryxxxx xxx xxx xxxx
CROP CULTIVATION N/A x N/AN/A N/A
Barley x xx x xx
Wheat x
Faba x
Yeast xx
Hop xx xx
Fertilizer x x x x
Lime x x
Manure
Pesticide x x x x
BREWY PROCESS N/A N/SN/S N/A N/AN/SN/S
Malt xxxxx xx x
Corn Grain x
Hop Pellet xxxx x
Peracetic Acid x x
Filtration Eart x
Caustic Soda xx x
PVPP x x
Refrigerant Liquids xxx x
PRIMARY AND SECONDARY PACKAGING N/A xx N/A N/A N/A
Aluminumx xx x
PET xx x xx
Glassxx xx xxx xx
HDPE x x
Pallet (wood) x
Cardboard x xx
ENERGY SOURCESx N/SN/S N/SN/SN/SN/S
Thermal xxx x
Electricity xxx xx xx x x
Diseal xxx x xxx
Natural Gases x x x x
WATERxxxx xx x xx x
BY PRODUCTS
Surplus Yeast x x x
Spent Grain x x x x
Westwater x x xx
N/A = not applicable, N/S = not explain the inventory item considered.

4.3. Life Cycle Impact Assessment

The life cycle impact assessment (LCIA) step, which is optional according to the ISO standard, consists of classifying and assigning characterization factors to the life cycle inventory (LCI) results for the selected impact categories (ISO, 2006b). In this way, the different LCI results can be more easily expressed as a reduced number of environmental indicators [21,49,59,60,61,62]. LCIA methods are usually applied using dedicated LCA software. The studies examined mainly used SimaPro, the most widely used LCA software application, Open-LCA, and GaBI. In the studies reviewed, the main methods used to calculate several impact categories simultaneously were ILCD 2011 [2,33,57], Ecoindicator 99 [10,39], and Environmental Footprint (PEF) [2,41,43] mainly in the midpoint, only one study conducted life cycle assessment using Ecoindicator 99 endpoints [10]. The diversity of the methods used in LCA studies shows the variety of methodological approaches for assessing impacts. In addition, some studies used single-issue methods: Cumulative energy demand (CED) [35], carbon footprint (IPCC 2007) [2,10,35,36,37,38,39,41,43,44,45,47,63,64], and water footprint [44]. The application of LCA methods allows the outputs of a process to be calculated and grouped into impact categories. The latter represents a specific area of environmental concern in which the environmental effects or consequences of a product, process, or service throughout its life cycle are measured and evaluated. Impact categories organize and classify the data collected, allowing the various environmental effects to be quantified systematically and comparably. In an LCA study, the impact categories selected reflect the environmental issues associated with the product system under consideration, as well as the objectives and scope of the study (ISO, 2006b). In the life cycle impact assessment (LCIA) phase, the inventory fluxes (e.g., methane or nitrogen oxides) are converted using characterization factors and grouped into LCIA categories (e.g., Global Warming Potential, Eutrophication Potential, Acidification Potential) using rule sets [44,45,59]. Table 3 shows the main impact categories considered in literature studies. The calculation of Global warming potential (GWP), also called carbon footprint (CF), has been considered in almost all studies. The CF is one of the most frequently evaluated impact categories as it highlights the importance of reducing CO2 emissions in the beer production cycle. Water Footprint (WF) is considered in a few studies but is crucial given the high water consumption in beer production [27,44,47]. Although not directly considering WF, they focused on specific impact categories concerning water (Marine eutrophication, Freshwater eutrophication, water scarcity, WRD, Water resource depletion) [27]. Another category used is CED (Cumulative Energy Demand) as it bridges the focus on total life cycle energy consumption. There are several other categories of environmental impact on which studies have focused, such as acidification (AP), eutrophication (EP), photochemical ozone formation (POF), and human toxicity (HuT). The variety of categories demonstrates a holistic assessment of environmental impacts [10,47,50].
Table 3. Principle impact categories used in published beer LCA studies. X = considered, blank space = excluded.
STUDIESIMPACT CATEGORIESCARBON FOOTPRINTWATER FOOTPRINTCED
FRDPFEPWSARDCCODHuTIRPMPOFAPTEFEMEFEcTLURDWRDSW
[35] x x
[36] x
[2]xx xxx x xxx x
[38] x x
[32] xx x x xx
[39] x
[33] xxxxxxxxxxxxxx
[40] x
[57] xxxxxxxxxxxxxx
[37] xxxxxxxxxxxxxx
[41] xx x x x x
[42] x
[58] x xx
[10] x x x
[43] xx x x xx
[44] xxx
[45] x
[55]
[46] x x
[60] x xx xxxxxx x
CC, Climate Change; FRDP: fossil resource depletion potential; AP, Acidification potential; FEP, freshwater eutrophication potential; IR, Ionizing radiation; ME, Marine eutrophication, OD, Ozone deplation; POF, photochemical ozone formation potential; TE, Terrestrial eutrophication; ARD, abiotic resource depletion potential; HuT, Human toxicity; PM, Particulate matter; IR, Ionizing radiation; FEcT, Feshwater ecotoxicity; LU, Land Use; WRD, Water resource depletion; Resource Depletion; SW, Solid Waste.

4.4. Interpretation

The results interpretation phase allows for robust conclusions and recommendations on which, for example, to base a communication strategy and an eco-design process [13,48,65]. The main elements of the interpretation of results are [66]:
-
identification of hot spots (materials/processes that contribute most to overall impacts are identified),
-
assessments of the completeness and robustness of the model (such as sensitivity and uncertainty analysis),
-
definition of the study’s conclusions, including considering the limitations present.
The results interpretation phase allows the results to be clearly and transparently communicated about environmental issues related to products and services to plan improvement actions.
The reviewed beer LCA studies considered beer production through different methodological approaches, so it is not easy to compare the reviewed studies with each other; however, studies with similar interpretations of results were considered and compared [14].
The main hot spots of the brewing process that have been identified in the reviewed studies are packaging [32,35,36,39,50], raw materials production, in particular barley cultivation and maturing, and later transport and waste management [50].
Several studies have reported that packaging accounts for approximately 85–95% of the total impacts of the beer production cycle [32]. Cimini et al. (2018), who examined the entire beer production process (cradle to grave) in their study, attributed about 34 kg CO2 eq per 1 l L of beer bottled in 66 cL glass bottles to packaging [45,50].
The main impact of this input is mainly related to the production phase of primary and secondary packaging. The type of packaging greatly influences the environmental impact of the entire brewing process. Glass bottles, especially non-returnable bottles, have the highest carbon footprint (0.67 kg CO2 eq per liter of beer), followed by aluminum cans (0.69 kg CO2 eq per liter of beer), and 30-L steel kegs (0.25 kg CO2 eq per liter of beer) [50,67]. Furthermore, Cimini et al. (2019) pointed out that the packaging format significantly affects the carbon footprint of beer. The use of larger glass bottles (66 cL) can reduce CF by approximately 15% compared to 33 cL bottles. Returnable glass bottles and kegs show significantly lower environmental impacts than disposable glass bottles and aluminum cans [45]. The study by Cimini et al. (2018) also looked at the possibility of recycling packaging, especially glass bottles and aluminum cans; recycling results in a significant reduction of CF by about 20–30% for glass packaging and 95% for aluminum packaging [39,41,50]. In addition to the carbon footprint, packaging has a significant impact on most impact categories, especially on acidification (AP), with a contribution of about 68% of the total load, mainly due to the production of sulfur dioxide in the manufacture of glass packaging, which also leads to higher temperatures and consequently higher energy consumption [54].
Another process step that is considered a hot spot is barley cultivation. Several studies have reported that the cultivation of barley has a significant impact on the environmental footprint of the product due to the significant emissions associated with agricultural processes and cultivation techniques. Barley cultivation contributes to approximately 8–13% of greenhouse gas (GHG) emissions, 27–32% of soil eutrophication, 12–18% of acidification, 39–48% of marine eutrophication and 34–66% of land use. This is mainly due to the use of nitrogen fertilizers, tillage techniques, and the use of agricultural machinery [1,41]. This is especially so for nitrogen fertilizers, which release nitrous oxide (N2O), a potent greenhouse gas. Furthermore, the irrigation of barley can require large amounts of water, especially in arid regions. This contributes to the consumption of water resources, affecting significantly all impact categories related to water consumption (marine eutrophication, water scarcity, freshwater eutrophication) [39].
Another aspect to consider is agricultural practices, which in the case of barley are often intensive and can lead to soil degradation, including loss of organic matter, erosion, and soil compaction. This reduces the capacity of the soil to support crop growth and can lead to desertification. Mattila et al. (2012) indicated that barley production and malting were associated with 0.051 kg CO2 equivalent per 0.33 L of beer, underlining the importance of barley cultivation as an environmental hotspot in beer production [1]. However, the application of crop rotation in the cultivation of barley for brewing can have significant impacts on reducing environmental impacts, although the benefits may vary depending on the specific impact categories and products considered. Mattila et al. (2012) indicated that crop rotation of barley soil could significantly reduce the use of chemical fertilizers and improve biodiversity; this resulted in a reduction of approximately 200% in some impact categories compared to the exclusive use of soil for barley cultivation [1,68].
About brewing, brewery operations (mashing, boiling, fermentation, malting, filtration) contribute between 2% and 28% of the total life-cycle greenhouse gas emissions of beer, the main driver of emissions in this phase being energy use [39,69]. Therefore, improvements in the energy efficiency of breweries can lead to significant reductions in carbon footprint and other impact categories [60]. For example, better isolation and heat recovery can reduce energy demand by 20% [39].
Transport, including transport of raw materials (such as barley and hops) and finished products, contributes significantly, about 10%, to CO2 and other greenhouse gas emissions (20 kg CO2 eq) [35,50]. These impacts vary depending on the distance traveled and the type of vehicle used. Furthermore, the use of fossil fuels for transport is a significant source of environmental impact, contributing to the depletion of natural resources and air pollution. Furthermore, transport by heavy vehicles (trucks, ships, planes, etc.) can cause wear and tear on infrastructure and require more frequent maintenance and repairs, with additional environmental impacts associated with the construction and maintenance of infrastructure. Another aspect related to beer transport to be considered is the geographical area in which the LCA study is carried out; studies conducted with the analysis of transport in urban areas with high population density may lead to an increase in local emissions and a lowering of the quality of the environment [2,10,35,44].
Another aspect that few studies have considered is the impact of the retail and consumption phase. In fact, in these final steps of the beer production process, two aspects have the greatest impact, and these are the transport and refrigeration of the beverage, which is then bought by consumers. As far as transport is concerned, the considerations are like those described above [47]. Whereas, regarding sales, distribution, and consumption, it has been shown that they mainly affect the consumption of electricity due to the lighting and refrigeration of the beverage. Furthermore, impacts related to waste management and disposal must be considered. Ineffective waste management can lead to pollution and increased landfill volumes [37,46]. The recycling rate of post-consumer packaging is crucial in determining the environmental impact. In fact, the higher the recycling rate, the lower the overall impact on recycled packaging [27,35].

Sensitivity and Uncertainty Analysis

To better understand the results obtained with LCIA, two types of investigations can be conducted: sensitivity and uncertainty analysis. Sensitivity analysis is a technique used to determine how changes in a model’s input parameters affect the model’s output. It allows us to identify which variables have the greatest impact on the results. This analysis aims to identify the parameters (inputs) that most influence the result, understand the behavior of the studied model in response to changes in the inputs, and support decision-making choices to obtain more accurate data and improve the model [11,55,70].
In the context of the LCA of beer, several studies have conducted a sensitivity analysis mainly on cultivation techniques, packaging, and energy.
Regarding cultivation, agricultural practices and the use of fertilizers can significantly alter the results. Sensitivity analysis has highlighted that more sustainable practices reduce greenhouse gas emissions and other environmental impacts [33]. In the case of packaging, the analysis was conducted to understand the uncertainties related to the recycled content of the packaging material [33,39]. Three variables were considered: aluminum cans with 80% recycled material, glass bottles with 70% recycled material, and 100% recycled PET. These approaches have shown that varying the percentage of recycled material in packaging determines changes in the carbon footprint (10–15% less) and in the potential for depletion of abiotic resources (up to 18%) [37,71]. Another aspect that has been studied is energy sources. Sensitivity analysis has shown that the use of different energy sources during the production process can significantly influence greenhouse gas emissions. For example, the use of renewable energy compared to conventional energy significantly reduces the environmental impact by about 20–30% compared to fossil energy sources [33]. Furthermore, improving brewery efficiency, for example, with better thermal insulation, can reduce GHG emissions by 15–20% [70]. Hallström et al., 2018 considered the consumption of alcoholic beverages in their study, including beer, through a cradle-to-grave approach, highlighting how reducing beer consumption by 50% can reduce diet-related GHG emissions by 5–11%. Furthermore, he highlighted how beer storage practices in the distribution and sales phases and home storage of this beverage can affect GHG, underlining that preferring the storage of beer at room temperature improves greenhouse gas emissions by 10–15% [40]. These numerical results show how different operational and behavioral choices can significantly influence the overall environmental impact of beer production and consumption. Uncertainty analysis is a technique used to quantify the degree of uncertainty in a model’s outputs resulting from uncertainty in input parameters. It provides a measure of confidence in the model’s outputs. The purpose of this analysis is to quantify the overall uncertainty associated with the model’s outputs, assess its robustness, and provide confidence intervals. The reviewed studies have mainly used a Monte Carlo analysis to assess the uncertainty in LCA outputs. This technique allows repeated simulations to be performed by randomly varying input values within given confidence intervals. One thousand simulations were chosen to estimate the uncertainty associated with the input data and emissions models [5,33,70]. In the context of beer, Cimini & Moresi 2018 assessed the uncertainty of the carbon footprint (CF) for beer packaged in glass and PET bottles. All independent variables were varied by approximately ±10% from the values used; these results indicate that variations in independent variables can significantly influence the total carbon footprint, highlighting the importance of considering uncertainties in environmental assessments [50]. For the carbon footprint of beer, CO2 eq emissions range between 0.8 and 1.3 kg CO2 eq per liter with a 95% confidence interval [68,71]. Hallström et al., 2018 estimated GHG emissions for alcohol consumption in Sweden with a variability of 10–20%, i.e., average emissions of 52 kg CO2 eq per person per year can range from 41.6 to 62.4 kg CO2 eq [40]. These uncertainty analyses provide a detailed picture of how variability in data and methodological assumptions influence the results of studies on the environmental impact of beer production and consumption.

5. Conclusions, Limitations, and Future Research

Beer production presents significant environmental sustainability challenges, but the Life Cycle Assessment (LCA) application offers a robust methodology to identify and mitigate these impacts. From the literature review results, the stages of raw material cultivation, energy use, and packaging are the main contributors to greenhouse gas emissions and other environmental impacts (e.g., eutrophication potential, acidification potential, etc.). However, it is important to note that the available studies are few and heterogeneous in the application of LCA methodologies, which make a direct and meaningful comparison between the results difficult. One of the main limitations found in this review is the paucity of studies on LCA applied to beer production. This limits the ability to generalize the results and draw definitive conclusions. Furthermore, the studies reviewed the use of different methodologies, impact categories, and functional units, which further complicates the comparison and synthesis of the results. The definition of the system boundaries also varies greatly between the studies: some include only specific stages of production, while others consider the entire life cycle from cultivation to distribution and disposal. Energy use and packaging are two critical aspects identified in the review. Energy use in breweries represents a significant part of the environmental footprint, with room for improvement through the adoption of more efficient technologies and the use of renewable energy sources. Packaging, especially glass bottles and aluminum cans, contributes substantially to greenhouse gas emissions and other impacts, such as acidification and eutrophication. Reduction strategies include the use of recycled materials and the promotion of reuse and recycling systems. However, it is also important to emphasize that the environmental impacts associated with beer production may be highly dependent on different factors and vary significantly depending on the geographical region of production, which influences differences in climate, water availability, and agricultural practices, and is dependent on the scale of production. For example, the different environmental and geographical characteristics of the barley production site (although it is a very adaptable plant), such as rainfall, temperature, photoperiod, altitude, or latitude, could have significant effects on the need for more or fewer inputs, which ultimately reflect on the sustainability of production. But geographical variability could also be reflected in the energy mix used. For example, in the USA, which have some some of the world’s leading brewers, 60% of the electricity mix comes from fossil fuels, 19% from nuclear power, and about 21% from renewable energy sources. This could push the results up, especially in terms of global warming and ionizing radiation (which depend on whether nuclear energy is used or not). On the other hand, in Norway, where renewable resources are abundant, due to the large availability of geothermal and hydroelectric power relative to population, the results could be pushed down and be lower, especially in terms of carbon footprint. Finally, the locations of raw material suppliers, breweries, and consumers also influence transport emissions and energy use. For example, breweries located closer to barley production sites might have lower transport emissions than those importing inputs over long distances. All these factors, and thus the differences in geographical locations, could influence the implementation of sustainable practices as breweries may find it more or less economically feasible to implement these practices. In this context, the scale of production also plays a role. In more detail, it is evident that large breweries could benefit considerably from economies of scale as they could spread the investment costs for high-efficiency brewing equipment and other renewable energy production facilities over a larger number of units, thus producing beer at a lower cost per liter than smaller breweries—the ones that would then face higher unit costs for implementing sustainable practices. A final consideration that emerges from the literature review is that in the future, there will be a clear need to standardize LCA methodologies applied to beer production to allow more accurate and meaningful comparisons between different studies. Furthermore, future studies should focus on identifying technologies and practices that improve energy efficiency in breweries, thus reducing the carbon footprint of production, although, as mentioned, this may differ according to region and scale of production. Research on alternative, more sustainable packaging materials and effective reuse systems could also significantly contribute to reducing the environmental impact of packaging. This could further push the implementation of circular economy practices, e.g., through returnable vacuum practices, or the implementation of Deposit Return Systems (DRS), i.e., charging the consumer a small refundable deposit that is added to the sales price. This deposit will be returned as soon as the container (bottle, glass, jug, etc.) is returned, thus avoiding the dispersion of the container into the environment and, thus, ensuring its complete recycling. Since a large proportion of beers are consumed in bars, adopting the DRS system for plastics could also help bring about the circularity required by European directives. Finally, there is a need for long-term studies that assess the environmental impact of sustainable innovations and practices implemented over time. In conclusion, while LCA is confirmed as an essential tool to guide decisions toward more environmentally responsible brewing, there is a clear need for further research and greater methodological harmonization to address current and future sustainability challenges in the brewing sector.

Author Contributions

All authors contributed equally to the writing of the article. All authors have read and agreed to the published version of the manuscript.

Funding

This research received no external funding.

Data Availability Statement

No new data were created or analyzed in this study. Data sharing is not applicable to this article.

Conflicts of Interest

The authors declare no conflict of interest.

References

  1. Mattila, T.; Helin, T.; Antikainen, R. Land Use Indicators in Life Cycle Assessment A Case Study on Beer Production. Int. J. Life Cycle Assess. 2012, 17, 277–286. [Google Scholar] [CrossRef]
  2. Morgan, D.R.; Styles, D.; Lane, E.T. Thirsty Work: Assessing the Environmental Footprint of Craft Beer. Sustain. Prod. Consum. 2021, 27, 242–253. [Google Scholar] [CrossRef]
  3. Gómez-Corona, C.; Escalona-Buendía, H.B.; García, M.; Chollet, S.; Valentin, D. Craft vs. Industrial: Habits, Attitudes and Motivations towards Beer Consumption in Mexico. Appetite 2016, 96, 358–367. [Google Scholar] [CrossRef] [PubMed]
  4. Brewers Association. Available online: https://www.brewersassociation.org/ (accessed on 9 July 2024).
  5. Donadini, G.; Porretta, S. Uncovering Patterns of Consumers’ Interest for Beer: A Case Study with Craft Beers. Food Res. Int. 2017, 91, 183–198. [Google Scholar] [CrossRef]
  6. Diniz, D.d.P.; Carvalho, M. Environmental Repercussions of Craft Beer Production in Northeast Brazil. Sustainability 2024, 16, 4566. [Google Scholar] [CrossRef]
  7. Carvalho, G.; Leite, A.C.; Leal, R.; Pereira, R. The Role of Emergent Processing Technologies in Beer Production. Beverages 2023, 9, 7. [Google Scholar] [CrossRef]
  8. Montanari, L.; Floridi, S.; Marconi, O.; Tironzelli, M.; Fantozzi, P. Effect of Mashing Procedures on Brewing. Eur. Food Res. Technol. 2005, 221, 175–179. [Google Scholar] [CrossRef]
  9. Kalac, P.; Krizek, M. A Review of Biogenic Amines and Polyamines in Beer. J. Inst. Brew. 2003, 109, 123–128. [Google Scholar] [CrossRef]
  10. Talve, S. Life Cycle Assessment of a Basic Lager Beer. Int. J. Life Cycle Assess. 2001, 6, 293–298. [Google Scholar] [CrossRef]
  11. Cavenago, G.; Grosso, M.; Rigamonti, L. le fasi opzionali di normalizzazione e pesatura nell’analisi del ciclo di vita: Approcci possibili e stato dell’arte. Ing. Dell’ambiente 2021, 8, 188–201. [Google Scholar] [CrossRef]
  12. Uhlman, B.W.; Saling, P.R. The BASF Eco-Efficiency Toolbox: Holistic Evaluation of Sustainable Solutions; Elsevier: Amsterdam, The Netherlands, 2017; Volume 1, ISBN 9780128046777. [Google Scholar]
  13. da Fonseca, L.M.C.M. ISO 14001:2015: An Improved Tool for Sustainability. J. Ind. Eng. Manag. 2015, 8, 37–50. [Google Scholar] [CrossRef]
  14. Giuliana, V.; Lucia, M.; Marco, R.; Simone, V. Environmental Life Cycle Assessment of Rice Production in Northern Italy: A Case Study from Vercelli. Int. J. Life Cycle Assess. 2022, 29, 1523–1540. [Google Scholar] [CrossRef]
  15. ISO 14001:2015; Environmental Management Systems—Requirements with Guidance for Use. ISO—International Organization for Standardization: Geneva, Switzerland, 2015.
  16. Wang, S.; Dong, Y. Applications of Life Cycle Assessment in the Chocolate Industry: A State-of-the-Art Analysis Based on Systematic Review. Foods 2024, 13, 915. [Google Scholar] [CrossRef] [PubMed]
  17. Ferrara, C.; De Feo, G. Life Cycle Assessment Application to the Wine Sector: A Critical Review. Sustainability 2018, 10, 395. [Google Scholar] [CrossRef]
  18. Zingale, S.; Guarnaccia, P.; Matarazzo, A.; Lagioia, G.; Ingrao, C. A Systematic Literature Review of Life Cycle Assessments in the Durum Wheat Sector. Sci. Total Environ. 2022, 844, 157230. [Google Scholar] [CrossRef]
  19. Vinci, G.; Ruggieri, R.; Ruggeri, M.; Prencipe, S.A. Rice Production Chain: Environmental and Social Impact Assessment—A Review. Agriculture 2023, 13, 340. [Google Scholar] [CrossRef]
  20. Ahmad, A.; Zoli, M.; Latella, C.; Bacenetti, J. Rice Cultivation and Processing: Highlights from a Life Cycle Thinking Perspective. Sci. Total Environ. 2023, 871, 162079. [Google Scholar] [CrossRef]
  21. Sonnemann, G.W.; Solgaard, A.; Saur, K.; Udo de Haes, H.A.; Christiansen, K.; Jensen, A.A. Life Cycle Management: UNEP-Workshop Sharing Experiences on LCM. Int. J. Life Cycle Assess. 2001, 6, 325–333. [Google Scholar] [CrossRef]
  22. Peças, P.; Götze, U.; Bravo, R.; Richter, F.; Ribeiro, I. Methodology for Selection and Application of Eco-Efficiency Indicators Fostering Decision-Making and Communication at Product Level-the Case of Molds for Injection Molding; Elsevier Inc.: Amsterdam, The Netherlands, 2018; ISBN 9780081024140. [Google Scholar]
  23. Curran, M.A. Life Cycle Assessment: A Review of the Methodology and Its Application to Sustainability. Curr. Opin. Chem. Eng. 2013, 2, 273–277. [Google Scholar] [CrossRef]
  24. Fauzi, R.T.; Lavoie, P.; Sorelli, L.; Heidari, M.D.; Amor, B. Exploring the Current Challenges and Opportunities of Life Cycle Sustainability Assessment. Sustainability 2019, 11, 636. [Google Scholar] [CrossRef]
  25. Bozzola, M.; Lamonaca, E.; Santeramo, F.G. Impacts of Climate Change on Global Agri-Food Trade. Ecol. Indic. 2023, 154, 110680. [Google Scholar] [CrossRef]
  26. Chen, Z.; Huang, L. Application Review of LCA (Life Cycle Assessment) in Circular Economy: From the Perspective of PSS (Product Service System). Procedia CIRP 2019, 83, 210–217. [Google Scholar] [CrossRef]
  27. Martin, M.; Herlaar, S.; Jönsson, A.; Lazarevic, D. From Circular to Linear? Assessing the Life Cycle Environmental and Economic Sustainability of Steel and Plastic Beer Kegs. Circ. Econ. Sustain. 2022, 2, 937–960. [Google Scholar] [CrossRef]
  28. Marimon Viadiu, F.; Casadesús Fa, M.; Heras Saizarbitoria, I. ISO 9000 and ISO 14000 Standards: An International Diffusion Model. Int. J. Oper. Prod. Manag. 2006, 26, 141. [Google Scholar] [CrossRef]
  29. ISO 14001:2006; Environmental Management Systems—Requirements with Guidance for Use. International Organization for Standardization: Geneva, Switzerland, 2006.
  30. Sala, S.; Beylot, A.; Corrado, S.; Crenna, E.; Sanyé-Mengual, E.; Secchi, M. Indicators and Assessment of the Environmental Impact of EU Consumption; JRC Publications Repository: Brussels, Belgium, 2019; ISBN 9789279996726. [Google Scholar]
  31. Saling, P.; Kicherer, A.; Dittrich-Krämer, B.; Wittlinger, R.; Zombik, W.; Schmidt, I.; Schrott, W.; Schmidt, S. Eco-Efficiency Analysis by BASF: The Method. Int. J. Life Cycle Assess. 2002, 7, 203–218. [Google Scholar] [CrossRef]
  32. IngeAmienyo, D.; Azapagic, A. Life Cycle Environmental Impacts and Costs of Beer Production and Consumption in the UK. Int. J. Life Cycle Assess. 2016, 21, 492–509. [Google Scholar] [CrossRef]
  33. Notarnicola, B.; Tassielli, G.; Renzulli, P.A.; Castellani, V.; Sala, S. Environmental Impacts of Food Consumption in Europe. J. Clean. Prod. 2017, 140, 753–765. [Google Scholar] [CrossRef]
  34. Brancoli, P.; Bolton, K.; Eriksson, M. Environmental Impacts of Waste Management and Valorisation Pathways for Surplus Bread in Sweden. Waste Manag. 2020, 117, 136–145. [Google Scholar] [CrossRef]
  35. Pasqualino, J.; Meneses, M.; Castells, F. The Carbon Footprint and Energy Consumption of Beverage Packaging Selection and Disposal. J. Food Eng. 2011, 103, 357–365. [Google Scholar] [CrossRef]
  36. Cimini, A.; Moresi, M. Mitigation Measures to Minimize the Cradle-to-Grave Beer Carbon Footprint as Related to the Brewery Size and Primary Packaging Materials. J. Food Eng. 2018, 236, 1–8. [Google Scholar] [CrossRef]
  37. Morgan, D.R.; Styles, D.; Thomas Lane, E. Packaging Choice and Coordinated Distribution Logistics to Reduce the Environmental Footprint of Small-Scale Beer Value Chains. J. Environ. Manag. 2022, 307, 114591. [Google Scholar] [CrossRef] [PubMed]
  38. Cimini, A.; Moresi, M. Are the Present Standard Methods Effectively Useful to Mitigate the Environmental Impact of the 99% EU Food and Drink Enterprises? Trends Food Sci. Technol. 2018, 77, 42–53. [Google Scholar] [CrossRef]
  39. Cimini, A.; Moresi, M. Carbon Footprint of a Pale Lager Packed in Different Formats: Assessment and Sensitivity Analysis Based on Transparent Data. J. Clean. Prod. 2016, 112, 4196–4213. [Google Scholar] [CrossRef]
  40. Hallström, E.; Håkansson, N.; Åkesson, A.; Wolk, A.; Sonesson, U. Climate Impact of Alcohol Consumption in Sweden. J. Clean. Prod. 2018, 201, 287–294. [Google Scholar] [CrossRef]
  41. Saget, S.; Porto Costa, M.; Black, K.; Iannetta, P.P.M.; Reckling, M.; Styles, D.; Williams, M. Environmental Impacts of Scottish Faba Bean-Based Beer in an Integrated Beer and Animal Feed Value Chain. Sustain. Prod. Consum. 2022, 34, 330–341. [Google Scholar] [CrossRef]
  42. Smedman, A.; Lindmark-Månsson, H.; Drewnowski, A.; Edman, A.K.M. Nutrient Density of Beverages in Relation to Climate Impact. Food Nutr. Res. 2010, 54, 5170. [Google Scholar] [CrossRef]
  43. Mata, T.M.; Costa, C.A.V. Life Cycle Assessment of Different Reuse Percentages for Glass Beer Bottles. Int. J. Life Cycle Assess. 2001, 6, 307–319. [Google Scholar] [CrossRef]
  44. Ho, D.M.; Thach, B.T.; Bui, H.M. Establishing Criteria for Advancing Circular Economy Practices in the Beer Industry: A Case Study in South Vietnam. Environ. Qual. Manag. 2024, 34, 22218. [Google Scholar] [CrossRef]
  45. Cimini, A.; Moresi, M. Product Carbon Footprint: Still a Proper Method to Start Improving the Sustainability of Food and Beverage Enterprises. Ital. J. Food Sci. 2019, 31, 808–826. [Google Scholar] [CrossRef]
  46. Hanssen, O.J.; Rukke, E.O.; Saugen, B.; Kolstad, J.; Hafrom, P.; Von Krogh, L.; Raadal, H.L.; Rønning, A.; Wigum, K.S. The Environmental Effectiveness of the Beverage Sector in Norway in a Factor 10 Perspective. Int. J. Life Cycle Assess. 2007, 12, 257–265. [Google Scholar] [CrossRef]
  47. Salazar Tijerino, M.B.; San Martín-González, M.F.; Velasquez Domingo, J.A.; Huang, J.Y. Life Cycle Assessment of Craft Beer Brewing at Different Scales on a Unit Operation Basis. Sustainability 2023, 15, 11416. [Google Scholar] [CrossRef]
  48. ISO 14040:2006; Environmental Management–Life Cycle Assessment—Principles and Framework. International Standard Organization: Geneva, Switzerland, 2006.
  49. Avadí, A.; Fréon, P. Life Cycle Assessment of Fisheries: A Review for Fisheries Scientists and Managers. Fish. Res. 2013, 143, 21–38. [Google Scholar] [CrossRef]
  50. Cibelli, M.; Cimini, A.; Moresi, M. Carbon Footprint of Different Coffee Brewing Methods. Chem. Eng. Trans. 2021, 87, 373–378. [Google Scholar] [CrossRef]
  51. García-Arca, J.; Garrido, A.T.G.-P.; Prado-Prado, J.C. “Sustainable Packaging Logistics”. The link between Sustainability and Competitiveness in Supply Chains. Sustainability 2017, 9, 1098. [Google Scholar] [CrossRef]
  52. de Paula Diniz, D.; Carvalho, M.; Abrahão, R. Greenhouse Gas Accounting for the Energy Transition in a Brewery. Environ. Prog. Sustain. Energy 2021, 40, e13563. [Google Scholar] [CrossRef]
  53. De Marco, I.; Miranda, S.; Riemma, S.; Iannone, R. Life Cycle Assessment of Ale and Lager Beers Production. Chem. Eng. Trans. 2016, 49, 337–342. [Google Scholar] [CrossRef]
  54. Saget, S.; Porto Costa, M.; Santos, C.S.; Vasconcelos, M.; Styles, D.; Williams, M. Comparative Life Cycle Assessment of Plant and Beef-Based Patties, Including Carbon Opportunity Costs. Sustain. Prod. Consum. 2021, 28, 936–952. [Google Scholar] [CrossRef]
  55. Cordella, M.; Tugnoli, A.; Spadoni, G.; Santarelli, F.; Zangrando, T. LCA of an Italian Lager Beer. Int. J. Life Cycle Assess. 2008, 13, 133–139. [Google Scholar] [CrossRef]
  56. Rosenbaum, R.K.; Hauschild, M.Z.; Boulay, A.M.; Fantke, P.; Laurent, A.; Núñez, M.; Vieira, M. Life Cycle Impact Assessment. In Life Cycle Assessment: Theory and Practice; Springer International Publishing: Cham, Switzerland, 2017; ISBN 9783319564753. [Google Scholar]
  57. Boesen, S.; Bey, N.; Niero, M. Environmental Sustainability of Liquid Food Packaging: Is There a Gap between Danish Consumers’ Perception and Learnings from Life Cycle Assessment? J. Clean. Prod. 2019, 210, 1193–1206. [Google Scholar] [CrossRef]
  58. Usva, K.; Saarinen, M.; Katajajuuri, J.M.; Kurppa, S. Supply Chain Integrated LCA Approach to Assess Environmental Impacts of Food Production in Finland. Agric. Food Sci. 2009, 18, 460–476. [Google Scholar] [CrossRef]
  59. Schau, E.M.; Fet, A.M. LCA for Food Products (Subject Editor: Niels Jungbluth) LCA Studies of Food Products as Background for Environmental Product Declarations. Int. J. Life Cycle Assess. 2008, 13, 255–264. [Google Scholar] [CrossRef]
  60. Hertwich, E.; van der Voet, E.; Suh, S.; Tukker, A.; Huijbregts, M.; Kazmierczyk, P.; Lenzen, M.; McNeely, J.; Moriguchi, Y. UNEP—Assessing the Environmental Impacts of Consumption and Production: Priority Products and Materials, A Report of the Working Group on the Environmental Impacts of Products and Materials to the International Panel for Sustainable Resource Management; UNEP/Earthprint: Nairobi, Kenya, 2010; ISBN 9789280730845. [Google Scholar]
  61. Koroneos, C.; Roumbas, G.; Gabari, Z.; Papagiannidou, E.; Moussiopoulos, N. Life Cycle Assessment of Beer Production in Greece. J. Clean. Prod. 2005, 13, 433–439. [Google Scholar] [CrossRef]
  62. Notarnicola, B.; Sala, S.; Anton, A.; McLaren, S.J.; Saouter, E.; Sonesson, U. The Role of Life Cycle Assessment in Supporting Sustainable Agri-Food Systems: A Review of the Challenges. J. Clean. Prod. 2017, 140, 399–409. [Google Scholar] [CrossRef]
  63. Scientific Applications International Corporation (SAIC). Life Cicle Assesment: Principle and Practice 2006. National Risk Management Research Laboratory Office of Research and Development US Environmental Protection Agency. Available online: https://books.google.it/books?hl=it&lr=&id=Aa4LcJ1brSIC&oi=fnd&pg=PR2&dq=SAIc+Life+Cycle+Assessment:+Principles+and+Practice%3B+Scientific+Applications+International+Corporation+(SAIC),+2006.&ots=1gtthsgdkW&sig=e1gKWCxzw6RaK-Ff4iJTuU4r2vY#v=onepage&q=SAIc%20Life%20Cycle%20Assessment%3A%20Principles%20and%20Practice%3B%20Scientific%20Applications%20International%20Corporation%20(SAIC)%2C%202006.&f=false (accessed on 19 July 2024).
  64. Hauschild, M.Z.; Goedkoop, M.; Guinée, J.; Heijungs, R.; Huijbregts, M.; Jolliet, O.; Margni, M.; De Schryver, A.; Humbert, S.; Laurent, A.; et al. Identifying Best Existing Practice for Characterization Modeling in Life Cycle Impact Assessment. Int. J. Life Cycle Assess. 2013, 18, 683–697. [Google Scholar] [CrossRef]
  65. Heller, M. Food Product Environmental Footprint Literature Summary: Food Transportation; The Oregon Sustainability Board: Salem, OR, USA, 2017. [Google Scholar]
  66. Mattila, T.; Leskinen, P.; Soimakallio, S.; Sironen, S. Uncertainty in Environmentally Conscious Decision Making: Beer or Wine? Int. J. Life Cycle Assess. 2012, 17, 696–705. [Google Scholar] [CrossRef]
  67. Březinová, M. Beer Industry in the Czech Republic: Reasons for Founding a Craft Brewery. Sustainability 2021, 13, 9680. [Google Scholar] [CrossRef]
  68. Stillitano, T.; Falcone, G.; De Luca, A.I.; Piga, A.; Conte, P.; Strano, A.; Gulisano, G. A Life Cycle Perspective to Assess the Environmental and Economic Impacts of Innovative Technologies in Extra Virgin Olive Oil Extraction. Foods 2019, 8, 209. [Google Scholar] [CrossRef]
  69. Cibelli, M.; Cimini, A.; Cerchiara, G.; Moresi, M. Carbon Footprint of Different Methods of Coffee Preparation. Sustain. Prod. Consum. 2021, 27, 1614–1625. [Google Scholar] [CrossRef]
  70. Arzoumanidis, I.; Salomone, R.; Petti, L.; Mondello, G.; Raggi, A. Is There a Simplified LCA Tool Suitable for the Agri-Food Industry? An Assessment of Selected Tools. J. Clean. Prod. 2017, 149, 406–425. [Google Scholar] [CrossRef]
  71. Zheng, H.; Xing, M.; Cao, T.; Zhang, J. Uncertainty Study and Parameter Optimization of Carbon Footprint Analysis for Fermentation Cylinder. Sustainability 2019, 11, 661. [Google Scholar] [CrossRef]
Figure 1. Article selection processes of Google Scholar and Scopus Database.
Beverages 10 00086 g001
Figure 2. Principle System Boundaries of Beer LCA Study (Different colors represent the main system boundary approaches: blue for cradle-to-grave, orange for gate-to-gate, and green for cradle-to-gate).
Beverages 10 00086 g002
Disclaimer/Publisher’s Note: The statements, opinions and data contained in all publications are solely those of the individual author(s) and contributor(s) and not of MDPI and/or the editor(s). MDPI and/or the editor(s) disclaim responsibility for any injury to people or property resulting from any ideas, methods, instructions or products referred to in the content.

