Article

In Vitro Screening of Potential Role of Green and Roasted Coffee Extracts in Type 2 Diabetes Management

by
Lorena G. Calvo
1,†,
Vinicius de Monte Vidal
2,3,4,†,
Victoria Díaz-Tomé
2,3,4,
Francisco J. Otero Espinar
2,3,4 and
Trinidad de Miguel
1,*
1
Department of Microbiology and Parasitology, Universidade de Santiago de Compostela (USC), 15782 Santiago de Compostela, Spain
2
Paraquasil Group, Institute of Materials iMATUS, Department of Pharmacology, Pharmacy and Pharmaceutical Technology, Universidade de Santiago de Compostela (USC), 15706 Santiago de Compostela, Spain
3
Paraquasil Group, University Clinical Hospital, Health Research Institute of Santiago de Compostela (IDIS), 15706 Santiago de Compostela, Spain
4
Instituto de Herbología Sarela (Etnogal SL), 15701 Santiago de Compostela, Spain
*
Author to whom correspondence should be addressed.
These authors contributed equally to this work.
Beverages 2025, 11(3), 56; https://doi.org/10.3390/beverages11030056
Submission received: 4 March 2025 / Revised: 16 April 2025 / Accepted: 17 April 2025 / Published: 22 April 2025

Abstract

:
This study evaluates the potential role of two extracts derived from green and roasted coffee in managing Type 2 Diabetes (T2D). The phytochemical analysis revealed that the roasted coffee extract (RCE) contains higher levels of flavonoids and tannins, while the green coffee extract (GCE) seems to be richer in phenolic acids. No differences in the antioxidant activity of both extracts were observed. The study demonstrated that GCE exhibits stronger prebiotic potential by significantly enhancing the growth of beneficial probiotic bacteria when compared to the untreated sample. Both extracts inhibited α-amylase and α-glucosidase enzymes, with RCE demonstrating a better performance than other commercial treatments for T2D. Glucose uptake assays on yeast cells demonstrated that both extracts enhance glucose transport, particularly at low glucose concentrations, reducing supernatant glucose levels by 60–80%. Notably, GCE maintained its effectiveness even at the highest glucose concentrations tested. These findings suggest that coffee extracts, particularly GCE, may be useful as nutraceuticals for potentially regulating glucose metabolism and gut microbiota in T2D management.

Graphical Abstract

1. Introduction

Glucose is a key molecule for our body’s energy production and consumption [1]; many researchers and nutritionists have claimed the important role that it plays in human physiological functions, with its balance being crucial for avoiding organ damage and neurodegenerative and cardiovascular diseases [2]. Type 2 diabetes (T2D) is a chronic metabolic disorder characterized by poor insulin sensitivity and increased blood sugar levels, known as hyperglycemia [3]. Insulin is a hormone produced by the β-cells of the islets of Langerhans that play a crucial role in regulating the metabolism of carbohydrates, fats, and proteins. β-pancreatic cells regulate insulin secretion as a response to blood glucose levels, increasing its secretion when these are high and reducing it when these are low [4,5]. This phenomenon enhances cellular glucose uptake, thus reducing blood sugar levels, which is essential to maintain metabolic balance and avoid hyperglycemic crisis in diabetic patients.
Diabetes is already recognized as a twenty-first century epidemic. With a global prevalence of 8.3% among adults—expected to reach 53% by 2035—it stands among the top five most deathly diseases around the world [6]. Even though no concrete cause has been associated with T2D [5], epidemiological studies confirm a tight relationship between T2D and overnutrition [7,8].
Eating habits such as the Mediterranean diet, rich in polyunsaturated fat, cereal fibre, fruits, and vegetables, have proven to be protective of T2D [9]. Closely related to diet, glucose bioaccessibility and bioavailability depend on carbohydrate decomposition by digestive enzymes—amylases and glucosidases [10]—and gut microbiota [11]. α-amylase starts the process of carbohydrate catabolism by the hydrolysis of α-D-(1,4) glycosidic linkages of polysaccharides to disaccharides, followed by α-glucosidase cleavage into glucose [12]. Hence, these enzymes play a major role in controlling hyperglycaemia spikes after food intake. Inhibitors of these enzymes can delay carbohydrate metabolization [13] and decrease blood glucose levels, keeping hyperglycaemia under control [14]. The digestion and absorption of nutrients are also dependent on bacterial metabolization and fermentation [15]. Recent studies on T2D patients revealed dysbiosis, which is linked to a wide range of clinical symptoms [16,17,18]. Hence, microbiota modulation approaches using prebiotics, probiotics, and symbiotics arise as new methods to prevent T2D.
Among probiotics, different strains of lactic acid bacteria (LAB) have significantly reduced glucose blood levels and ameliorated diabetes symptoms [19,20,21]. Therefore, treatments including a synergistic approach seem to be suitable for the management of this disease. Indeed, even though many studies have shown that dietary components affect the hormones involved in glucose balance and determine the microbiota composition, the effects of micronutrients and phytochemicals on glucose metabolism regulation and their potential benefits in a holistic treatment of diabetes are so far poorly understood [22].
Coffee is one of the most consumed beverages worldwide, valued not only for its taste and stimulating effects but also for its potential health benefits [23]. The role of coffee phytochemicals and caffeine in T2D management and prevention has been previously studied in vivo and in vitro [24]. Akash et al. reported an inverse correlation between T2D and coffee consumption, especially remarkable in the case of decaffeinated coffee [25], which suggests a protective effect mainly linked to non-caffeine compounds, such as polyphenols [26].
The typical coffee phytochemicals are caffeine, chlorogenic acid, diterpenes, and flavonoids [22]. Among them, chlorogenic acid, an ester of caffeic and quinic acids, has previously been reported as a potential nutraceutical compound that offers protection against cardiovascular and inflammatory T2D-related conditions because of its antioxidant activity [27]. Indeed, both chlorogenic acid and melanoidin are key compounds associated with diabetes amelioration. However, while chlorogenic acid has been reported as a fundamental antioxidant component of fresh or green coffee, melanoidins are mainly present in roasted coffee [23,28]. Melanoidins are produced during the Maillard reaction, when the coffee beans are exposed to heat, and their occurrence in roasted coffee compensates for the antioxidant decrease caused by the loss of chlorogenic acid [29].
The consumption of green coffee products has arisen in recent years as a healthier option than roasted coffee, despite its bitter flavour. Green coffee is considered better than roasted coffee in some ways, primarily due to its higher levels of phenolic acids, due to its lesser acrylamide amounts, and because it is a more natural and less processed option [22]. Additionally, it has slightly less caffeine, which may be more advisable for a certain population [30].
Based on the existing literature, the present study aims to validate the coffee phytochemicals as candidates for the synergistic control of T2D from a nutraceutical approach. For this purpose, two coffee extracts obtained from Brazilian green and roasted beans were studied and compared with a commercial drug used for the treatment of T2D. The potential antidiabetic activity in vitro was studied by means of different indicators, including antioxidant assays, glucose uptake across yeast cell membrane, and the inhibition of α-amylase and α-glucosidase enzymes. Additionally, a prebiotic approach was taken into consideration due to the close connection between microbiota and metabolic disorders.
The results from this research suggest that coffee extracts, especially from green coffee beans, are promising sources of bioactive compounds that could be introduced in food and pharmaceutical settings to prevent and ameliorate T2D by improving the composition of the microbiota and balancing glucose levels.

2. Materials and Methods

2.1. Materials

α-amylase, an α-glucosidase assay kit, α-glucosidase from Saccharomyces cerevisiae 10 U/mg, and Folin–Ciocalteu’s phenol reagent were purchased from Sigma-Aldrich (Steinheim, Germany). The DeMan, Rogosa, and Sharpe broth (MRS) was purchased from Sigma-Aldrich, and the Cation-Adjusted Müller Hinton II broth (CAMHB) was purchased from Becton Dickinson (BBL, Sparks, NV, USA). AlamarBlue was purchased from Thermo Fisher Scientific in Massachusetts, USA, and was employed as a resazurin cell viability enzymatic substrate. Methanol, sodium carbonate, sodium nitrite, sodium hydroxide, hydrochloric acid, and vanillin were purchased from Labkem (Barcelona, Spain). Aluminum chloride was provided by Guinama (Valencia, Spain), and Trolox and DPPH reagents were purchased from Tokyo Chemical Industry CO., LTD (Tokyo, Japan). Galic acid and rutin standards were purchased from Cymit Química S.L. (Barcelona, Spain), and catechin was purchased from Glentham Life Science (United Kingdom).
The commercial T2D treatment, acarbose (Viatris, Madrid, Spain), was used as an enzymatic inhibitor and glucose uptake stimulator control. A 100 mg acarbose tablet was dissolved in 50 mL of distilled water to achieve a concentration of 2 mg/mL, which is the maximum concentration tested in previous studies [31]. The solution was then filtered using a 0.22 µm cellulose filter.
Bacterial strains were purchased from the Spanish Type Culture Collection. Lacticaseibacillus rhamnosus CECT 275, Lacticaseibacillus paracasei CECT 277, and Lactiplantibacillus plantarum ATCC 14917 were grown on (MRS) agar and incubated for 48 h at 37 °C under aerobic conditions.

2.2. Extracts Production

Green and roasted coffee beans were provided by Atlántico Specialty Coffees S.L. Coffee beans were grinded and mixed with an equal proportion (w/v) of glycerine–water (50:50). The green coffee extract (GCE) and roasted coffee extract (RCE) were produced by ETNOGAL S.L. by using an assisted ultrasonic extraction method (Intellectual Property).

2.3. Determination of Total Phenolic Content

The total phenolic content (TPC) of the coffee extracts was obtained using the Folin–Ciocalteu method, with slight modifications [32]. Briefly, 40 µL of extract were mixed with 200 µL of the Folin–Ciocalteu reagent (1:10, v/v) and 150 µL of the sodium carbonate solution (7.5 g/L). The mixture was incubated in the darkness for 2 h. Methanol was employed as a blank. Subsequently, the absorbance was measured at 740 nm. The TPC index was quantified using calibration curves of gallic acid, and the final data were expressed as micrograms of gallic acid equivalents per millilitre of extract (µg GAE/mL).

2.4. Determination of Total Flavonoid Content

The total flavonoid content (TFC) was measured following the protocol described by Zhishen et al. [33]. Briefly, 50 µL of extract, 200 µL of water, and 20 µL of 5% NaNO2 were mixed. After 6 min of incubation at room temperature, 30 µL of 10% AlCl3 were added. After a brief incubation of 5 min, 100 µL of NaOH 1M and 100 µL of water were added. Methanol was employed as a blank. Absorbance was measured at 510 nm. The TFC index was quantified using calibration curves of rutin, and the final data were expressed as micrograms of rutin equivalent per millilitre of extract (µg RE/mL). The samples were analyzed in triplicate.

2.5. Determination of Total Tannin Content

In order to determine the total tannin content (TTC), the protocol by Barbosa et al. was followed [32]. Briefly, 50 µL of sample were mixed with 335 µL of vanillin prepared in 4% methanol and 165 µL of 37% HCl. Mixture was incubated at room temperature for 20 min. After incubation, absorbance was measured at 500 nm. Methanol was employed as a blank. The TTC index was quantified using calibration curves of catechin, and the final data were expressed as micrograms of catechin equivalents per millilitre of extract (µg CE/mL). The samples were analyzed in triplicate.

2.6. Evaluation of the Antioxidant Activity

The antioxidant activity of the extracts was determined using the 2,2-Diphenyl-1-picrylhydrazyl (DPPH) method. Here, 360 µL of the DPPH reagent prepared in methanol was mixed with 40 µL of the sample. Room temperature incubation was performed, and absorbance was measured at 517 nm. The antioxidant activity was quantified using a calibration curve of Trolox (100–5.3 μg/mL). Methanol was employed as a blank. The samples were analyzed in triplicate. Data were expressed as micrograms of Trolox in mL of extract (Trolox µg/mL) [32].

2.7. Resazurin Cell Viability Assay

To assess the effect of coffee extracts on the growth of probiotic bacteria, the method of viable cell assessment by resazurin reduction with fluorometric reading was employed following the adaptation of Calvo et al. for LAB [34]. Briefly, LAB were grown on MRS agar plates and incubated aerobically at 37 °C for 48 h. Stock solutions of each extract were prepared in water, so that, after the addition of 40 µL of the corresponding stock to each well, the final concentrations were 0%, 0.625%, 1.25%, 2.5%, 5%, 10%, and 20%, where 0% represents the non-treated control. The extractive solvent was assessed as a control in the same proportions as the extracts. Furthermore, 100 μL of a bacterial culture containing 106 CFU/mL in CAMHB 2X-8% MRS was added to the microplate wells and mixed with 60 μL of 1M phosphate-buffered saline (PBS) to control the possible pH variations motivated by LAB growth. The microplate was incubated for 21 h at 37 °C. Cell-free blanks were also used in order to detect fluorescence interferences. After overnight incubation, 20 μL of each well were added to a new 96-well microplate containing 50% CAMHB 2X-8% MRS, 30% PBS, and 10% resazurin in a final volume of 200 µL per well. After incubation at 37 °C for 60 min, colorimetric changes were observed. Resazurin reduction to resorufin was measured at an excitation wavelength of 544 nm and an emission wavelength of 590 nm using the FLUOstar microplate reader (BMG Labtech). The growth tendency results were estimated by the growth rates in comparison to the non-treated well. All the experiments were performed in triplicate.

2.8. Determination of Glucose Uptake Capacity by Yeast Cells

The yeast glucose uptake test was performed according to the well-defined method of Cirillo [35]. Commercial baker’s yeast was dissolved in distilled water to prepare a 1% (w/v) suspension. The suspension was incubated overnight at room temperature and then centrifuged at 4300 rpm for 5 min. The pellet was washed three times with distilled water until a clear supernatant was obtained and was then resuspended in 10 mL of water. Finaly, 1/10 (v/v) dilution was obtained by mixing the cell suspension with 90 mL of distilled water.
Here, 400 μL of 5% (v/v) coffee extracts and the control (glycerine–water solvent) was mixed with various concentrations (5, 10, and 25  Mm) of 1 mL of glucose solution and incubated for 10 min at 37 °C. To initiate the reaction, 100 μL of yeast suspension was added to the mixture of glucose and extract, vortexed, and incubated for 60 min at 37 °C. After incubation, the mixtures were centrifuged for 5 min at 3800 rpm, and the amount of glucose present in the supernatant was estimated by using a spectrophotometer at 520 nm. Controls were added in order to avoid absorbance measurements interference. Glucose uptake was calculated using Equation (1), where Abs Control refers to the untreated sample and Abs Extract to the treated sample.
G l u c o s e   u p t a k e = A b s   C o n t r o l A b s   E x t r a c t A b s   C o n t r o l × 100

2.9. In Vitro α-Glucosidase Inhibition Assay

The α-glucosidase inhibitory activity assay (MAK123, Sigma-Aldrich) was performed according to the manufacturer’s instructions, with slight modifications. Briefly, 20 μL of 5% extract stock, 20 μL of the α-glucosidase solution (0.5 U/mL), and 180 μL of a mixture of a pH 7 assay buffer and the p-nitrophenyl-α-D-glucopyranoside (pNPG) solution were added to a 96-well plate (volume per each well) and incubated at 37 °C for 20 min. After incubation, absorbance at 405 nm was measured. Blanks’ absorbance was subtracted, and the inhibition values were calculated using Equation (2), where Abs Control refers to the untreated sample and Abs Extract to the treated sample. Experiments were performed in triplicate.
α     G l u c o s i d a s e   i n h i b i t i o n = A b s   C o n t r o l     A b s   E x t r a c t A b s   C o n t r o l × 100

2.10. In Vitro α-Amylase Inhibition Assay

The in vitro α-amylase inhibition assay (MAK009, Sigma-Aldrich) was performed according to the manufacturer’s instructions, with slight modifications for microtiter plates. Briefly, 20 μL of 5% extract stock, 5 μL of the α-amylase solution, 25 μL assay buffer, and 100 μL of amylase substrate mix (with ethylidene-pNP-G7) were added to each well. A nitrophenol standard curve was employed as a reference for ethylidene-pNP-G7 cleavage. The plate was incubated at room temperature, and the absorbance at 405 nm was measured every 5 min until the value of the most active sample was higher than the value of the highest nitrophenol standard. To avoid absorbance interferences, blanks were added. Experiments were performed in triplicate. The ability of coffee extracts to inhibit α-amylase was calculated using Equation (3), where Abs Control refers to the untreated sample and Abs Extract to the treated sample. Experiments were performed in triplicate.
  α     A m y l a s e   i n h i b i t i o n = A b s   C o n t r o l     A b s   E x t r a c t A b s   C o n t r o l × 100

2.11. Statistical Analysis

Coffee extracts were produced in triplicate. The TPC, TFC, TTC, and AA assays were performed in triplicate per each sample. Average values and ±SD differences were represented graphically (Figure 1). Statistical differences between extract samples were analyzed by an unpaired t-test, used to compare the mean of two independent groups. Lactobacillus growth experiments were performed in triplicate. Values were reported to the untreated control and expressed as means ±SD of bacterial growth (%). Statistical differences were analyzed using two-way ANOVA Dunnett’s multiple comparison test with CI 95% (Figure 2a–c). One-way ANOVA Šídák’s multiple comparisons test was performed between the green and roasted extract values for each bacterium (Figure 2d). Glucose uptake assays were performed in two independent experiments, each comprising three repeated measures. Uptake values were expressed as the percentage decrease in glucose absorbance reported to the untreated control. Differences were analyzed by one-way ANOVA Tukey’s multiple comparisons test. Enzymatic inhibition tests were performed in triplicate, and the inhibition values were expressed as the percentage of inhibition in relation to the non-treated control. Statistical differences were analyzed using the one-way ANOVA Turkey’s test. All statistical analyses were performed using Graphpad Prism 9.0. software. Data normality was stablished by a Q-Q plot. Differences were considered statistically significant at p < 0.05.

3. Results

3.1. Phytochemical Profile

Phytochemical characterization is a crucial step in analyzing the bioactive compounds present in plant extracts, and it provides comprehensive information about their potential medicinal and nutritional applications. In order to determine the abundance of the main phytochemical groups, a green coffee extract (GCE) and a roasted coffee extract (RCE) were analyzed. Figure 1a–c and Table 1 collect the amount of total phenolic compounds (TPC), condensed tannins (TTC), and flavonoids (TFC) present in both extracts. Significant quantitative differences among extracts were observed for the values of TFC and TTC, both being higher in RCE. Non-hydrolysable condensed tannins not only release smaller tannin fragments when degraded but also anthocyanins (flavonoid analogues). This phenomenon depends on the tannin’s degree of polymerization. Therefore, we can observe a significant increase in TFC and TTC for RCE. Condensed tannins are common phytochemicals present in roasted coffee, whose presence is influenced by the temperatures reached during the roasting process, which can enhance flavonoid detection due to tannin fragmentation [36,37]. The total phenolic profile, determined by the Folin–Ciocalteu method, is shown in Figure 1a. The low phenolic detection suggests incompatibility with other compounds present in the extracts, mostly polysaccharides. Consequently, an underestimation of the extracts’ TPC values is assumed [38]. This conclusion is supported by the high flavonoid content detected in both extracts, since that TFC detection method presents high flavonoid affinity and low interferences with other molecules. These results suggest that both extracts present different phytochemical compositions, with the low presence of tannins in GCE being remarkable. Even though TPC values are underestimated, probably by sugar interferences [38,39], their higher abundance in GCE in relation to the other measured parameters suggest the presence of non-flavonoid and non-tannin phytochemical molecules, probably belonging to the hydroxycinnamic acid family [40].

3.2. Antioxidant Activity

Antioxidant activity refers to the capacity of free radical neutralization in cells and food by certain compounds known as antioxidants. Polyphenols are the most well-known antioxidants, and their role in preventing inflammation or reactive oxygen stress which can lead to illness has previously been established [41]. Indeed, antioxidant therapy protects pancreatic ꞵ-cells against oxidative stress-induced apoptosis, preserving cell function and hence protecting patients from diabetes-related complications [40].
The antioxidant activities of the coffee extracts are collected in Figure 1d. The DPPH scavenging activity test determined that both extracts present similar antioxidant activity, at 40,457 ± 298 Eq. Trolox µg/mL and 40,276 ± 333 Eq. Trolox µg/mL for GCE and RCE, respectively.
Previous reports have suggested a positive correlation between the TPC and antioxidant activity [42,43]. From the results exhibited in Figure 1d, where the antioxidant activity is similar for both extracts, it is expected that the TPC value will also be similar. The values for antioxidant activity reinforce the hypothesis discussed in Section 3.1, arguing that both extracts possess similar TPC values, although different compositions, with RCE being richer in tannic–flavonoid compounds and GCE in phenolic acid–flavonoid molecules.

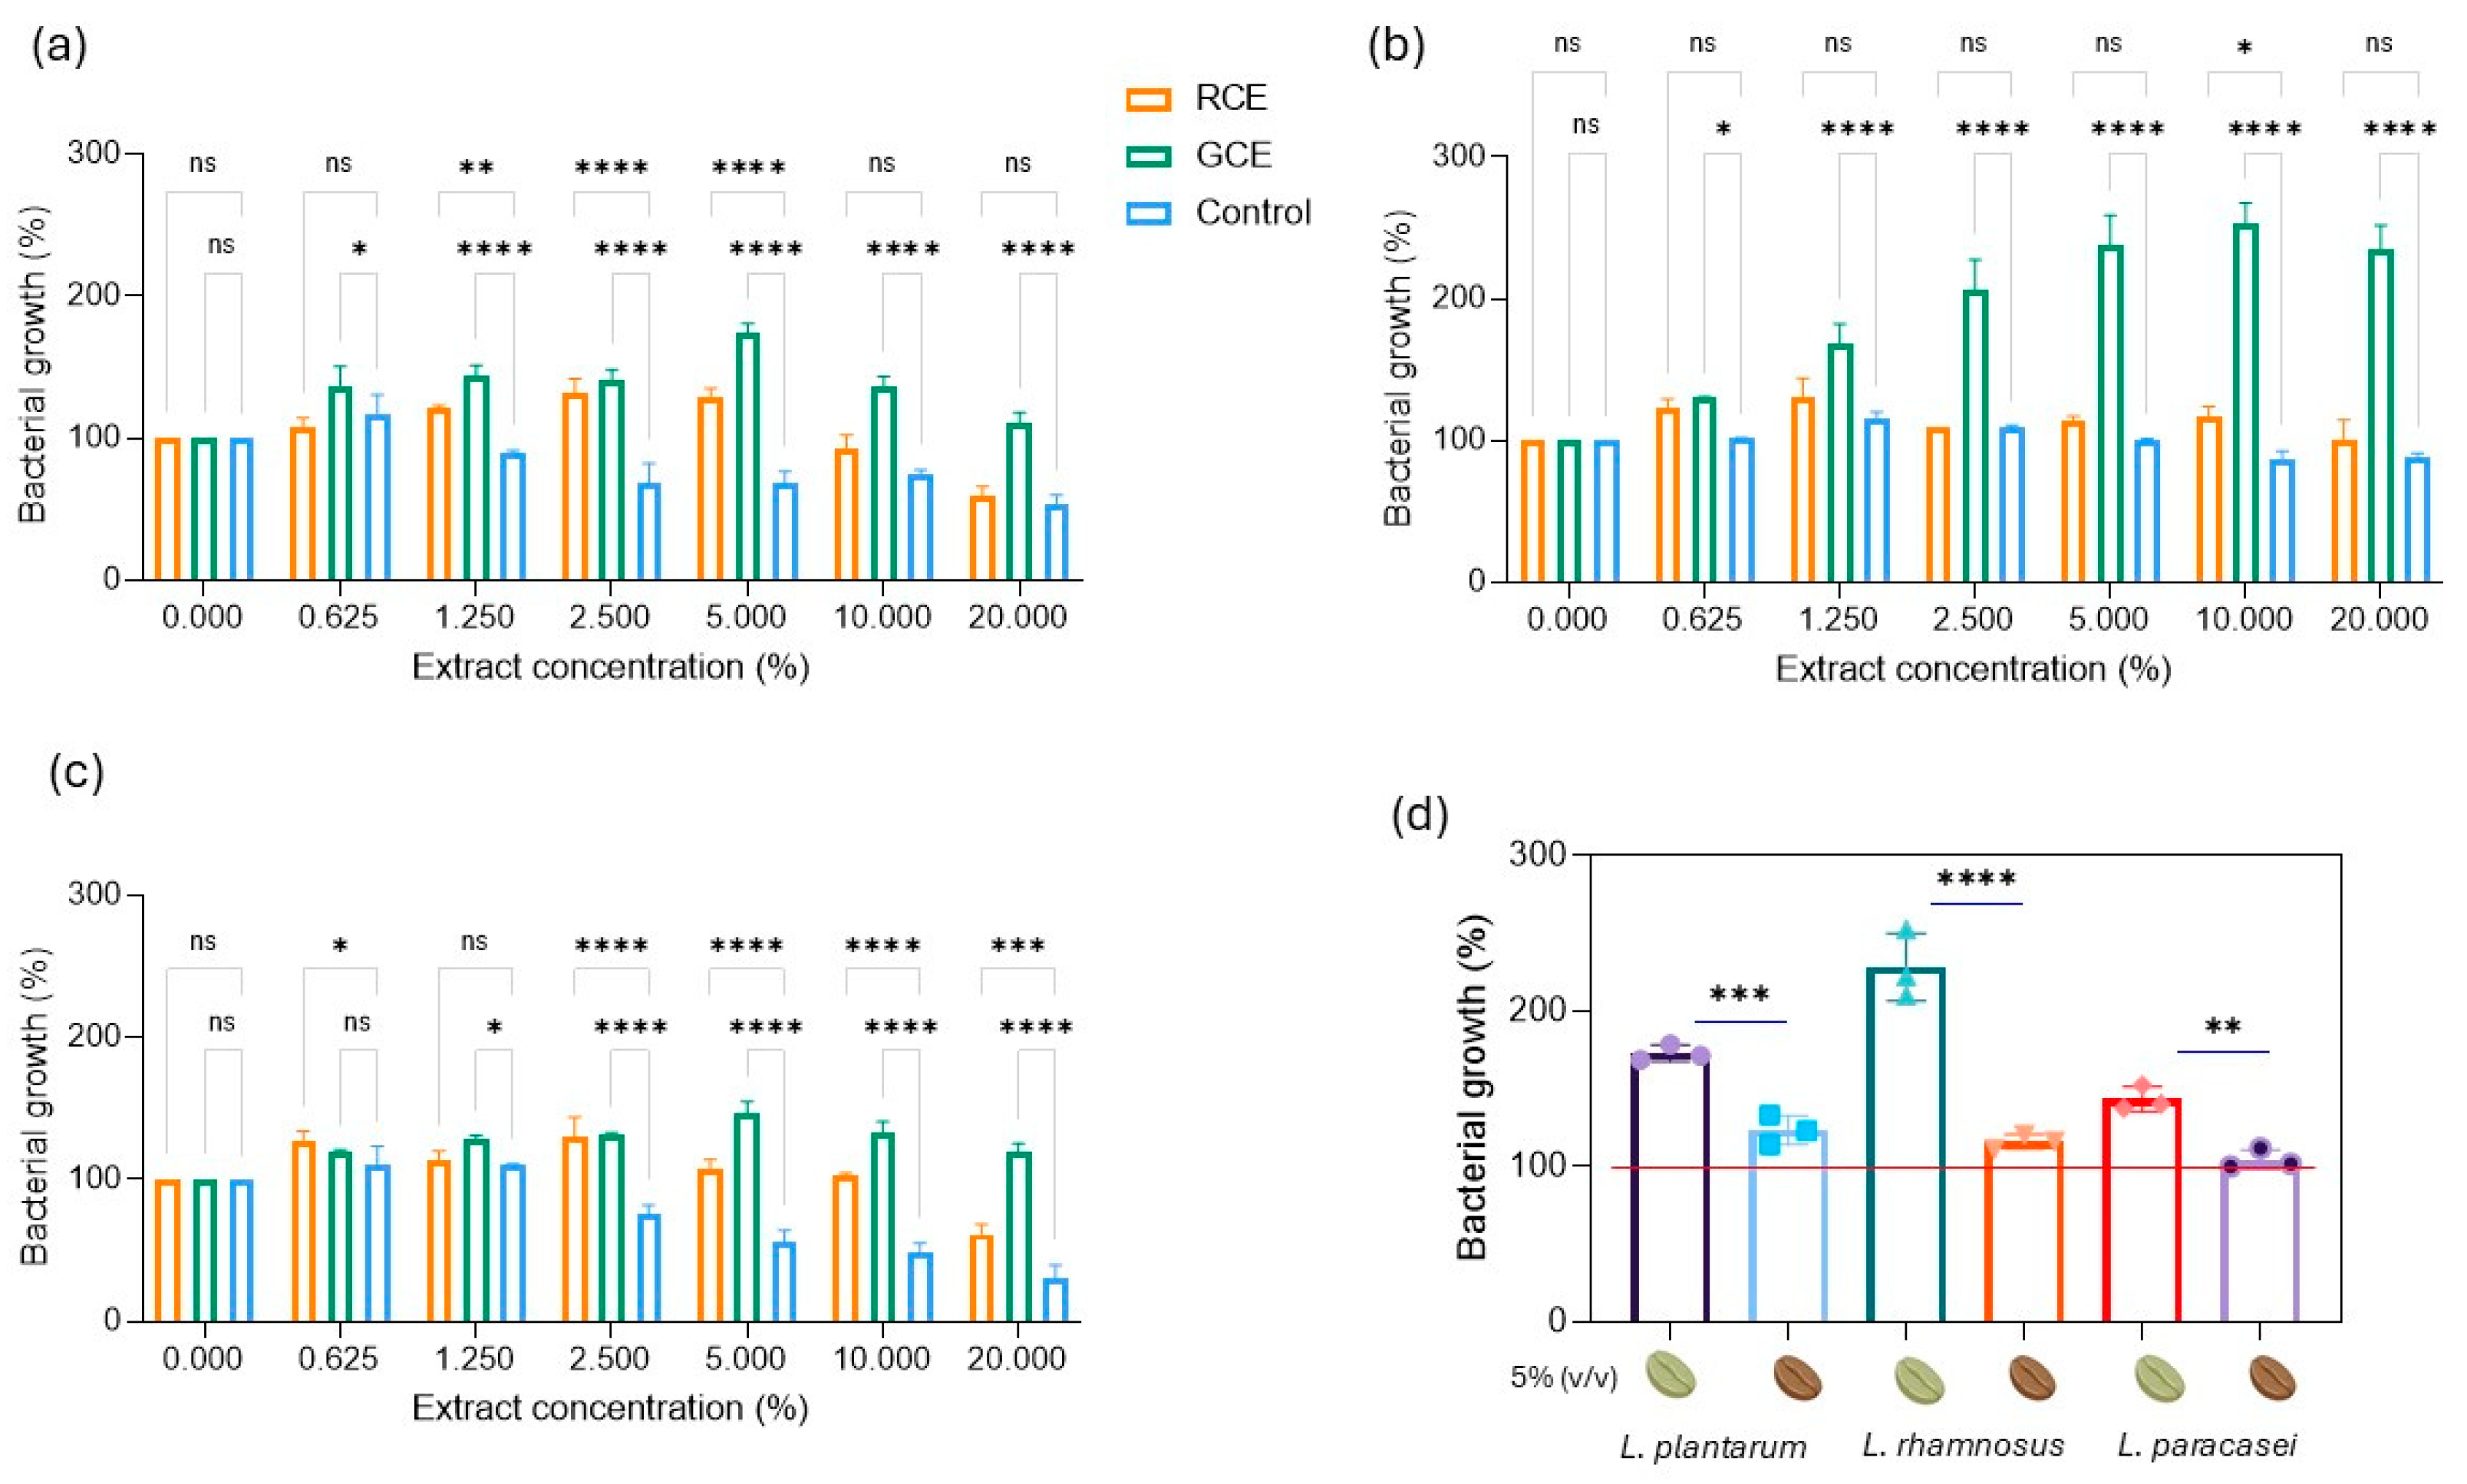
3.3. Effect of GCE and RCE on Probiotics Growth

Microbiota modulation has been one of the ultimate mechanisms proposed for the amelioration and control of metabolic disorders. Dysbiosis has been linked to the emergence of obesity and T2D through decreased glucose tolerance and insulin resistance, the impairment of nutrient absorption, and inflammation responses [11].
Regarding microbiota modulation, probiotics have shown to be effective regarding eubiosis restoration after foodborne infections and prolonged antibiotic treatments [44]. Among probiotics, lactic acid bacteria (LAB) stand out because of their antagonistic activity, mostly due to their active metabolism. Hence, the introduction of probiotics and prebiotic compounds that favour their growth can be a good dietary strategy to improve the symptoms derived from metabolic disorders. In the present work, two glycerine–water coffee extracts were assessed as potential prebiotics to improve the gut microbiota balance of T2D patients. Concentrations ranging from 0 to 20% (v/v) of the extracts were studied as prebiotic compounds for three different well-known probiotic strains, namely L. rhamnosus, L. paracasei, and L. plantarum. Both extracts showed significant promoting effects on LAB growth, especially at low–medium concentrations.
Significant differences were observed between RCE and GCE, the latter being the most efficient, especially regarding L. rhamnosus overgrowth (Figure 2b). Indeed, slightly different responses were observed between bacteria, especially when treated with RCE. Prebiotic activity seems to be limited by the antimicrobial effect of the extractive solvent, which was observed to decrease probiotics growth, especially at concentrations above 5%, this being the tendency clearly observed for L. plantarum and L. paracasei in Figure 2a–c. Regarding L. rhamnosus, neither RCE nor the solvent showed a significant effect on the bacterial population (Figure 2c). On the contrary, GCE seems to improve bacterial growth, even camouflaging the solvent effect. Concentrations of 5% of extracts seem to be the most suitable for this purpose because of the remarkable growth enhancement and lower solvent interference. At this concentration, green coffee extracts significantly stand out as the most prominent source of prebiotics, even doubling the probiotics population after the incubation time, in comparison to the untreated samples. RCE, meanwhile, only has a very slight effect on the bacterial growth, with an enhancement of 10–20% of L. plantarum and L. rhamnosus growth and with no detected effect on L. paracasei. The comparison of the three LAB treated with both extracts at a concentration of 5% is shown in Figure 2d.

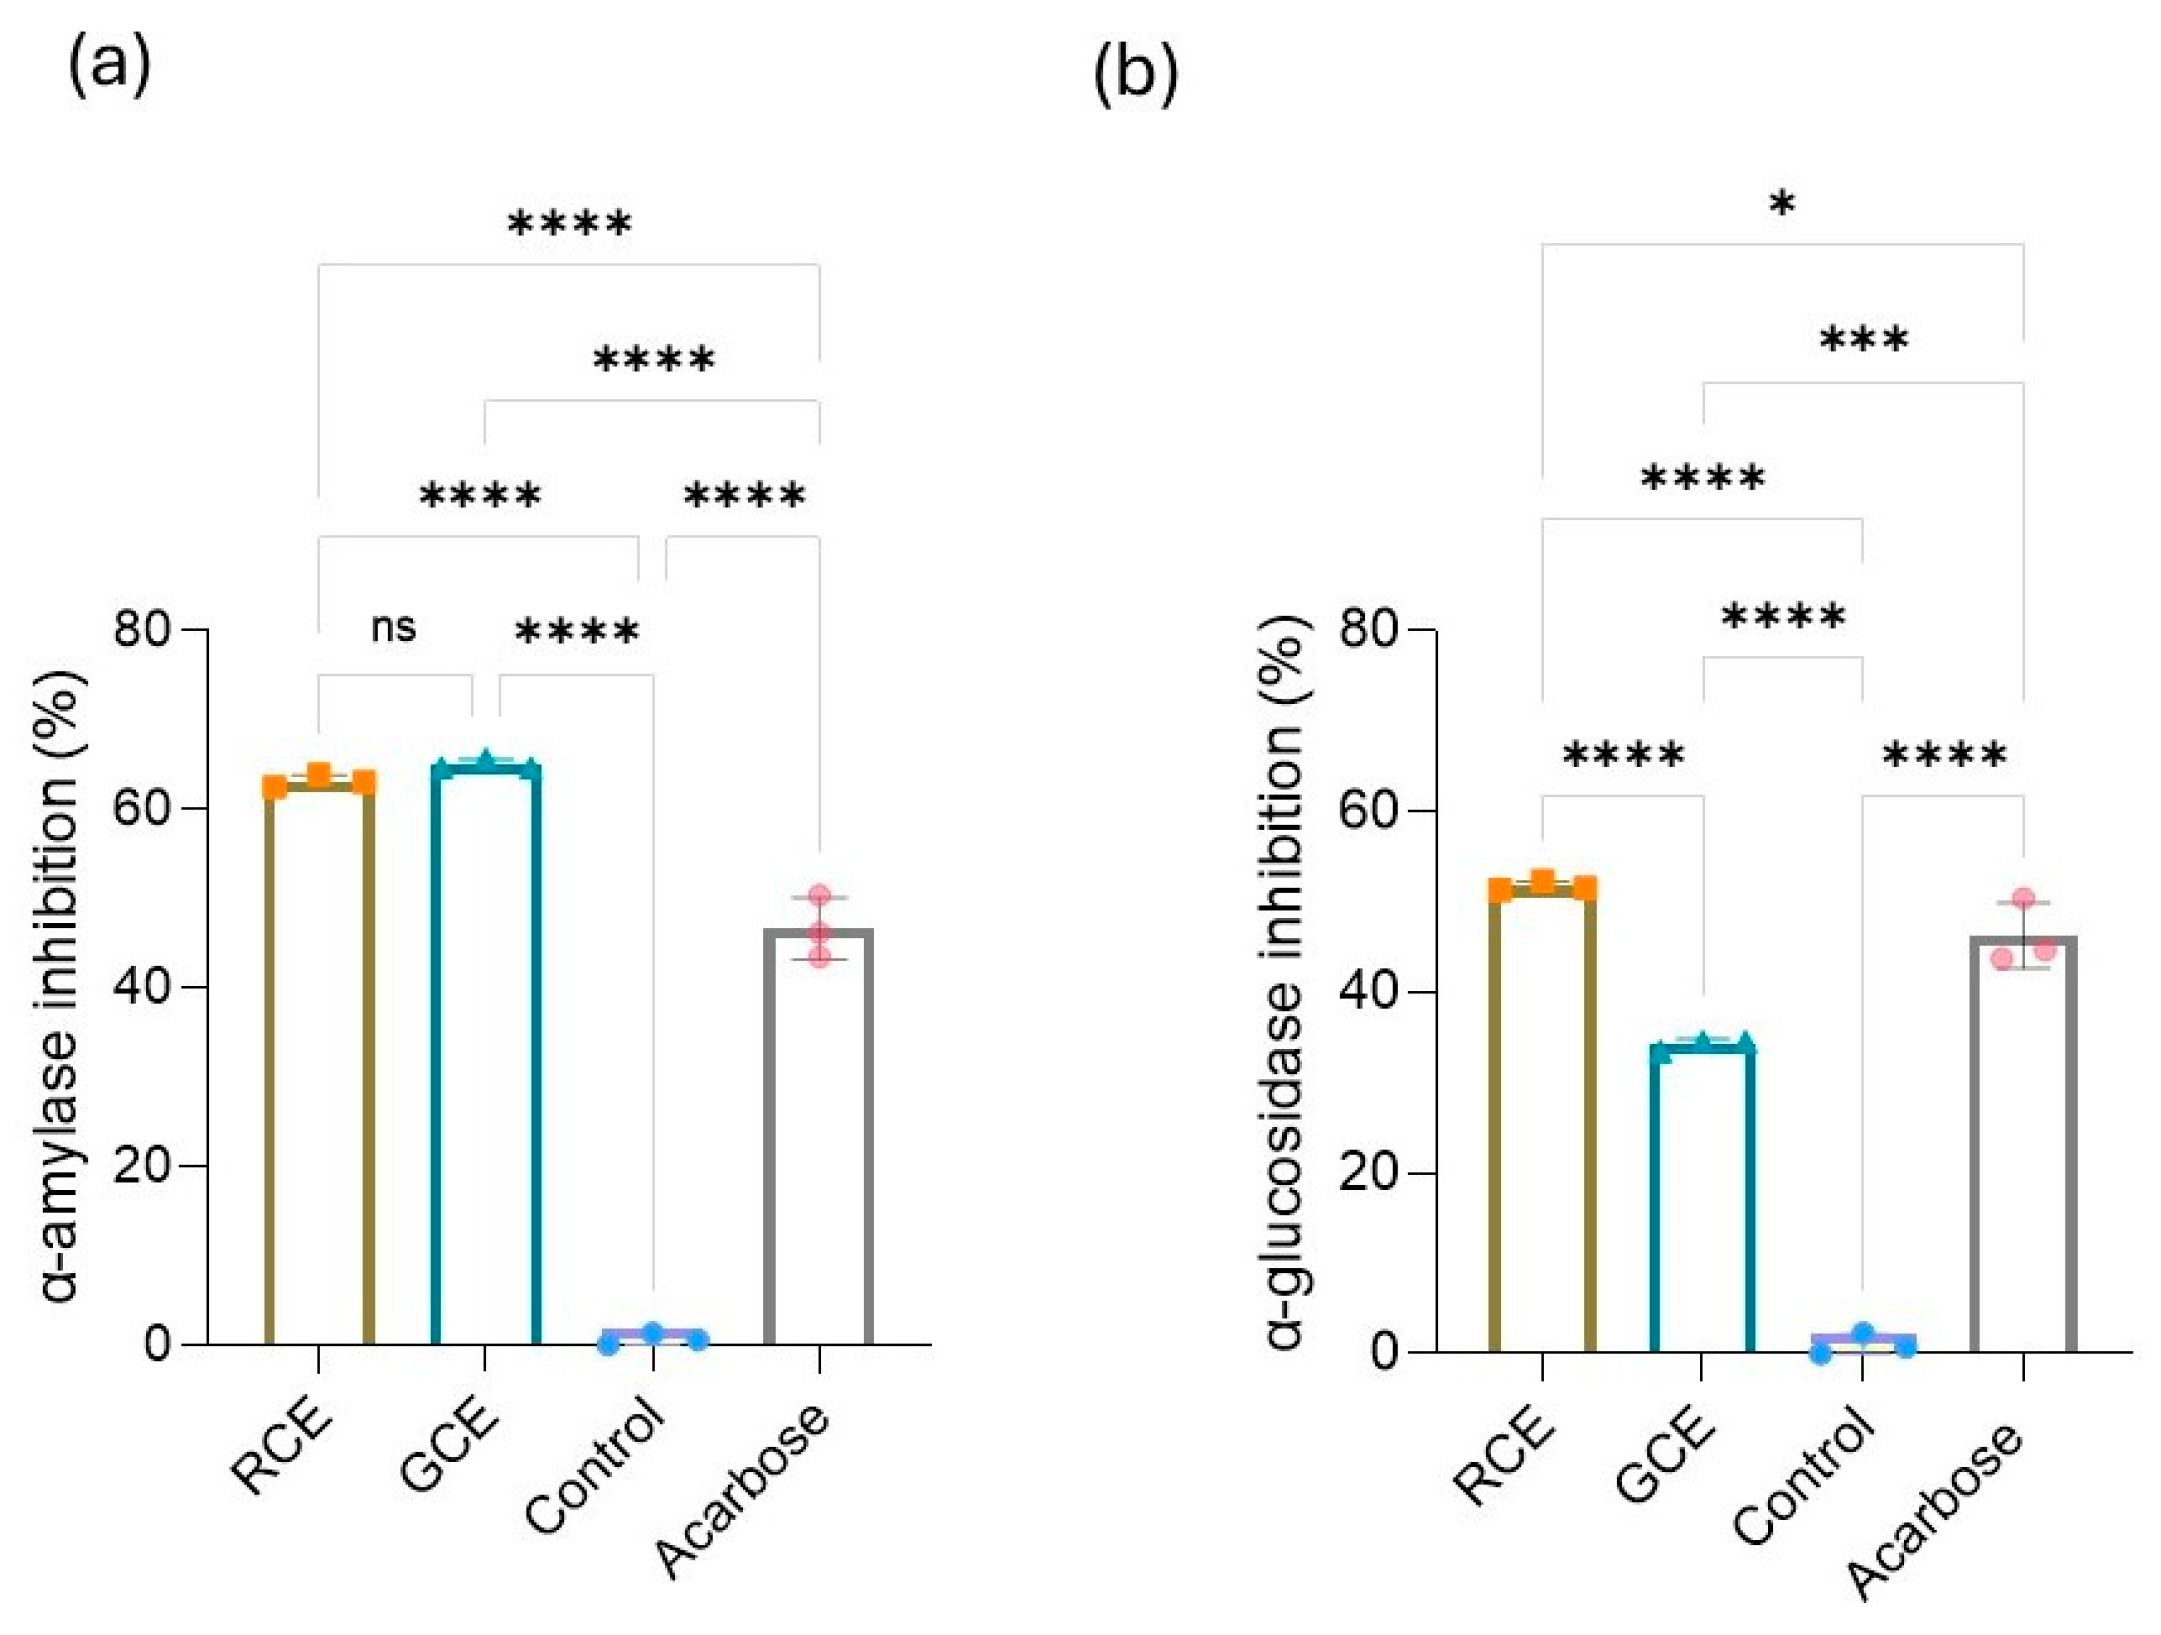
3.4. Effect of Coffee Extracts on Carbohydrate-Cleavage Enzymes

Improvements in cellular glucose uptake and the slowing down of carbohydrate metabolism are key factors in regulating blood sugar levels and preventing metabolic disorders such as diabetes. Carbohydrate-cleavage enzymes are responsible for breaking down complex carbohydrates into simpler sugars, improving bioavailability in the digestive system. However, because of insulin impairment in diabetic patients, glucose uptake systems are aberrated, implying post-meal blood sugar spikes. Some treatments for diabetes aim to inhibit certain carbohydrate-digesting enzymes such as α-amylase and α-glucosidase to slow down carbohydrate breakdown, thus reducing the post-meal hyperglycaemia [45].
In order to evaluate GCE and RCE as potential nutraceuticals to control post-meal hyperglycaemia and slow down carbohydrates digestion, their inhibitory effects over α-amylase and α-glucosidase activity were examined and compared to the commercial T2D treatment, acarbose. The concentration of the control drug used was 2 mg/mL, since this is the maximal concentration previously tested by other authors [31,45,46]
Concentrations of 5% (v/v) of extracts were selected on the basis of their effect on the growth of probiotic strains, as described in Section 3.3. As shown in Figure 3a, α-amylase inhibition rates after treatment do not exhibit significant differences among extracts. Similar inhibition rates were achieved after exposition to 5% RCE (63%) and to 5% GCE (65%), which are higher than those obtained with acarbose (46%). Regarding α-glucosidase inhibition, a remarkable inactivation was observed when RCE was assayed, with the inhibition being higher than 50% (Figure 3b). However, only 35% of inhibition was achieved by GCE. Acarbose inhibits the enzyme by 44%, with this inhibition being significatively inferior to the one provided by RCE, although higher than the one obtained with GCE. No inhibition activity was observed with the control solvent. The previous findings suggest that the different molecules present in both extracts may determine different binding affinities to the enzymes action sites. The results also show that, while GCE seems to be more efficient as a prebiotic by promoting LAB growth, as reported in Section 3.3, RCE presents higher activity as an enzyme inhibitor, being even more effective than commercial T2D treatments.

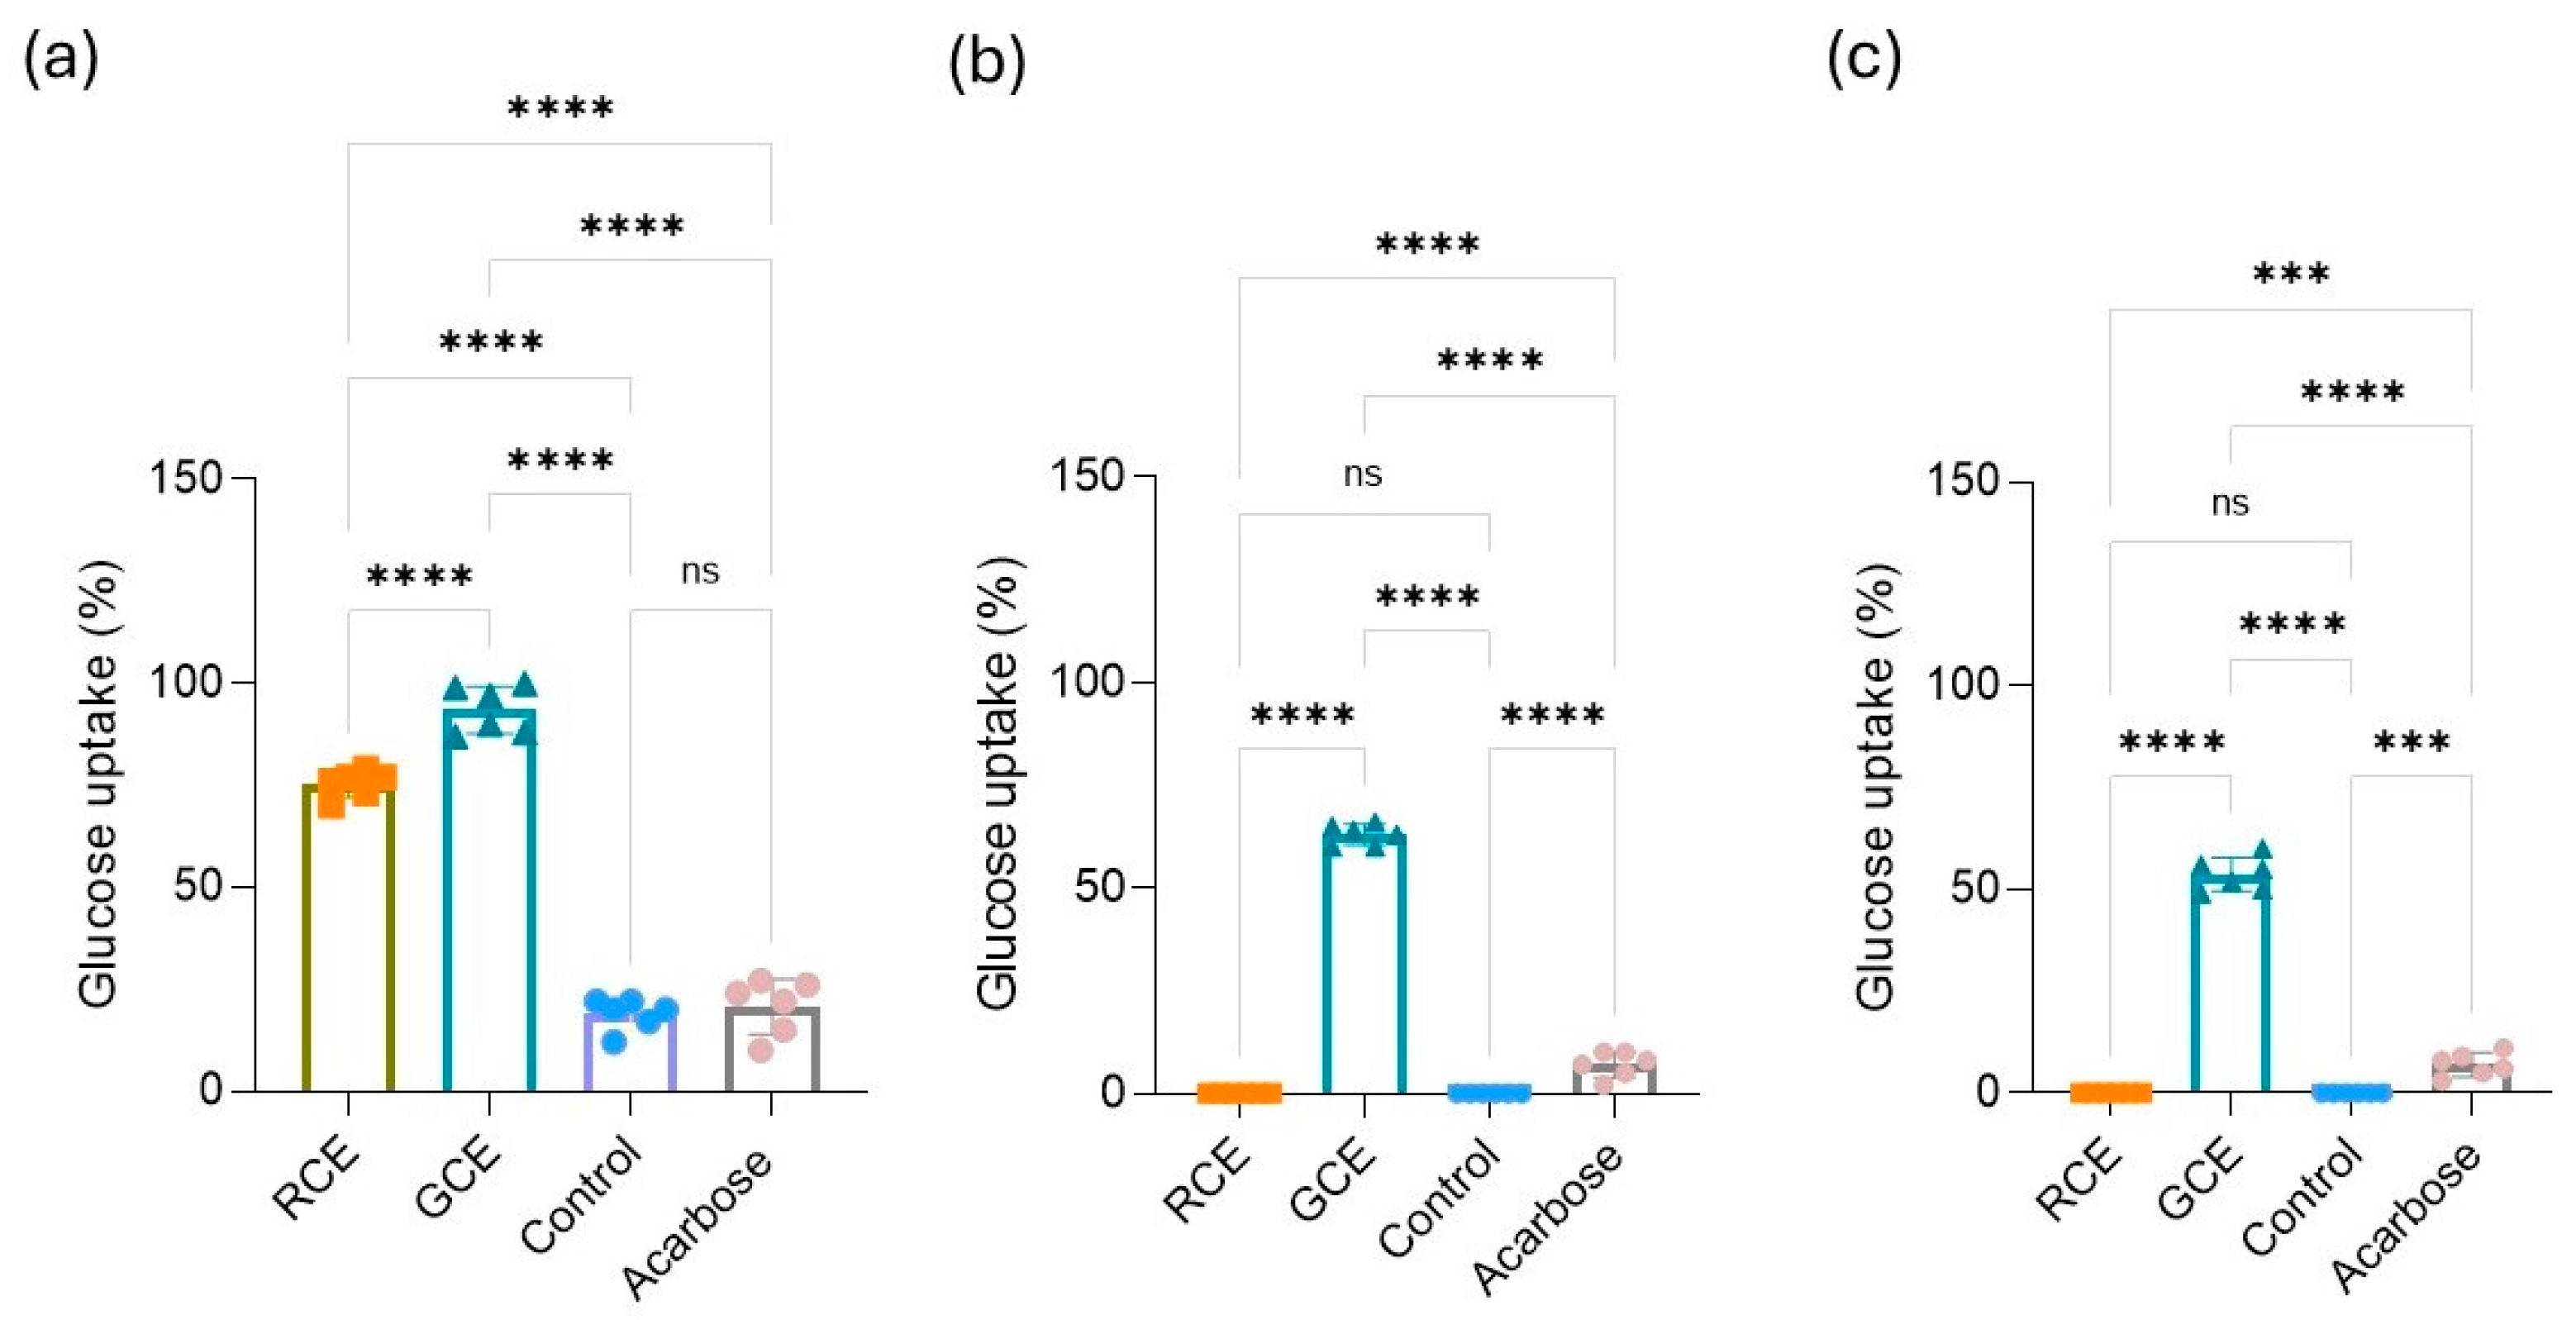
3.5. Modulation of Glucose Cell Uptake

The yeast glucose assay is an in vitro laboratory method that evaluates yeasts’ natural ability to metabolize glucose, allowing for the study of some aspects of glucose metabolism, such as uptake rates [6]. This method is employed to preliminarily evaluate the potential role of enhancers or inhibitors of glucose transporters, such as GLUT2 and GLUT4 [47,48], which are detrimental to glucose cellular intake. Here, 5% of GCE and RCE were evaluated as modulators of yeast glucose uptake in order to screen the potential role of both extracts on T2D management. Furthermore, 5% of the extraction solvent was used as a control. Our preliminary results suggest that both extracts enhance glucose transport, and this uptake is dependent on the concentration of glucose. Low concentrations of glucose (5 mM) seemed to be efficiently transported when exposed to 5% of extracts, especially GCE, with an uptake rate of nearly 90%. Additionally, 77% of uptake was achieved in the presence of RCE, and only 20% in the presence of the extraction solvent or acarbose (Figure 4a). However, at higher concentrations of glucose (10 mM and 25 mM), the effect diminishes, suggesting a possible dose-dependent response. RCE does not have a significant impact on the glucose uptake at high concentrations, similarly to the untreated sample. No uptake stimulation was observed with the extraction solvent, and only 7% was observed with 2 mg/mL of acarbose (Figure 4b,c). Although all the values diminished in the presence of high concentrations of glucose, the treatment with GCE maintains much of its effectiveness. The data presented above suggest that GCE could be a potential coadjutant in strategies focused on the enhancement of glucose cellular uptake.

4. Discussion

The phytochemical composition of coffee varies significantly depending on the way of processing and roasting the coffee beans, as well as on the method used for the extraction and beverage production [49]. After drying and fermentation processes, green beans are normally roasted, enhancing their aroma and flavour. However, the roasting process has been associated with the appearance of certain toxic compounds [50] and the degradation of beneficial ones [51]. Big differences exist among the phenolic acid composition of green and roasted coffee, especially in the case of hydroxycinnamic acids such as chlorogenic acid [27]. This phenolic molecule has been detected in higher concentrations in green coffee extracts, suggesting their degradation or transformation during the roasting process [22]. Indeed, phenolic compound transformation during coffee production was previously described by Fathy M. Mehaya [52]. These authors observed chlorogenic acid degradation from 34.2 to 2.6 mg/g of sample during roasting at 220 °C for 40 min. However, gallic acid and caffeic acid increased at the beginning of the roasting process and decreased afterwards. Similar results were obtained by Marilu Mestanza et al. during their study of the polyphenolic composition of arabica coffee varieties and their antioxidant stability during roasting [51]. During our research, no significant differences between the total phenol composition of the extracts was observed, this being a consequence of the Folin–Ciocalteu method underdetermination, probably due to interferences with other compounds. It is hypothesized that sugars extracted from the beans are the main reason for Folin–Ciocalteu reagent interference. The same situation was reported by Lawag et al. [38] during their assessment of the phenolic content in honey samples. The total flavonoid and tannic content assays, present in higher proportion in roasted coffee extracts, suggest a biotransformation of the compounds rather than degradation and loss after roasting. Indeed, De Souza et al. observed little variation in the total phenolic content between green coffee and lightly roasted coffee, but a dramatic reduction was observed in black roasted beans [53], suggesting that the degree of roasting is important in the degradation of phenolic compounds. Mesfin et al. evaluated the phytochemical profile of green coffee bean extracts obtained through a wet processing method before and after yeast fermentation [54]. These authors observed that the values of the TPC, TFC, and TTC for their green coffee extracts were similar, at around 600 µg/mL. In our research, differences between polyphenol groups were observed, with tannins exhibiting the lowest value detected, especially in GCE. Regarding roasted coffee, Gobbi et al. [55] analyzed eight coffee powders and beverages of Arabica variety, observing an average TPC concentration of 25 mg GAE/g coffee powder and a TFC of 92 mg RE/g coffee powder. These data align with the values reported in this study, with the TFC being higher than TPC, especially in roasted coffee.
The values of the antioxidant activity of the extracts in relation to their phytochemical composition suggest that both extracts present highly antioxidant compounds, but these occur in slightly different proportions. Previous research performed by Priftis et al. showed a positive correlation between the TPC and the antioxidant activity in both roasted and green coffee beans, with a higher value of total polyphenols and, therefore, higher levels of antioxidant activity detected for the green ones [56]. These results suggest that the phytochemical content is important for the antioxidant performance of coffee extracts, with phenolic acids presenting the most antioxidant compounds. In addition to the phytochemical content, melanoidins, dietary fiber, carbohydrates, and caffeine are also important for the bioactivities of coffee extracts [22].
Machado et al. recently reviewed the role of coffee by-products as prebiotics, supporting their role in the balance of the gut microbiota [57]. Even though prebiotics are mainly defined as insoluble carbohydrates, recent research has enhanced the role of phenolic compounds as fermentable products and prebiotics [58]. As phenolic compounds are usually linked to difficult-to-digest fibrous components, they can enter the colon and act as a substrate for the microbiota. Stalmach et al. observed that 70% of chlorogenic acid from coffee passes from the small intestine to the large intestine, where it is exposed to the biotransformation of the colonic microbiota [59]. Filannino et al. defined the ability of lactic acid bacteria to metabolize phenolic acid by specific decarboxylases and/or reductase [60]. This evidence supports the overgrowth results observed when the Lactobacillus strains used in this study were exposed to different concentrations of coffee extracts, especially GCE. Additionally, other non-phenolic compounds present in the extracts may be fermented by probiotic strains, which contributes to the bacterial growth.
The antidiabetic activity of the coffee extracts observed during this study could be linked to the phenolic acids and their degradation products formed during roasting [24]. It has been reported that these compounds affect the intestinal absorption of glucose by the inhibition of the glucose transporter protein, glucose-6-phosphate translocase-1 [61], and can also reduce the hepatic glucose via the inhibition of the glucose-6 phosphatase [62].
Flavonoids have also shown antidiabetic effects by targeting cellular signalling pathways, influencing β-cell function, insulin sensitivity, and energy metabolism. Some studies that evaluated the role of flavonoids in glucose homeostasis related their anti-diabetic effects to their antioxidant and enzyme inhibitory activity [31,63]. The same results were obtained in this research where we have described how GCE and RCE inhibit carbohydrate cleavage enzymes, with RCE being more efficient for this purpose, even outperforming a commercial T2D treatment. To our knowledge, no previous comparative studies on the antidiabetic potential of green and roasted coffee have been conducted. However, effective digestive enzyme inhibition caused by roasted coffee was assessed by Acharaporn Duangjai et al., proposing that roasted coffee can act as a good coadjutant against hyperglycaemia by inhibiting the activity of α-amylase and α-glucosidase [36].
Furthermore, our extracts seem to enhance glucose uptake by yeast cells, which is an in vitro preliminary approach to other eukaryotic or human body cells. The transport of glucose through the yeast membrane may be affected by several variables, and it differs from the mechanisms found in other eukaryotic cells which use glucose transporters such as GLUT2 and GLUT4. Glucose intake is mediated by the passive diffusion of yeast glucose transporters inside the cells, but it also depends on the speed of metabolization. The faster the cells metabolize the glucose transported inside them, the higher the rate of cell uptake, with subsequent reductions in free glucose [6]. Only GCE seems to affect the yeast’s glucose uptake at the highest glucose concentrations assayed (10 mM and 25 mM). RCE does not have a significant impact on the glucose uptake at high concentrations, which is similar in treated and untreated samples. These data suggest that GCE could both facilitate glucose diffusion and enhance glucose metabolism, outlining its potential use as a coadjutant in strategies focused on the enhancement of glucose cellular uptake.
The data presented in this study suggest that green coffee beans are a valuable source of bioactive compounds, with a potential effect on gut microbiota modulation and glucose balance. Future experiments to validate the gastrointestinal stability of the extracts and in vitro studies using mammalian cells should be performed in order to uncover the mechanisms of glucose intake regulation and decipher their potential in the food and pharmacological industries as nutraceuticals or preventive treatments for T2D.

5. Conclusions

This research highlights the promising potential of green and roasted coffee extracts in T2D management by mainly addressing two strategies: gut microbiota modulation and glucose metabolism regulation. The prebiotic activity of green coffee extracts suggests that green coffee is suitable for promoting the growth of beneficial intestinal bacteria, while its ability to enhance glucose uptake highlights it as a potential adjunct in T2D management. Additionally, the stronger enzyme inhibition observed in RCE supports its role in delaying carbohydrate breakdown, potentially preventing post-meal glucose spikes. Further phytochemical characterization should be performed in order to assess green and roasted coffee prebiotic and antidiabetic key compounds. Future research in vivo should focus on assessing the compounds’ bioavailability and validating these preliminary prebiotic and antidiabetic effects. Regarding their dual benefits, these coffee extracts could be further explored for their inclusion as functional foods or pharmaceuticals targeting diabetes prevention and control.

Author Contributions

Conceptualization, L.G.C., V.d.M.V., V.D.-T., F.J.O.E. and T.d.M.; methodology, L.G.C., V.d.M.V. and V.D.-T.; software, L.G.C. and V.d.M.V.; validation, L.G.C., V.d.M.V. and V.D.-T.; formal analysis, L.G.C. and V.d.M.V.; investigation, L.G.C., V.d.M.V., V.D.-T., F.J.O.E. and T.d.M.; resources, V.d.M.V., F.J.O.E. and T.d.M.; data curation, L.G.C., V.d.M.V., V.D.-T., F.J.O.E. and T.d.M.; writing—original draft preparation, L.G.C. and V.d.M.V.; writing—review and editing, T.d.M.; visualization, L.G.C.; supervision, V.D.-T., F.J.O.E. and T.d.M. All authors have read and agreed to the published version of the manuscript.

Funding

This research received no external funding.

Data Availability Statement

Data will be available on request to the corresponding author.

Acknowledgments

We would like to thank Pedro Tanoira from Atlántico Specialty Coffee S.L (Mori Café) for supplying the green and roasted Brazilian coffee beans. Additionally, we would like to extend our gratitude to the company ETNOGAL S.L for providing the coffee extracts. Victoria Díaz-Tomé acknowledges Consellería de Cultura, Educación e Universidade for her Postdoctoral Fellowships (Xunta de Galicia, Spain; ED481B-2023-092)).

Conflicts of Interest

Vinicius de Monte Vidal is an employee of ETNOGAL SL.

References

  1. Mergenthaler, P.; Lindauer, U.; Dienel, G.A.; Meisel, A. Sugar for the brain: The role of glucose in physiological and pathological brain function. Trends Neurosci. 2013, 36, 10. [Google Scholar] [CrossRef] [PubMed]
  2. Gillespie, K.M.; Kemps, E.; White, M.J.; Bartlett, S.E. The Impact of Free Sugar on Human Health-A Narrative Review. Nutrients 2023, 15, 4. [Google Scholar] [CrossRef]
  3. Goyal, R.; Singhal, M.; Jialal, I. Type 2 Diabetes; StatPearl: Petersburg, FL, USA, 2025. Available online: https://www.ncbi.nlm.nih.gov/books/NBK513253/ (accessed on 23 June 2023).
  4. Institute for Quality and Efficiency in Health Care (IQWiG). Overview: Type 2 Diabetes. In Informed Health; Institute for Quality and Efficiency in Health Care (IQWiG): Cologne, Germany, 2006. Available online: https://www.ncbi.nlm.nih.gov/books/NBK279509/ (accessed on 18 December 2023).
  5. Smith, J.; Doe, A.; Johnson, L. The impact of diet on type 2 diabetes management. Lancet Diabetes Endocrinol. 2024, 12, 5. [Google Scholar]
  6. Rehman, G.; Hamayun, M.; Iqbal, A.; Ul Islam, S.; Arshad, S.; Zaman, K.; Ahmad, A.; Shehzad, A.; Hussain, A.; Lee, I. In Vitro Antidiabetic Effects and Antioxidant Potential of Cassia nemophila Pods. BioMed Res. Int. 2018, 2018, 1824790. [Google Scholar] [CrossRef] [PubMed]
  7. Salas-Salvadó, J.; Martinez-González, M.Á.; Bulló, M.; Ros, E. The role of diet in the prevention of type 2 diabetes. Nutr. Metab. Cardiovasc. Dis. 2011, 21, B32–B48. [Google Scholar] [CrossRef] [PubMed]
  8. Ardisson Korat, A.V.; Willett, W.C.; Hu, F.B. Diet, lifestyle, and genetic risk factors for type 2 diabetes: A review from the Nurses’ Health Study, Nurses’ Health Study 2, and Health Professionals’ Follow-up Study. Curr. Nutr. Rep. 2014, 3, 4. [Google Scholar] [CrossRef]
  9. Martín-Peláez, S.; Fito, M.; Castaner, O. Mediterranean diet effects on type 2 diabetes prevention, disease progression, and related mechanisms. A review. Nutrients 2020, 12, 8. [Google Scholar] [CrossRef]
  10. Jagadeesan, G.; Muniyandi, K.; Manoharan, A.L.; Nataraj, G.; Thangaraj, P. Understanding the bioaccessibility, α-amylase and α-glucosidase enzyme inhibition kinetics of Allmania nodiflora (L.) R.Br. ex Wight polyphenols during in vitro simulated digestion. Food Chem. 2022, 372, 131294. [Google Scholar] [CrossRef]
  11. Iatcu, C.O.; Steen, A.; Covasa, M. Gut microbiota and complications of type-2 diabetes. Nutrients 2021, 14, 1. [Google Scholar] [CrossRef]
  12. Yang, C.-Y.; Yen, Y.-Y.; Hung, K.-C.; Hsu, S.-W.; Lan, S.-J.; Lin, H.-C. Inhibitory effects of pu-erh tea on alpha glucosidase and alpha amylase: A systemic review. Nutr. Diabetes 2019, 9, 23. [Google Scholar] [CrossRef]
  13. Poovitha, S.; Parani, M. In vitro and in vivo α-amylase and α-glucosidase inhibiting activities of the protein extracts from two varieties of bitter gourd (Momordica charantia L.). BMC Complement. Altern. Med. 2016, 16, 185. [Google Scholar] [CrossRef]
  14. Holman, R.R.; Cull, C.A.; Turner, R.C. A randomized double-blind trial of acarbose in type 2 diabetes shows improved glycemic control over 3 years (UK Prospective Diabetes Study 44). Diabetes Care 1999, 22, 960–964. [Google Scholar] [CrossRef]
  15. Rowland, I.; Gibson, G.; Heinken, A.; Scott, K.; Swann, J.; Thiele, I.; Tuohy, K. Gut microbiota functions: Metabolism of nutrients and other food components. Eur. J. Nutr. 2018, 57, 1–24. [Google Scholar] [CrossRef] [PubMed]
  16. Takeuchi, T.; Kubota, T.; Nakanishi, Y.; Tsugawa, H.; Suda, W.; Kwon, A.T.-J.; Yazaki, J.; Ikeda, K.; Nemoto, S.; Mochizuki, Y.; et al. Gut microbial carbohydrate metabolism contributes to insulin resistance. Nature 2023, 621, 389–395. [Google Scholar] [CrossRef] [PubMed]
  17. Sharma, S.; Tripathi, P. Gut microbiome and type 2 diabetes: Where we are and where to go? J. Nutr. Biochem. 2019, 63, 101–108. [Google Scholar] [CrossRef] [PubMed]
  18. Lee, H.; Yoon, S.; Park, Y.H.; Lee, J.-S.; Rhyu, D.Y.; Kim, K.-T. Microbiota dysbiosis associated with type 2 diabetes-like effects caused by chronic exposure to a mixture of chlorinated persistent organic pollutants in zebrafish. Environ. Pollut. 2023, 334, 122108. [Google Scholar] [CrossRef]
  19. Wang, G.; Si, Q.; Yang, S.; Jiao, T.; Zhu, H.; Tian, P.; Wang, L.; Li, X.; Gong, L.; Zhao, J.; et al. Lactic acid bacteria reduce diabetes symptoms in mice by alleviating gut microbiota dysbiosis and inflammation in different manners. Food Funct. 2020, 11, 5898–5914. [Google Scholar] [CrossRef]
  20. Yan, F.; Li, N.; Shi, J.; Li, H.; Yue, Y.; Jiao, W.; Wang, N.; Song, Y.; Huo, G.; Li, B. Lactobacillus acidophilus alleviates type 2 diabetes by regulating hepatic glucose, lipid metabolism and gut microbiota in mice. Food Funct. 2019, 10, 5804–5815. [Google Scholar] [CrossRef]
  21. Chen, S.; Zhang, Y. Mechanism and application of Lactobacillus in type 2 diabetes-associated periodontitis. Front Public Health 2023, 11, 1248518. [Google Scholar] [CrossRef]
  22. Sarriá, B.; Martínez-López, S.; Mateos, R.; Bravo-Clemente, L. Long-term consumption of a green/roasted coffee blend positively affects glucose metabolism and insulin resistance in humans. Food Res. Int. 2016, 89, 1023–1028. [Google Scholar] [CrossRef]
  23. Gamboa-Gómez, C.I.; Morales-Castro, J.; Barragan-Zuñiga, J.; Herrera, M.D.; Zamilpa-Álvarez, A.; González, J.L.; Martínez-Aguilar, G.; Morales-Castro, E.P.; Anese, M.; Alongi, M. Influence of coffee roasting degree on antioxidant and metabolic parameters: Comprehensive in vitro and in vivo analysis. Curr. Res. Food Sci. 2024, 9, 100861. [Google Scholar] [CrossRef]
  24. Van Dam, R.M. Coffee and type 2 diabetes: From beans to beta-cells. Nutr. Metab. Cardiovasc. Dis. 2006, 16, 69–77. [Google Scholar] [CrossRef] [PubMed]
  25. Akash, M.S.H.; Rehman, K.; Chen, S. Effects of coffee on type 2 diabetes mellitus. Nutrition 2014, 30, 755–763. [Google Scholar] [CrossRef] [PubMed]
  26. Pereira, M.A.; Parker, E.D.; Folsom, A.R. Coffee consumption and risk of type 2 diabetes mellitus: An 11-year prospective study of 28,812 postmenopausal women. Arch. Intern. Med. 2006, 166, 1311–1316. [Google Scholar] [CrossRef] [PubMed]
  27. Liczbiński, P.; Bukowska, B. Tea and coffee polyphenols and their biological properties based on the latest in vitro investigations. Ind. Crops. Prod. 2022, 175, 114265. [Google Scholar] [CrossRef]
  28. Palmieri, M.G.S.; Cruz, L.T.; Bertges, F.S.; Húngaro, H.M.; Batista, L.R.; Silva, S.S.; Fonseca, M.J.V.; Rodarte, M.P.; Vilela, F.M.P.; Amaral, M.P.H. Enhancement of antioxidant properties from green coffee as promising ingredient for food and cosmetic industries. Biocatal. Agric. Biotechnol. 2018, 16, 43–48. [Google Scholar] [CrossRef]
  29. Delgado-Andrade, C.; Rufián-Henares, J.A.; Morales, F.J. Assessing the antioxidant activity of melanoidins from coffee brews by different antioxidant methods. J. Agric. Food Chem. 2005, 53, 7832–7836. [Google Scholar] [CrossRef]
  30. Awwad, S.; Issa, R.; Alnsour, L.; Albals, D.; Al-Momani, I. Quantification of caffeine and chlorogenic acid in green and roasted coffee samples using HPLC-DAD and evaluation of the effect of degree of roasting on their levels. Molecules 2021, 26, 7502. [Google Scholar] [CrossRef]
  31. Li, K.; Yao, F.; Xue, Q.; Fan, H.; Yang, L.; Li, X.; Sun, L.; Liu, Y. Inhibitory effects against α-glucosidase and α-amylase of the flavonoids-rich extract from Scutellaria baicalensis shoots and interpretation of structure–activity relationship of its eight flavonoids by a refined assign-score method. Chem. Cent. J. 2018, 12, 82. [Google Scholar] [CrossRef]
  32. Barbosa-Pereira, L.; Guglielmetti, A.; Zeppa, G. Pulsed electric field assisted extraction of bioactive compounds from cocoa bean shell and coffee silverskin. Food Bioprocess Technol. 2018, 11, 818–835. [Google Scholar] [CrossRef]
  33. Jia, Z.; Tang, M.; Wu, J. The determination of flavonoid contents in mulberry and their scavenging effects on superoxide radicals. Food Chem. 1999, 64, 555–559. [Google Scholar]
  34. Calvo, L.G.; Villarino, R.A.; Rama, J.L.R.; Abril, A.G.; de Miguel, T. A modification of the resazurin cell viability assay, suitable for the quantification of lactic acid producing bacteria. LWT 2025, 215, 117259. [Google Scholar] [CrossRef]
  35. Cirillo, V.P. Mechanism of glucose transport across the yeast cell membrane. J. Bacteriol. 1962, 84, 485–491. [Google Scholar] [CrossRef] [PubMed]
  36. Duangjai, A.; Trisat, K.; Saokaew, S. Effect of roasting degree, extraction time, and temperature of coffee beans on anti-hyperglycaemic and anti-hyperlipidaemic activities using ultrasound-assisted extraction. Prev. Nutr. Food Sci. 2021, 26, 338–345. [Google Scholar] [CrossRef]
  37. Ali, A.; Zahid, H.F.; Cottrell, J.J.; Dunshea, F.R. A comparative study for nutritional and phytochemical profiling of Coffea arabica (C. arabica) from different origins and their antioxidant potential and molecular docking. Molecules 2022, 27, 16. [Google Scholar] [CrossRef]
  38. Lawag, I.L.; Nolden, E.S.; Schaper, A.A.M.; Lim, L.Y.; Locher, C. A modified Folin-Ciocalteu assay for the determination of total phenolics content in honey. Appl. Sci. 2023, 13, 4. [Google Scholar] [CrossRef]
  39. Bonitati, J.; Elliott, W.B.; Miles, P.G. Interference by carbohydrate and other substances in the estimation of protein with the Folin-Ciocalteu reagent. Anal. Biochem. 1969, 31, 399–404. [Google Scholar] [CrossRef]
  40. Shafras, M.; Sabaragamuwa, R.; Suwair, M. Role of dietary antioxidants in diabetes: An overview. Food Chem. Adv. 2024, 4, 100666. [Google Scholar] [CrossRef]
  41. Rudrapal, M.; Khairnar, S.J.; Khan, J.; Dukhyil, A.B.; Ansari, M.A.; Alomary, M.N.; Alshabrmi, F.M.; Palai, S.; Deb, P.K.; Devi, R. Dietary polyphenols and their role in oxidative stress-induced human diseases: Insights into protective effects, antioxidant potentials, and mechanism(s) of action. Front Pharmacol. 2022, 13, 806470. [Google Scholar] [CrossRef]
  42. Kumar, S.; Sandhir, R.; Ojha, S. Evaluation of antioxidant activity and total phenol in different varieties of Lantana camara leaves. BMC Res. Notes 2014, 7, 1–9. [Google Scholar] [CrossRef]
  43. Paixão, N.; Perestrelo, R.; Marques, J.C.; Câmara, J.S. Relationship between antioxidant capacity and total phenolic content of red, rosé and white wines. Food Chem. 2007, 105, 204–214. [Google Scholar] [CrossRef]
  44. Szajewska, H.; Scott, K.P.; de Meij, T.; Forslund-Startceva, S.K.; Knight, R.; Koren, O.; Little, P.; Johnston, B.C.; Łukasik, J.; Suez, J.; et al. Antibiotic-perturbed microbiota and the role of probiotics. Nat. Rev. Gastroenterol. Hepatol. 2025, 22, 155–172. [Google Scholar] [CrossRef] [PubMed]
  45. Telagari, M.; Hullatti, K. In-vitro α-amylase and α-glucosidase inhibitory activity of Adiantum caudatum Linn. and Celosia argentea Linn. extracts and fractions. Indian J. Pharmacol. 2015, 47, 425–429. [Google Scholar] [PubMed]
  46. Lankatillake, C.; Luo, S.; Flavel, M.; Lenon, G.B.; Gill, H.; Huynh, T.; Dias, D.A. Screening natural product extracts for potential enzyme inhibitors: Protocols, and the standardisation of the usage of blanks in α-amylase, α-glucosidase and lipase assays. Plant Methods 2021, 17, 3. [Google Scholar] [CrossRef]
  47. Leto, D.; Saltiel, A. Regulation of glucose transport by insulin: Traffic control of GLUT4. Nat. Rev. Mol. Cell Biol. 2012, 13, 383–396. [Google Scholar] [CrossRef]
  48. Brown, G.K. Glucose transporters: Structure, function and consequences of deficiency. J. Inherit. Metab. Dis. 2000, 23, 237–246. [Google Scholar] [CrossRef]
  49. Murthy, P.S.; Naidu, M.M. Sustainable management of coffee industry by-products and value addition—A review. Resour. Conserv. Recycl. 2012, 66, 45–58. [Google Scholar] [CrossRef]
  50. Strocchi, G.; Rubiolo, P.; Cordero, C.; Bicchi, C.; Liberto, E. Acrylamide in coffee: What is known and what still needs to be explored. A review. Food Chem. 2022, 393, 133406. [Google Scholar] [CrossRef]
  51. Mestanza, M.; Mori-Culqui, P.L.; Chavez, S.G. Changes of Polyphenols and Antioxidants of Arabica Coffee Varieties during Roasting. Front. Nutr. 2023, 10, 1078701. [Google Scholar] [CrossRef] [PubMed]
  52. Mehaya, F.M.; Mohammad, A.A. Thermostability of Bioactive Compounds During Roasting Process of Coffee Beans. Heliyon 2020, 6, e05508. [Google Scholar] [CrossRef]
  53. Souza Ldos, S.; Horta, I.P.C.; de Souza Rosa, L.; Lima, L.G.; da Rosa, J.S.; Montenegro, J.; da Silva Santos, L.; de Castro, R.B.; Freitas-Silva, O.; Teodoro, A.J. Effect of the roasting levels of Coffea arabica L. extracts on their potential antioxidant capacity and antiproliferative activity in human prostate cancer cells. RSC Adv. 2020, 10, 30115–30126. [Google Scholar] [CrossRef] [PubMed]
  54. Haile, M.; Kang, W.H. Antioxidant Activity, Total Polyphenol, Flavonoid and Tannin Contents of Fermented Green Coffee Beans with Selected Yeasts. Fermentation 2019, 5, 29. [Google Scholar] [CrossRef]
  55. Gobbi, L.; Maddaloni, L.; Prencipe, S.A.; Vinci, G. Bioactive Compounds in Different Coffee Beverages for Quality and Sustainability Assessment. Beverages 2023, 9, 3. [Google Scholar] [CrossRef]
  56. Priftis, A.; Stagos, D.; Konstantinopoulos, K.; Tsitsimpikou, C.; Spandidos, D.A.; Tsatsakis, A.M.; Tzatzarakis, M.N.; Kouretas, D. Comparison of antioxidant activity between green and roasted coffee beans using molecular methods. Mol. Med. Rep. 2015, 12, 7293–7302. [Google Scholar] [CrossRef]
  57. Machado, M.; Ferreira, H.; Oliveira, M.B.P.P.; Alves, R.C. Coffee by-products: An underexplored source of prebiotic ingredients. Crit. Rev. Food Sci. Nutr. 2024, 64, 7181–7200. [Google Scholar] [CrossRef]
  58. Piekarska-Radzik, L.; Klewicka, E. Mutual influence of polyphenols and Lactobacillus spp. bacteria in food: A review. Eur. Food Res. Technol. 2021, 247, 9–24. [Google Scholar] [CrossRef]
  59. Stalmach, A.; Steiling, H.; Williamson, G.; Crozier, A. Bioavailability of chlorogenic acids following acute ingestion of coffee by humans with an ileostomy. Arch. Biochem. Biophys. 2010, 501, 98–105. [Google Scholar] [CrossRef]
  60. Filannino, P.; Cardinali, G.; Rizzello, C.G.; Buchin, S.; De Angelis, M.; Gobbetti, M.; Di Cagno, R. Metabolic Responses of Lactobacillus plantarum Strains during Fermentation and Storage of Vegetable and Fruit Juices. Appl. Environ. Microbiol. 2014, 80, 2206–2215. [Google Scholar] [CrossRef]
  61. McCarty, M.F. A chlorogenic acid-induced increase in GLP-1 production may mediate the impact of heavy coffee consumption on diabetes risk. Med. Hypotheses 2005, 64, 848–853. [Google Scholar] [CrossRef]
  62. Arion, W.J.; Canfield, W.K.; Ramos, F.C.; Schindler, P.W.; Burger, H.J.; Hemmerle, H.; Schubert, G.; Below, P.; Herling, A. W Chlorogenic acid and hydroxynitrobenzaldehyde: New inhibitors of hepatic glucose 6-phosphatase. Arch. Biochem. Biophys. 1997, 339, 315–322. [Google Scholar] [CrossRef]
  63. Anandh Babu, P.V.; Liu, D.; Gilbert, E.R. Recent advances in understanding the anti-diabetic actions of dietary flavonoids. J. Nutr. Biochem. 2013, 24, 1777–1789. [Google Scholar] [CrossRef]
Figure 1. (a) Total phenolic content determination in GCE and RCE. (b) Total tannin determination in GCE and RCE. (c) Total flavonoid content determination in GCE and RCE. (d) Antioxidant activity by DPPH method of GCE and RCE. Experiments were performed in triplicate. Error bars represent ±SD. T-test was performed to compare statistical significances: ns (not significant) p > 0.05; *** p < 0.001.
Beverages 11 00056 g001
Figure 2. Effect of GCE and RCE on Lactobacillus spp. growth. Extractive solvent (blue) was employed as the control treatment. Growth tendency after being exposed to different extract concentrations for (a) L. plantarum, (b) L. rhamnosus, and (c) L. paracasei. (d) Effect of 5% (v/v) concentration of GCE and RCE on the bacterial growth rate. The values are expressed in percentage with respect to the growth of non-treated bacteria. Error bars represent ±SD. The red line in (d) represents the growth threshold of untreated bacteria. Two-way ANOVA Dunnett’s multiple comparison test was performed for Figure 2a–c; one-way ANOVA Šídák’s multiple comparisons test was performed for Figure 2d. Symbol meanings: ns p > 0.05; * p ≤ 0.05; ** p ≤ 0.01; *** p ≤ 0.001; **** p ≤ 0.0001. Figure 2d was created in BioRender. Gómez, L. (2025). https://BioRender.com/exn8h48 (accessed on 16 April 2025). License agreement number: VT254U6HT3.
Beverages 11 00056 g002
Figure 3. Inhibitory effect of green and roasted coffee extracts on (a) α-amylase and (b) α-glucosidase activity. X axes were adjusted to inhibitory percentage values in order to obtain better results representation. Experiments were performed in triplicate and error bars represent ±SD. One-way ANOVA Turkey’s test was performed to evaluate the differences among extracts. Symbol meanings: ns (not significant) p > 0.05; * p ≤ 0.05; *** p ≤ 0.001; **** p ≤ 0.0001.
Beverages 11 00056 g003
Figure 4. Glucose uptake by yeast cells at (a) 5 mM, (b) 10 mM, and (c) 25 mM initial concentration of glucose in the presence of 5% GCE and RCE. The same percentage of extractive solvent was employed as a control. Experiments were performed in duplicate and repeated three times. Error bars represent ±SD. One-way ANOVA Tukey’s multiple comparisons test was performed to compare the statistical differences. Symbol meanings: ns p > 0.05; *** p ≤ 0.001; **** p ≤ 0.0001.
Beverages 11 00056 g004
Table 1. Phytochemical composition and antioxidant activity of coffee extracts. The total phenolic content (TPC) is expressed in gallic acid equivalents (GAE µg/mL); the total tannin content (TTC) is expressed in catechin equivalents (CE µg/mL); the total flavonoid content (TFC) is expressed in rutin equivalents (RE µg/mL); and antioxidant activity (AA) is expressed in Trolox equivalents (TE µg/mL).
ExtractTPC (GAE µg/mL)TTC (CE µg/mL)TFC (RE µg/mL)AA (TE µg/mL)
GCE3531 ± 321547 ± 20619,523 ± 131740,457 ± 298
RCE3008 ± 7412391 ± 21829,103 ± 79440,276 ± 333
Disclaimer/Publisher’s Note: The statements, opinions and data contained in all publications are solely those of the individual author(s) and contributor(s) and not of MDPI and/or the editor(s). MDPI and/or the editor(s) disclaim responsibility for any injury to people or property resulting from any ideas, methods, instructions or products referred to in the content.

