Abstract
This study aimed to determine the allele frequencies and genetic diversity of 21 autosomal short tandem repeat (STR) loci from the Expanded U.S. Core Loci and European Standard Set in the Romanian population. A random sample of 928 unrelated men from all Romanian counties was analyzed using the Investigator 24plex QS and Investigator 24plex GO! Kits (Qiagen). The genotypes were determined, and the allele frequencies were calculated using the STRidER tool. The results provide updated population genetic data for the Romanian population, which is essential for accurate calculation of DNA evidence weight in forensic casework.
1. Introduction
In recent decades, the field of forensic sciences has undergone a series of changes, by introducing new specializations and improved methods, and also by removing those that did not have a solid scientific basis (e.g., bite mark analysis [1], microscopic hair analysis [2]).
Forensic genetics was one of the specializations that revolutionized the field of forensic sciences, which in the last 30 years has experienced enormous development and ”has produced valuable evidence that has contributed to the successful prosecution and conviction of criminals as well as to the exoneration of innocent people” [3].
Nowadays, the vast majority of forensic genetics laboratories use data obtained as a result of analyzing a set of short tandem repeat (STR) markers that together form a genetic profile. Depending on the number of markers contained and the rarity of the alleles obtained, the genetic profile may be unique (except for monozygotic twins where other techniques need to be applied [4]).
In the context of the freedom of movement, unprecedented in all human history, and the criminal challenges it poses (e.g., terrorism and cross-border crime [5,6]), law enforcement agencies have established the use of standard sets of STR markers, like Expanded U.S. Core Loci or European Standard Set and the interconnection of national forensic DNA databases.
When a genetic profile obtained from a person (also called reference/known sample) is identical to the genetic profile obtained from an object related to a crime (also called unknown sample/casework sample), we say there is a match. These matches can be the result of direct comparisons of two DNA profiles obtained from a casework sample and a reference sample, or the result of comparisons between a DNA profile obtained from a casework sample and one or more forensic DNA databases. Matches of two or more persons are also relevant to forensic work when it comes to investigative steps, kinship, pedigree, or familial DNA searches. Likewise, matches of two or more DNA profiles obtained from casework can be used for linking different cases.
In forensic genetics, as a general rule, when there is a match between a reference sample and an unknown sample, the weight of evidence must be determined [7]. To calculate it, data on the relative frequency of alleles in the population are required [8]. Although a number of population genetic studies have been published over the years [9,10,11,12,13,14,15,16,17,18], given the abrupt decline in Romania’s population (every 10 years in the last three decades the population has decreased by approximately 1 million) [18], the immigration and the increased number of autosomal STR markers that are currently used in forensic genetics, we considered it appropriate to carry out a new population genetic study, which would reflect the current Romanian population status.
In this study we optimized our data analysis protocols and utilized the place of birth as the benchmark for selecting the population group.
Another particularity of this study is that only samples from men, who do not share the same genetic haplotype of the Y chromosome, were used, using an additional step to ensure that there is no kinship between the participants.
2. Materials and Methods
For this study we randomly selected a sample of n = 928 men from all Romanian counties respecting, for most of the counties, the corresponding proportion of Romania’s population, according to 2021 population census [19], as follows in Table 1.

Table 1.
Distribution of analyzed samples.
The biological samples, consisting of epithelial buccal cells, were collected from convicted persons through non-invasive methods by medical personnel, as a result of applying the national law no. 76 from 2008 [20]. EasiCollect® Plus devices (Qiagen, Venlo, The Netherlands) were used to collect 96.65% of the samples, while 3.35% were collected using different types of buccal swabs.
After collection, the samples were processed in one of the following ways, depending on the type of support or how well the sample was preserved:
- (a)
- DNA was extracted with QIAamp Investigator BioRobot Kit (Qiagen) on BioRobot Universal System (Qiagen) using the kit manufacturer’s protocol. The DNA extraction was followed by STR amplification with the Investigator 24plex QS kit (Qiagen) and a Veriti™ Thermal Cycler (ThermoFisher Scientific, Waltham, MA, USA) for 21 autosomal STR (A-STR) loci (Table 2), one Y chromosome STR (Y-STR) locus (DYS391), Amelogenin, and two quality controls, using the kit manufacturer’s protocol.
Table 2. A-STR loci analyzed and their chromosomal locations [21].
- (b)
- DNA was extracted with QIAsymphony DNA Investigator Kit (Qiagen) and QIAsymphony SP/AS instrument (Qiagen) using the kit manufacturer’s protocol. The DNA was quantified with Investigator Quantiplex Pro RGQ (Qiagen) and RotorGene Q Real-Time System (Qiagen) using the kit manufacturer’s protocol. PCR amplification was made with the Investigator 24plex QS kit (Qiagen) and a Veriti™ Thermal Cycler (ThermoFisher Scientific) for 21 A-STR loci (Table 2), one Y-STR locus (DYS391), Amelogenin, and two quality controls, using the kit manufacturer’s protocol.
- (c)
- DNA was extracted with Investigator STR GO! Lysis Buffer (Qiagen) using the kit manufacturer’s protocol. The DNA extraction was followed by STR amplification with the Investigator 24plex GO! Kit (Qiagen) and a Veriti™ Thermal Cycler (ThermoFisher Scientific) for 21 A-STR loci (Table 2), one Y-STR locus (DYS391), Amelogenin, and two quality controls, using the kit manufacturer’s protocol.
- (d)
- For some samples, no separate DNA extraction step was performed. Instead, the samples were subjected directly to PCR amplification using the Investigator 24plex GO! Kit (Qiagen) and a Veriti™ Thermal Cycler (ThermoFisher Scientific). This amplification targeted 21 A-STR loci (Table 2), one Y-STR locus (DYS391), the Amelogenin locus, and two quality control markers. The amplification was carried out following the manufacturer’s protocol.
Regardless of how the samples were processed in the previous steps, the detection and separation of PCR products were carried out using ABI 3500 Genetic Analyzer (ThermoFisher Scientific) according to the recommendations of the amplification kit manufacturer.
Genotypes were determined using GeneMapper ID-X 1.6 with the default settings from Analysis_HID_3500_200rfu protocol.
Statistical analysis was performed with quality control of autosomal Short Tandem Repeat allele frequency databasing (STRidER) v3/R2 [22].
The calculations for observed heterozygosity, expected heterozygosity, Hardy–Weinberg equilibrium exact test, matching probability, power of discrimination, polymorphism information content, power of exclusion, and typical paternity index were performed using STRAF 2.2.2 [23].
3. Results
The allele’s frequency for the 21 STR loci from the Expanded U.S. Core Loci and European Standard Set studied in the Romanian population and statistical parameters are summarized in Table 3 and Table 4 (STRidER reference code STR000441).
Table 3.
Alleles frequency, observed heterozygosity (Ho), expected heterozygosity (He), Hardy–Weinberg equilibrium exact test (P), matching probability (PM), power of discrimination (PD), polymorphism information content (PIC), power of exclusion (PE), and typical paternity index (TPI) for 11 STR markers.
Table 4.
Alleles frequency, observed heterozygosity (Ho), expected heterozygosity (He), Hardy– Weinberg equilibrium exact test (P), matching probability (PM), power of discrimination (PD), polymorphism information content (PIC), power of exclusion (PE), and typical paternity index (TPI) for 10 STR markers.
The numbers of alleles observed for every locus analyzed is presented in Table 5 and varied from six alleles for TPOX marker to 49 for SE33 marker, with an overall mean value of 13 alleles per locus.
Table 5.
Numbers of alleles observed for every locus analyzed.
No significant differences were seen between observed heterozygosity and expected heterozygosity.
With the exception of the SE33 locus (P = 0.002), no deviations from Hardy–Weinberg equilibrium were observed. This may be due to the high mutation rate of this locus, the highest of all the markers analyzed (0.64%), more than twice as high as the second highest mutation rate [24].
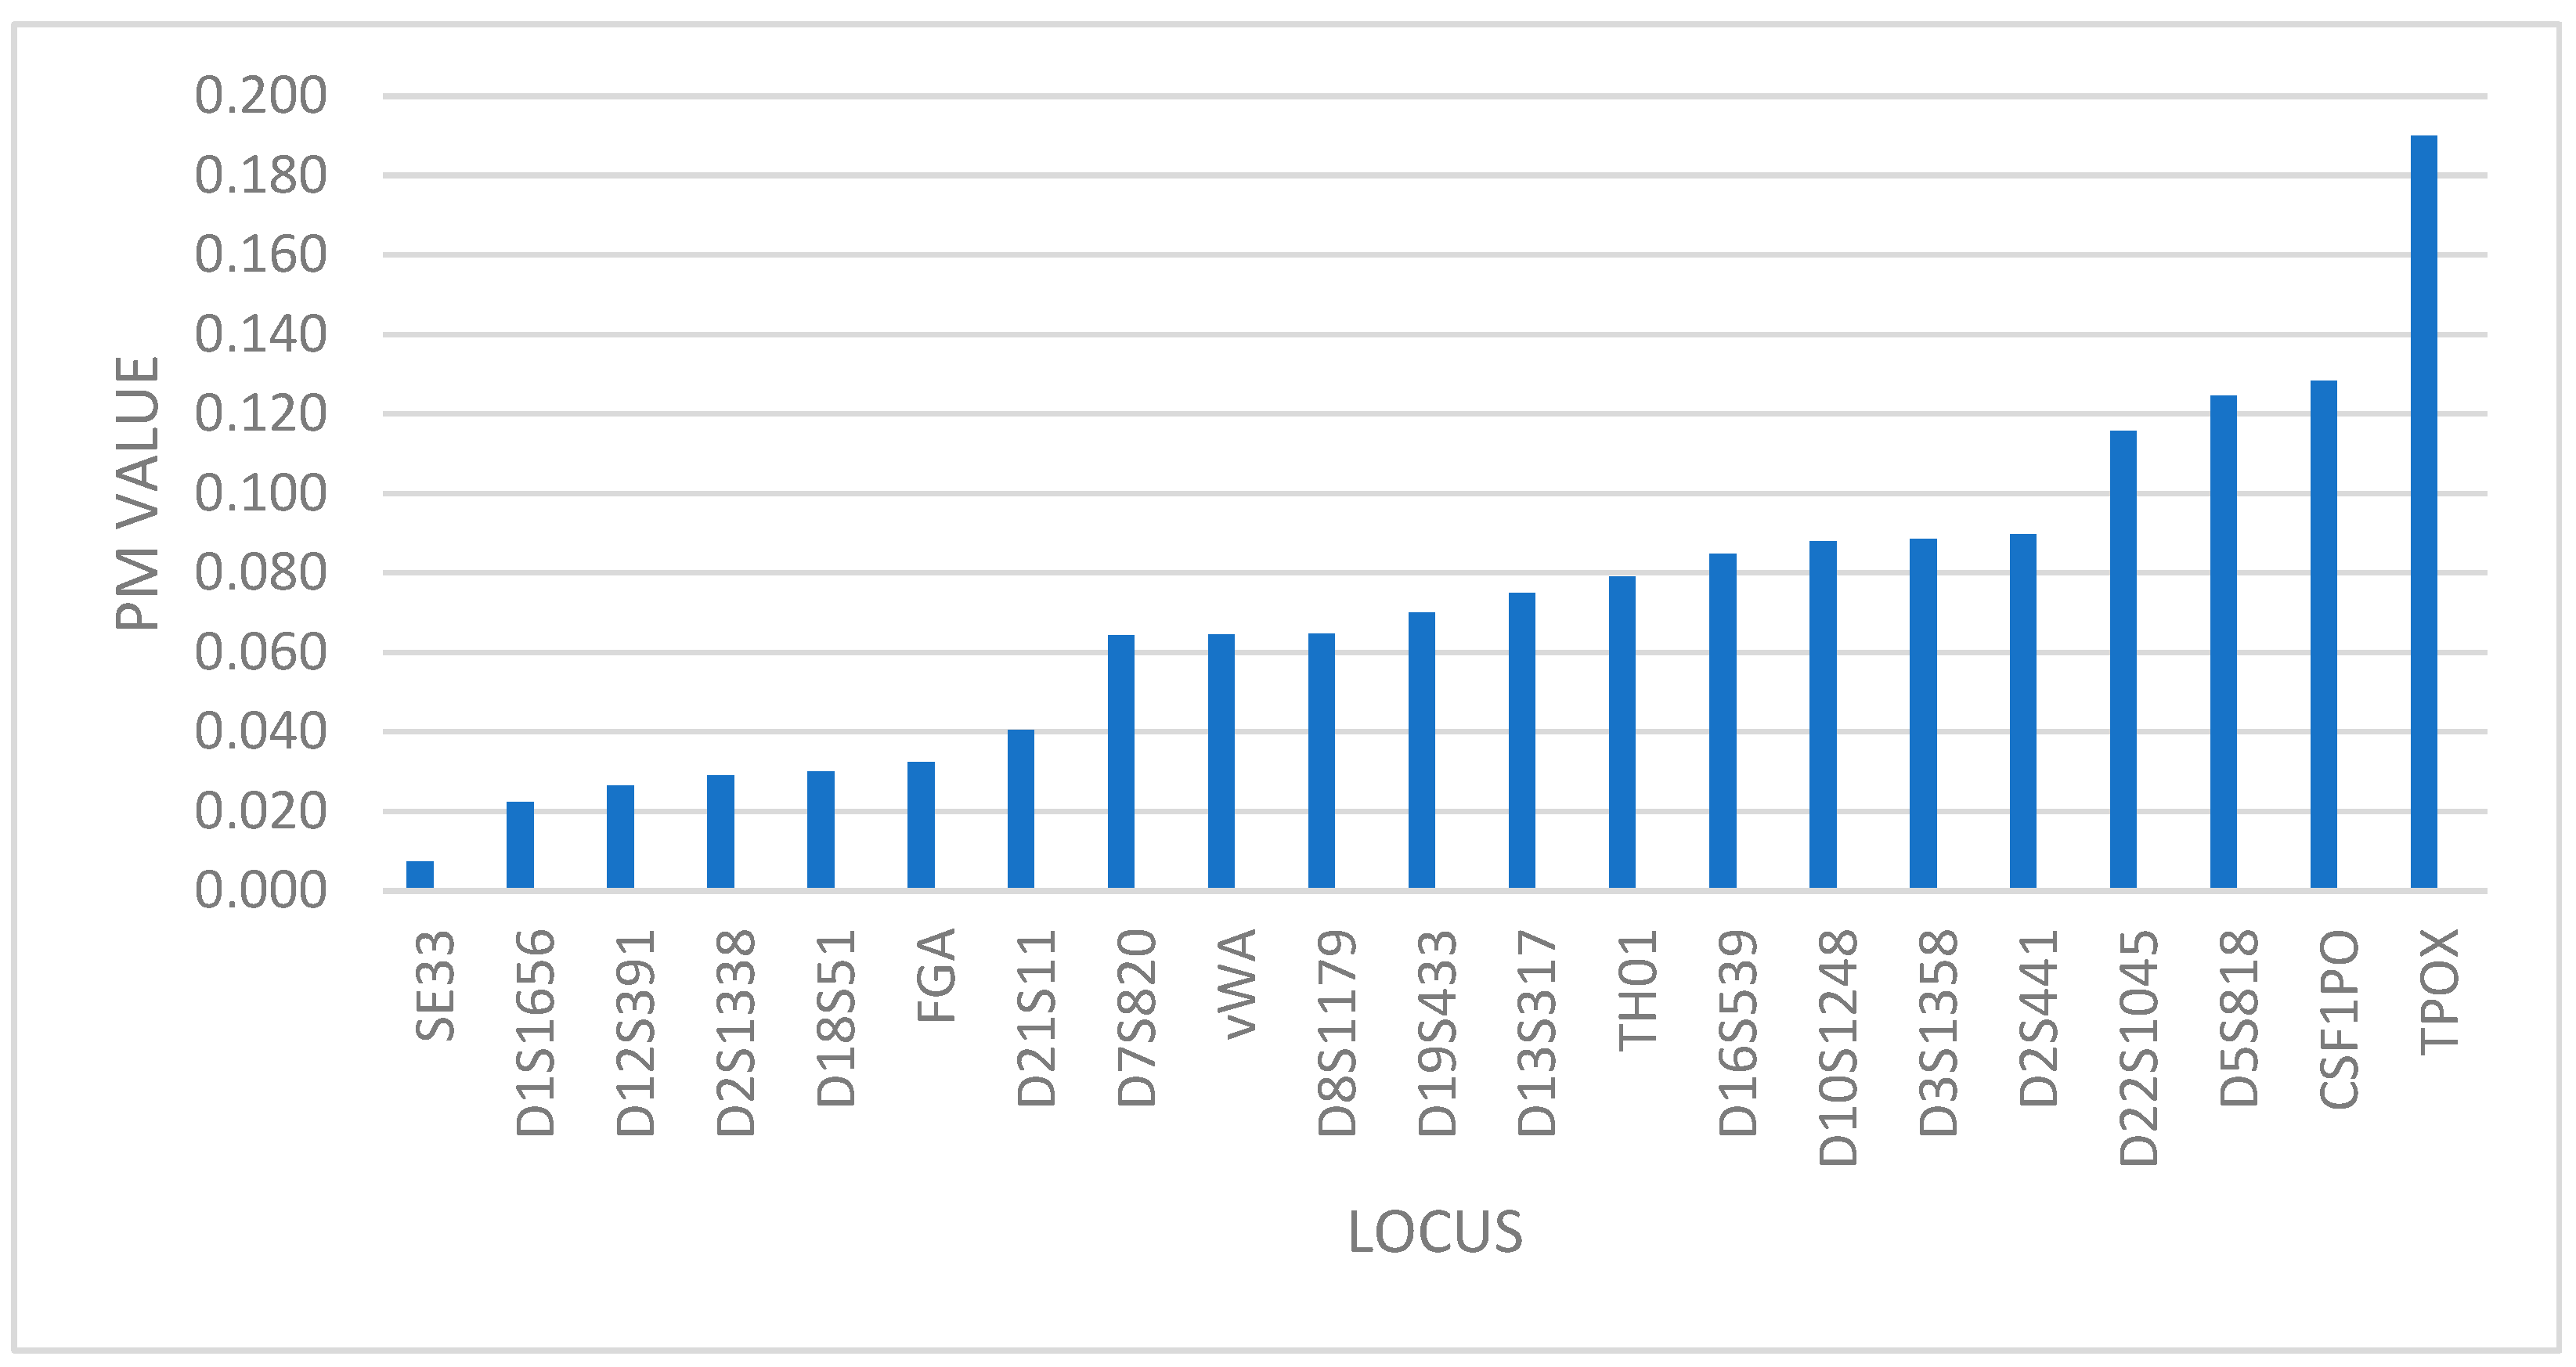
The lowest random match probability (PM) value is at locus SE33 (PM = 0.007) and the highest at TPOX (PM = 0.190) as shown in Figure 1, which means that TPOX marker has the lowest power of discrimination of all 21 analyzed markers (PD = 0.810), while the SE33 marker has the highest power of discrimination (PD = 0.993).
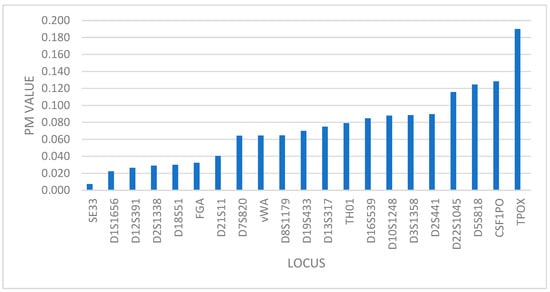
Figure 1.
Distribution of markers based on PM value.
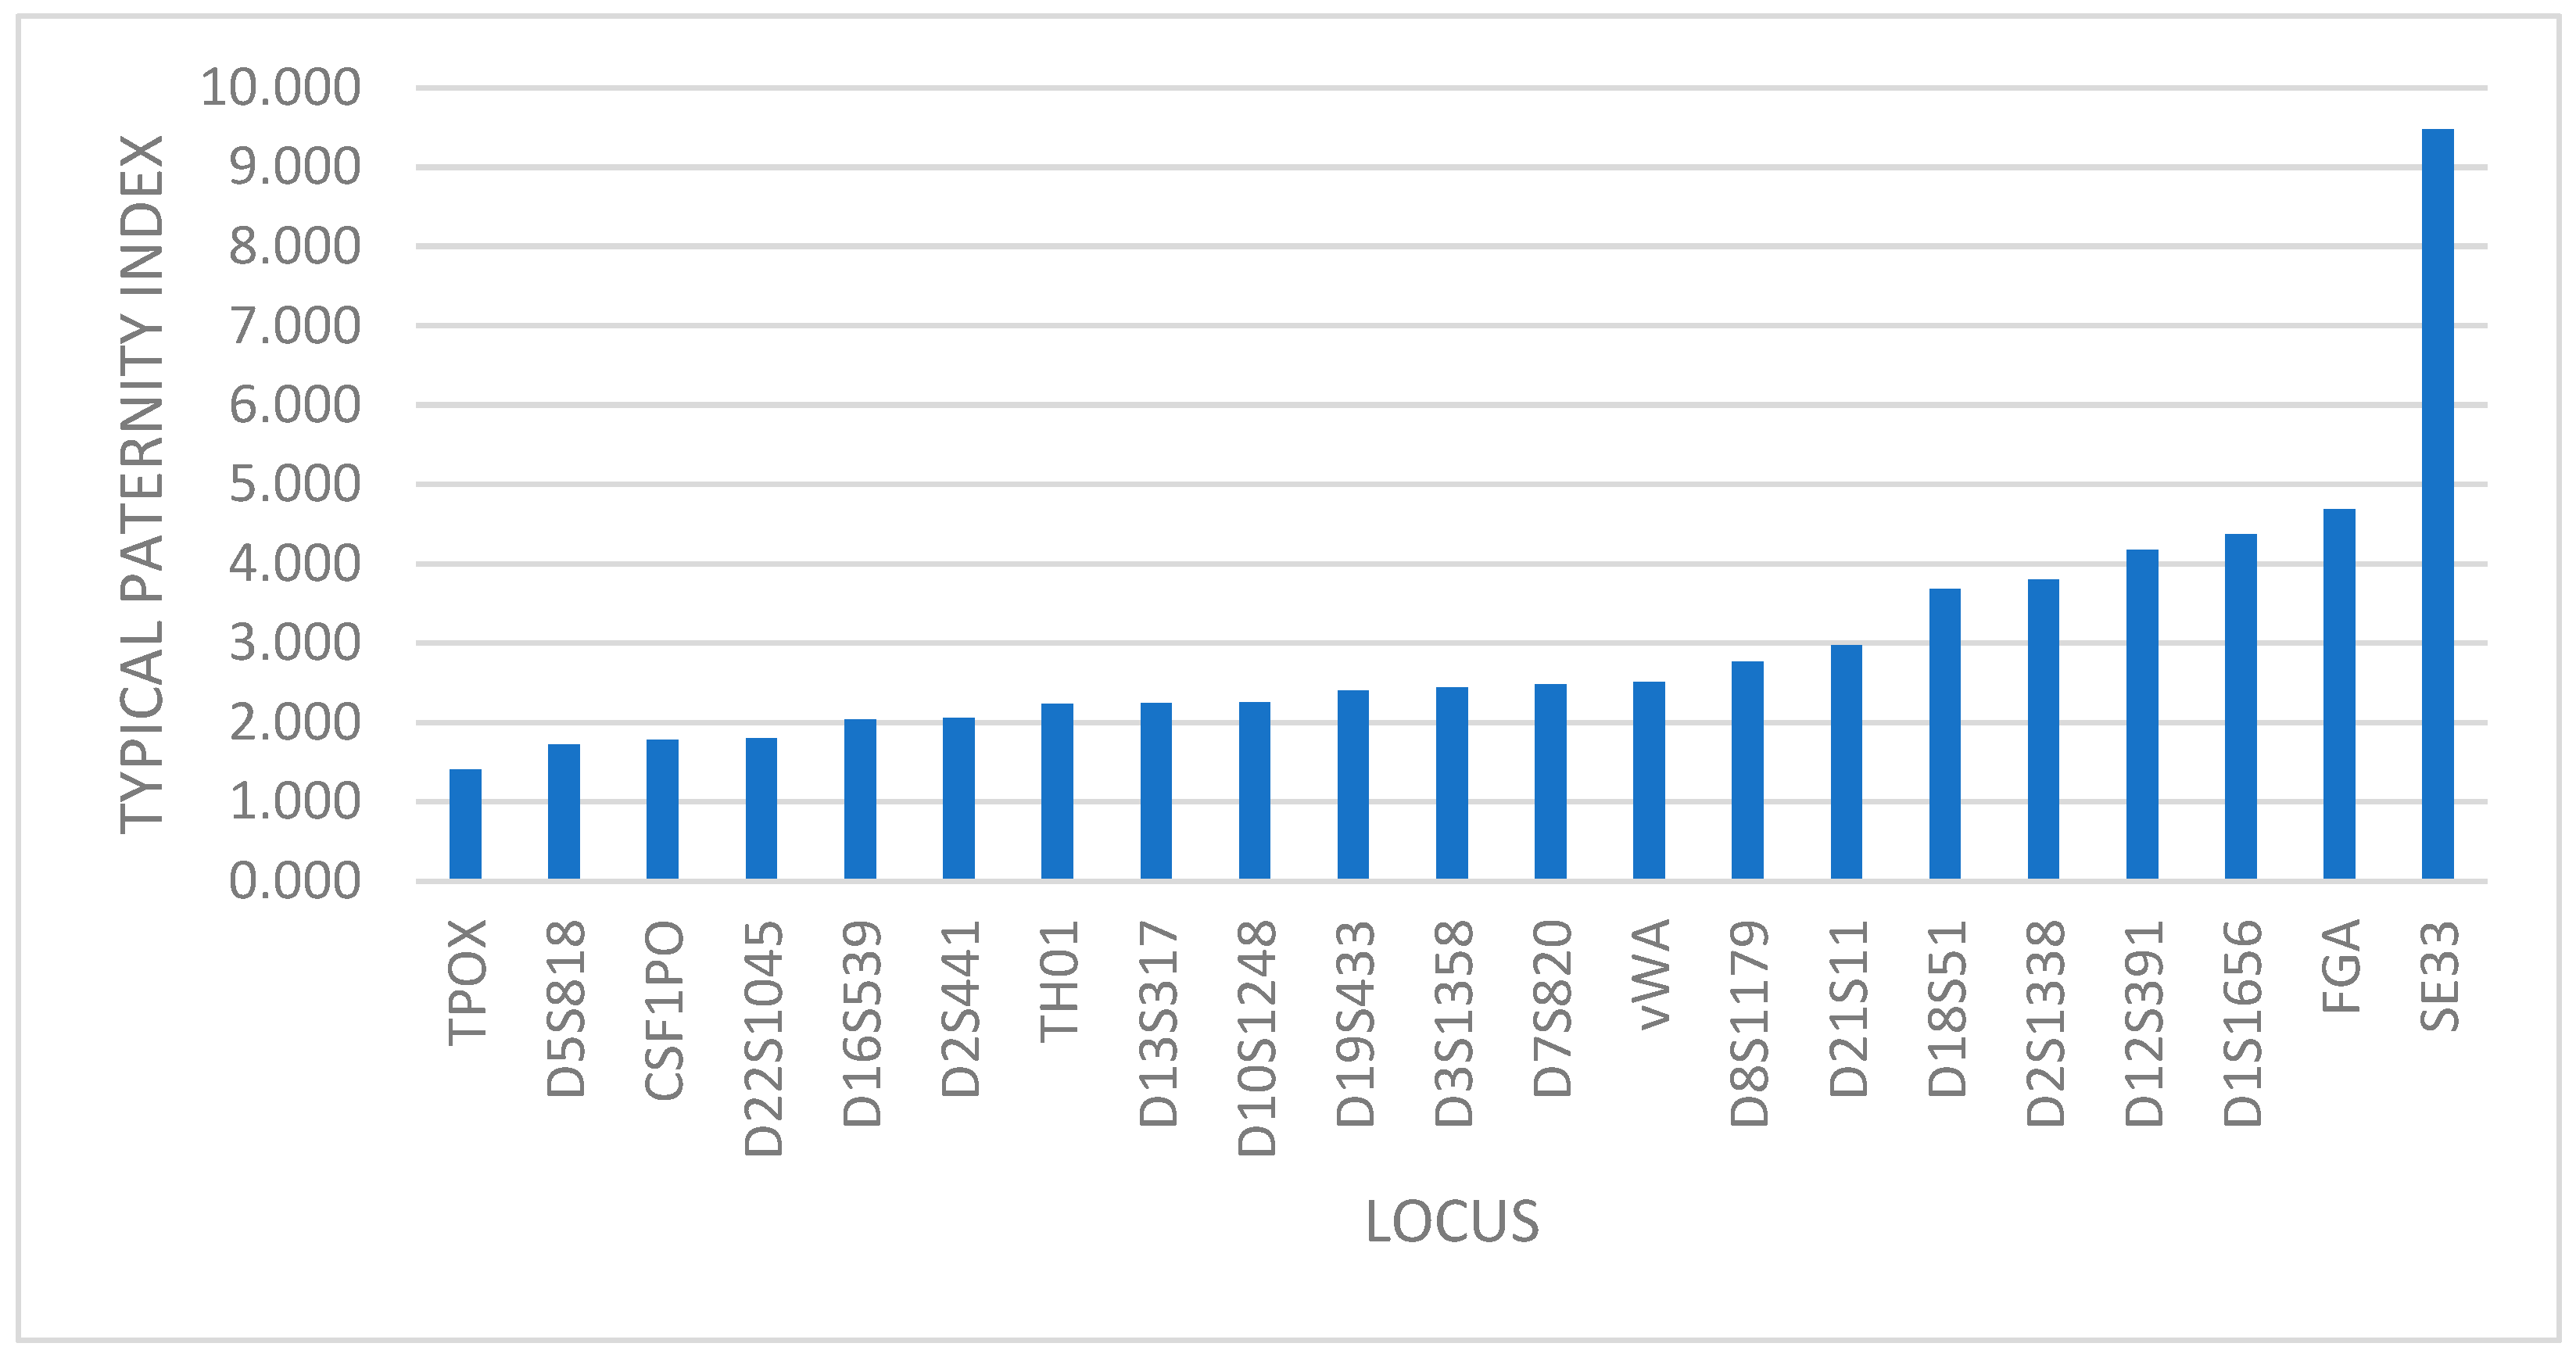
In the case of genetic relationship, the power of exclusion (PE) and typical paternity index (TPI) show the same distribution of the markers, with TPOX locus having the lowest value and the SE33 locus with the highest one (Figure 2).
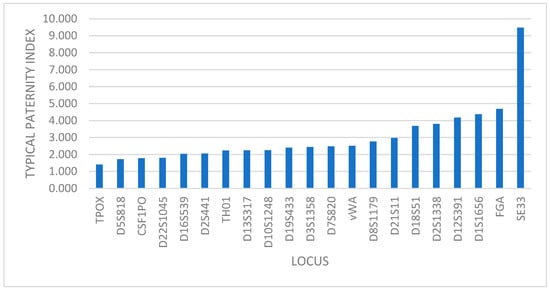
Figure 2.
Distribution of markers based on TPI value.
4. Discussion
Comparing the number of alleles observed in the Romanian population in this study with the number of alleles discovered worldwide [21], it results that a proportion varying between 17% and 48% of these alleles are found in the Romanian population (Figure 3), with loci D22S1045 (48%), D10S1248 (47%), and SE33 (45%) having the highest percent of the alleles found worldwide and the loci FGA (17%) and D7S820 (22%) having the lowest percent of the alleles found worldwide.
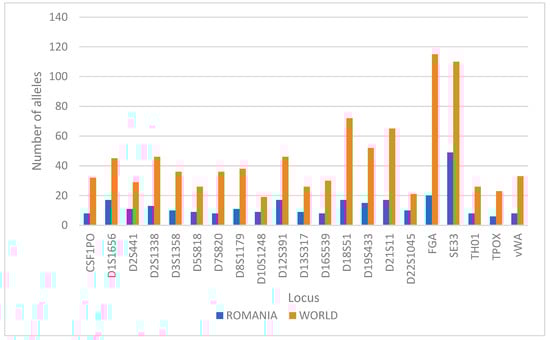
Figure 3.
Comparison between the count of alleles present in Romania for each marker versus worldwide.
The comparative analysis of similar studies in the Romanian population highlighted slight differences, when it comes to obtained alleles and their frequencies. However, the differences between the obtained results for this sample and those obtained by Stanciu et al. [16] were minor, with the maximum calculated differences between allele frequencies per locus being in the range of 1.2–4.2%. Alleles obtained in this study and not in the other one, and vice versa, are considered very rare alleles because they were observed less than five times in the samples analyzed [25]. The main difference between the two analyses lies in the number of markers that were processed, six more in this study than in the previous one.
More significant differences were observed when comparing the results of this study and those obtained by Barbarii et al. [11]. Thus, six alleles with frequency differences of more than 5% were highlighted. Also, a more diverse distribution of alleles was shown in our sample, with a difference of more than 40 alleles observed in the new study. These differences could be explained by the large difference in the size of the sample (928 vs. 243), the way the sample was selected (all Romania’s counties vs Bucharest area) and the 20-year difference between the two studies.
5. Conclusions
In this study, following the latest international guidelines when it comes to the field of forensic genetics, we obtained a set of allele frequencies suitable for the purpose of making biostatistical calculations which can be used for forensic DNA identification, paternity testing, and probabilistic interpretation to evaluate STR DNA profiles from a mixture of contributors.
Moreover, the results obtained by comparing the data presented here with those obtained in similar studies, of the population of other countries, can contribute to a better understanding of some aspects regarding population migration throughout history across Europe and other continents.
Author Contributions
Conceptualization, G.P. and S.E.G.; methodology, G.P. and F.S.; validation, G.P. and F.S.; formal analysis, F.S. and G.P.; investigation, V.C., S.V., P.P, V.N., I.M.S., A.P., B.H., B.N., A.M.P., A.C., A.R., F.S. and G.P.; resources, A.C.H.; data curation, F.S. and G.P.; writing—original draft preparation, G.P.; writing—review and editing, F.S., S.E.G., B.N., A.P., P.P. and A.R.; visualization, G.P. and S.E.G.; supervision, A.C.H.; project administration, A.C.H. and S.E.G.; funding acquisition, A.C.H. All authors have read and agreed to the published version of the manuscript.
Funding
This research received no external funding.
Institutional Review Board Statement
The study was conducted in accordance with the code of ethics and deontology of the National Forensic Institute, the protocol was approved by the Ethics Committee on October 27th, 2021 and all provisions of Regulation (EU) 2016/679 on the protection of natural persons with regard to the processing of personal data and the free movement of such data were respected during the handling of genetic information.
Informed Consent Statement
Informed consent was waived due to the fact that biological samples were taken from convicted persons in accordance with the provisions of the national Law no. 76 from 2008 on the organization and functioning of the National Forensic Genetic Data System.
Data Availability Statement
The raw data is not publicly available, because DNA profiles are considered sensitive information due to their highly personal, unique and identifiable nature. The analysis was conducted in accordance with the recommendations of International Society for Forensic Genetics using Short Tandem Repeat allele frequency databasing (STRidER) and has the reference code STR000441.
Acknowledgments
This study was conceived as a result of studies conducted within the Doctoral School of Biology program of the University of Bucharest. This paper was supported by Council for Doctoral Studies (CSUD), University of Bucharest. Also, we would like to acknowledge and thank Romică Potorac, the director of National Forensic Institute, for his support for research activities within the institute, and all the auxiliary staff, without whom the completion of this study would have been more difficult.
Conflicts of Interest
The authors declare no conflicts of interest.
References
- PCAST Forensic Science in Criminal Courts: Ensuring Scientific Validity of Feature-Comparison Methods 2016. Available online: https://obamawhitehouse.archives.gov/sites/default/files/microsites/ostp/PCAST/pcast_forensic_science_report_final.pdf (accessed on 27 April 2025).
- FBI Testimony on Microscopic Hair Analysis Contained Errors in at Least 90 Percent of Cases in Ongoing Review—FBI. Available online: https://www.fbi.gov/news/press-releases/fbi-testimony-on-microscopic-hair-analysis-contained-errors-in-at-least-90-percent-of-cases-in-ongoing-review (accessed on 27 April 2025).
- National Research Council. Strengthening Forensic Science in the United States: A Path Forward; National Academies Press: Washington, DC, USA, 2009; ISBN 978-0-309-13131-5. [Google Scholar]
- Schlieper, D.; Ehlich, A.; Benecke, M. Discrimination of Monozygotic Twins (and Clones) on the DNA Level. Int. Congr. Ser. 2003, 1239, 857–859. [Google Scholar] [CrossRef]
- Decision–2008/615–EN–EUR-Lex. Available online: https://eur-lex.europa.eu/eli/dec/2008/615/oj/eng (accessed on 27 April 2025).
- Decision–2008/616–EN–EUR-Lex. Available online: https://eur-lex.europa.eu/eli/dec/2008/616/oj/eng (accessed on 27 April 2025).
- Evett, I.W.; Weir, B.S. Interpreting DNA Evidence: Statistical Genetics for Forensic Scientists; Sinauer Associates: Sunderland, MA, USA, 1998; ISBN 978-0-87893-155-2. [Google Scholar]
- Aitken, C.; Roberts, P.; Jackson, G. Communicating and Interpreting Statistical Evidence. In The Administration of Criminal Justce: Fundamentals of Probability and Statistical Evidence in Criminal Proceedings; Royal Statistical Society: London, UK, 2010. [Google Scholar]
- Anghel, A.; Marian, C.; Pitulescu, M.; Daba, A.; Sirbu, I.O.; Rusu, V.; Budowle, B. Population Genetic Study of Eight Short Tandem Repeat Loci CSF1PO, TPOX, TH01, F13A01, FESFPS, vWA, F13B and LPL in the Western Romanian Population. Forensic Sci. Int. 2003, 131, 218–219. [Google Scholar] [CrossRef] [PubMed]
- Barbarii, L. Genetic Study on 10 STR Loci in the Romanian Population. Int. Congr. Ser. 2004, 1261, 169–172. [Google Scholar] [CrossRef]
- Barbarii, L.E.; Rolf, B.; Constantinescu, C.; Hohoff, C.; Calistru, P.; Dermengiu, D. Allele Frequencies of 13 Short Tandem Repeat (STR) Loci in the Romanian Population. Forensic Sci. Int. 2004, 141, 171–174. [Google Scholar] [CrossRef] [PubMed]
- Egyed, B.; Füredi, S.; Padar, Z. Population Genetic Study in Two Transylvanian Populations Using Forensically Informative Autosomal and Y-Chromosomal STR Markers. Forensic Sci. Int. 2006, 164, 257–265. [Google Scholar] [CrossRef] [PubMed]
- Marian, C.; Anghel, A.; Bel, S.M.; Ferencz, B.K.; Ursoniu, S.; Dressler, M.; Popescu, O.; Budowle, B. STR Data for the 15 AmpFlSTR Identifiler Loci in the Western Romanian Population. Forensic Sci. Int. 2007, 170, 73–75. [Google Scholar] [CrossRef] [PubMed]
- Demeter, S.J.; Kelemen, B.; Székely, G.; Popescu, O. Genetic Variation at 15 Polymorphic, Autosomal, Short Tandem Repeat Loci of Two Hungarian Populations in Transylvania, Romania. Croat. Med. J. 2010, 51, 515–523. [Google Scholar] [CrossRef] [PubMed]
- Demeter, J.S.; Kelemen, B.; Székely, G.; Popescu, O. Effects of Population Data Update on Genetic Variance of 15 Polymorphic Autosomal Str Loci Tested in Transylvania. Ann. Rom. Soc. Cell Biol. 2010, 15, 18–21. [Google Scholar]
- Stanciu, F.; Vladu, S.; Cuţăr, V.; Cocioabă, D.; Iancu, F.; Cotolea, A.; Stoian, I.M. Genetic Parameters and Allele Frequencies of Five New European Standard Set STR Loci (D10S1248, D22S1045, D2S441, D1S1656, D12S391) in the Population of Romania. Croat. Med. J. 2013, 54, 232–237. [Google Scholar] [CrossRef] [PubMed]
- Anghel, A.; Enache, A.; Seclaman, E.; Gruin, G.; Ursoniu, S.; Alexa, A.; Antonescu, M.; Marian, C. Genetic Polymorphism Data on 15 Autosomal STR Markers in a Western Romanian Population Sample. Leg. Med. 2014, 16, 238–240. [Google Scholar] [CrossRef] [PubMed]
- Benvisto, A.; Messina, F.; Finocchio, A.; Popa, L.; Stefan, M.; Stefanescu, G.; Mironeanu, C.; Novelletto, A.; Rapone, C.; Berti, A. A Genetic Portrait of the South-Eastern Carpathians Based on Autosomal Short Tandem Repeats Loci Used in Forensics. Am. J. Hum. Biol. 2018, 30, e23139. [Google Scholar] [CrossRef] [PubMed]
- Institutul Național de Statistică. Rezultate Definitive: Caracteristici Demografice–-Recensamantul Populației și Locuințelor 2021; Institutul Național de Statistică: Bucharest, Romania, 2023. [Google Scholar]
- LEGE 76 08/04/2008–Portal Legislativ. Available online: https://legislatie.just.ro/Public/DetaliiDocument/91323 (accessed on 28 April 2025).
- Butler, J.M.; Vallone, P.M.; Gettings, K.B.; Borsuk, L.A.; Ruitberg, C.M.; Reeder, D.J. NIST Short Tandem Repeat DNA Internet Database; National Institute of Standards and Technology: Gaithersburg, MD, USA, 2017. [Google Scholar]
- Bodner, M.; Bastisch, I.; Butler, J.M.; Fimmers, R.; Gill, P.; Gusmão, L.; Morling, N.; Phillips, C.; Prinz, M.; Schneider, P.M.; et al. Recommendations of the DNA Commission of the International Society for Forensic Genetics (ISFG) on Quality Control of Autosomal Short Tandem Repeat Allele Frequency Databasing (STRidER). Forensic Sci. Int. Genet. 2016, 24, 97–102. [Google Scholar] [CrossRef] [PubMed]
- Gouy, A.; Zieger, M. STRAF—A Convenient Online Tool for STR Data Evaluation in Forensic Genetics. Forensic Sci. Int. Genet. 2017, 30, 148–151. [Google Scholar] [CrossRef] [PubMed]
- Butler, J. Advanced Topics in Forensic DNA Typing: Interpretation; Elsevier: Boston, MA, USA, 2014; ISBN 978-0-12-405213-0. [Google Scholar]
- Butler, J.M. Fundamentals of Forensic DNA Typing; Elsevier: Amsterdam, Switzerland; Academic Press: Boston, MA, USA, 2010; ISBN 978-0-12-374999-4. [Google Scholar]

Disclaimer/Publisher’s Note: The statements, opinions and data contained in all publications are solely those of the individual author(s) and contributor(s) and not of MDPI and/or the editor(s). MDPI and/or the editor(s) disclaim responsibility for any injury to people or property resulting from any ideas, methods, instructions or products referred to in the content. |
© 2025 by the authors. Licensee MDPI, Basel, Switzerland. This article is an open access article distributed under the terms and conditions of the Creative Commons Attribution (CC BY) license (https://creativecommons.org/licenses/by/4.0/).