
Three-Dimensional Analysis of Posterior Mandibular Displacement in Rats

 ,
,  , , , ,
Abstract
1. Introduction
2. Materials and Methods
2.1. Experimental Design
2.2. Three-Dimensional Analysis
2.3. Statistics
3. Results
4. Discussion
5. Conclusions
Supplementary Materials
Author Contributions
Funding
Institutional Review Board Statement
Data Availability Statement
Conflicts of Interest
References
- Bombonatti, R.; Aliaga-Del Castillo, A.; Bombonatti, J.F.S.; Garib, D.; Tompson, B.; Janson, G. Cephalometric and occlusal changes of Class III malocclusion treated with or without extractions. Dent. Press J. Orthod. 2020, 25, 24–32, Erratum in Dent. Press J. Orthod. 2020, 25, e11. [Google Scholar] [CrossRef]
- Campbell, P.M. The dilemma of Class III treatment. Early or late? Angle Orthod. 1983, 53, 175–191. [Google Scholar] [CrossRef] [PubMed]
- Rabie, A.B.; Wong, R.W.; Min, G.U. Treatment in Borderline Class III Malocclusion: Orthodontic Camouflage (Extraction) Versus Orthognathic Surgery. Open Dent. J. 2008, 2, 38–48. [Google Scholar] [CrossRef]
- Zere, E.; Chaudhari, P.K.; Sharan, J.; Dhingra, K.; Tiwari, N. Developing Class III malocclusions: Challenges and solutions. Clin. Cosmet. Investig. Dent. 2018, 10, 99–116. [Google Scholar] [CrossRef] [PubMed]
- Almeida, R.R.; Alessio, L.E.; Almeida-Pedrin, R.R.; Almeida, M.R.; Pinzan, A.; Vieira, L.S. Management of the Class III malocclusion treated with maxillary expansion, facemask therapy and corrective orthodontic. A 15-year follow-up. J. Appl. Oral Sci. 2015, 23, 101–109. [Google Scholar] [CrossRef] [PubMed][Green Version]
- Singh, S.P.; Kumar, V.; Verma, R.; Singh, S. Management of Developing Skeletal Class III Malocclusion in a Prepubertal Girl with Prognathic Mandible in Late Mixed Dentition. Contemp. Clin. Dent. 2017, 8, 139–144. [Google Scholar] [CrossRef] [PubMed]
- Nardoni, D.N.; Siqueira, D.F.; Cardoso Mde, A.; CapelozzaFilho, L. Cephalometric variables used to predict the success of interceptive treatment with rapid maxillary expansion and face mask. A longitudinal study. Dent. Press J. Orthod. 2015, 20, 85–96. [Google Scholar] [CrossRef] [PubMed][Green Version]
- Cholasueksa, P.; Warita, H.; Soma, K. Alterations of the Rat Temporomandibular Joint in Functional Posterior Displacement of the Mandible. Angle Orthod. 2004, 74, 677–683. [Google Scholar] [CrossRef] [PubMed]
- Meikle, M.C. Remodeling the Dentofacial Skeleton: The Biological Basis of Orthodontics and Dentofacial Orthopedics. J. Dent. Res. 2007, 86, 12–24. [Google Scholar] [CrossRef]
- Teramoto, M.; Kaneko, S.; Shibata, S.; Yanagishita, M.; Soma, K. Effect of compressive forces on extracellular matrix in rat mandibular condylar cartilage. J. Bone Miner. Metab. 2003, 21, 276–286. [Google Scholar] [CrossRef] [PubMed]
- Von den Hoff, J.W.; Delatte, M. Interplay of mechanical loading and growth factors in the mandibular condyle. Arch. Oral Biol. 2008, 53, 709–715. [Google Scholar] [CrossRef]
- Wendell, P.D.; Nanda, R.; Sakamoto, T.; Nakamura, S. The effects of chin cup therapy on the mandible: A longitudinal study. Am. J. Orthod. 1985, 87, 265–274. [Google Scholar] [CrossRef]
- Lyros, I.; Makrygiannakis, M.A.; Lykogeorgos, T.; Ferdianakis, E.; Tsolakis, A.I. Posterior Mandibular Displacement—A Systematic Review Based on Animal Studies. Animals 2021, 11, 823. [Google Scholar] [CrossRef] [PubMed]
- Du, W.; Bhojwani, A.; Hu, J.K. FACEts of mechanical regulation in the morphogenesis of craniofacial structures. Int. J. Oral Sci. 2021, 13, 4. [Google Scholar] [CrossRef] [PubMed]
- Tsolakis, A.I. Effects of Posterior Mandibular Traction in the Rabbit: A Cephalometric, Histologic, Electromyographic Study. Master’s Thesis, Case Western Reserve University, Cleveland, OH, USA, 1981. [Google Scholar]
- Carlson, D.S. Evolving concepts of heredity and genetics in orthodontics. Am. J. Orthod. Dent. Orthop. 2015, 148, 922–938. [Google Scholar] [CrossRef] [PubMed]
- Hersberger-Zurfluh, M.A.; Papageorgiou, S.N.; Motro, M.; Kantarci, A.; Will, L.A.; Eliades, T. Genetic and environmental components of vertical growth in mono- and dizygotic twins up to 15–18 years of age. Angle Orthod. 2021, 91, 384–390. [Google Scholar] [CrossRef] [PubMed]
- Anusuya, V.; Nagar, A.; Tandon, P.; Singh, G.K.; Singh, G.P.; Mahdi, A.A. Serum DHEA-S levels could be used as a comparable diagnostic test to assess the pubertal growth spurt in dentofacial orthopedics. Prog. Orthod. 2020, 21, 15. [Google Scholar] [CrossRef]
- Kelly, M.P.; Vorperian, H.K.; Wang, Y.; Tillman, K.K.; Werner, H.M.; Chung, M.K.; Gentry, L.R. Characterizing mandibular growth using three-dimensional imaging techniques and anatomic landmarks. Arch. Oral Biol. 2017, 77, 27–38. [Google Scholar] [CrossRef]
- Yu, S.; Tang, Q.; Xie, M.; Zhou, X.; Long, Y.; Xie, Y.; Guo, F.; Chen, L. Circadian BMAL1 regulates mandibular condyle development by hedgehog pathway. Cell Prolif. 2020, 53, e12727. [Google Scholar] [CrossRef]
- Kahn, S.; Ehrlich, P.; Feldman, M.; Sapolsky, R.; Wong, S. The Jaw Epidemic: Recognition, Origins, Cures, and Prevention. Bioscience 2020, 70, 759–771. [Google Scholar] [CrossRef] [PubMed]
- Liu, C.; Kaneko, S.; Soma, K. Effects of a mandibular lateral shift on the condyle and mandibular bone in growing rats. Angle Orthod. 2007, 77, 787–793. [Google Scholar] [CrossRef] [PubMed]
- Maspero, C.; Cavagnetto, D.; Abate, A.; Cressoni, P.; Farronato, M. Effects on the Facial Growth of Rapid Palatal Expansion in Growing Patients Affected by Juvenile Idiopathic Arthritis with Monolateral Involvement of the Temporomandibular Joints: A Case-Control Study on Posteroanterior and Lateral Cephalograms. J. Clin. Med. 2020, 9, 1159. [Google Scholar] [CrossRef] [PubMed]
- Alabdulrazaq, R.S.; Al-Haj Ali, S.N. Parental Reported Bullying among Saudi Schoolchildren: Its Forms, Effect on Academic Abilities, and Associated Sociodemographic, Physical, and Dentofacial Features. Int. J. Pediatr. 2020, 2020, 8899320. [Google Scholar] [CrossRef] [PubMed]
- Langlois, J.H.; Kalakanis, L.; Rubenstein, A.J.; Larson, A.; Hallam, M.; Smoot, M. Maxims or myths of beauty? A meta-analytic and theoretical review. Psychol. Bull. 2000, 126, 390–423. [Google Scholar] [CrossRef] [PubMed]
- Proffit, W.R.; Jackson, T.H.; Turvey, T.A. Changes in the pattern of patients receiving surgical-orthodontic treatment. Am. J. Orthod. Dentofac. Orthop. 2013, 143, 793–798. [Google Scholar] [CrossRef] [PubMed]
- Al-Taai, N.; LevringJäghagen, E.; Persson, M.; Ransjö, M.; Westerlund, A. A Superimposition-Based Cephalometric Method to Quantitate Craniofacial Changes. Int. J. Environ. Res. Public Health 2021, 18, 5260. [Google Scholar] [CrossRef] [PubMed]
- Devereux, L.; Moles, D.; Cunningham, S.J.; McKnight, M. How important are lateral cephalometric radiographs in orthodontic treatment planning? Am. J. Orthod. Dentofac. Orthop. 2011, 139, e175–e181. [Google Scholar] [CrossRef] [PubMed]
- Chadwick, J.W.; Prentice, R.N.; Major, P.W.; Lam, E.W. Image distortion and magnification of 3 digital CCD cephalometric systems. Oral Surg. Oral Med. Oral Pathol. Oral Radiol. Endod. 2009, 107, 105–112. [Google Scholar] [CrossRef] [PubMed]
- Houston, W.J. The analysis of errors in orthodontic measurements. Am. J. Orthod. 1983, 83, 382–390. [Google Scholar] [CrossRef]
- Paula, L.K.; Solon-de-Mello Pde, A.; Mattos, C.T.; Ruellas, A.C.; Sant’Anna, E.F. Influence of magnification and superimposition of structures on cephalometric diagnosis. Dent. Press J. Orthod. 2015, 20, 29–34. [Google Scholar] [CrossRef] [PubMed][Green Version]
- Durão, A.P.; Morosolli, A.; Pittayapat, P.; Bolstad, N.; Ferreira, A.P.; Jacobs, R. Cephalometric landmark variability among orthodontists and dentomaxillofacial radiologists: A comparative study. Imaging Sci. Dent. 2015, 45, 213–220. [Google Scholar] [CrossRef] [PubMed]
- Ghafari, J.; Baumrind, S.; Efstratiadis, S.S. Misinterpreting growth and treatment outcome from serial cephalographs. Clin. Orthod. Res. 1998, 1, 102–106. [Google Scholar] [CrossRef] [PubMed]
- Botticelli, S.; Verna, C.; Cattaneo, P.M.; Heidmann, J.; Melsen, B. Two- versus three-dimensional imaging in subjects with unerupted maxillary canines. Eur. J. Orthod. 2011, 33, 344–349. [Google Scholar] [CrossRef]
- Kau, C.H.; Richmond, S.; Palomo, J.M.; Hans, M.G. Three-dimensional cone beam computerized tomography in orthodontics. J. Orthod. 2005, 32, 282–293. [Google Scholar] [CrossRef] [PubMed]
- Tulunoglu, O.; Esenlik, E.; Gulsen, A.; Tulunoglu, I. A comparison of three-dimensional and two-dimensional cephalometric evaluations of children with cleft lip and palate. Eur. J. Dent. 2011, 5, 451–458. [Google Scholar] [CrossRef]
- Wei, D.; Zhang, L.; Li, W.; Jia, Y. Quantitative Comparison of Cephalogram and Cone-Beam Computed Tomography in the Evaluation of Alveolar Bone Thickness of Maxillary Incisors. Turk. J. Orthod. 2020, 33, 85–91. [Google Scholar] [CrossRef] [PubMed]
- American Academy of Oral and Maxillofacial Radiology. Clinical recommendations regarding use of cone beam computed tomography in orthodontics. [corrected]. Position statement by the American Academy of Oral and Maxillofacial Radiology. Oral Surg. Oral Med. Oral Pathol. Oral Radiol. 2013, 116, 238–257, Erratum in Oral Surg. Oral Med. Oral Pathol. Oral Radiol. 2013, 116, 661. [Google Scholar] [CrossRef]
- Coşkun, İ.; Kaya, B. Cone Beam Computed Tomography in Orthodontics. Turk. J. Orthod. 2018, 31, 55–61. [Google Scholar] [CrossRef] [PubMed]
- Kapila, S.D.; Nervina, J.M. CBCT in orthodontics: Assessment of treatment outcomes and indications for its use. Dentomaxillofac. Radiol. 2015, 44, 20140282. [Google Scholar] [CrossRef] [PubMed]
- Abdelkarim, A. Cone-Beam Computed Tomography in Orthodontics. Dent. J. 2019, 7, 89. [Google Scholar] [CrossRef] [PubMed]
- Theodorakou, C.; Walker, A.; Horner, K.; Pauwels, R.; Bogaerts, R.; Jacobs, R. SEDENTEXCT Project Consortium. Estimation of paediatric organ and effective doses from dental cone beam CT using anthropomorphic phantoms. Br. J. Radiol. 2012, 85, 153–160. [Google Scholar] [CrossRef]
- Grünheid, T.; KolbeckSchieck, J.R.; Pliska, B.T.; Ahmad, M.; Larson, B.E. Dosimetry of a cone-beam computed tomography machine compared with a digital X-ray machine in orthodontic imaging. Am. J. Orthod. Dentofac. Orthop. 2012, 141, 436–443. [Google Scholar] [CrossRef] [PubMed]
- Pauwels, R.; Beinsberger, J.; Collaert, B.; Theodorakou, C.; Rogers, J.; Walker, A.; Cockmartin, L.; Bosmans, H.; Jacobs, R.; Bogaerts, R.; et al. SEDENTEXCT Project Consortium. Effective dose range for dental cone beam computed tomography scanners. Eur. J. Radiol. 2012, 81, 267–271. [Google Scholar] [CrossRef] [PubMed]
- Kapetanović, A.; Oosterkamp, B.C.M.; Lamberts, A.A.; Schols, J.G.J.H. Orthodontic radiology: Development of a clinical practice guideline. Radiol. Med. 2021, 126, 72–82. [Google Scholar] [CrossRef] [PubMed]
- Navarro Rde, L.; Oltramari-Navarro, P.V.; Fernandes, T.M.; Oliveira, G.F.; Conti, A.C.; Almeida, M.R.; Almeida, R.R. Comparison of manual, digital and lateral CBCT cephalometric analyses. J. Appl. Oral Sci. 2013, 21, 167–176. [Google Scholar] [CrossRef] [PubMed]
- Nalçaci, R.; Oztürk, F.; Sökücü, O. A comparison of two-dimensional radiography and three-dimensional computed tomography in angular cephalometric measurements. Dentomaxillofac Radiol. 2010, 39, 100–106. [Google Scholar] [CrossRef]
- Kumar, V.; Ludlow, J.; SoaresCevidanes, L.H.; Mol, A. In vivo comparison of conventional and cone beam CT synthesized cephalograms. Angle Orthod. 2008, 78, 873–879. [Google Scholar] [CrossRef] [PubMed]
- Maspero, C.; Farronato, M.; Bellincioni, F.; Cavagnetto, D.; Abate, A. Assessing mandibular body changes in growing subjects: A comparison of CBCT and reconstructed lateral cephalogram measurements. Sci. Rep. 2020, 10, 11722. [Google Scholar] [CrossRef]
- Sfogliano, L.; Abood, A.; Viana, G.; Kusnoto, B. Cephalometric evaluation of posteroanterior projection of reconstructed three-dimensional Cone beam computed tomography, two-dimensional conventional radiography, and direct measurements. J. World Fed. Orthod. 2016, 5, 22–27. [Google Scholar] [CrossRef]
- Li, N.; Hu, B.; Mi, F.; Song, J. Preliminary evaluation of cone beam computed tomography in three-dimensional cephalometry for clinical application. Exp. Ther. Med. 2017, 13, 2451–2455. [Google Scholar] [CrossRef][Green Version]
- Lin, H.S.; Li, J.D.; Chen, Y.J.; Lin, C.C.; Lu, T.W.; Chen, M.H. Comparison of measurements of mandible growth using cone beam computed tomography and its synthesized cephalograms. Biomed. Eng. Online 2014, 13, 133. [Google Scholar] [CrossRef] [PubMed]
- Ludlow, J.B.; Gubler, M.; Cevidanes, L.; Mol, A. Precision of cephalometric landmark identification: Cone-beam computed tomography vs. conventional cephalometric views. Am. J. Orthod. Dentofac. Orthop. 2009, 136, 312.e1–312.e10, discussion 312–313. [Google Scholar] [CrossRef]
- Park, C.S.; Park, J.K.; Kim, H.; Han, S.S.; Jeong, H.G.; Park, H. Comparison of conventional lateral cephalograms with corresponding CBCT radiographs. Imaging Sci. Dent. 2012, 42, 201–205. [Google Scholar] [CrossRef]
- Herring, S.W. TMJ anatomy and animal models. J. Musculoskelet. Neuronal. Interact. 2003, 3, 391–394. [Google Scholar] [PubMed]
- Suzuki, A.; Iwata, J. Mouse genetic models for temporomandibular joint development and disorders. Oral Dis. 2016, 22, 33–38. [Google Scholar] [CrossRef] [PubMed]
- Asano, T. The effects of mandibular retractive force on the growing rat mandible. Am. J. Orthod. Dentofac. Orthop. 1986, 90, 464–474. [Google Scholar] [CrossRef]
- Ingervall, B.; Fredén, H.; Heyden, G. Histochemical study of mandibular joint adaptation in experimental posterior mandibular displacement in the rat. Arch. Oral Biol. 1972, 17, 661–671. [Google Scholar] [CrossRef]
- Wang, S.; Sun, Y.; Xia, L.; Li, H.; Xu, Y.; Hua, X. Effects of Twin Inclined Plane Device on Adaptation and Ultrastructure Variations in Condyle of Growing Rats. BioMed Res. Int. 2019, 2019, 3069347. [Google Scholar] [CrossRef]
- Padzys, G.S.; Tankosic, C.; Trabalon, M.; Martrette, J.M. Craniofacial development and physiological state after early oral breathing in rats. Eur. J. Oral Sci. 2012, 120, 21–28. [Google Scholar] [CrossRef]
- Tsolakis, A.I.; Spyropoulos, M.N.; Katsavrias, E.; Alexandridis, K. Effects of altered mandibular function on mandibular growth after condylectomy. Eur. J. Orthod. 1997, 19, 9–19. [Google Scholar] [CrossRef]
- Desai, S.; Johnson, D.L.; Howes, R.I.; Rohrer, M.D. Changes in the rabbit temporomandibular joint associated with posterior displacement of the mandible. Int. J. Prosthodont. 1996, 9, 46–57. [Google Scholar]
- Bland, J.M.; Altman, D.G. Statistical methods for assessing agreement between two methods of clinical measurement. Lancet 1986, 1, 307–310. [Google Scholar] [CrossRef]
- Lin, L.I. A concordance correlation coefficient to evaluate reproducibility. Biometrics 1989, 45, 255–268. [Google Scholar] [CrossRef] [PubMed]
- Lin, F.; Ren, M.; Yao, L.; He, Y.; Guo, J.; Ye, Q. Psychosocial impact of dental esthetics regulates motivation to seek orthodontic treatment. Am. J. Orthod. Dentofac. Orthop. 2016, 150, 476–482. [Google Scholar] [CrossRef]
- Shen, H.; Chau, D.K.; Su, J.; Zeng, L.L.; Jiang, W.; He, J.; Fan, J.; Hu, D. Brain responses to facial attractiveness induced by facial proportions: Evidence from an fMRI study. Sci. Rep. 2016, 6, 35905. [Google Scholar] [CrossRef] [PubMed]
- Sofer, C.; Dotsch, R.; Wigboldus, D.H.; Todorov, A. What is typical is good: The influence of face typicality on perceived trustworthiness. Psychol. Sci. 2015, 26, 39–47. [Google Scholar] [CrossRef]
- Frieze, I.H.; Olson, J.E.; Russell, J. Attractiveness and Income for Men and Women in Management. J. Appl. Soc. Psychol. 1991, 21, 1039–1057. [Google Scholar] [CrossRef]
- Lathrop-Marshall, H.; Keyser, M.M.B.; Jhingree, S.; Giduz, N.; Bocklage, C.; Couldwell, S.; Edwards, H.; Glesener, T.; Moss, K.; Frazier-Bowers, S.; et al. Orthognathic speech pathology: Impacts of Class III malocclusion on speech. Eur. J. Orthod. 2021, 25, cjab067. [Google Scholar] [CrossRef] [PubMed]
- Rezaei, F.; Masalehi, H.; Golshah, A.; Imani, M.M. Oral health related quality of life of patients with class III skeletal malocclusion before and after orthognathic surgery. BMC Oral Health 2019, 19, 289. [Google Scholar] [CrossRef] [PubMed]
- Vieira, A.R. Orthodontics and Genetics. Dent. Press J. Orthod. 2019, 24, 92–97. [Google Scholar] [CrossRef] [PubMed]
- Logan, C.A. Commercial Rodents in America: Standard Animals, Model Animals, and Biological Diversity. Brain Behav. Evol. 2019, 93, 70–81. [Google Scholar] [CrossRef]
- Sengupta, P. The Laboratory Rat: Relating Its Age with Human’s. Int. J. Prev. Med. 2013, 4, 624–630. [Google Scholar] [PubMed]
- Bolker, J.A. Selection of Models: Evolution and the Choice of Species for Translational Research. Brain Behav. Evol. 2019, 93, 82–91. [Google Scholar] [CrossRef] [PubMed]
- Baume, L.J.; Derichsweiler, H. Is the condylar growth center responsive to orthodontic therapy? An Experimental study in macacamulatta. Oral Surg. Oral Med. Oral Path. 1961, 14, 347–362. [Google Scholar] [CrossRef]
- Janzen, E.K.; Bluher, J.A. The cephalometric, anatomic, and histologic changes in Macacamulatta after application of a continuous-acting retraction force on the mandible. Am. J. Orthod. 1965, 51, 803–878. [Google Scholar] [CrossRef]
- Roach, H.I.; Mehta, G.; Oreffo, R.O.; Clarke, N.M.; Cooper, C. Temporal analysis of rat growth plates: Cessation of growth with age despite presence of a physis. J. Histochem. Cytochem. 2003, 51, 373–383. [Google Scholar] [CrossRef]
- Andreollo, N.A.; Santos, E.F.; Araújo, M.R.; Lopes, L.R. Rat’s age versus human’s age: What is the relationship? Arq. Bras. Cir. Dig. 2012, 25, 49–51, (In English, Portuguese). [Google Scholar] [CrossRef] [PubMed]
- Quinn, R. Comparing rat’s to human’s age: How old is my rat in people years? Nutrition 2005, 21, 775–777. [Google Scholar] [CrossRef] [PubMed]
- Klein, Z.A.; Romeo, R.D. Changes in hypothalamic-pituitary-adrenal stress responsiveness before and after puberty in rats. Horm. Behav. 2013, 64, 357–363. [Google Scholar] [CrossRef] [PubMed]
- Farias-Neto, A.; Varela Brown Martins, A.P.; Figueroba, S.R.; Groppo, F.C.; de Almeidad, S.M.; Rizzatti-Barbosa, C.M. Altered mandibular growth under functional posterior displacement in rats. Angle Orthod. 2012, 82, 3–7. [Google Scholar] [CrossRef] [PubMed]
- Hua, X.; Xiong, H.; Han, G.; Cheng, X. The effects of gradually induced backward movement of the mandible by a Twin Inclined Plane Device in rats. Angle Orthod. 2012, 82, 839–845. [Google Scholar] [CrossRef]


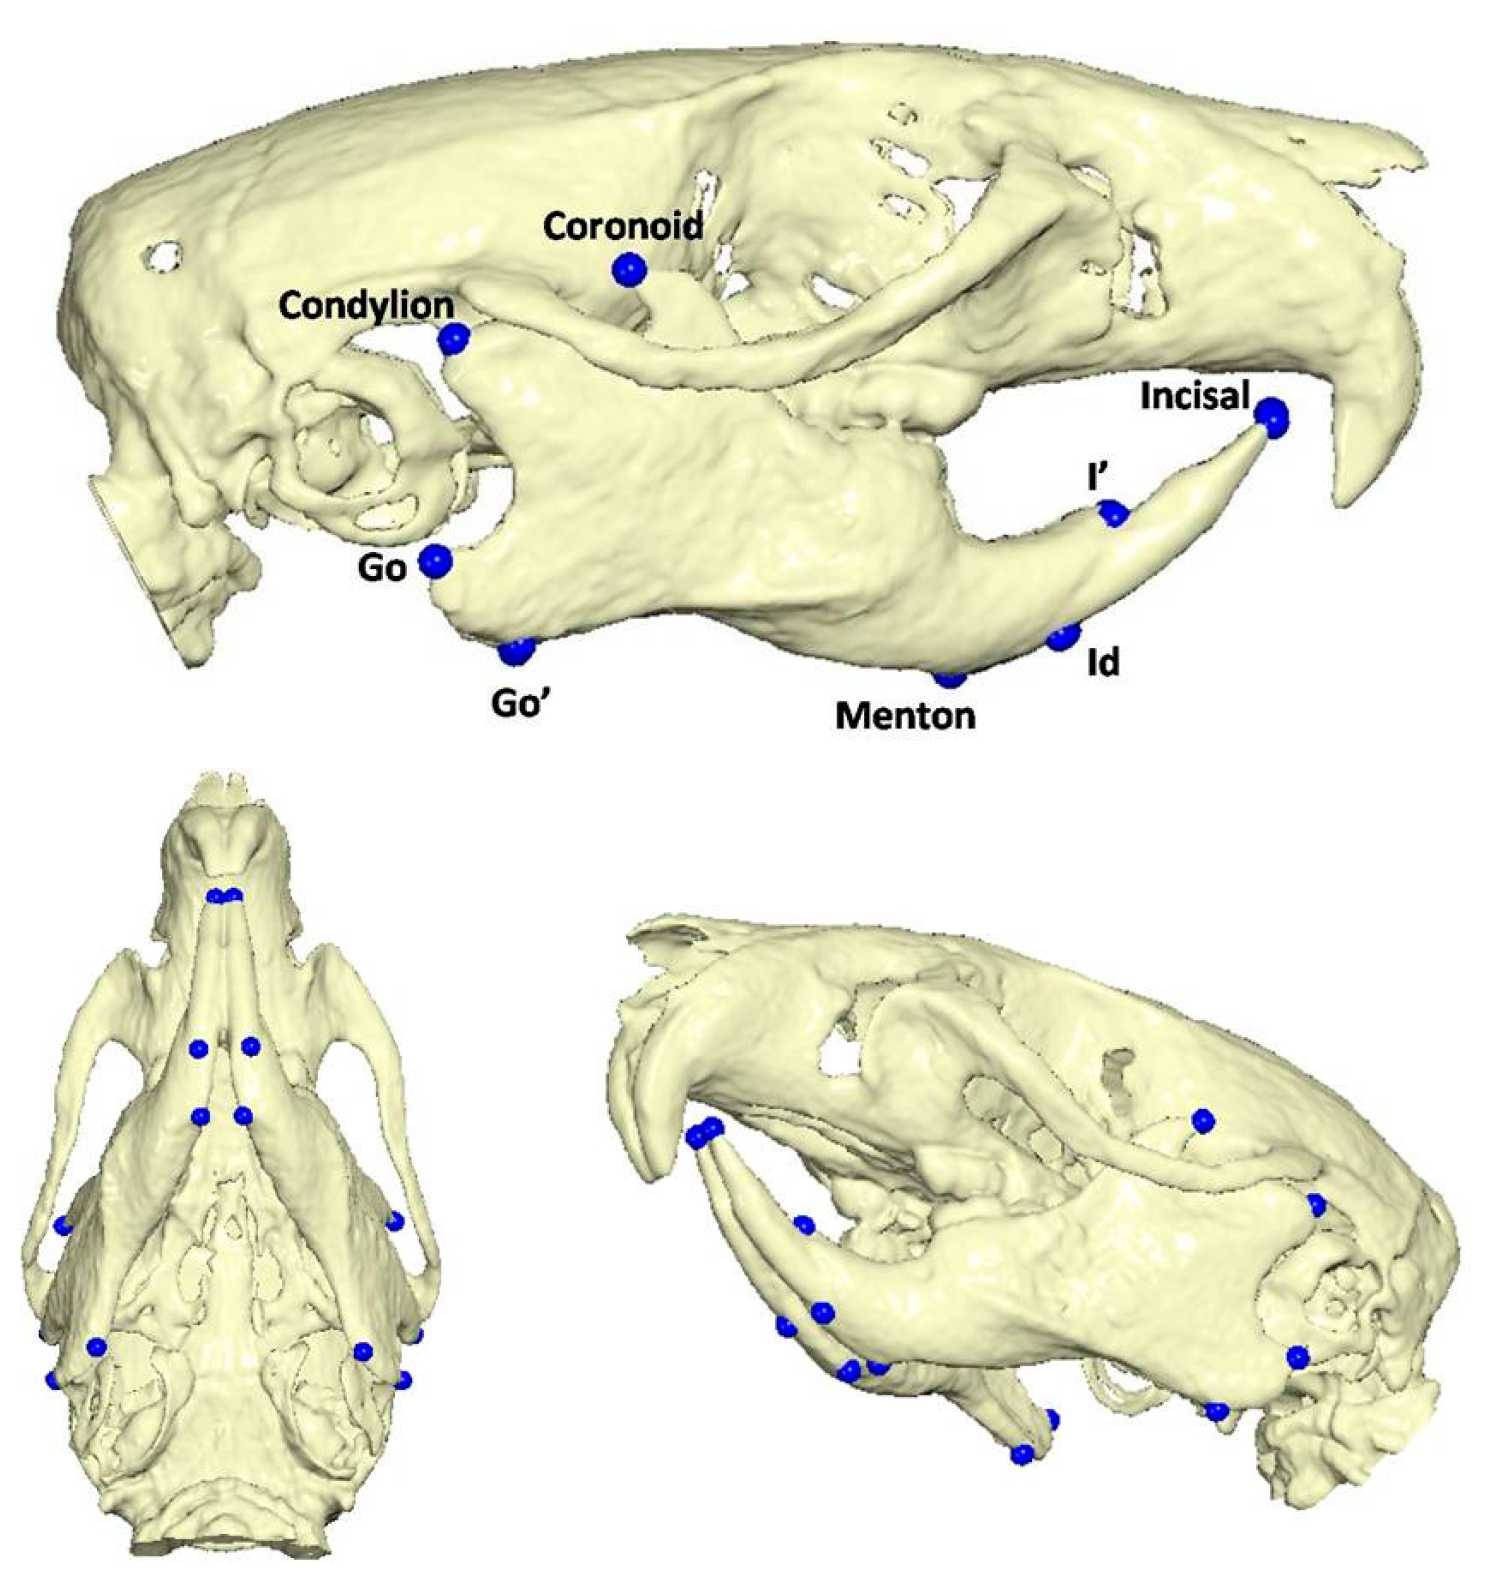
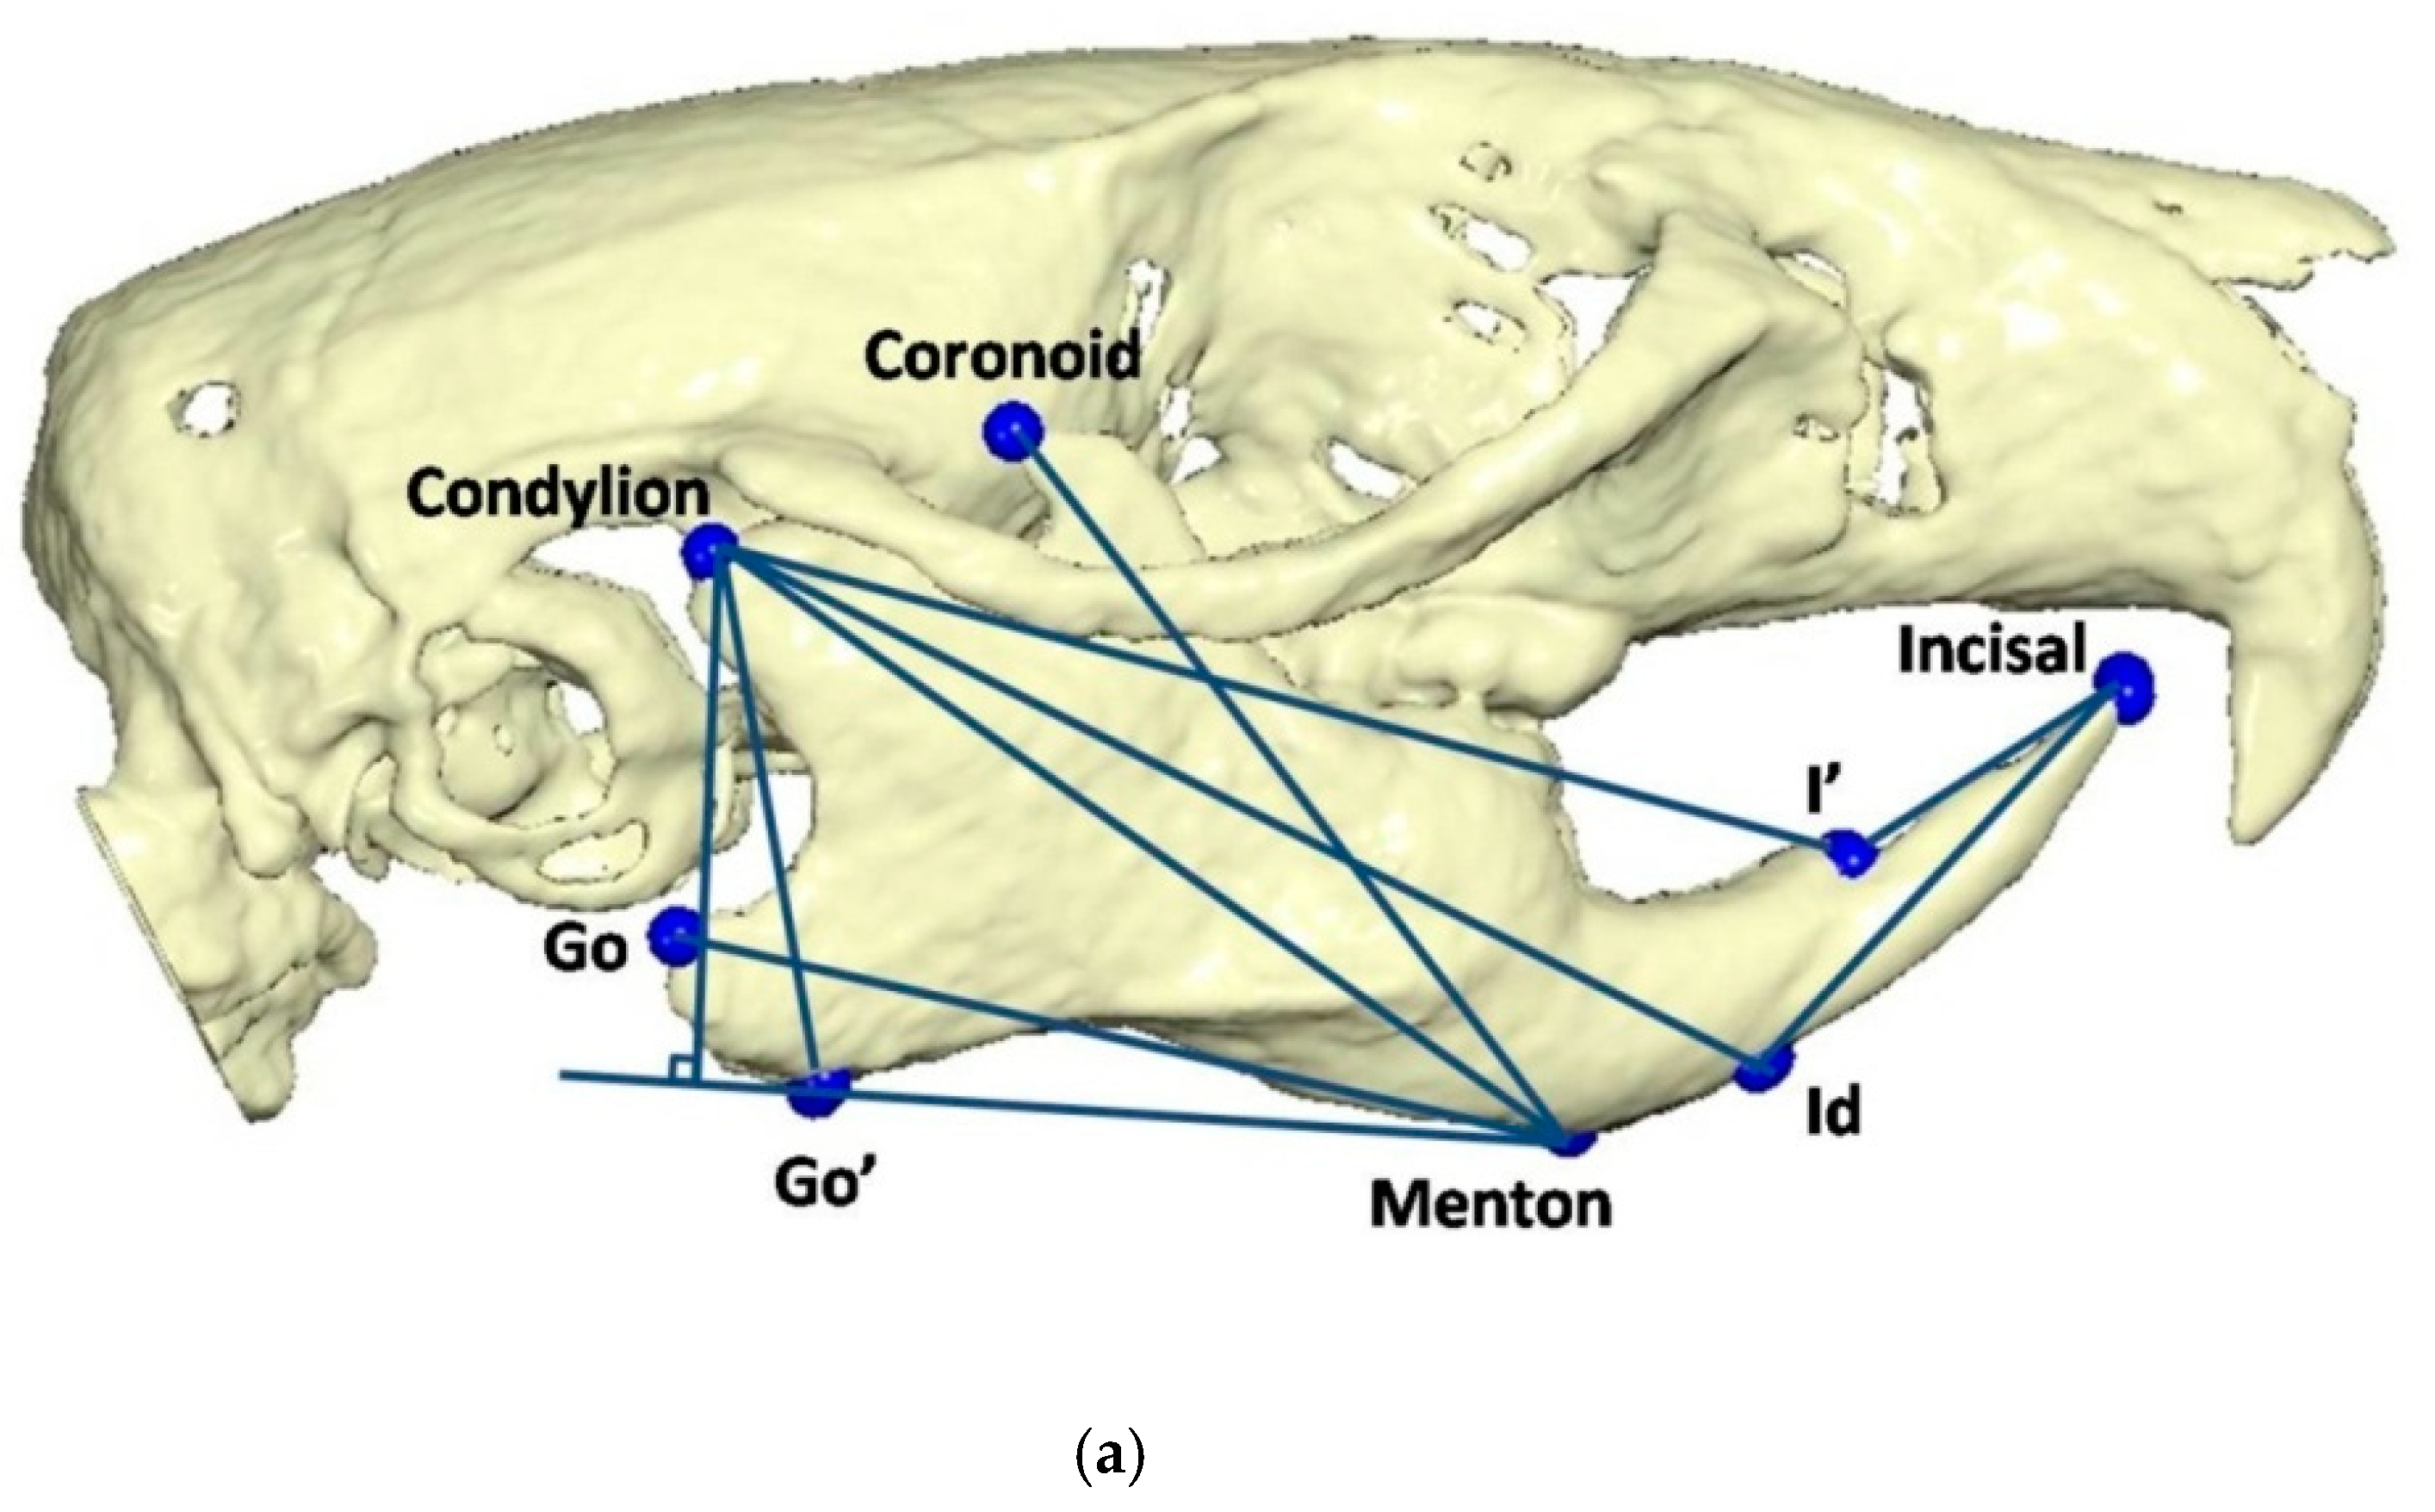
| Anatomic Landmarks | Description |
|---|---|
| Go’ | the lowest point of the gonial process |
| Go | the most posterior point of the gonial process |
| Menton | the lowest point of the mental process |
| Coronoid | the tip of the coronoid process |
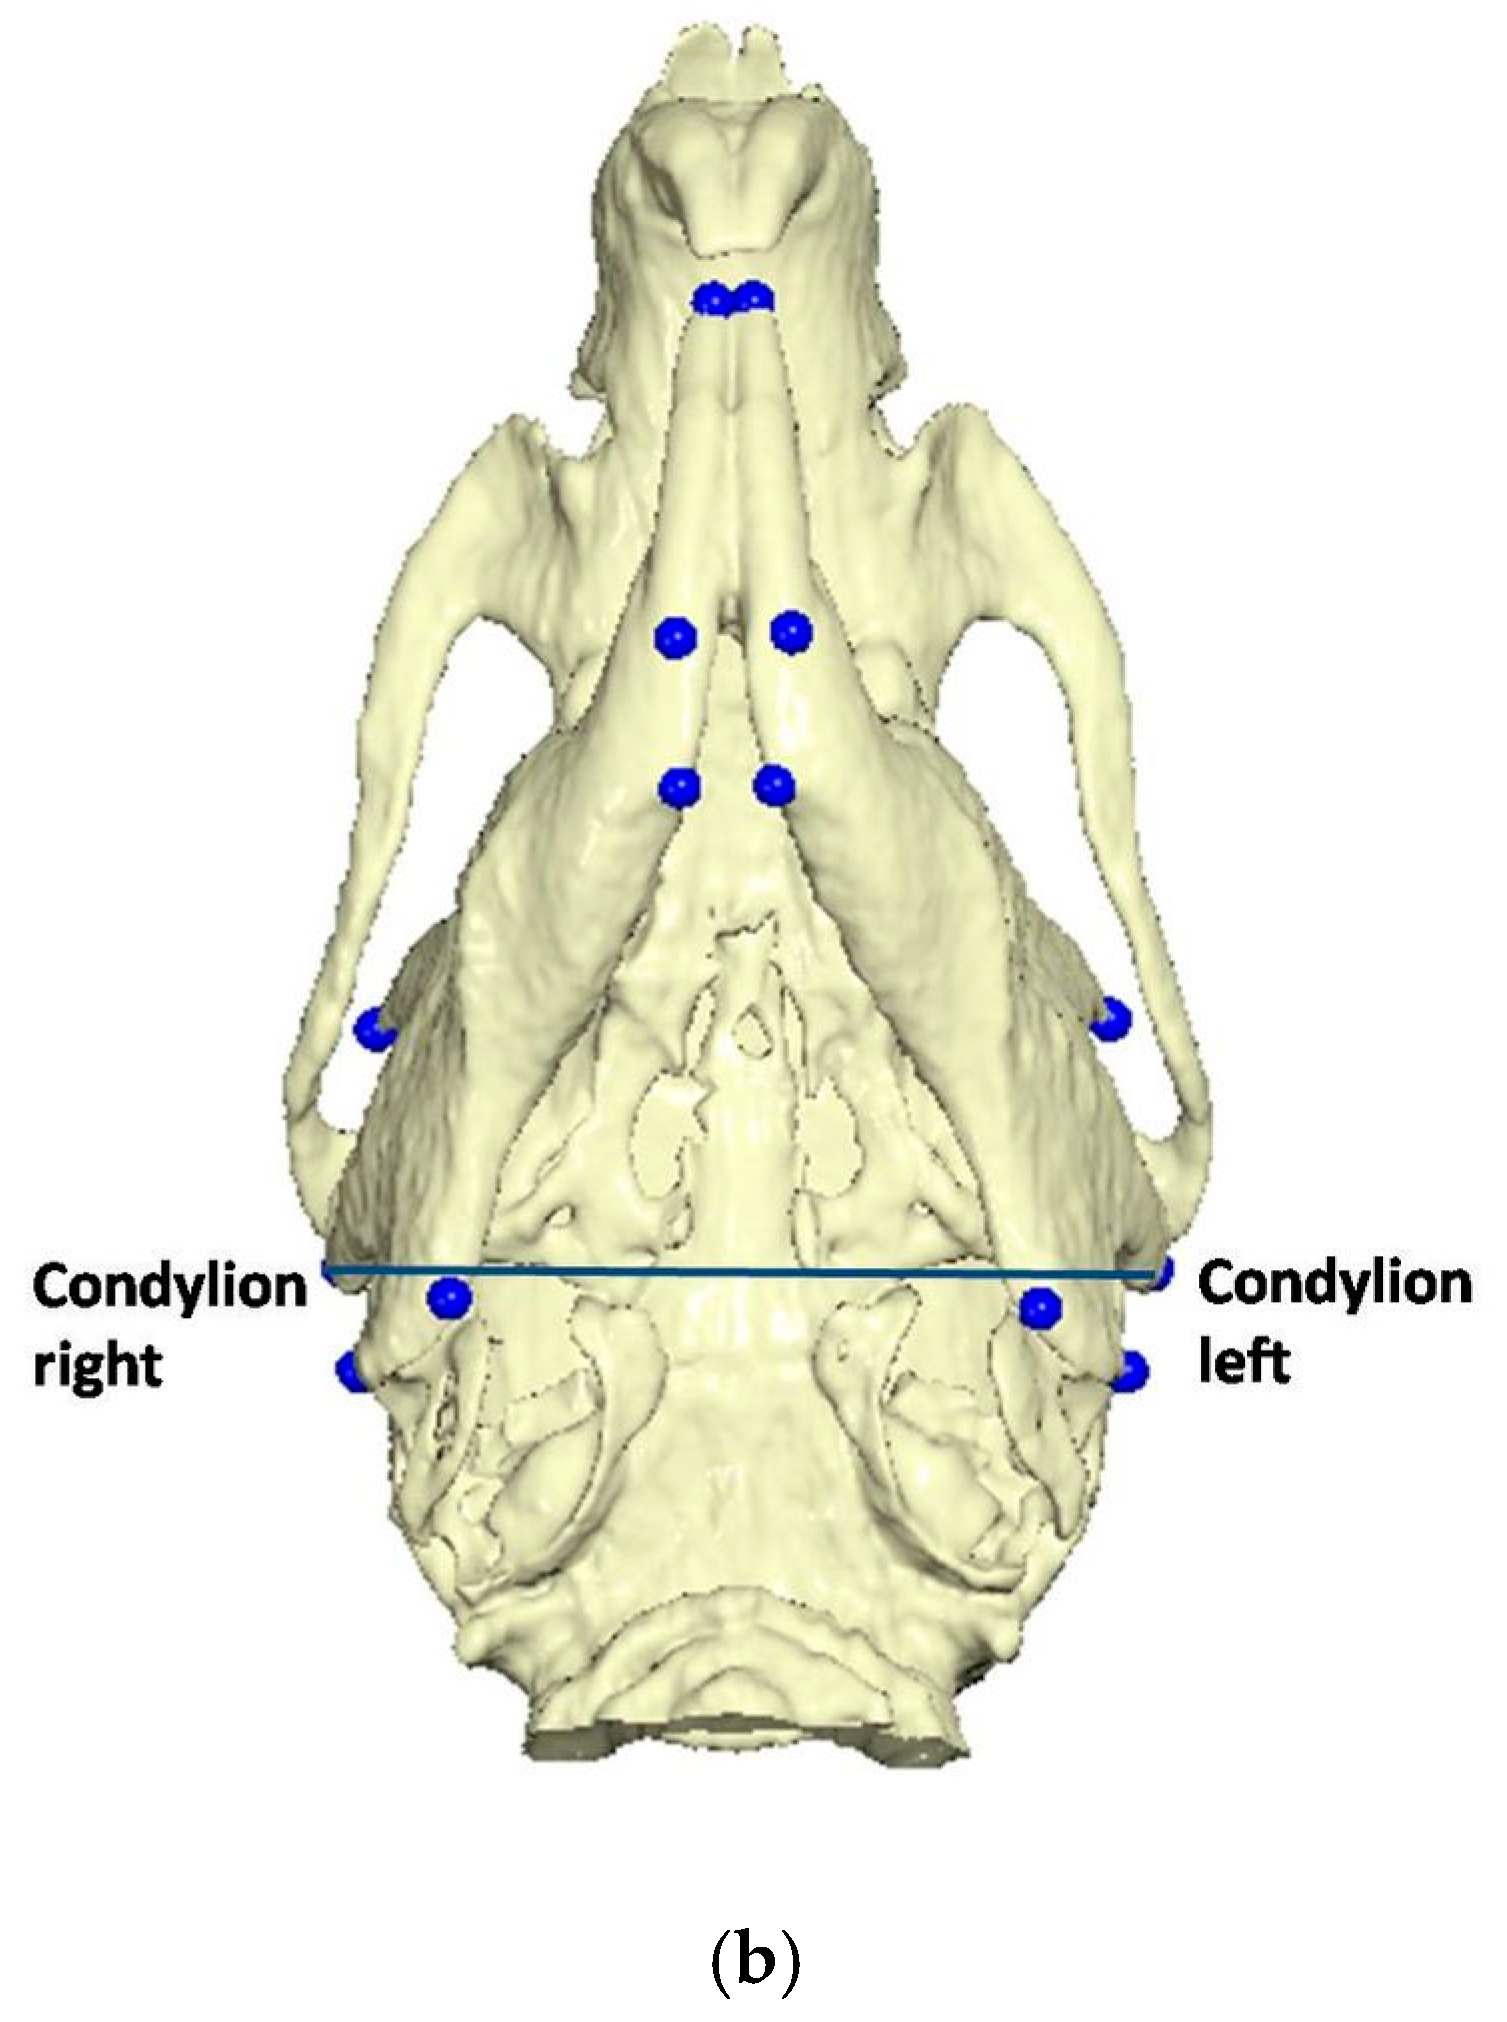
| Condylion | the most posterior and highest point of the condylar process |
| I’ | the most anterior point of the alveolar process at the side of the concavity of the lower incisor |
| Id | the most anterior point of the alveolar process at the side of the convexity of the lower incisor |
| Incisal | Incisal edge of the lower incisor |
| Experimental Group A | Subgroups—Timing | ||||
|---|---|---|---|---|---|
| A1—0d | A2—0d | A3—0d | Overall | ||
| Mean (SD) | Mean (SD) | Mean (SD) | Mean (SD) | p-Value * | |
| Weight Initial (grams) | 117.2 (17.2) | 117.6 (17.5) | 115.8 (13.4) | 116.9 (15.7) | 0.956 |
| Go’–Menton Initial (mm) | 13.60 (0.52) | 14.80 (0.51) | 13.70 (0.53) | 14.03 (0.74) | <0.001 |
| Go–Menton Initial (mm) | 16.75 (0.52) | 17.14 (0.55) | 16.63 (0.46) | 16.84 (0.54) | 0.018 |
| Coronoid–Menton Initial (mm) | 16.17 (0.44) | 16.48 (0.48) | 16.00 (0.56) | 16.22 (0.52) | 0.016 |
| Condylion/Go’–Menton Initial (mm) | 8.29 (0.40) | 8.20 (0.30) | 8.36 (0.33) | 8.28 (0.34) | 0.137 |
| Condylion–Go’ Initial (mm) | 8.81 (0.38) | 8.52 (0.31) | 8.82 (0.26) | 8.71 (0.34) | 0.002 |
| Condylion–Menton Initial (mm) | 18.55 (0.42) | 18.91 (0.45) | 18.48 (0.42) | 18.64 (0.46) | 0.005 |
| Condylion–Id Initial (mm) | 20.65 (0.36) | 20.95 (0.52) | 20.71 (0.49) | 20.77 (0.47) | 0.140 |
| Condylion–I’ Initial (mm) | 20.85 (0.51) | 21.11 (0.48) | 20.75 (0.38) | 20.90 (0.48) | 0.076 |
| Incisal–Id Initial (mm) | 7.87 (0.45) | 7.94 (0.29) | 7.82 (0.28) | 7.88 (0.34) | 0.741 |
| Incisal–I’ Initial (mm) | 5.06 (0.24) | 5.13 (0.27) | 5.27 (0.26) | 5.15 (0.26) | 0.124 |
| Intercondylar Initial (mm) | 17.78 (0.40) | 17.43 (0.33) | 17.50 (0.48) | 17.57 (0.42) | 0.068 |
| A1—30d | A2—60d | A3—90d | Overall | ||
| Mean (SD) | Mean (SD) | Mean (SD) | Mean (SD) | p-Value * | |
| Weight Final (grams) | 256.1 (24.5) | 320.7 (25.0) | 337.0 (58.6) | 304.6 (52.2) | <0.001 |
| Go’–Menton Final (mm) | 15.86 (0.79) | 16.58 (0.69) | 16.83 (0.69) | 16.43 (0.82) | 0.003 |
| Go–Menton Final (mm) | 19.48 (0.46) | 20.81 (0.51) | 21.38 (0.77) | 20.56 (0.99) | <0.001 |
| Coronoid–Menton Final (mm) | 18.74 (0.40) | 20.13 (0.49) | 20.50 (0.98) | 19.79 (1.01) | <0.001 |
| Condylion/Go’–Menton Final (mm) | 9.72 (0.38) | 10.58 (0.26) | 10.78 (0.51) | 10.36 (0.60) | <0.001 |
| Condylion–Go’ Final (mm) | 10.12 (0.40) | 11.02 (0.31) | 11.32 (0.53) | 10.82 (0.66) | <0.001 |
| Condylion–Menton Final (mm) | 20.93 (0.48) | 22.24 (0.48) | 22.87 (0.81) | 22.01 (1.01) | <0.001 |
| Condylion–Id Final (mm) | 23.13 (0.54) | 24.48 (0.60) | 25.10 (0.95) | 24.23 (1.09) | <0.001 |
| Condylion–I’ Final (mm) | 23.06 (0.48) | 24.35 (0.49) | 25.13 (0.75) | 24.18 (1.04) | <0.001 |
| Incisal–Id Final (mm) | 7.40 (0.93) | 9.22 (1.62) | 12.59 (1.00) | 9.73 (2.48) | <0.001 |
| Incisal–I’ Final (mm) | 4.25 (0.97) | 5.63 (1.52) | 8.90 (1.00) | 6.26 (2.29) | <0.001 |
| Intercondylar Final (mm) | 18.02 (0.35) | 18.19 (0.33) | 18.08 (0.54) | 18.10 (0.41) | 0.142 |
| Control Group B | Subgroups—Timing | ||||
|---|---|---|---|---|---|
| B1—0d | B2—0d | B3—0d | Overall | ||
| Mean (SD) | Mean (SD) | Mean (SD) | Mean (SD) | p-Value * | |
| Weight Initial (grams) | 109.4 (12.2) | 105.4 (22.1) | 121.7 (14.7) | 112.2 (17.8) | 0.062 |
| Go’–Menton Initial (mm) | 13.18 (0.43) | 13.40 (0.61) | 13.74 (0.38) | 13.44 (0.52) | 0.075 |
| Go–Menton Initial (mm) | 16.34 (0.44) | 16.28 (0.66) | 16.70 (0.55) | 16.44 (0.57) | 0.804 |
| Coronoid–Menton Initial (mm) | 15.90 (0.39) | 15.74 (0.74) | 15.98 (0.59) | 15.87 (0.58) | 0.348 |
| Condylion/Go’–Menton Initial (mm) | 8.13 (0.34) | 8.26 (0.37) | 8.55 (0.37) | 8.31 (0.39) | 0.040 |
| Condylion–Go’ Initial (mm) | 8.67 (0.34) | 8.72 (0.38) | 8.97 (0.41) | 8.79 (0.39) | 0.413 |
| Condylion–Menton Initial (mm) | 18.11 (0.50) | 18.18 (0.71) | 18.50 (0.52) | 18.26 (0.59) | 0.400 |
| Condylion–Id Initial (mm) | 20.36 (0.59) | 20.37 (0.81) | 20.61 (0.64) | 20.45 (0.68) | 0.345 |
| Condylion–I’ Initial (mm) | 20.42 (0.52) | 20.44 (0.78) | 20.72 (0.58) | 20.53 (0.63) | 0.546 |
| Incisal–Id Initial (mm) | 7.64 (0.26) | 7.73 (0.32) | 7.95 (0.54) | 7.77 (0.40) | 0.381 |
| Incisal–I’ Initial (mm) | 5.17 (0.31) | 5.15 (0.22) | 5.33 (0.43) | 5.21 (0.33) | 0.865 |
| Intercondylar Initial (mm) | 17.60 (0.47) | 17.43 (0.50) | 17.65 (0.55) | 17.56 (0.50) | 0.604 |
| B1—30d | B2—60d | B3—90d | Overall | ||
| Mean (SD) | Mean (SD) | Mean (SD) | Mean (SD) | ||
| Weight Final | 282.3 (18.1) | 365.3 (35.0) | 430.2 (30.1) | 359.2 (67.4) | <0.001 |
| Go’–Menton Final (mm) | 17.43 (0.43) | 18.74 (0.51) | 19.92 (0.80) | 18.69 (1.19) | <0.001 |
| Go–Menton Final (mm) | 20.30 (0.60) | 21.63 (0.67) | 22.93 (0.56) | 21.62 (1.24) | <0.001 |
| Coronoid–Menton Final (mm) | 19.35 (0.51) | 20.63 (0.43) | 21.61 (0.47) | 20.53 (1.05) | <0.001 |
| Condylion/Go’–Menton Final (mm) | 9.66 (0.44) | 10.56 (0.58) | 11.23 (0.23) | 10.48 (0.78) | <0.001 |
| Condylion–Go’ Final (mm) | 9.86 (0.46) | 10.72 (0.58) | 11.32 (0.25) | 10.63 (0.75) | <0.001 |
| Condylion–Menton Final (mm) | 21.60 (0.67) | 23.06 (0.33) | 23.91 (0.37) | 22.86 (1.08) | <0.001 |
| Condylion–Id Final (mm) | 23.90 (0.72) | 25.79 (0.54) | 26.45 (0.41) | 25.38 (1.23) | <0.001 |
| Condylion–I’ Final (mm) | 23.93 (0.58) | 25.69 (0.39) | 26.44 (0.48) | 25.36 (1.17) | <0.001 |
| Incisal–Id Final (mm) | 10.05 (0.38) | 11.06 (0.37) | 11.81 (0.48) | 10.98 (0.83) | <0.001 |
| Incisal–I’ Final (mm) | 6.92 (0.23) | 7.72 (0.28) | 8.13 (0.32) | 7.59 (0.58) | 0.001 |
| Intercondylar Final (mm) | 18.02 (0.41) | 18.07 (0.48) | 18.18 (0.49) | 18.09 (0.45) | 0.642 |
| p-Values * | |||
|---|---|---|---|
| Measurement | A1 vs. B1 | A2 vs. B2 | A3 vs. B3 |
| Weight Initial | 0.764 | 0.222 | >0.999 |
| Go’–Menton Initial | 0.262 | <0.001 | >0.999 |
| Go–Menton Initial | 0.436 | 0.003 | >0.999 |
| Coronoid–Menton Initial | >0.999 | 0.016 | 0.810 |
| Condylion/Go’–Menton Initial | >0.999 | 0.027 | 0.953 |
| Condylion–Go’ Initial | >0.999 | 0.001 | >0.999 |
| Condylion–Menton Initial | 0.177 | 0.005 | 0.900 |
| Condylion–Id Initial | >0.999 | 0.363 | 0.206 |
| Condylion–I’ Initial | 0.345 | 0.059 | 0.605 |
| Incisal–Id Initial | 0.775 | >0.999 | >0.999 |
| Incisal–I’ Initial | 0.353 | 0.873 | >0.999 |
| Intercondylar Initial | >0.999 | 0.590 | >0.999 |
| Weight Final | 0.202 | 0.007 | <0.001 |
| Go’–Menton Final | <0.001 | <0.001 | <0.001 |
| Go–Menton Final | <0.001 | <0.001 | <0.001 |
| Coronoid–Menton Final | 0.002 | 0.001 | <0.001 |
| Condylion/Go’–Menton Final | >0.999 | >0.999 | 0.104 |
| Condylion–Go’ Final | 0.793 | 0.056 | >0.999 |
| Condylion–Menton Final | <0.001 | <0.001 | <0.001 |
| Condylion–Id Final | 0.001 | <0.001 | <0.001 |
| Condylion–I’ Final | <0.001 | <0.001 | <0.001 |
| Incisal–Id Final | <0.001 | <0.001 | >0.999 |
| Incisal–I’ Final | <0.001 | <0.001 | 0.245 |
| Intercondylar Final | >0.999 | >0.999 | >0.999 |
| p-Values * | ||||||
|---|---|---|---|---|---|---|
| Measurement | A1 vs. A2 | A1 vs. A3 | A2 vs. A3 | B1 vs. B2 | B1 vs. B3 | B2 vs. B3 |
| Weight Initial | >0.999 | >0.999 | >0.999 | >0.999 | 0.295 | 0.075 |
| Go’–Menton Initial | <0.001 | >0.999 | <0.001 | 0.211 | 0.194 | >0.999 |
| Go–Menton Initial | 0.116 | >0.999 | 0.031 | >0.999 | >0.999 | >0.999 |
| Coronoid–Menton Initial | 0.192 | >0.999 | 0.020 | >0.999 | 0.627 | >0.999 |
| Condylion/Go’–Menton Initial | >0.999 | >0.999 | 0.189 | 0.153 | 0.089 | >0.999 |
| Condylion–Go’ Initial | 0.016 | >0.999 | 0.007 | >0.999 | 0.959 | 0.959 |
| Condylion–Menton Initial | 0.027 | >0.999 | 0.014 | 0.711 | >0.999 | >0.999 |
| Condylion–Id Initial | 0.205 | >0.999 | 0.831 | >0.999 | >0.999 | 0.595 |
| Condylion–I’ Initial | 0.338 | >0.999 | 0.128 | >0.999 | >0.999 | >0.999 |
| Incisal–Id Initial | >0.999 | >0.999 | >0.999 | >0.999 | 0.726 | >0.999 |
| Incisal–I’ Initial | >0.999 | 0.192 | 0.618 | >0.999 | >0.999 | >0.999 |
| Intercondylar Initial | 0.099 | 0.415 | >0.999 | >0.999 | >0.999 | >0.999 |
| Weight Final | <0.001 | <0.001 | 0.999 | <0.001 | <0.001 | <0.001 |
| Go’–Menton Final | >0.999 | 0.003 | 0.212 | 0.266 | 0.001 | 0.152 |
| Go–Menton Final | <0.001 | <0.001 | 0.009 | <0.001 | <0.001 | <0.001 |
| Coronoid–Menton Final | <0.001 | <0.001 | 0.023 | <0.001 | <0.001 | 0.001 |
| Condylion/Go’–Menton Final | <0.001 | <0.001 | >0.999 | <0.001 | <0.001 | 0.009 |
| Condylion–Go’ Final | <0.001 | <0.001 | >0.999 | <0.001 | <0.001 | 0.028 |
| Condylion–Menton Final | <0.001 | <0.001 | <0.001 | <0.001 | <0.001 | 0.005 |
| Condylion–Id Final | <0.001 | <0.001 | 0.012 | <0.001 | <0.001 | 0.117 |
| Condylion–I’ Final | <0.001 | <0.001 | <0.001 | <0.001 | <0.001 | 0.011 |
| Incisal–Id Final | <0.001 | <0.001 | <0.001 | 0.007 | <0.001 | 0.594 |
| Incisal–I’ Final | 0.003 | <0.001 | <0.001 | 0.032 | 0.002 | >0.999 |
| Intercondylar Final | 0.198 | 0.990 | >0.999 | >0.999 | >0.999 | >0.999 |
| Final–Initial | Mean Difference (mm) | 95% Conf. Interval | p-Value | |
|---|---|---|---|---|
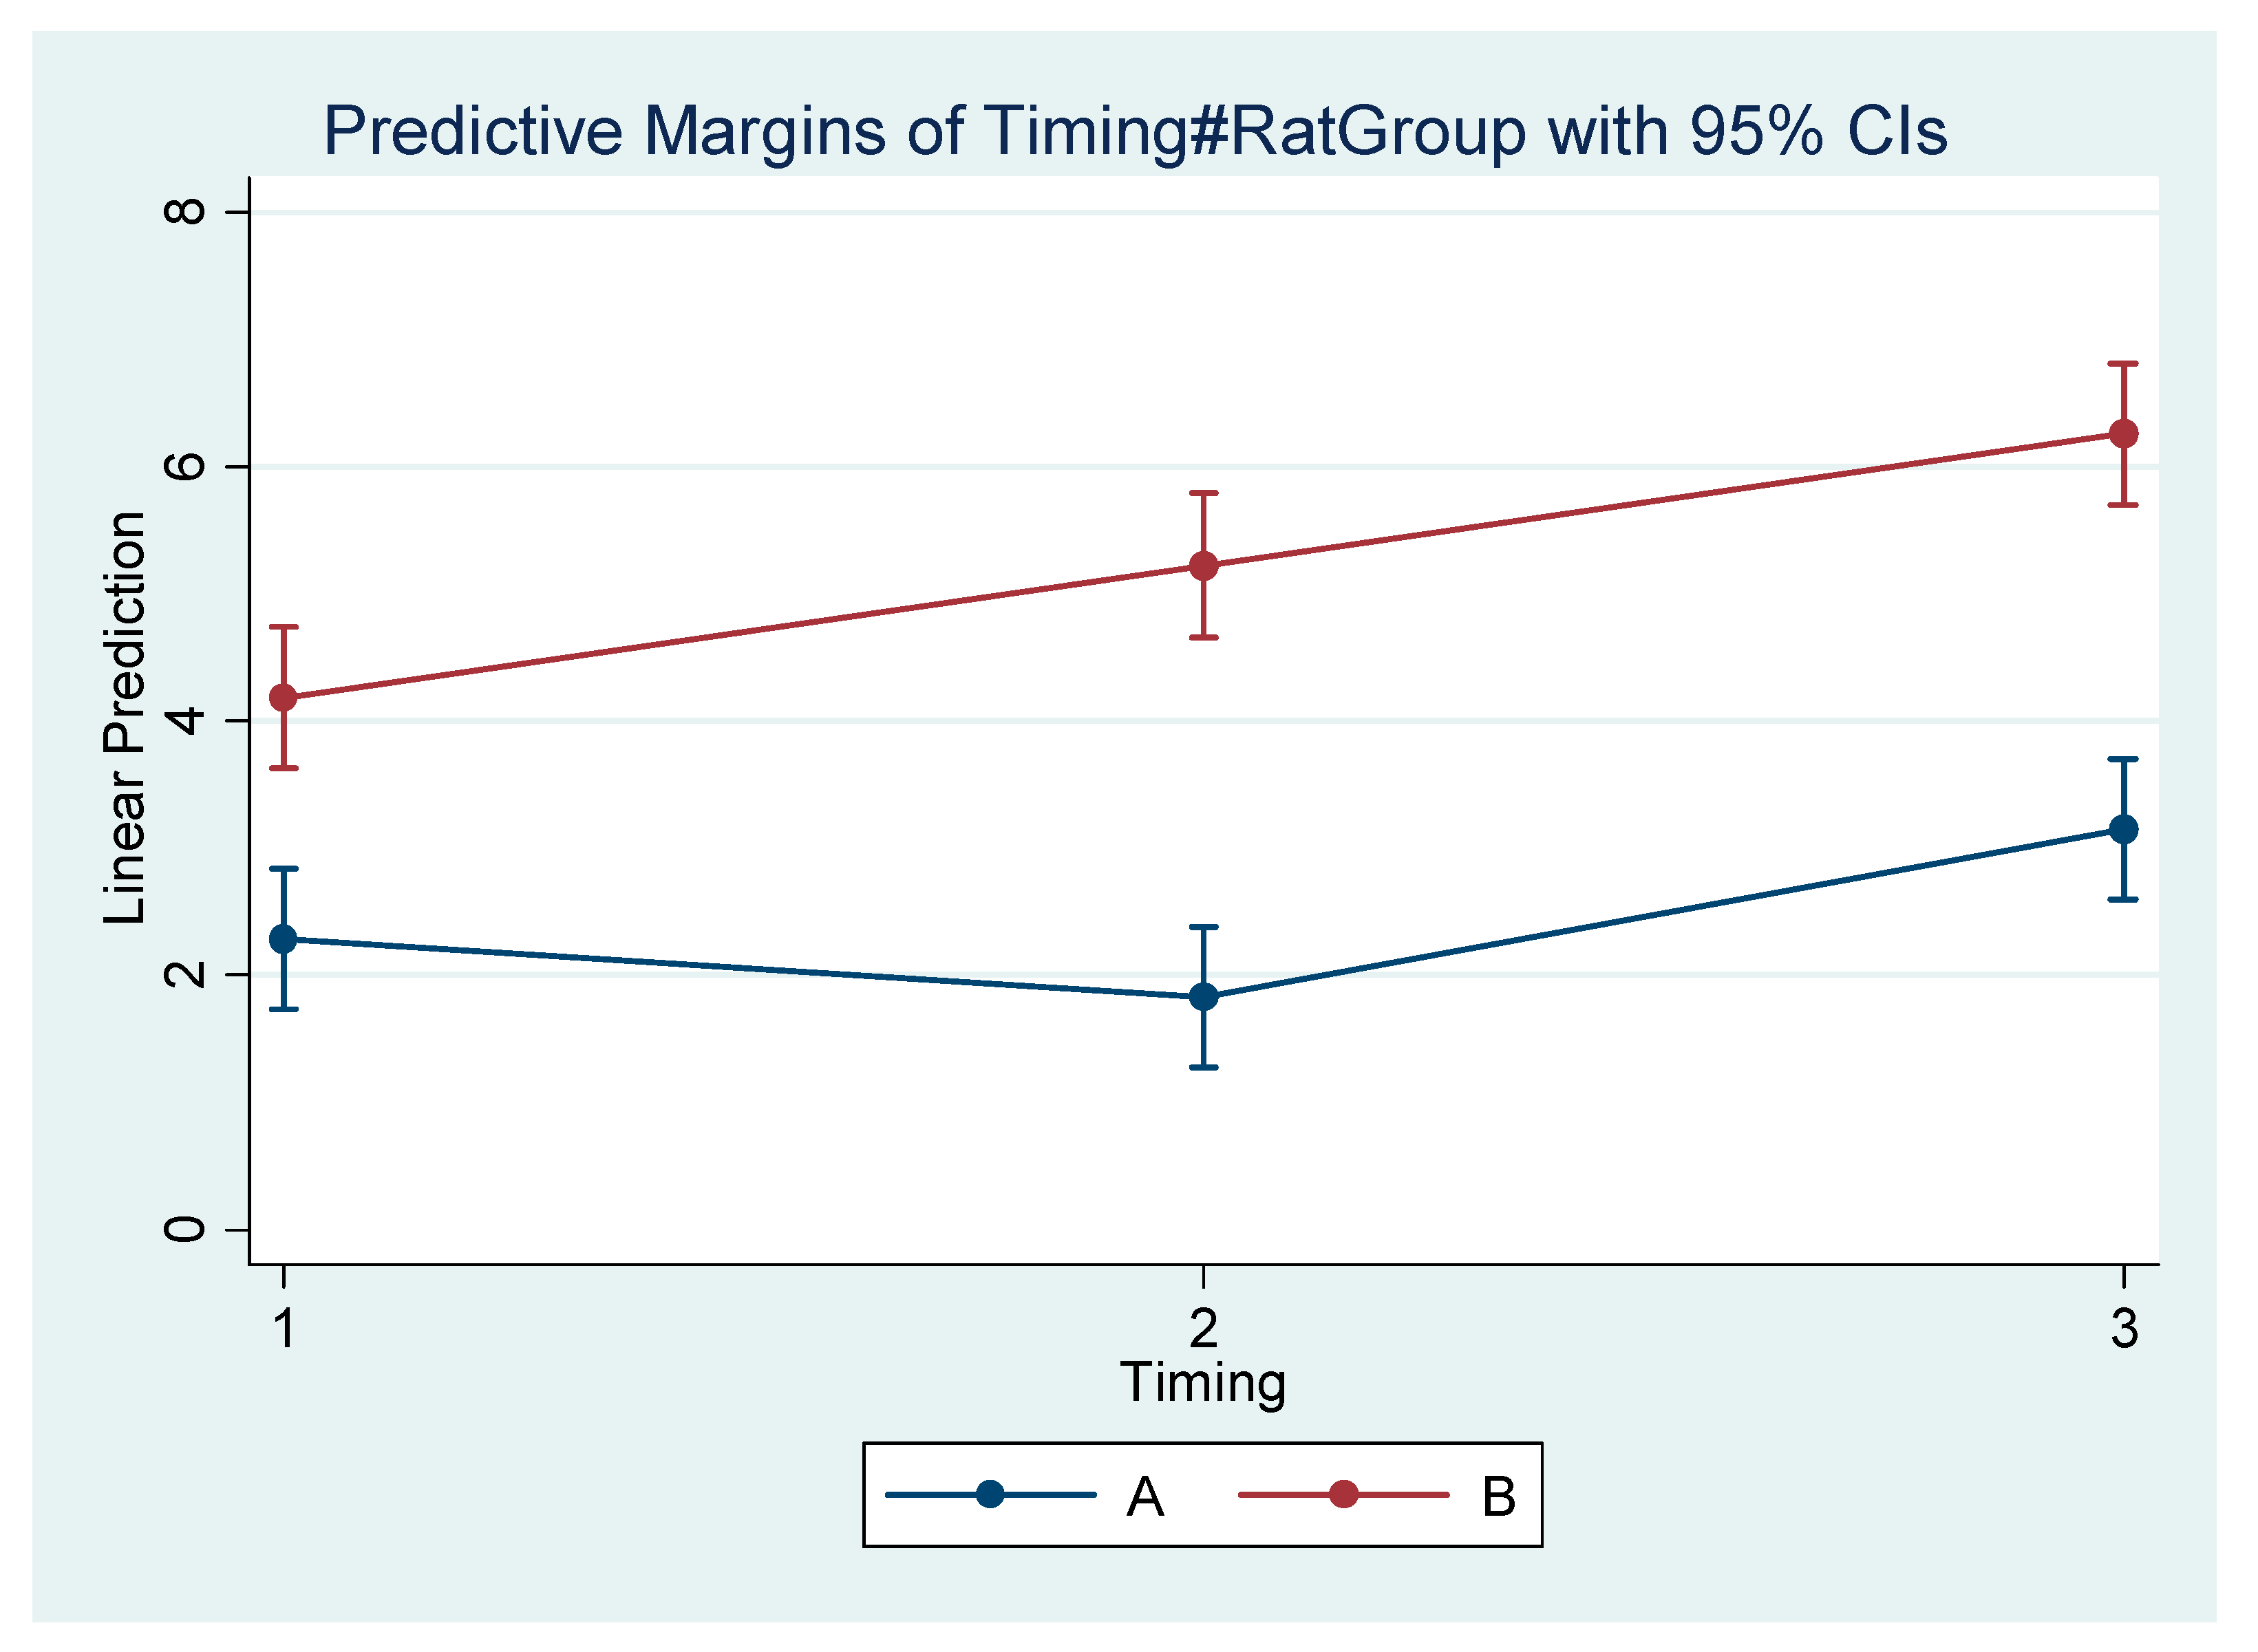
| Go’–Menton | ||||
| A1 | 2.29 | 1.74 | 2.84 | <0.001 |
| B1 | 4.19 | 3.63 | 4.74 | <0.001 |
| A2 | 1.82 | 1.27 | 2.38 | <0.001 |
| B2 | 5.23 | 4.66 | 5.79 | <0.001 |
| A3 | 3.15 | 2.60 | 3.70 | <0.001 |
| B3 | 6.26 | 5.70 | 6.82 | <0.001 |
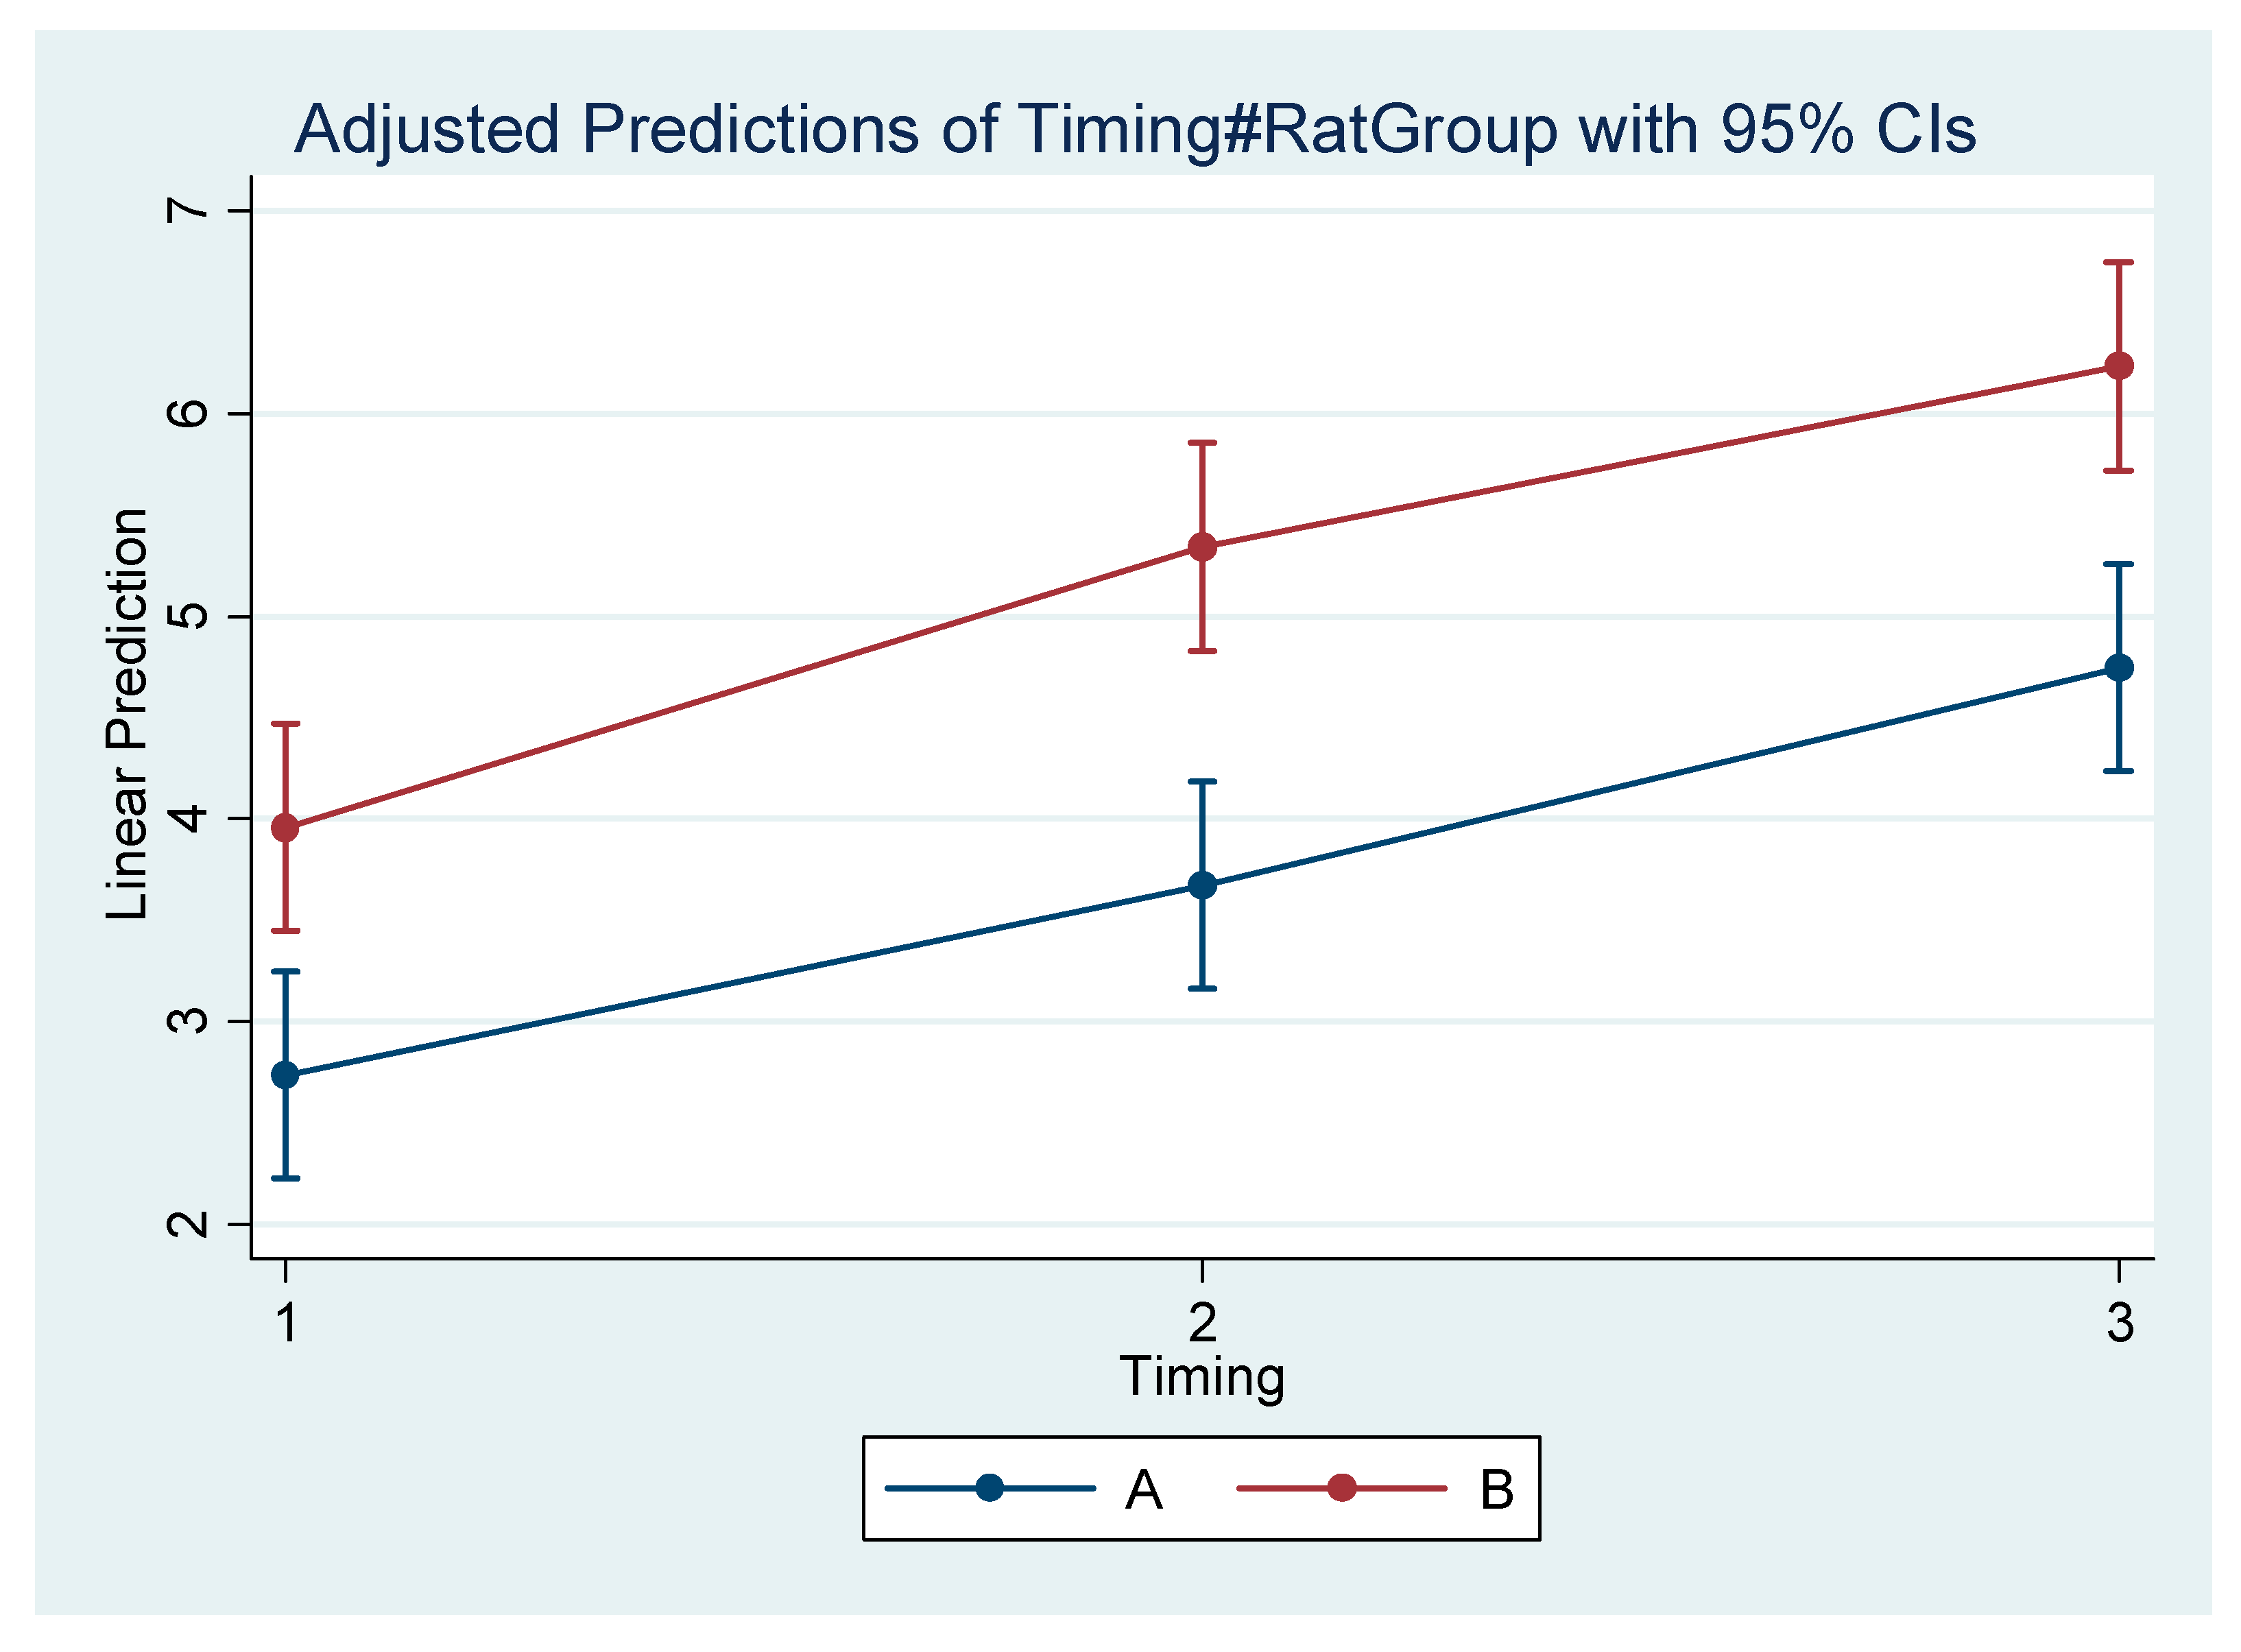
| Go–Menton | ||||
| A1 | 2.73 | 2.22 | 3.24 | <0.001 |
| B1 | 3.96 | 3.45 | 4.47 | <0.001 |
| A2 | 3.67 | 3.16 | 4.18 | <0.001 |
| B2 | 5.34 | 4.83 | 5.85 | <0.001 |
| A3 | 4.75 | 4.23 | 5.26 | <0.001 |
| B3 | 6.23 | 5.72 | 6.74 | <0.001 |
| Coronoid–Menton | ||||
| A1 | 2.61 | 2.18 | 3.03 | <0.001 |
| B1 | 3.38 | 2.96 | 3.81 | <0.001 |
| A2 | 3.69 | 3.27 | 4.11 | <0.001 |
| B2 | 4.78 | 4.35 | 5.21 | <0.001 |
| A3 | 4.52 | 4.10 | 4.94 | <0.001 |
| B3 | 5.73 | 5.30 | 6.15 | <0.001 |
| Condylion/Go’–Menton | ||||
| A1 | 1.45 | 1.14 | 1.76 | <0.001 |
| B1 | 1.51 | 1.20 | 1.82 | <0.001 |
| A2 | 2.39 | 2.08 | 2.70 | <0.001 |
| B2 | 2.26 | 1.94 | 2.57 | <0.001 |
| A3 | 2.43 | 2.12 | 2.74 | <0.001 |
| B3 | 2.71 | 2.39 | 3.02 | <0.001 |
| CondylionGo | ||||
| A1 | 1.32 | 0.98 | 1.66 | <0.001 |
| B1 | 1.17 | 0.83 | 1.51 | <0.001 |
| A2 | 2.51 | 2.17 | 2.85 | <0.001 |
| B2 | 1.96 | 1.61 | 2.31 | <0.001 |
| A3 | 2.51 | 2.17 | 2.85 | <0.001 |
| B3 | 2.37 | 2.03 | 2.72 | <0.001 |
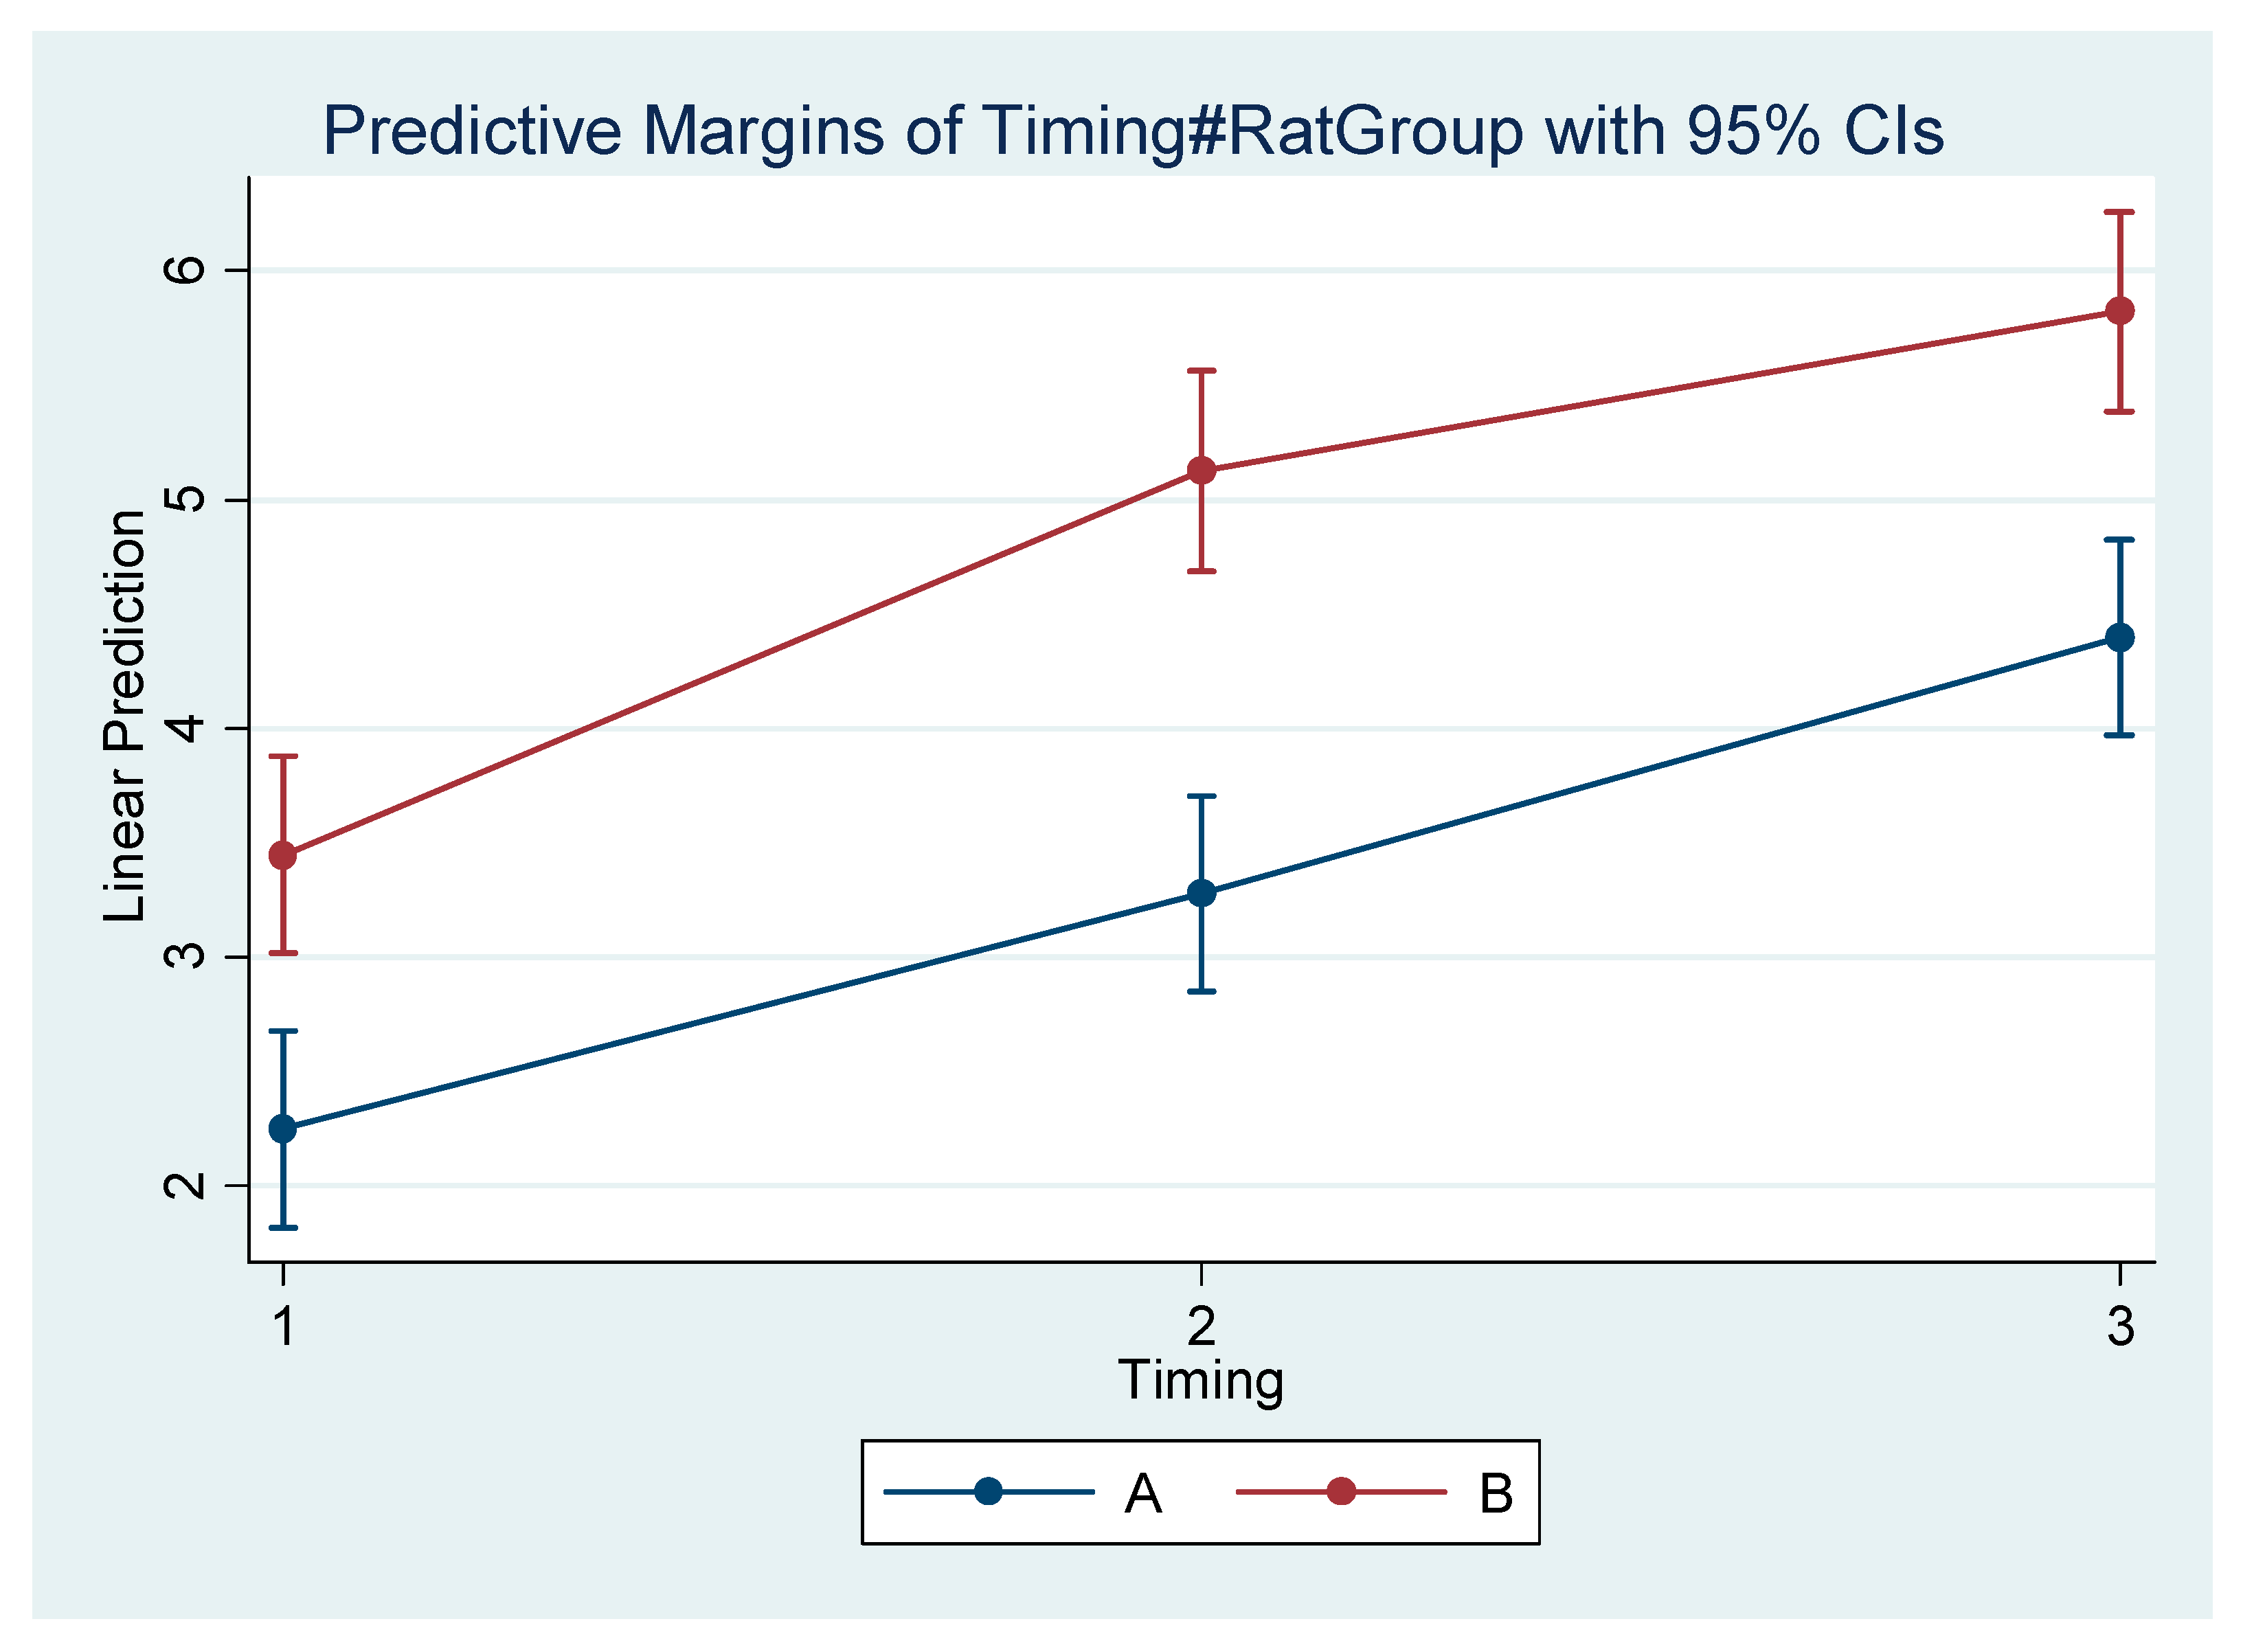
| Condylion–Menton | ||||
| A1 | 2.42 | 2.02 | 2.82 | <0.001 |
| B1 | 3.42 | 3.02 | 3.82 | <0.001 |
| A2 | 3.37 | 2.97 | 3.77 | <0.001 |
| B2 | 4.77 | 4.36 | 5.18 | <0.001 |
| A3 | 4.40 | 4.00 | 4.80 | <0.001 |
| B3 | 5.50 | 5.10 | 5.91 | <0.001 |
| Condylion–Id | ||||
| A1 | 2.51 | 2.04 | 2.99 | <0.001 |
| B1 | 3.47 | 2.99 | 3.95 | <0.001 |
| A2 | 3.57 | 3.10 | 4.05 | <0.001 |
| B2 | 5.29 | 4.80 | 5.78 | <0.001 |
| A3 | 4.40 | 3.93 | 4.88 | <0.001 |
| B3 | 5.94 | 5.45 | 6.42 | <0.001 |
| Condylion–I’ | ||||
| A1 | 2.25 | 1.82 | 2.67 | <0.001 |
| B1 | 3.45 | 3.01 | 3.88 | <0.001 |
| A2 | 3.28 | 2.85 | 3.71 | <0.001 |
| B2 | 5.12 | 4.68 | 5.56 | <0.001 |
| A3 | 4.40 | 3.97 | 4.82 | <0.001 |
| B3 | 5.82 | 5.39 | 6.26 | <0.001 |
| Incisal–Id | ||||
| A1 | −0.60 | −1.37 | 0.17 | 0.235 |
| B1 | 2.40 | 1.63 | 3.17 | <0.001 |
| A2 | 0.95 | 0.18 | 1.72 | 0.007 |
| B2 | 3.25 | 2.48 | 4.02 | <0.001 |
| A3 | 4.40 | 3.63 | 5.17 | <0.001 |
| B3 | 3.85 | 3.08 | 4.62 | <0.001 |
| Incisal–I’ | ||||
| A1 | −0.90 | −1.57 | −0.23 | 0.002 |
| B1 | 1.85 | 1.18 | 2.52 | <0.001 |
| A2 | 0.70 | 0.03 | 1.37 | 0.033 |
| B2 | 2.60 | 1.93 | 3.27 | <0.001 |
| A3 | 3.60 | 2.93 | 4.27 | <0.001 |
| B3 | 2.70 | 2.03 | 3.37 | <0.001 |
| Intercondylar | ||||
| A1 | 0.26 | −0.09 | 0.62 | 0.261 |
| B1 | 0.37 | 0.02 | 0.72 | 0.033 |
| A2 | 0.79 | 0.44 | 1.14 | <0.001 |
| B2 | 0.55 | 0.19 | 0.91 | 0.001 |
| A3 | 0.59 | 0.24 | 0.94 | <0.001 |
| B3 | 0.59 | 0.23 | 0.94 | <0.001 |
Publisher’s Note: MDPI stays neutral with regard to jurisdictional claims in published maps and institutional affiliations. |
© 2022 by the authors. Licensee MDPI, Basel, Switzerland. This article is an open access article distributed under the terms and conditions of the Creative Commons Attribution (CC BY) license (https://creativecommons.org/licenses/by/4.0/).
Share and Cite
Lyros, I.; Ferdianakis, E.; Halazonetis, D.; Lykogeorgos, T.; Alexiou, A.; Alexiou, K.-E.; Georgaki, M.; Vardas, E.; Yfanti, Z.; Tsolakis, A.I. Three-Dimensional Analysis of Posterior Mandibular Displacement in Rats. Vet. Sci. 2022, 9, 144. https://doi.org/10.3390/vetsci9030144
Lyros I, Ferdianakis E, Halazonetis D, Lykogeorgos T, Alexiou A, Alexiou K-E, Georgaki M, Vardas E, Yfanti Z, Tsolakis AI. Three-Dimensional Analysis of Posterior Mandibular Displacement in Rats. Veterinary Sciences. 2022; 9(3):144. https://doi.org/10.3390/vetsci9030144
Chicago/Turabian StyleLyros, Ioannis, Efstratios Ferdianakis, Demetrios Halazonetis, Theodoros Lykogeorgos, Antigoni Alexiou, Konstantina-Eleni Alexiou, Maria Georgaki, Emmanouil Vardas, Zafeiroula Yfanti, and Apostolos I. Tsolakis. 2022. "Three-Dimensional Analysis of Posterior Mandibular Displacement in Rats" Veterinary Sciences 9, no. 3: 144. https://doi.org/10.3390/vetsci9030144
APA StyleLyros, I., Ferdianakis, E., Halazonetis, D., Lykogeorgos, T., Alexiou, A., Alexiou, K.-E., Georgaki, M., Vardas, E., Yfanti, Z., & Tsolakis, A. I. (2022). Three-Dimensional Analysis of Posterior Mandibular Displacement in Rats. Veterinary Sciences, 9(3), 144. https://doi.org/10.3390/vetsci9030144