Article

Ultrasmall Glucose-Functionalized Au-Carbon Nanohybrids: Exploiting the Warburg Effect to Image Tumors by Multimodal CT/Fluorescence Imaging

Laboratory of Biocompatible Polymers, Department of “Scienze e Tecnologie Biologiche, Chimiche e Farmaceutiche” (STEBICEF), University of Palermo, Via Archirafi 32, 90123 Palermo, Italy
*
Author to whom correspondence should be addressed.
Submission received: 28 February 2024 / Revised: 26 March 2024 / Accepted: 2 April 2024 / Published: 4 April 2024
(This article belongs to the Special Issue Carbon Nanohybrids for Biomedical Applications)

Abstract

:
Utilizing glucose as a targeting agent represents a pioneering approach in selectively directing nanoparticles towards cancer cells, capitalizing on the pronounced glucose uptake observed in tumors attributable to the Warburg effect. In this study, we have successfully adopted this targeting strategy to facilitate the specific uptake of advanced nanotools, comprising carbon nanocrystals incorporating gold seeds (AuCDs). Leveraging the advantageous optical and size-related properties of carbon nanodots in conjunction with gold-mediated X-ray attenuation capabilities, these hybrid nanomaterials have been engineered as contrast agents for a bi-modal imaging modality, exploiting the synergistic benefits of fluorescence imaging and X-ray computed tomography. Notably, for the synthesis of AuCDs, we present, for the first time, the incorporation of gold seeds within the molecular precursors of carbon nanodots during their solvothermal synthesis process, showcasing the efficacy of this synthetic pathway in yielding nanoscale carbon structures incorporating bioeliminable gold ultrasmall nanoparticles (d < 5 nm). Subsequently, we employed an azido-alkyne click chemistry reaction to functionalize the nanoparticle surface with 2-deoxy-D-glucose as a targeting moiety. The demonstrated cancer-targeting proficiency, as assessed via fluorescence imaging, renders the proposed nanosystem highly promising for a spectrum of applications in precision anticancer theranostics, encompassing both diagnostic and therapeutic endeavors.

1. Introduction

The development of highly tumor cell-specific anticancer strategies is critical to overcoming the major limitations of current diagnostic and therapeutic approaches [1], whose effectiveness in promoting good prognoses for patients is still limited by the serious side effects that have to be ascribed to their nonspecific distributions and mechanisms of action [2]. Nanotechnology has made a significant breakthrough in this regard by offering nanoscaled medical tools that can be engineered to selectively target the desired site of action [1,3,4]. Despite the promises of enhanced permeability and retention (EPR) effect-based nanosystems [5,6], whose accumulation at the tumor site depends on the potential passive targeting of nanoparticles within 100–200 nm in diameter, nanosystems with ultrasmall size distribution (6–10 nm) are required to reach the tumor parenchyma after extravasation. This is due to the extremely limited diffusion of larger nanoparticles through the complex tumor microenvironment (TME), which usually consists of heterogeneous cell infiltrates surrounded by collagen and a hyaluronic acid-rich extracellular matrix [7,8]. For this reason, ultrasmall nanoparticles of 6–10 nm capable of efficiently diffusing throughout the TME are desired in cancer nanomedicine. In addition, they should possess contrast properties such as fluorescence, MRI, or CT, enabling diagnosis, tumor monitoring, and/or image-guided anticancer therapy (theranostics).
Among them, gold/carbon nanodot nanohybrids (Au/CDs) are advanced nanostructures designed to combine the optical properties of carbon nanodots (CDs) [9,10] and the X-ray attenuation properties of gold [11], obtaining bi-modal imaging nanotools, useful for performing both fluorescence imaging (FLI) and X-ray-based computed tomography (CT). FLI/CT bi-modal imaging nanosystems benefit from the complementary properties of the two imaging techniques [12], with CT making up for the in vivo drawbacks of FLI by providing deep-tissue imaging with strong contrast and high resolution [13], whereas FLI has higher performance for detailed imaging at sub-cellular levels [14], conferring to the nanosystem high imaging self-tracking properties for in vitro and ex vivo studies. Moreover, the utilization of targeted nanosystems for CT imaging could circumvent the limitations of currently employed contrast agents based on iodinated small molecules, which exhibit a short blood circulation time (<10 min) and nonspecific distribution [15,16].
More efficient targeting can be achieved by introducing surface moieties on the nanostructure that can specifically recognize cancer cells, distinguishing their peculiar biochemical characteristics [7,8]. Metabolic reprogramming, for instance, is one of the characteristic features of cancer cells [17,18], which exhibit major alterations in glucose metabolism [19]. In fact, the energy production in cancer cells relies on glycolysis and lactic acid production, rather than on oxidative phosphorylation, even in the presence of oxygen [20]. This phenomenon, called aerobic glycolysis or the Warburg effect [21], implies a massive glucose demand by cancer cells, resulting in increased glucose uptake and glucose transporters expression [22]. Surface engineering of drug delivery systems such as silver nanoparticles [23], polydopamine nanoparticles [24], and mesoporous silica nanoparticles [25] with glucose derivatives has been recently proposed to promote cancer uptake in several cancer types, including prostate cancer [23] and glioma [26]. Notably, high glucose-affinity facilitative transporter GLUT1 overexpression has been proven in several solid tumors [27], including breast cancer [28], and it has been also correlated with poor prognosis [29,30]. Being a unique feature of cancer cells, the Warburg effect offers an appealing opportunity for innovative targeting strategies that use glucose as a targeting agent [15].
Herein, we exploited the Warburg effect to achieve active targeting towards breast cancer cells of innovative hybrid ultrasmall AuCDs functionalized with 2-deoxy-D-glucose by a facile click chemistry approach. We designed AuCDs nanohybrids of about 6 nm that are conceived to combine in a unique targeted nanoplatform bright tunable photoluminescence, CT contrast properties, and selective drug delivery potential. In contrast to nanostructures composed of gold nanoparticle–carbon nanodot conjugates [31,32], we propose a novel approach wherein gold zero-dimensional seeds are incorporated into a carbonaceous crystal during its formation via solvothermal processes, resulting in a unique hybrid structure. This approach enabled maintaining advantageous characteristics of CDs, such as high water solubility, high surface-to-volume ratio, and biocompatibility [33], with a safer profile compared to pure gold nanoparticles [34]; these innovative nanosystems can be enforced for many anticancer strategies, including diagnostic imaging, monitoring, and drug delivery. Additionally, subsequent to the degradation of the carbon core within mitochondria, regarding gold seeds measuring a few nanometers, it is expected that they can be easily bioeliminated through renal clearance, thus averting the bioaccumulation phenomena typically associated with gold nanoparticles [35]. The proposed strategy stands as a starting pillar, delineating the trajectory for the advancement of gold–carbon nanohybrids useful for multimodal image-guided anticancer precision medicine.

2. Materials and Methods

2.1. Materials

Cetyltrimethylammonium bromide (CTAB, 99%), Tetrachloroauric (III) acid trihydrate (HauCl4 • 3H2O, 99%), sodium borohydride (NaBH4, 99.5%), reduced glutathione (GSH, 99.5%), ascorbic acid (99%), 4-Pentynoic acid (99.5%), poly(ethylene glycol) bis(amine) (Mw 2 kDa, H2N-PEG-NH2), Sephadex® G10, Sephadex® G15, Sephadex® G25, 1-Ethyl-3-(3-dimethyl aminopropyl) carbodiimide hydrochloride (EDC • HCl, 99.5%), N-Hydroxysuccinimide (NHS, 99.5%), 2-azido-2-deoxy-D-glucose (97%), copper (II) sulfate (99%), SpectraPor® Pre-wetted RC Tubing (MWCO 1 kDa), and phosphate-buffered saline pH 7.4 (PBS) were purchased from Sigma Aldrich (Milan, Italy). Dulbecco’s Modified Eagle Medium (DMEM), trypsin-EDTA (0.5 g L−1), fetal bovine serum (FBS), L-glutamine, penicillin G, streptomycin, and amphotericin B were purchased from EuroClone S.p.A. (Milan, Italy).
The CellTiter 96® AQueous Non-Radioactive Cell Proliferation Assay (MTS) was purchased from Promega (Milan, Italy).
Human breast cancer cell line MCF-7 was obtained from “Istituto Zooprofilattico Sperimentale della Lombardia e dell’Emilia Romagna”, Italy. Human Schwann cell line-hTERT ipn02.3 2λ (ATCC CRL-3392) was purchased from ATCC. Cells were cultured in DMEM supplemented with 10% (v/v) FBS, 100 units mL−1 penicillin G, 100 mg mL−1 streptomycin, 0.1% (v/v) amphotericin B, and 2 mM glutamine, at 37 °C and 5% CO2.

2.2. Synthesis and Characterization of Gold Seeds

Gold seeds were prepared following the first step of seed-mediated gold nanoparticle synthetic protocol, described elsewhere [36,37]. Briefly, 25 mL of HAuCl4 (50 mM) and 300 µL of NaBH4 (10 mM) were added to a CTAB solution (4.7 mL, 0.1 M) under vigorous stirring. The CTAB excess was precipitated at 4 °C and removed by centrifugation (12,000 rpm, 20′), obtaining a pink stable dispersion of gold seed. To further stabilize the colloidal particles, GSH (7.5 mg) was added and the solution was kept equilibrating for 2 h.
The UV–Vis absorption spectrum of a diluted gold seeds solution was recorded using a double-beam spectrophotometer (Shimadzu UV-2401PC, Nakagyō-ku, Kyoto) operating in the 200–800 nm range (1 nm bandwidth).

2.3. Synthesis and Characterization of Hybrid Gold/Carbon Nanoparticles (AuCDs)

Six batches of gold seeds were used for the synthesis of hybrid gold/carbon nanoparticles (AuCDs). The solution of gold seeds was concentrated by rotary evaporation (6 mL final volume) and added to a solution of citric acid (3 g, 16 mmol) and urea (6 g, 98 mmol) in dimethylformamide (DMF). The mixture was kept reacting at 170 °C in a steel autoclave (Büchi AG, Miniclave steel type 3, Gschwaderstrasse, Switzerland) for 4 h. DMF was then removed, and the product was washed with a diethyl ether/ethanol (9:1) mixture. The organic solvents were removed by rotary evaporation, and the product was resuspended in ultrapure water, obtaining a dark brown solution. The product was purified by size exclusion chromatography using a glass column packed with, in turn, Sephadex® G-10, G-15, and G-25 stationary phase, and using water as eluent. The collected fractions were grouped based on their UV–Vis absorption spectra, and freeze-dried. The most interesting fraction, named AuCDs, was selected for the subsequent functionalization processes.

Determination of the Gold Content in the AuCDs

The amount of gold incorporated in AuCDs was quantified using the Spectroquant® Gold Test (Merck) kit, following the manufacturer’s instructions. Before the analysis, an aliquot of AuCDs was dissolved in 10% v/v HNO3 and mineralized by in turn treating it for 5′ at 100 °C and 15′ at 200 °C, using a microwave synthesizer Discover SP (CEM). The gold concentration was calculated by comparison with a calibration curve obtained with Au (III) solutions (60–5 mM).

2.4. Synthesis of 2-Deoxy-D-Glucose-Functionalized AuCDs (AuCDs-PEG-Glu)

The surface functionalization of AuCDs with 2-deoxy-D-glucose moieties was achieved in a 3-step reaction protocol. In the first step, amino-PEG-alkyne (NH2-PEG-CC) was synthesized as reported by Scialabba et al., 2019 [38]. Briefly, 500 mg of poly(ethylene glycol) bis(amine) (NH2-PEG-NH2) were dissolved in 8 mL of PBS and 29.4 mg of 4-pentynoic acid were added to the solution under magnetic stirring. The pH was adjusted to 6.4, and then EDC (57.6 mg) and NHS (34.8 mg) were added and the reaction was kept under magnetic stirring for 18 h. The product (NH2-PEG-CC) was purified by size exclusion chromatography using a Sephadex® G15-G25 stationary phase, and freeze-dried (38% yield). Subsequently, 125 mg of H2N-PEG-CC were added to 5 mL of an aqueous solution of AuCDs (2 mg mL−1). The pH was adjusted to 6.4, and EDC (15 mg, 0.078 mmol) and NHS (9.01 mg, 0.078 mmol) were added. The mixture was kept reacting at pH 6.4 under magnetic stirring overnight. The product, named AuCDs-PEG-CC, was purified by dialysis (1 kDa MWCO) against water for 72 h, and then it was freeze-dried, obtaining a dark powder with a 30.2% yield. For last, AuCDs-PEG-CC (20 mg) and 2-azido-2-deoxy-D-glucose (2.1 mg, 1.0 mmol) were solubilized in 3 mL of ultrapure water, and then copper (II) sulfate (1.0 mg, 6.0 mmol) and ascorbic acid (10 mg, 6.0 mmol) were added. The mixture reacted under an inert atmosphere and magnetic stirring overnight. The mixture was dialyzed (1 kDa MWCO) against water for 72 h. The purified product, named AuCDs-PEG-Glu, was obtained by freeze-drying (98.6% yield).

2.5. Characterization of AuCDs-PEG-Glu and Precursors

Fourier-transform infrared (FT-IR) spectra were recorded with a PerkinElmer Spectrum Two IR spectrometer (Waltham, MA) operating in the 4000–400 cm−1 range. Samples were prepared as KBr pellets and dried under vacuum before the analysis.
Atomic force microscopy (AFM) micrographs were obtained on a FAST-SCAN microscope (Bruker) equipped with a closed-loop scanner (X, Y, Z maximum scan region: 35 mm, 35 mm, and 3 mm, respectively). Samples were prepared by deposition of aqueous dispersions of either AuCDs or AuCDs-PEG-Glu (10 mL, 0.01 mg mL−1) on a mica substrate, which was dried under vacuum before the analysis. The scans were performed using a FAST-SCAN-A probe (5 nm optical radius, 1400 kHz, 18 N m−1) in a non-contact way, obtaining micrographs with a resolution comparable to the tip radius. The size distribution was calculated from the analysis of the heights.
UV–Vis absorption spectra were recorded using a double-beam spectrophotometer (Shimadzu UV-2401PC) operating in the 200–800 nm range (1 nm bandwidth). Fluorescence 3D emission spectra were recorded with a Jasco FP-8500 spectrofluorometer (Milan, Italy) operating in the 360–850 nm range (lex 350–650 nm).

2.6. Characterization of the CT Contrast Properties of the AuCDs-PEG-Glu Conjugate

The computed tomography (CT) contrast abilities of the AuCDs-PEG-Glu were evaluated by the micro-CT imaging technique using a Bruker SKYSCAN 1272 (Karlsruhe, Germany). Briefly, an aqueous dispersion of the conjugate (0.5 mg mL−1) was introduced inside a capillarity (about 5 cm in lenght) and water was used as negative control. All micro-CT micropgraphs were obtained with a power of 40 kV, an intensity of 250 µA, and using an aluminum filter to optimize acquisitions.
The CT contrast of the AuCDs-PEG-Glu was also measured on a living fungi model. P. Italicum hyphae cultures were grown on malt medium agar plates (malt extract broth, Oxoid, Unipath Ltd., Hampshire, England) at r.t. In particular, pieces of 0.5 mm were cut from the hyphal fronts and placed in agar plates. After 25 days, fungi hyphae of about 2.5 mm were retrieved and resuspended either in ultrapure water or a dispersion of AuCDs-PEG-Glu in water (0.5 mg mL−1) for 24 h. After that, micro-CT analyses were recorded as described above.

2.7. Biological Characterization

Cellular uptake of AuCDs-PEG-Glu was evaluated in vitro by widefield fluorescence microscopy. MCF-7 and Schwann cells (HSC-hTERT ipn02.3 2λ) were seeded on an 8-well Nunc Lab-Tek chambered coverglass (Thermo Fisher Scientific, Waltham, MA USA) at a 104 cell density and cultured in complete DMEM for 24 h. Then, the culture medium was removed, and cells were treated with 120 mL of D-glucose solution in DMEM (250 mM) or 120 mL of DMEM. After 30′ of incubation at 37 °C, 30 mL of AuCDs-PEG-Glu dispersions in DMEM (1 mg mL−1) were added to each well. After 24 h, cells were washed twice with PBS, and fixed with 4% buffered formalin. Micrographs were obtained using a widefield fluorescence microscope Axio Cam MRm (Zeiss) (100× magnification).
The cytocompatibility of AuCDs-PEG-Glu was evaluated using an MTS cell viability assay. Both human breast cancer (MCF-7) and normal human Schwann (HSC-hTERT ipn02.3 2λ) cells were seeded in a 96-well plate (1.5 × 10⁴ cells per well) and cultured for 24 h. Then, the culture medium was replaced with either 150 mL AuCDs-PEG-Glu dispersions in DMEM (1.00–0.01 mg mL−1) or fresh medium for negative controls. After 48 h, the medium was removed and cells were washed with phosphate-buffered saline (PBS, pH 7.4) before treating with 120 mL of an MTS working solution (1:5 MTS assay solution/DMEM). The 492 nm absorbance of the samples was recorded after 2 h of incubation using a Multiskan microplate reader (Thermo, Dublin, UK). Cell viability was expressed as a percentage comparing the data to negative controls, assumed as 100% cell viability.

3. Results and Discussion

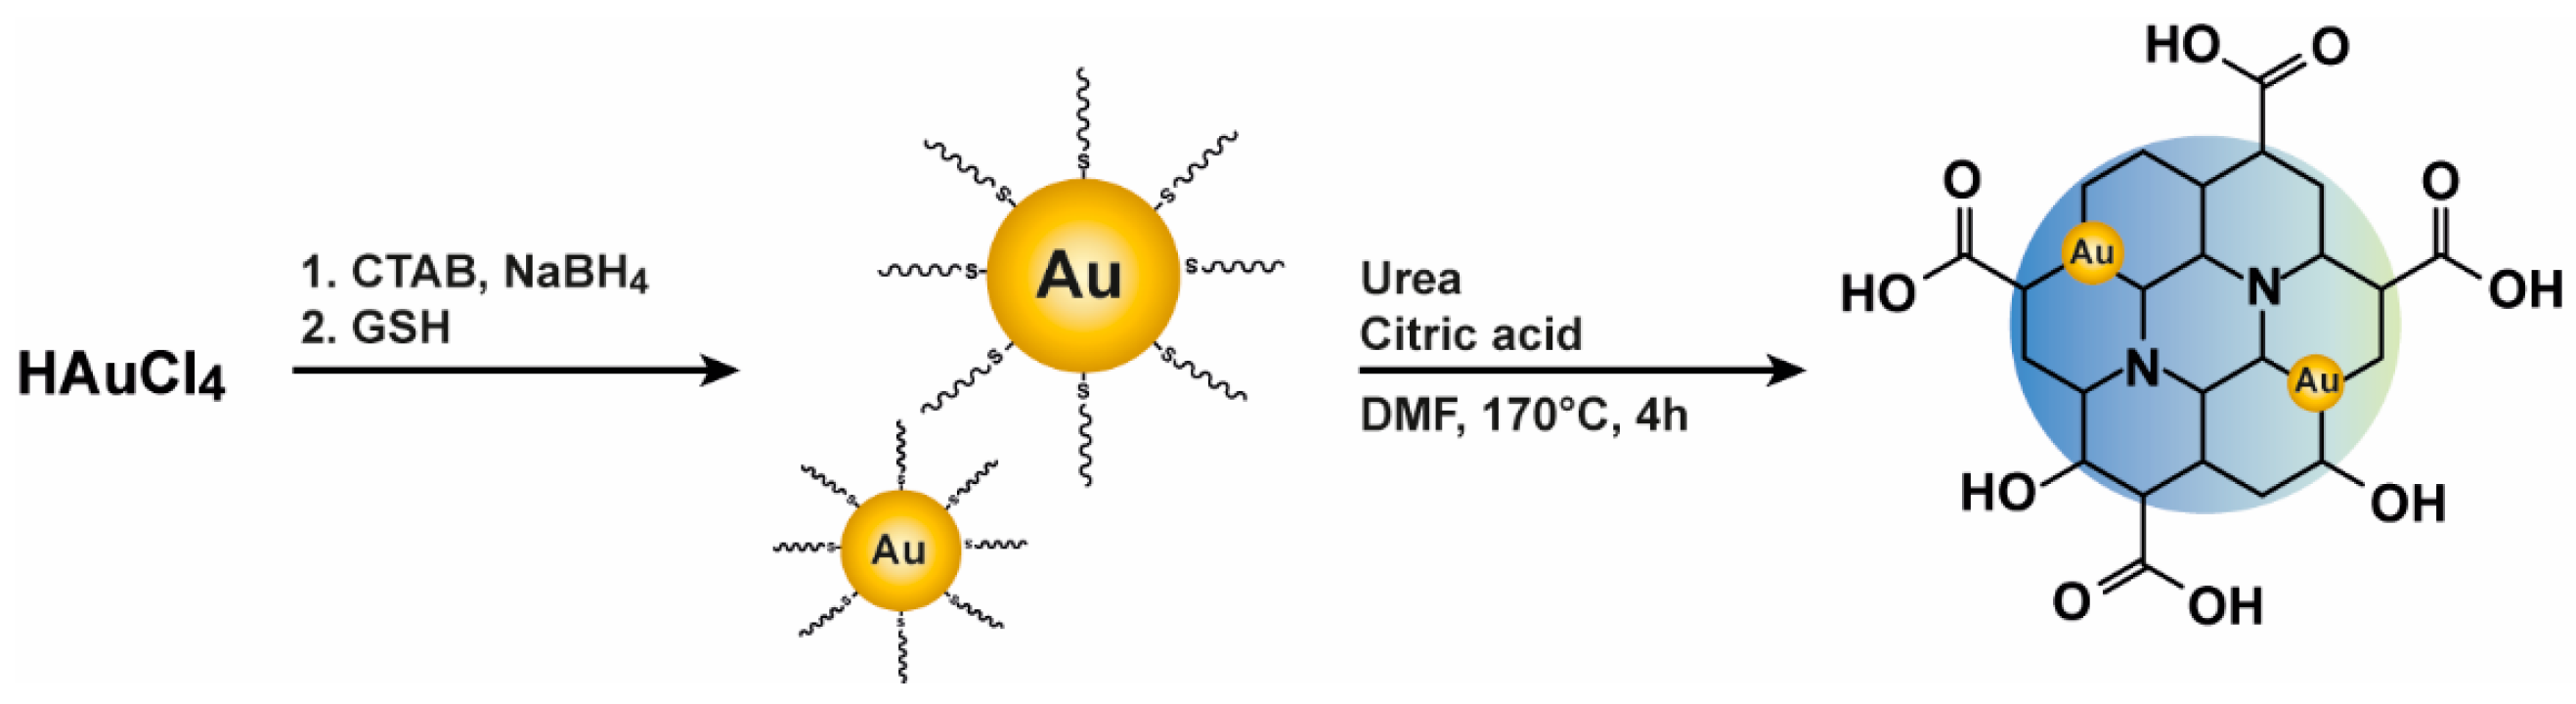
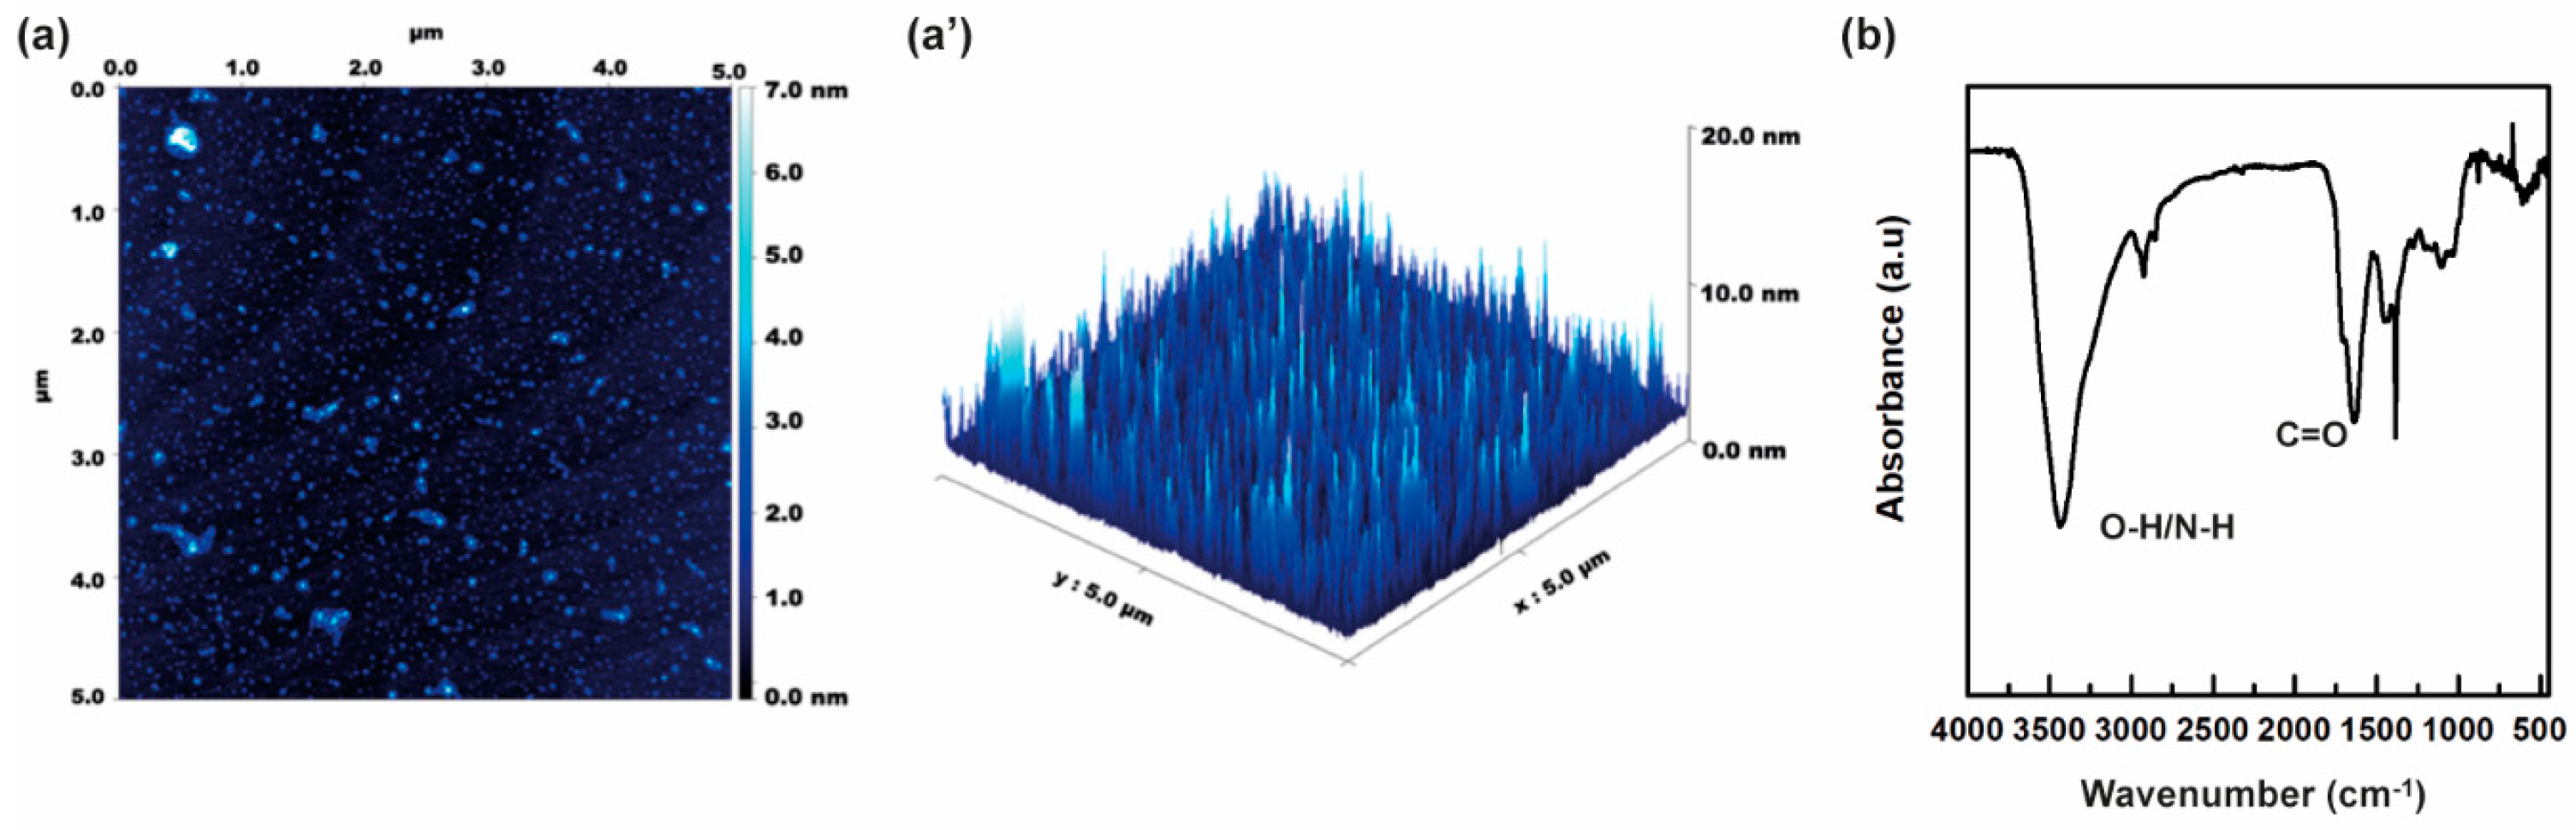
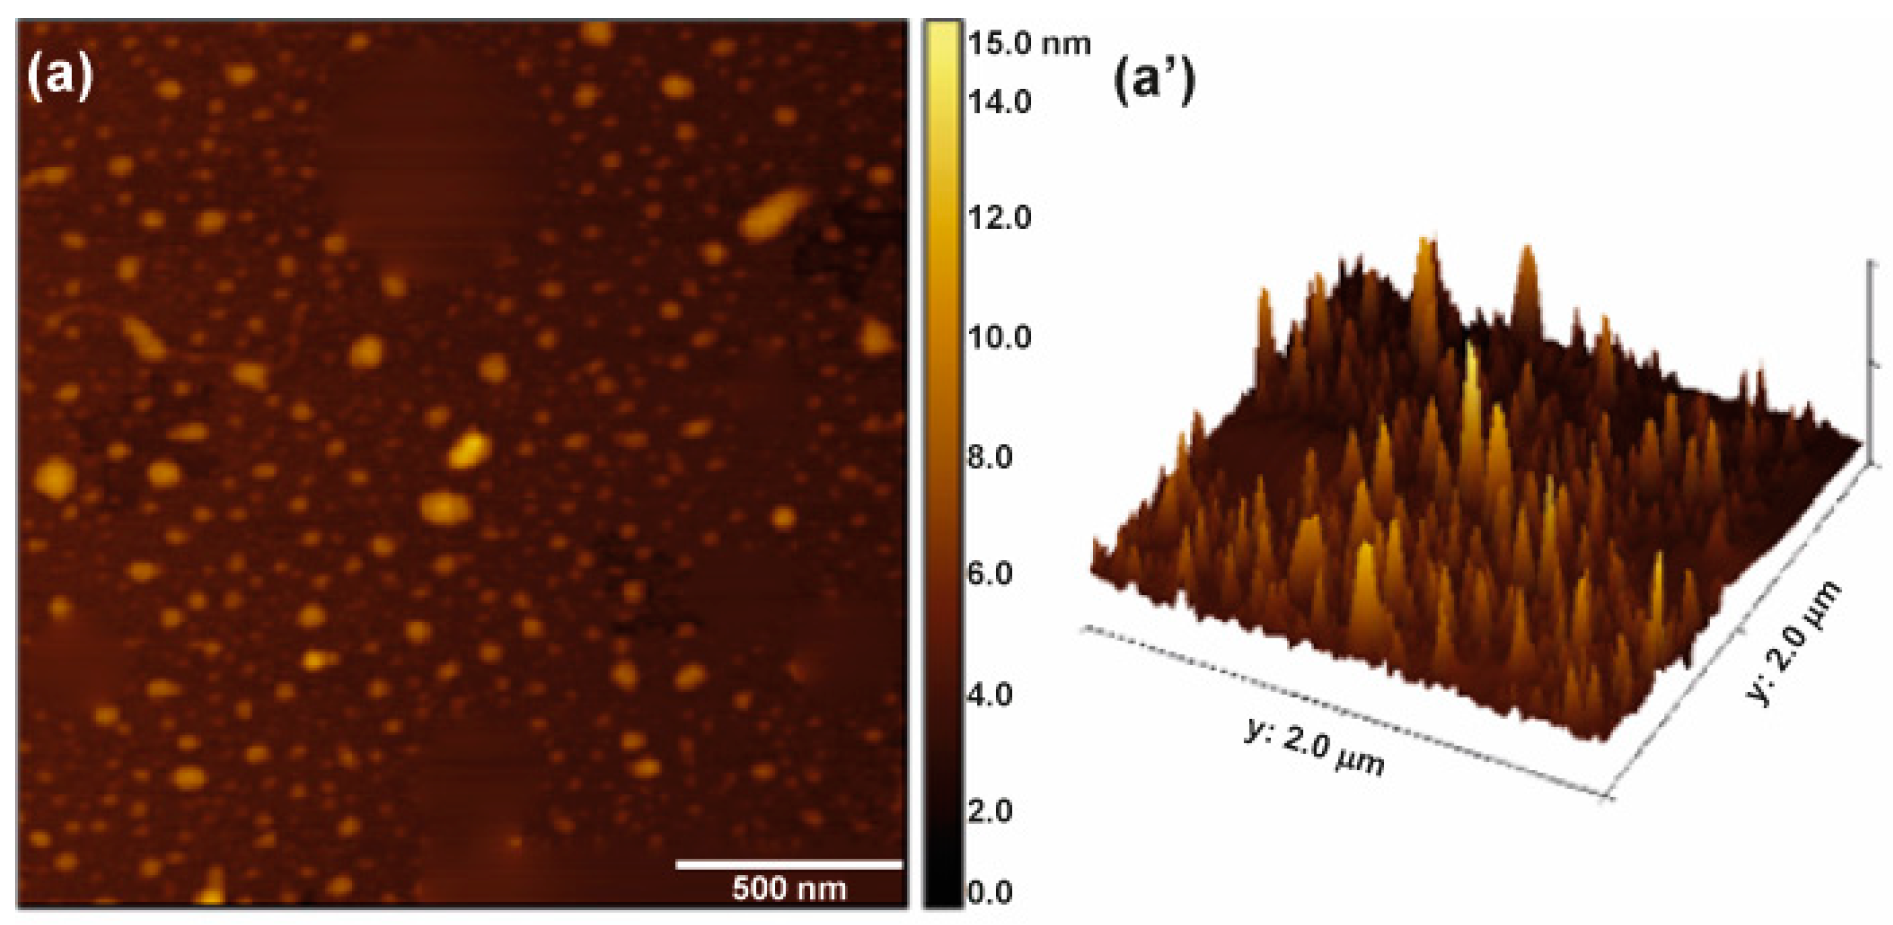
3.1. Synthesis and Characterization of Hybrid Gold/Carbon Nanoparticles (AuCDs)

The synthesis of hybrid AuCDs nanostructures was achieved by solvothermal decomposition of citric acid and urea in the presence of gold seeds of 1–2 nm in diameter. This approach, for the first time, goes beyond the decoration of carbon nanodots with gold layers or nanoparticles, proposing an efficient one-pot synthetic strategy to yield gold/carbonaceous hybrid nanocrystals during the nucleation process. Firstly, gold seeds of 1–2 nm were prepared as previously reported by aqueous phase reduction of Au3+, provided as HAuCl4, using NaBH4 as the reducing agent and CTAB surfactant as a stabilizing agent (Figure 1) [36]. The size distribution of the Au seeds was calculated on the basis of the fitting of their UV–Vis spectra by the Mie model for spheres. Amendola and Minghetti found that, by using a calibration of the dumping frequency of the surface plasmon resonance, it is possible to obtain the diameter with an accuracy of about 6% regarding the nanoparticles’ average size with respect to sizes measured by transmission electron microscopy (TEM) [39]. In the seed-mediated synthesis pathway of gold nanorods, the synthesis of gold seeds is usually followed by a controlled growth process, optimized to ensure high control of the size and shape of gold nanoparticles, thereby conferring precise chemical and optical characteristics [40]. Avoiding the seed-growing step, here, we focused instead on the stabilization of the obtained gold seeds in solution, which would have been included among the precursors of the solvothermal synthesis of carbon nanocrystals.
Considering the potential toxicity of the CTAB coating [41], we exploited its temperature-dependent water solubility [42] to precipitate and withdraw the excess surfactant. Reduced glutathione was then added to the gold seed solution to replace the CTAB stabilizing the particles, exploiting the favored sulfur–gold interactions [43]. The glutathione carbon chains bound to the surface of gold nanostructures will also be involved in carbonization processes during the solvothermal synthesis route. The glutathione-stabilized gold particles presented the typical UV–Vis spectrum of gold seeds, characterized by a broad absorption peak attributable to molecular-like optical transitions. The absence of the characteristic absorption peak related to surface plasmon resonance phenomena suggests that the nanoparticles in the solution were smaller than 2 nm (Figure S1) [44].
A concentrated solution of glutathione-stabilized gold seeds was added to a DMF solution of urea and citric acid and kept reacting at 170 °C in a steel autoclave. It has been extensively demonstrated in our previous works that, in these synthetic conditions, the solvothermal decomposition of economic and easily available molecular precursors, such as citric acid and urea, leads to highly fluorescent carbon nanodots with N-doped carbonaceous crystalline structures, presenting hydrophilic functional groups at the surface [45,46]. After 4 h, the organic solvent was removed, and the product was resuspended in ultrapure water to undergo an accurate purification process by size exclusion chromatography, using a Sephadex stationary phase packed with increasing cutoff (G10–G15–G25) to separate fractions with different size distributions. The collected fractions were gathered in four main groups, named A–D, based on their absorption spectra in the UV–Vis region. Among all, the D fraction presented the most interesting absorption spectrum, characterized by two main peaks at 348 and 435 nm, and a tail extending to the red region, with a shoulder at 560 nm (Figure S2), whereas the other fractions showed a less interesting profile with a single main peak at 335–340 nm and a shoulder at 395–400 nm. Likewise, comparing the emission spectra of the collected fractions, it can be noticed that the D fraction presented the strongest emission, tunable by changing the excitation wavelength, and with main emission peaks in the blue–green region (Figure S3). Therefore, only fraction D, henceforth named AuCDs, was selected for further functionalization.
Atomic force microscopy micrographs of AuCDs (Figure 2a,a’) display spherical objects presenting an average height of about 6 nm. The narrow size distribution and the homogeneity of the nanoparticles indicate the efficacy of the adopted purification process. The amount of gold incorporated in the AuCDs was quantified using the Spectroquant® Gold Test (Merck Life Science s.r.l., Milan, Italy) kit, following the manufacturer’s instructions. This kit allows for the detection of free Au3+ ions by reaction with rhodamine B in sulfuric solution to form a red–violet complex that is extracted and determined photometrically. Therefore, before performing the test, a sample of AuCDs underwent a mineralization process by dissolution in HNO3 10% and high-temperature treatment so as to degrade the carbonaceous structure and release gold ions that are entrapped in the core of the nanosystem. Moreover, in these drastic conditions, all the metallic gold released is oxidated to Au3+ ions to be detected. The absorbance of the sample complex with rhodamine B was compared with that obtained testing Au3+ standard solutions, calculating that gold represents the 0.43% w/w of AuCDs.
Further proofs of the incorporation of gold in the carbon structure were attained from the FT-IR spectrum of AuCDs, reported in Figure 2b. The AuCDs spectrum is characterized by the typical vibrations at 3480 and 2970 cm−1, ascribable to thydroxyl and methylene groups at the surface and the core, respectively. As immediately notable, the spectrum presents a very peculiar and sharp peak at 1385 cm−1 which can be attributed to the symmetric stretching vibration of carboxylic groups interacting with the gold metallic surface [47,48]. The high electron density of the metallic surface also induces a shift in the typical asymmetric stretching of carboxylic groups, which is found to be at 1637 cm−1 [37,48]. Moreover, intense I amide and II amide vibration bands can be distinghushed at 1620 and 1495 cm−1. The presence of carboxylic groups on the surface of AuCDs is advantageous because they can be easily exploited for further surface functionalization.

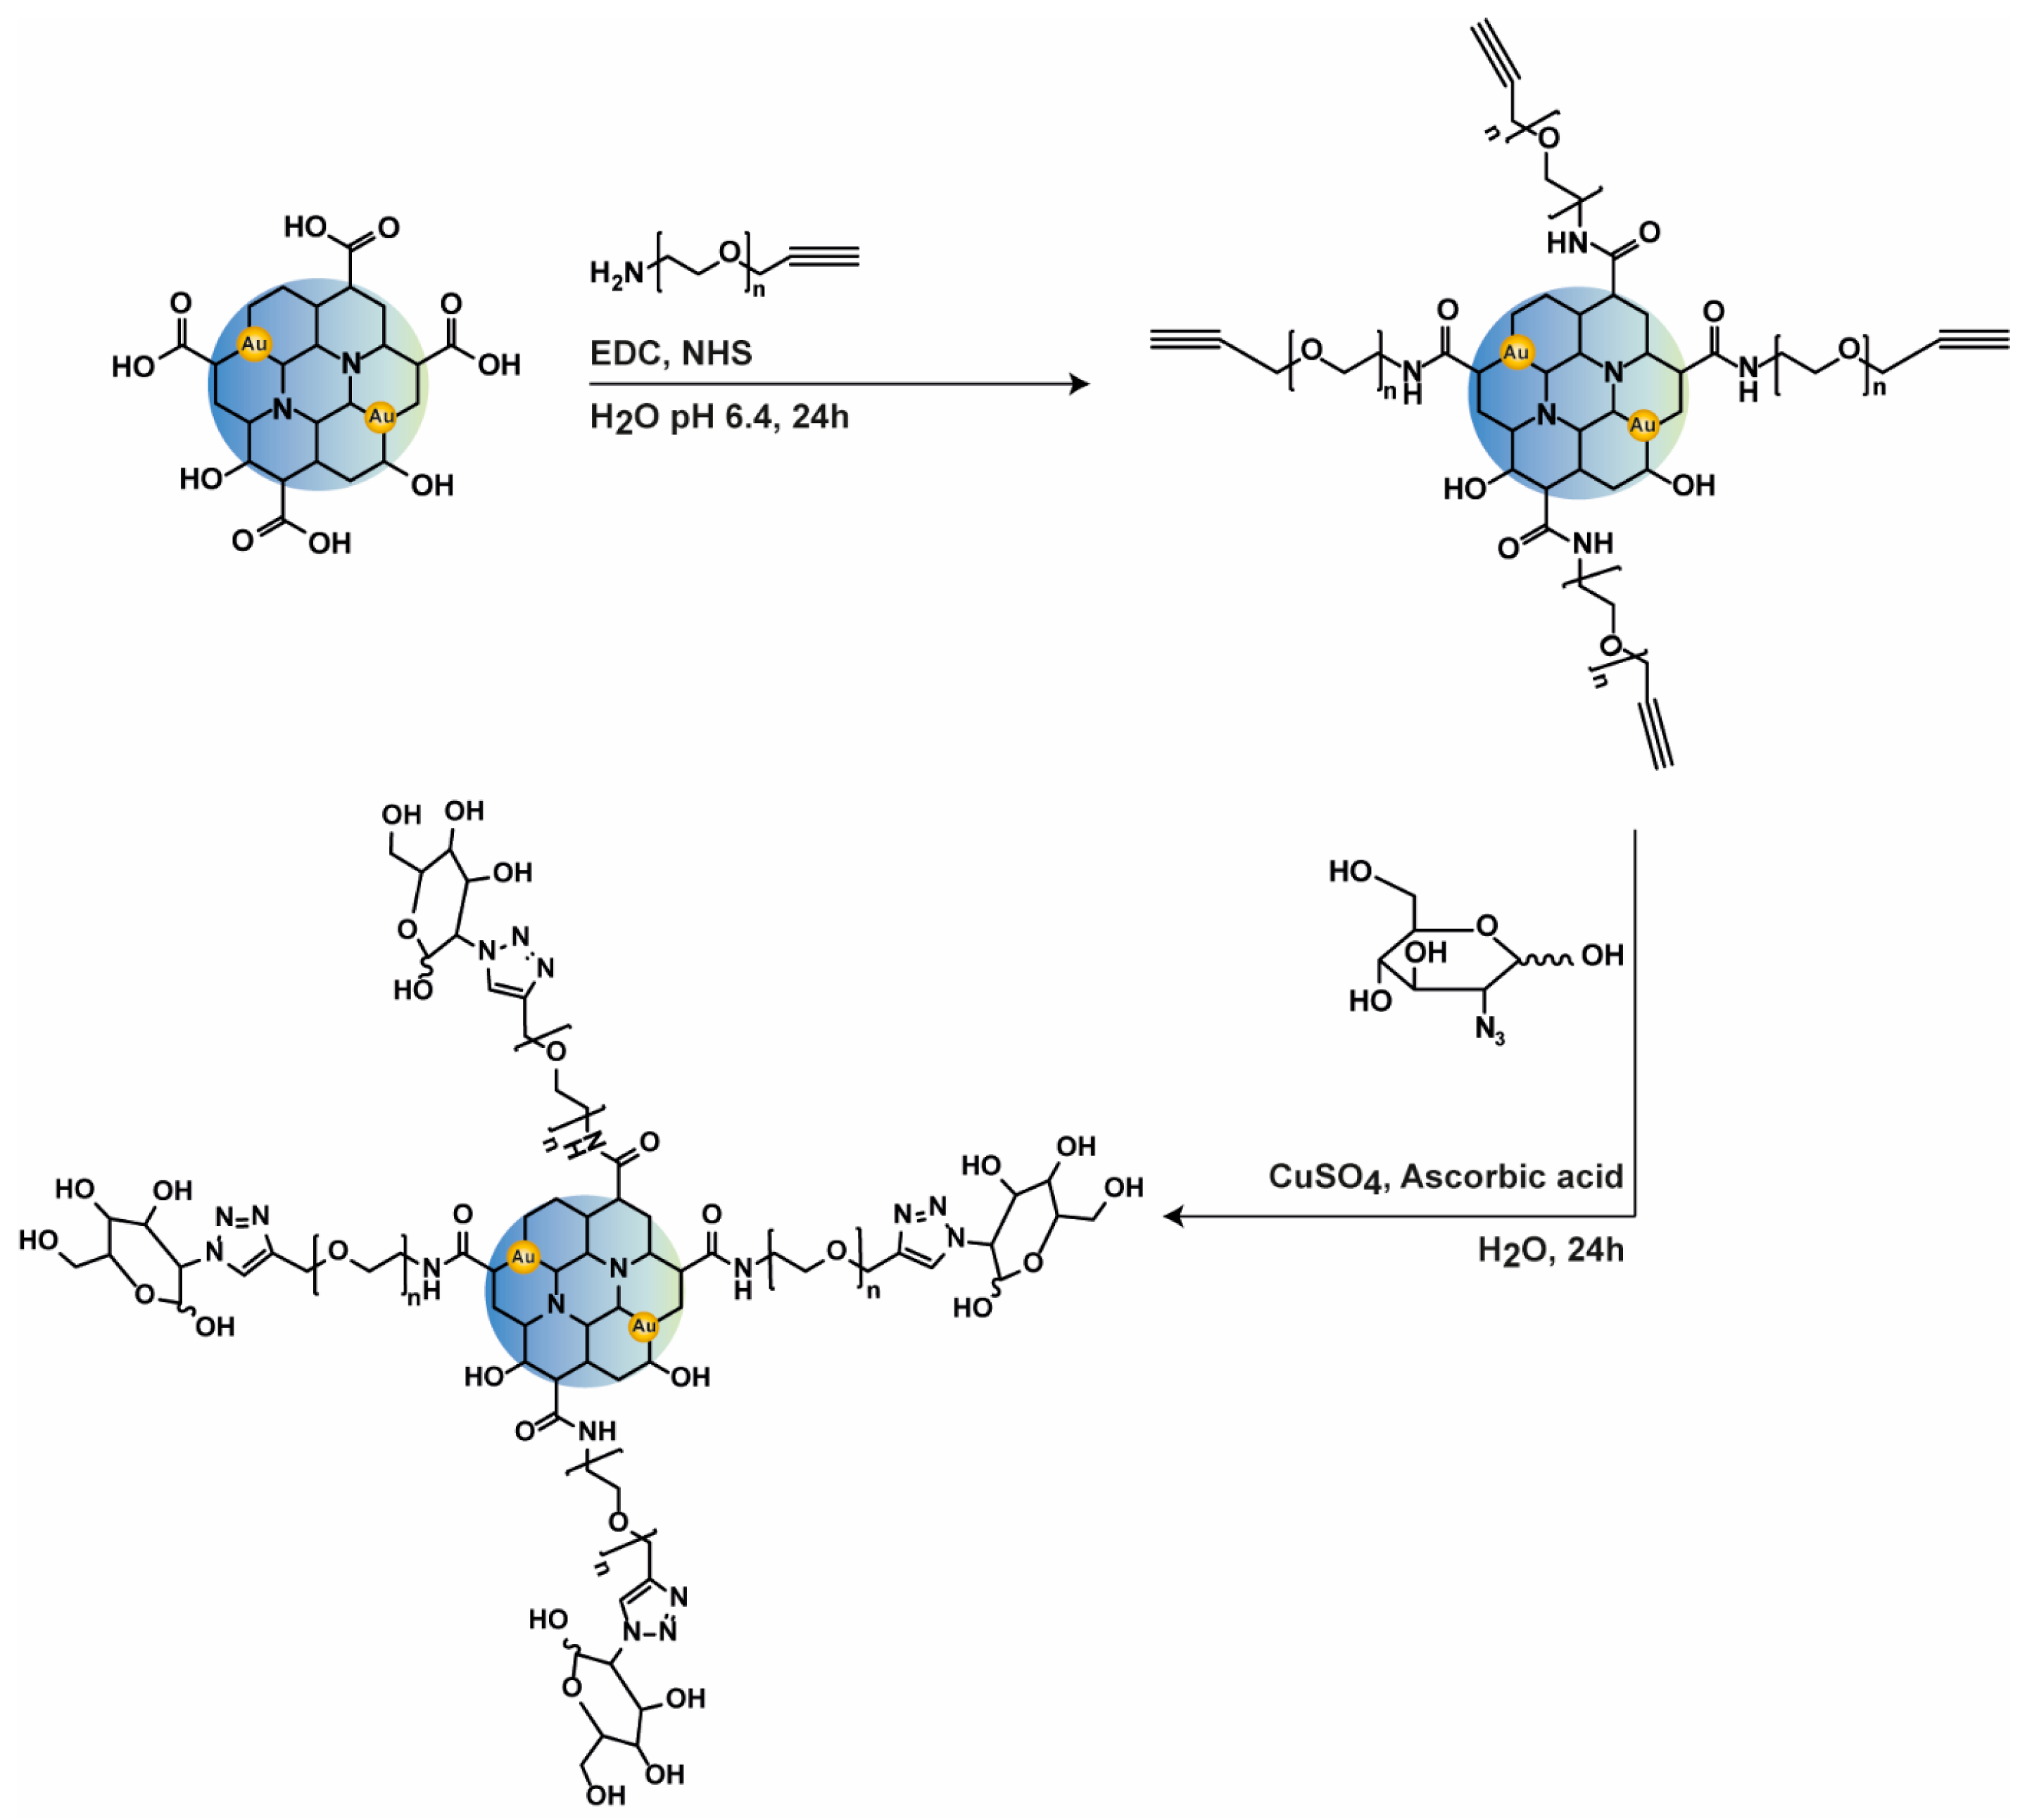
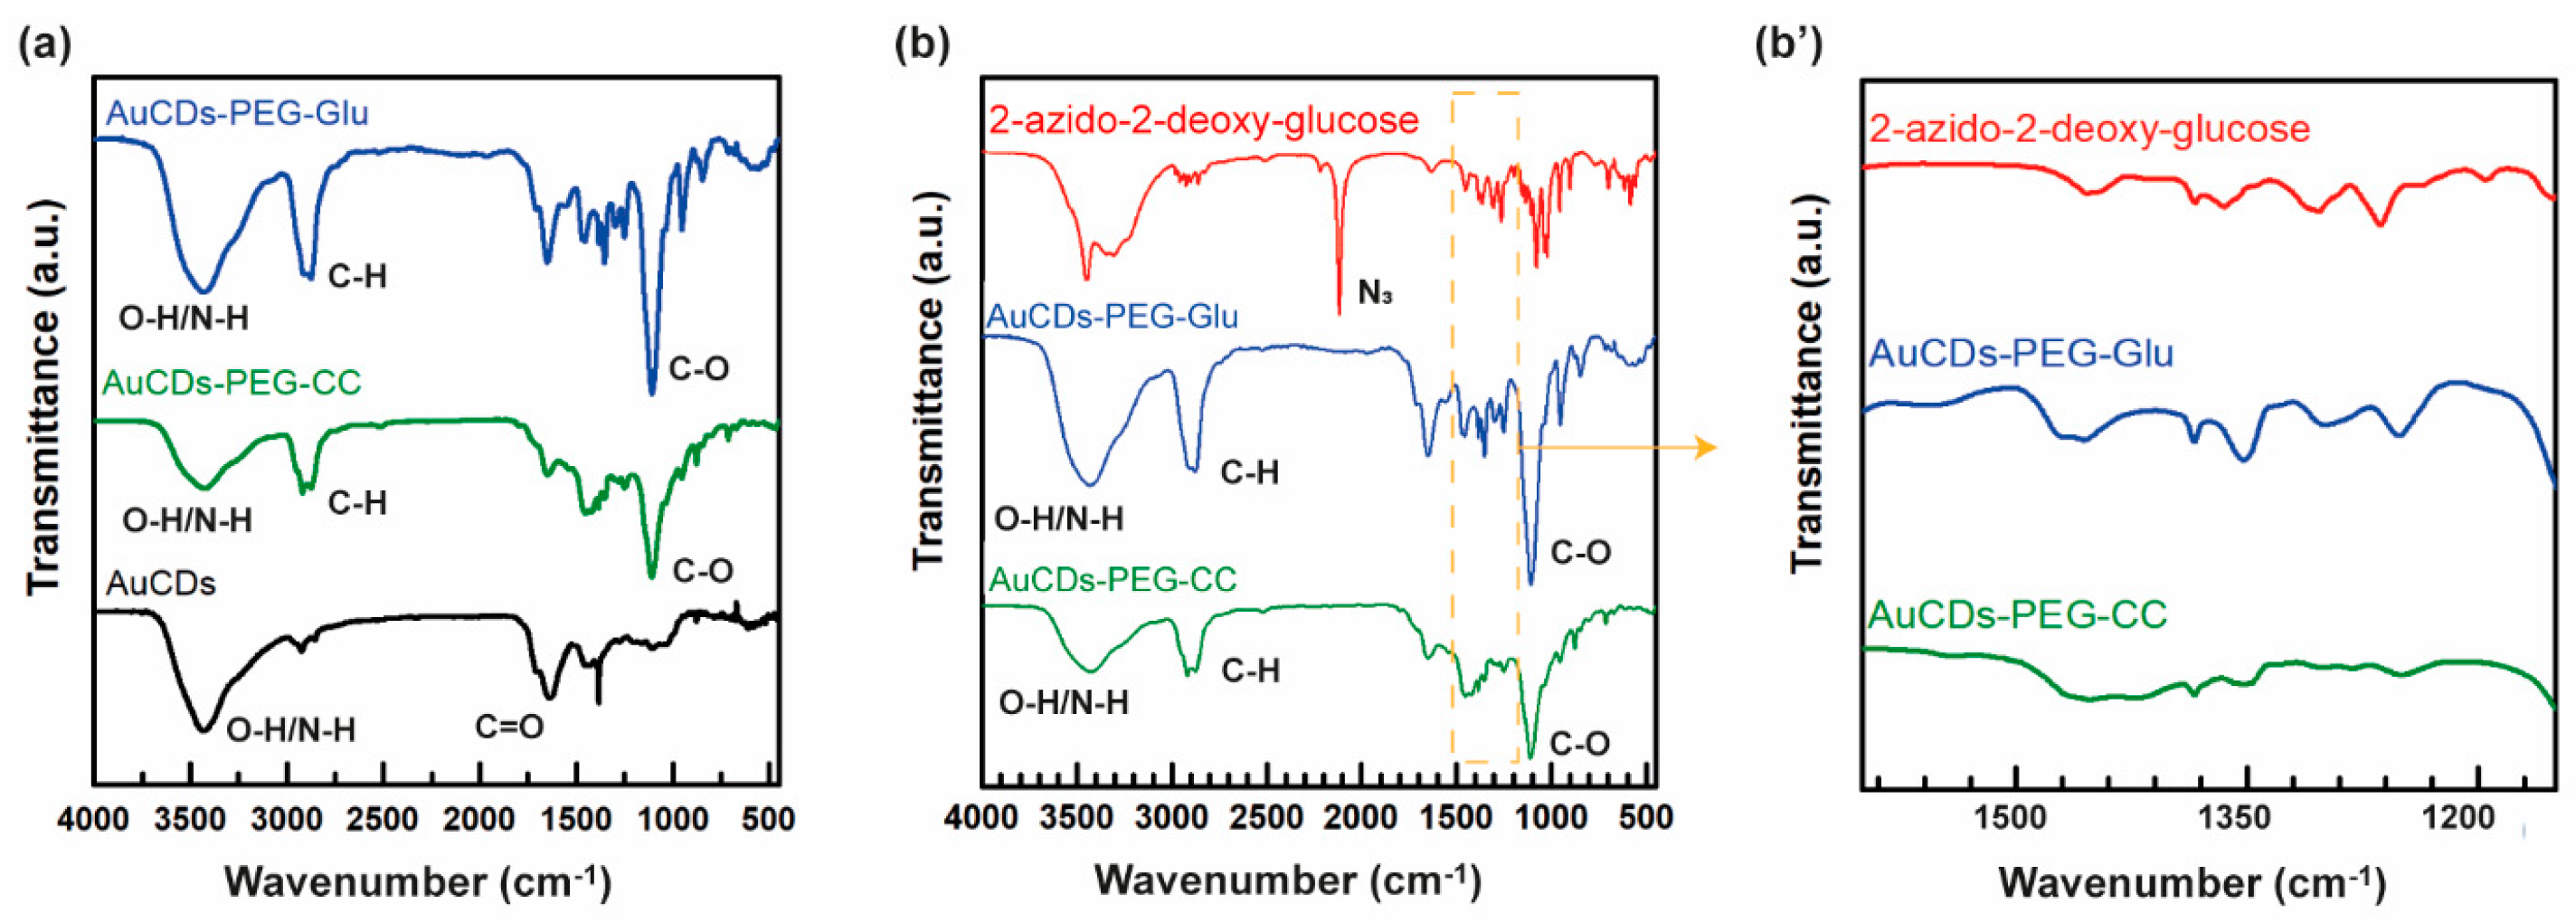
3.2. Surface Functionalization of AuCDs with 2-Deoxy-D-Glucose

To promote the selective targeting of AuCDs to cancer cells, by exploiting the Warburg effect, we conjugated 2-deoxy-D-glucose moieties at the nanoparticle surface. The synthesis of 2-deoxy-D-glucose-functionalized carbon nanodots was achieved by copper-catalyzed alkyne–azide Huisgen cycloaddition of 2-azido-2-deoxy-D-glucose on AuCDs, previously endowed with alkyne functions (AuCDs-PEG-CC) (Figure 3).
In detail, to introduce the alkyne functions required for the click chemistry reaction, we first modified the surface of AuCDs with a hetero-bi-functional PEG chain (2 kDa), bearing both amine and alkyne terminal functions (NH2-PEG-CC), which we previously synthesized from poly(ethylene glycol) bis(amine) by conjugation with 4-pentynoic acid (Figure S4A,B). The amine functions of NH2-PEG-CC were conjugated by amide bond with the carboxylic groups on the surface of AuCDs, using EDC and NHS as activating agents.
The presence of the PEG spacer in AuCDs-PEG-CC was confirmed by comparing the FT-IR spectra of the nanoparticles before and after functionalization. As shown in Figure 4a, the FT-IR spectrum of AuCDs-PEG-CC presents the vibrations of aliphatic C–H and C–O–C at 2900 cm−1 and 1100 cm−1, respectively, which are related to PEG chains [49,50]. Indeed, these bands are absent in the spectrum of AuCDs. Furthermore, the ratio of carboxylic to amidic vibrations (1714 cm−1 and 1640 cm−1) is lower in the AuCDs-PEG-CC spectrum, indicating the effective formation of amidic bonds during the functionalization.
The obtained AuCDs-PEG-CC was reacted with 2-azido-2-deoxy-D-glucose in the presence of Cu(I) as a catalyst, which was produced in solution through local reduction of Cu (II) by ascorbic acid, used as a reducing agent (Figure 3).
To prove the effectiveness of the synthetic pathway adopted, we analyzed the FT-IR spectra of the cycloaddition product, named AuCDs-PEG-Glu, and its precursors (Figure 4). As shown in Figure 4b,b’, the typical vibration bands of PEG chains are still maintained in the AuCDs-PEG-Glu spectra (2900 e 1100 cm−1), whereas the neat peak attributable to the azido group (2115 cm−1) does not appear, and the fingerprint region of AuCDs-PEG-Glu and 2-azido-2-deoxy-D-glucose spectra presents very similar peaks due to asymmetric C–O–C stretching (1100 cm−1) and C–C–O–H stretching (1475, 1370, and 1240 cm−1). These data indicate that 2-deoxy-D-glucose is effectively bound to the structure of AuCDs, and the azido group has been involved in the bond formation. Furthermore, the presence of an intense C=N vibration band at 1642 cm−1 in the AuCDs-PEG-Glu spectrum corroborates the formation of the triazole, expected from the Huisgen cycloaddition.
The average diameter of AuCDs increased after the functionalization process; indeed, AFM micrographs of AuCDs-PEG-Glu (Figure 5) show objects of about 12 nm diameter, which is two times higher than the diameter of bare AuCDs. Such a considerable increase is due to the presence of PEG chains at the surface of the nanoparticle, whose molecular weight of 2 kDa was purposely selected to raise the average diameter of AuCDs-PEG-Glu over the renal cutoff of 5 nm [51], ensuring reduced renal clearance. Considering that PEG2000 chains have also been associated with reduced unspecific uptake of the nanoparticles from the reticuloendothelial system (RES) [52], the functional role of the PEG spacer is clear in terms of extending the blood circulation time of the nanoparticles, favoring their distribution to the tumor.

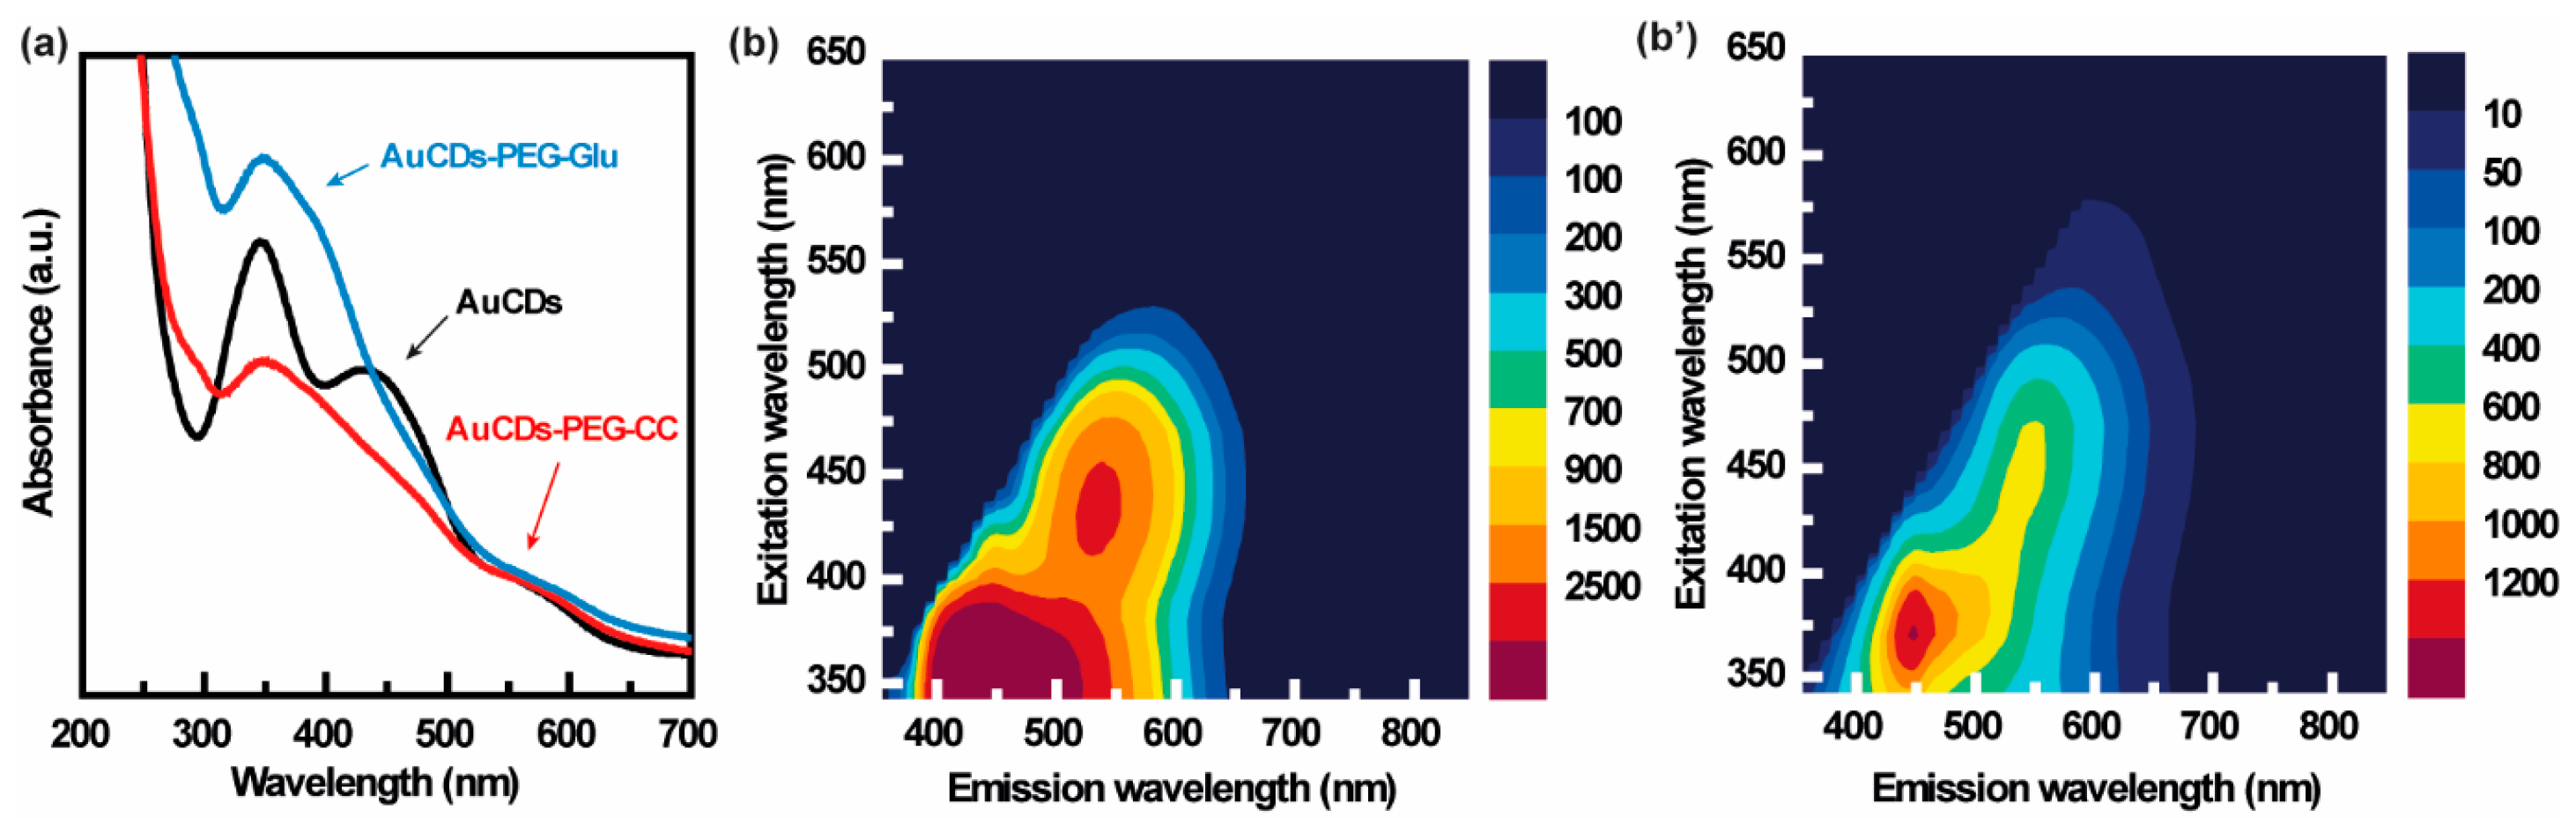
3.3. Optical Characterization of the AuCDs-PEG-Glu Conjugate and Precursors

The optical absorption spectra of AuCDs-PEG-Glu and its precursors are reported in Figure 6a. All the samples present complex spectra extending all along the UV–Visible region, with intense absorption below 300 nm, related to CDs’ core state transitions. The bare AuCDs show an intriguing spectrum, with three main absorption peaks at 348, 440, and 560 nm, whereas AuCDs-PEG-CC and AuCDs-PEG-Glu display very similar spectra with less-defined structures, which nevertheless resemble the same profile of the spectrum of AuCDs, presenting the main peak at 348 nm and decreasing tails that extend to 700 nm. Such elaborate absorption spectra indicate the occurrence of multiple electronic transitions associated with surface states, well-established in the literature [9], which are consistent with the presence of multiple functional groups at the nanoparticle surface [45].
The wide optical absorption range of the developed nanostructures results in multicolor fluorescence emission properties, which can be tuned by changing the excitation wavelength. As shown in Figure 6b, AuCDs present strong fluorescence emissions in the blue region, with a maximum intensity at about 450 nm, obtained by excitation in the 350–375 nm range, and a second main peak in the green region (535 nm), obtained by exiting the sample at 440 nm. The surface functionalization processes did not affect the position of the main emission peaks, recorded at 450 nm and 535 nm also for AuCDs-PEG-Glu (Figure 6b’). Moreover, the fluorescence emission properties of AuCDs and AuCDs-PEG-Glu go beyond the blue/green region, extending to the orange–red region with a gradually lower intensity.
Altogether, the surface passivation of AuCDs with PEG, and the subsequent conjugation with 2-deoxy-D-glucose, did not impair the optical qualities of the nanoparticles, including wide-range absorption and tunable multicolor emission properties, which makes them suitable as fluorescence imaging probes with self-tracking abilities. Although the main fluorescence emissions of AuCDs-PEG-Glu fall in the blue/green region, far from the window of biological transparency, limiting its application for in vivo imaging [53], it is nonetheless very useful for performing preliminary in vitro evaluation and could be exploited for ex vivo studies. On the other hand, having doped the core of the nanoparticles with gold, which is able to induce strong X-ray attenuation [11], in vivo tracking of the developed nanosystem could be performed by X-ray-based computed tomography (CT), which, moreover, provides better contrast and higher resolution even in deep tissues compared with FLI.

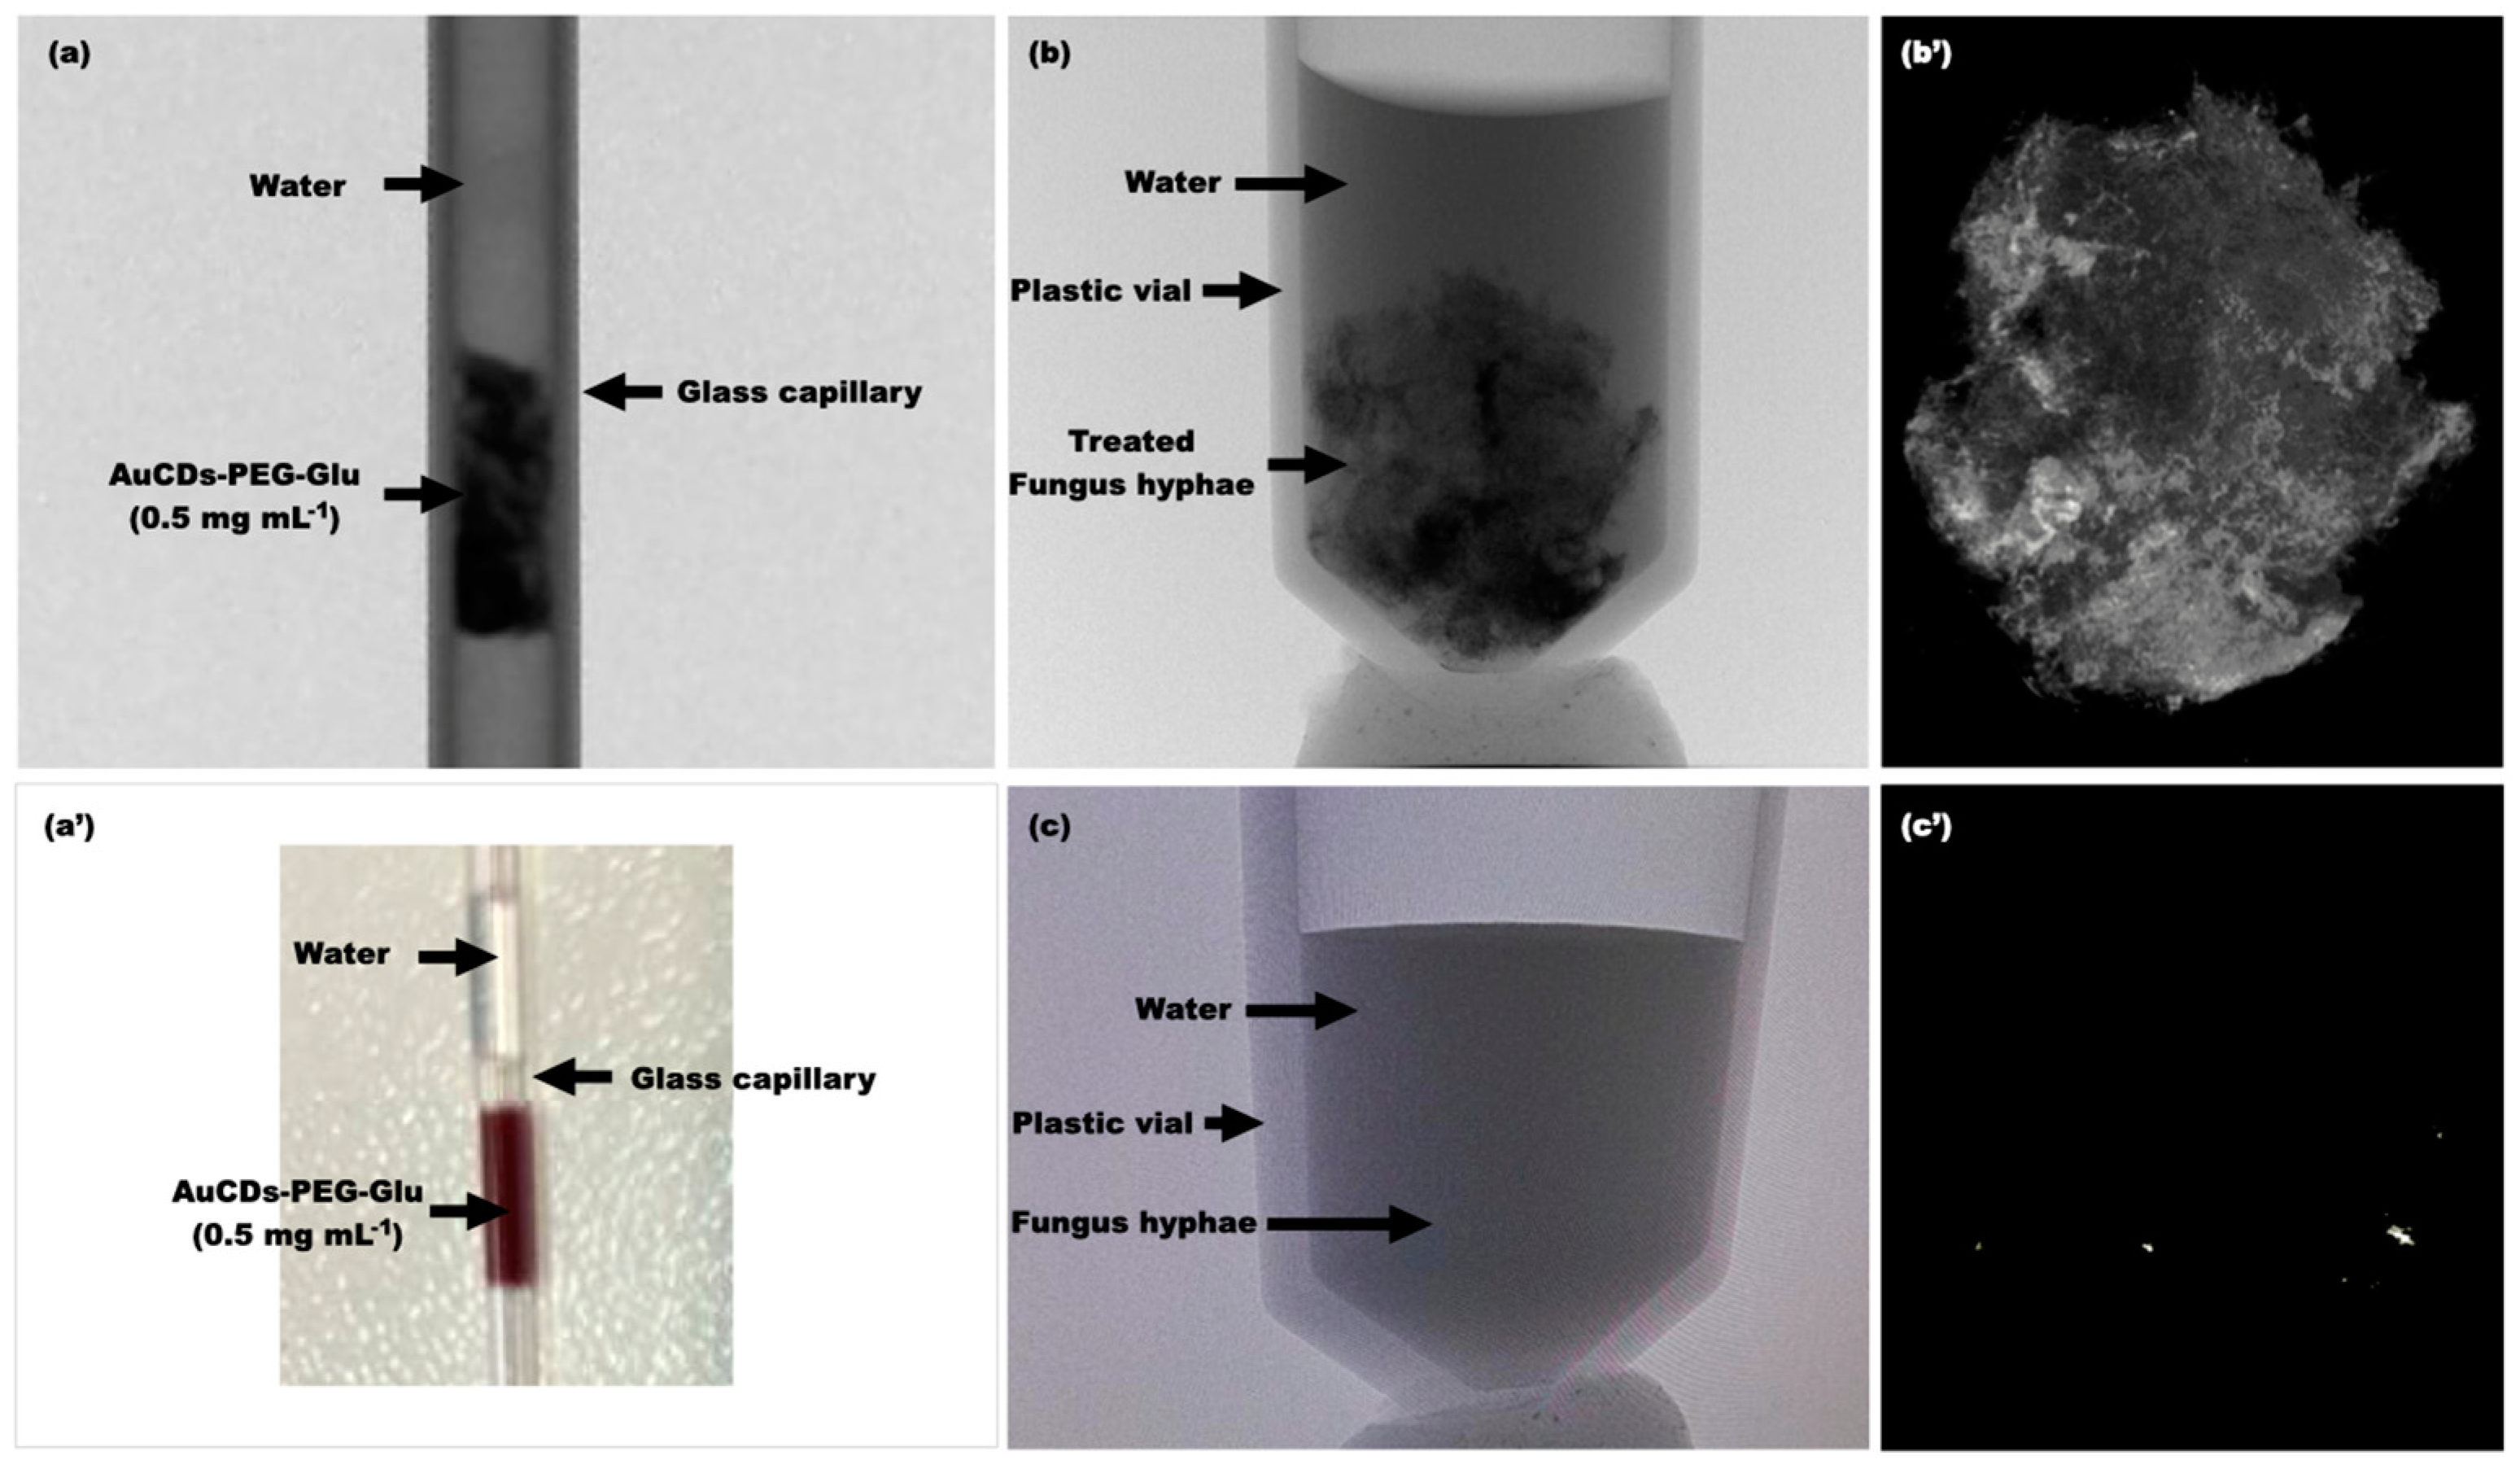
3.4. Characterization of the CT Contrast of the AuCDs-PEG-Glu Conjugate

The contrast properties of the AuCDs-PEG-Glu conjugate in computed tomography were established by micro-CT analisis both using a simple water dispersion of the sample against water (Figure 7a,a’) and an in vivo fungi model (Figure 7b,b’,c,c’). First of all, the CT contrast was measured by acquiring a micro-CT micrograph of a dispersion of AuCDs-PEG-Glu (0.5 mg mL−1) against water as a negative control, both placed in a glass capillary (Figure 7a,a’). As can be seen, the ultrapure water does not display any significant contrast, while the conjugate is characterized by remarkable X-ray scattering.
These evident contrast properties have been also confirmed in a complex 3D environment of living cells, such as fungi hyphae. In particular, we used P. Italicum hyphae, which are safe, available, and readily cultivable in nonspecialized laboratories. P. Italicum hyphae of about 2.5 mm were placed in a test tube containing a dispersion of AuCDs-PEG-Glu (0.5 mg mL−1) and incubated for 24 h at r.t. After that, the contrast was measured on the living hyphae by micro-CT analysis. As can be seen in Figure 7b,b’, the hyphal culture shows a bright contrast after the uptake of the conjugate, suggesting that it can penetrate inside cells and still maintain the starting features. On the contrary, the untreated hyphal culture cannot be observed by micro-CT scans (Figure 7c,c’). On the whole, it seems that the developed hybrid nanoplatforms allow imaging and monitoring living tissues after the exposure and the consequent uptake. Noteworthy is that CT contrast here can combined with fluorescence imaging for the in vitro and ex-vivo exploration of biological samples.

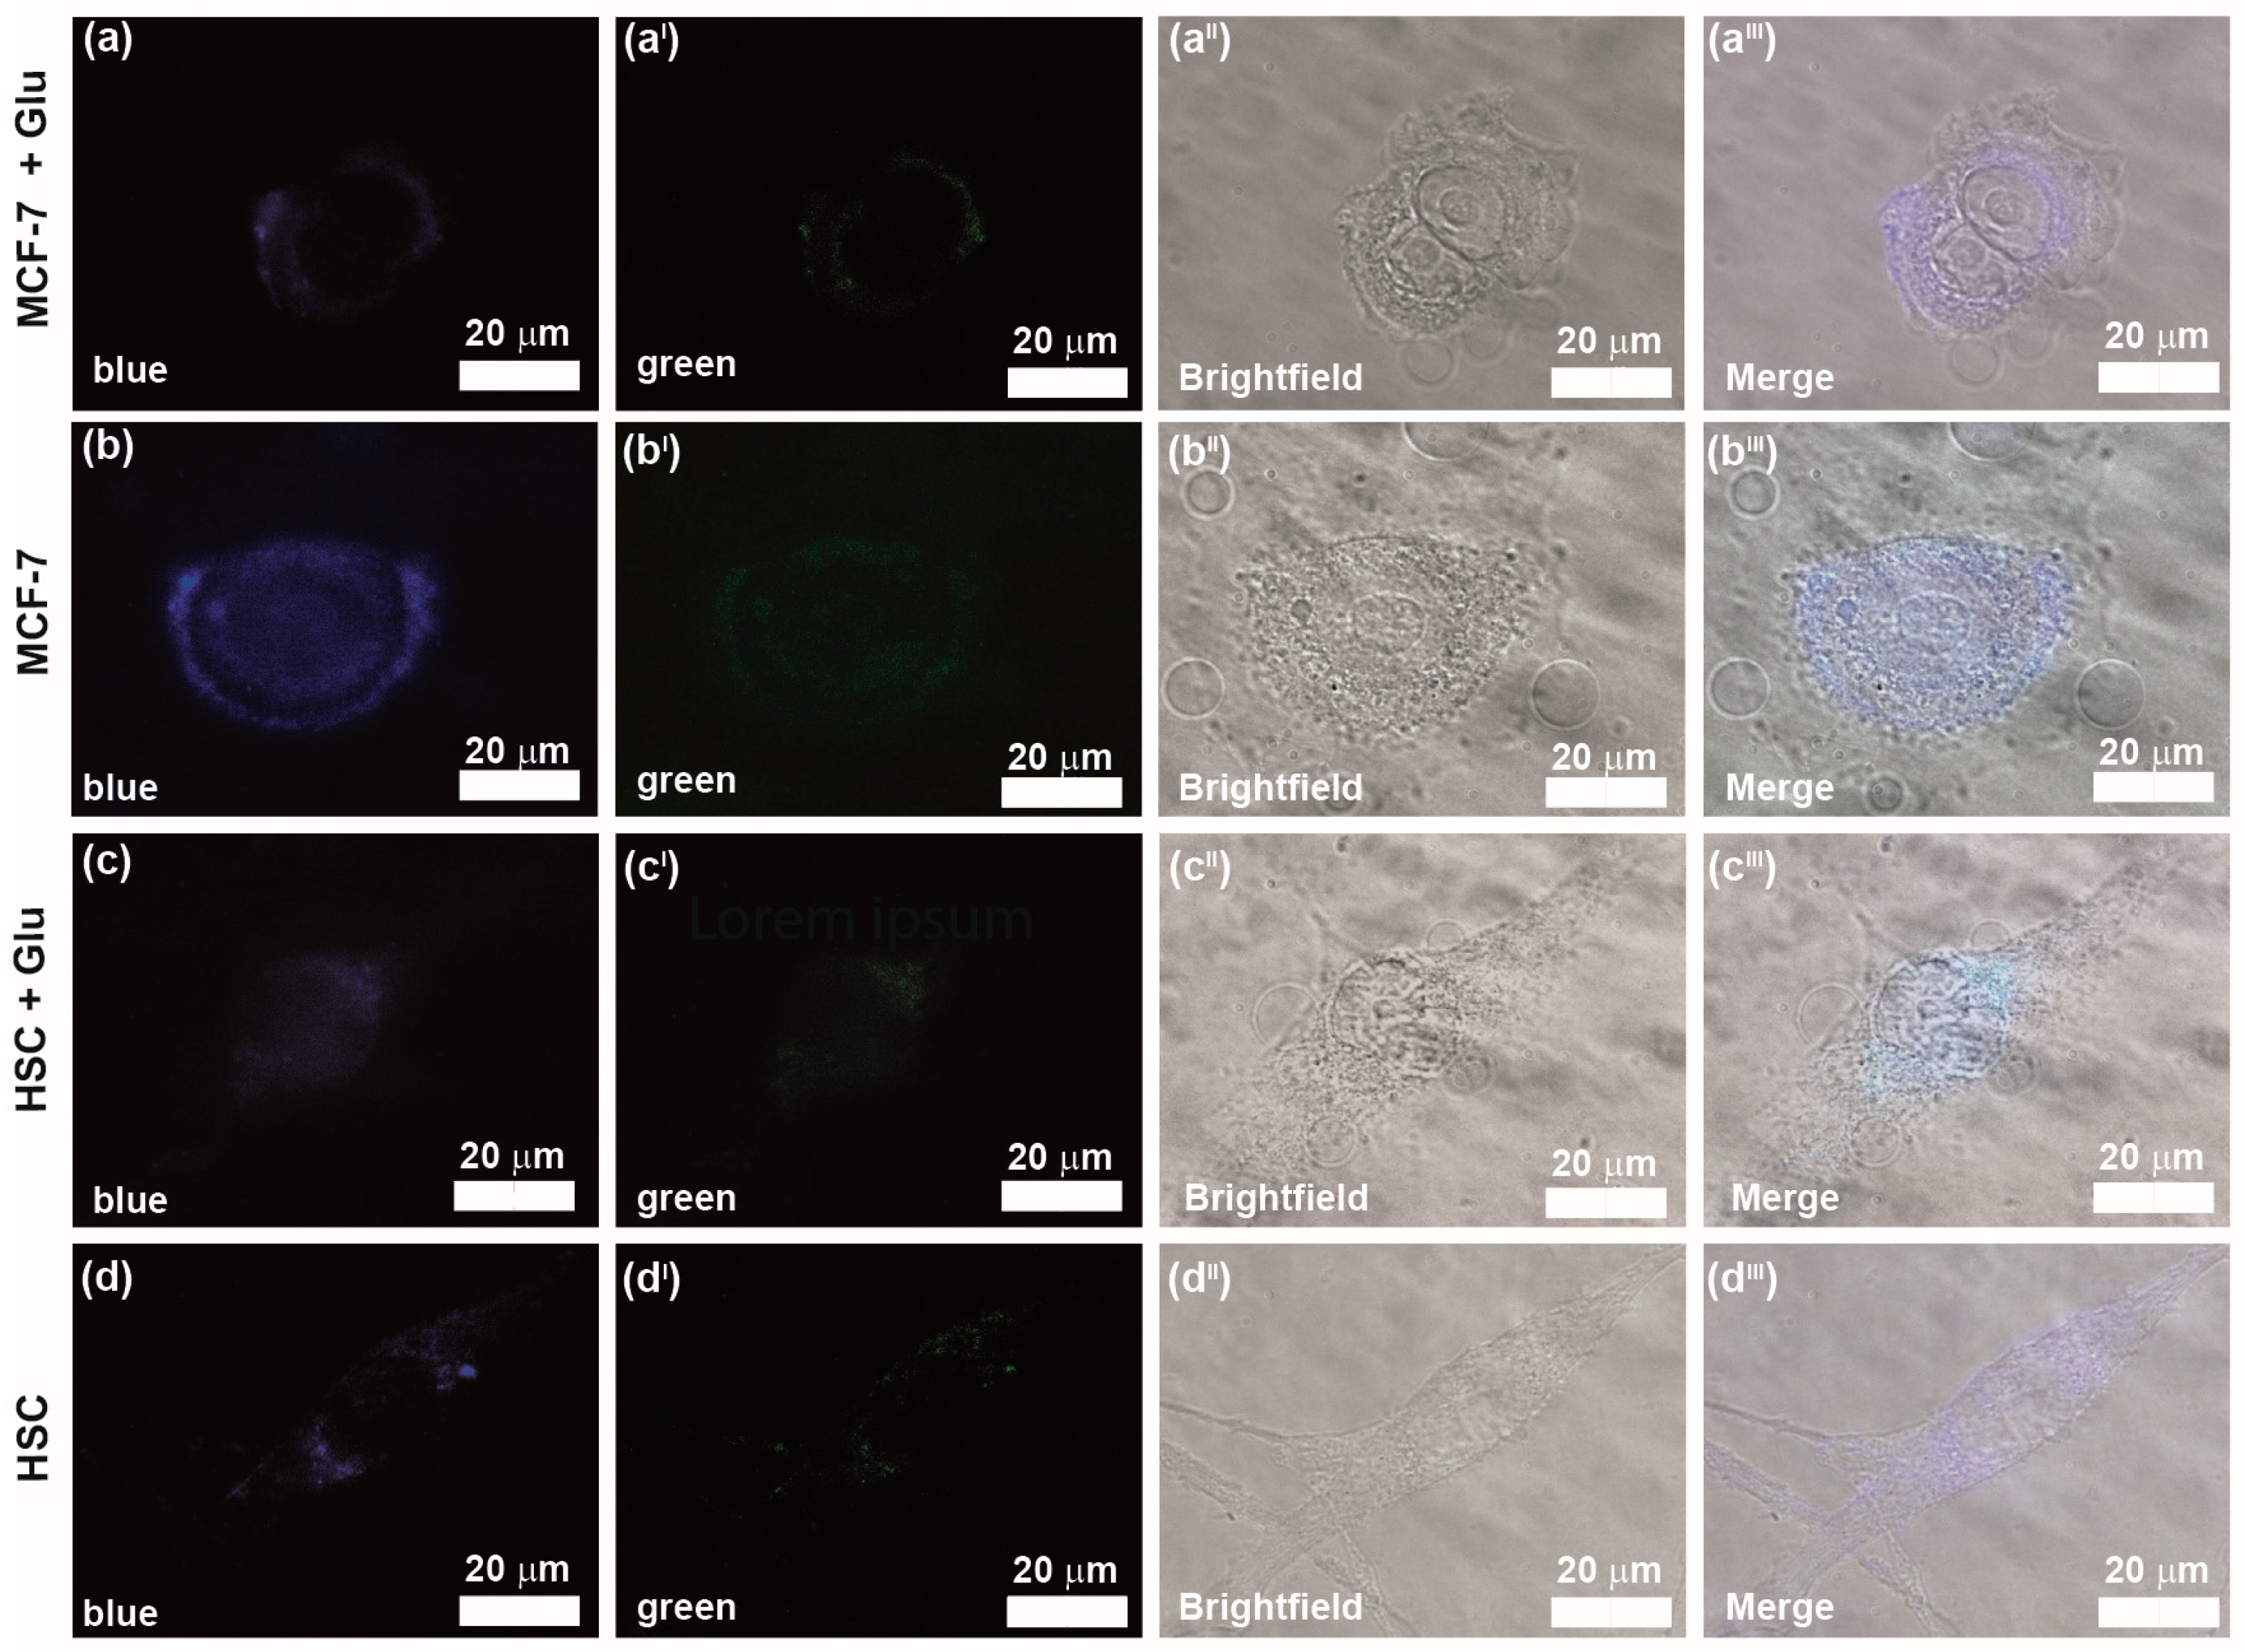
3.5. Glucose-Driven Cellular Uptake of AuCDs-PEG-Glu

The cellular uptake of AuCDs-PEG-Glu was evaluated by fluorescence microscopy, taking advantage of the fluorescence self-tracking properties of the nanoparticles in the blue–green channels. In particular, both healthy (human Schwann cells, HSC-hTERT ipn02.3 2λ) and breast cancer cells (MCF-7) were incubated with AuCDs-PEG-Glu for 24 h, and then fluorescence micrographs were acquired.
To assess the influence of glucose functionalization on the cellular internalization of AuCDs-PEG-Glu, in a parallel experimental set, we pre-treated the cells with D-glucose (250 mM), intending to induce the saturation of glucose transporters and abolish glucose-mediated uptake. As can be seen in Figure 8a–aIII, MCF-7 cells pretreated with glucose are able to internalize a small amount of the conjugate since the fluorescence intensity both in the blue and green channel is weak and restricted to the cytosol. Conversely, AuCDs-PEG-Glu efficiently enters cancer cells when glucose receptors are free to recognize glucose moieties at the conjugate’s surface (Figure 8b–bIII). Compared to those of glucose-pre-treated cells (Figure 8a,aIII), the fluorescence micrographs acquired from cells incubated with AuCDs-PEG-Glu in the absence of glucose are brighter, showing a higher accumulation of AuCDs-PEG-Glu within the cytosol and vesicular structures (i.e., cytosol, organelles, and nuclei). These preliminary studies indicate that, in the case of the MCF-7 cell line, AuCDs-PEG-Glu are predominantly internalized via a glucose-dependent mechanism rather than a passive one.
For the healthy HSC cells, the observed trend is quite different. In particular, the fluorescence intensity due to the uptake of AuCDs-PEG-Glu with (Figure 8c–cIII) and without (Figure 8d–dIII) the pre-incubation with D-glucose (250 mM) is low and comparable. This suggests that the uptake of conjugate by normal cells is moderate and not driven by glucose receptors. It might be noticed that cell uptake studies were performed without labeling the nanosystem with any fluorescent dye, just exploiting the blue and, although dull, green self-fluorescence of AuCDs-PEG-Glu for their tracking, demonstrating the potential role of the proposed nanostructure as a fluorescence imaging probe for in vitro or ex vivo evaluations after cellular internalization by cancer cells. Moreover, intraoperative fluorescence imaging using both laparoscopic and open surgery approaches can provide real-time identification of lymph nodes, tumor cells, and other malignant tissues, improving clinical outcomes. This can be achieved because, by eliminating the interference of soft tissues and skin in terms of absorption of blue and green light, the fluorescence detector and the laser source are in direct contact with the tissues to be treated.

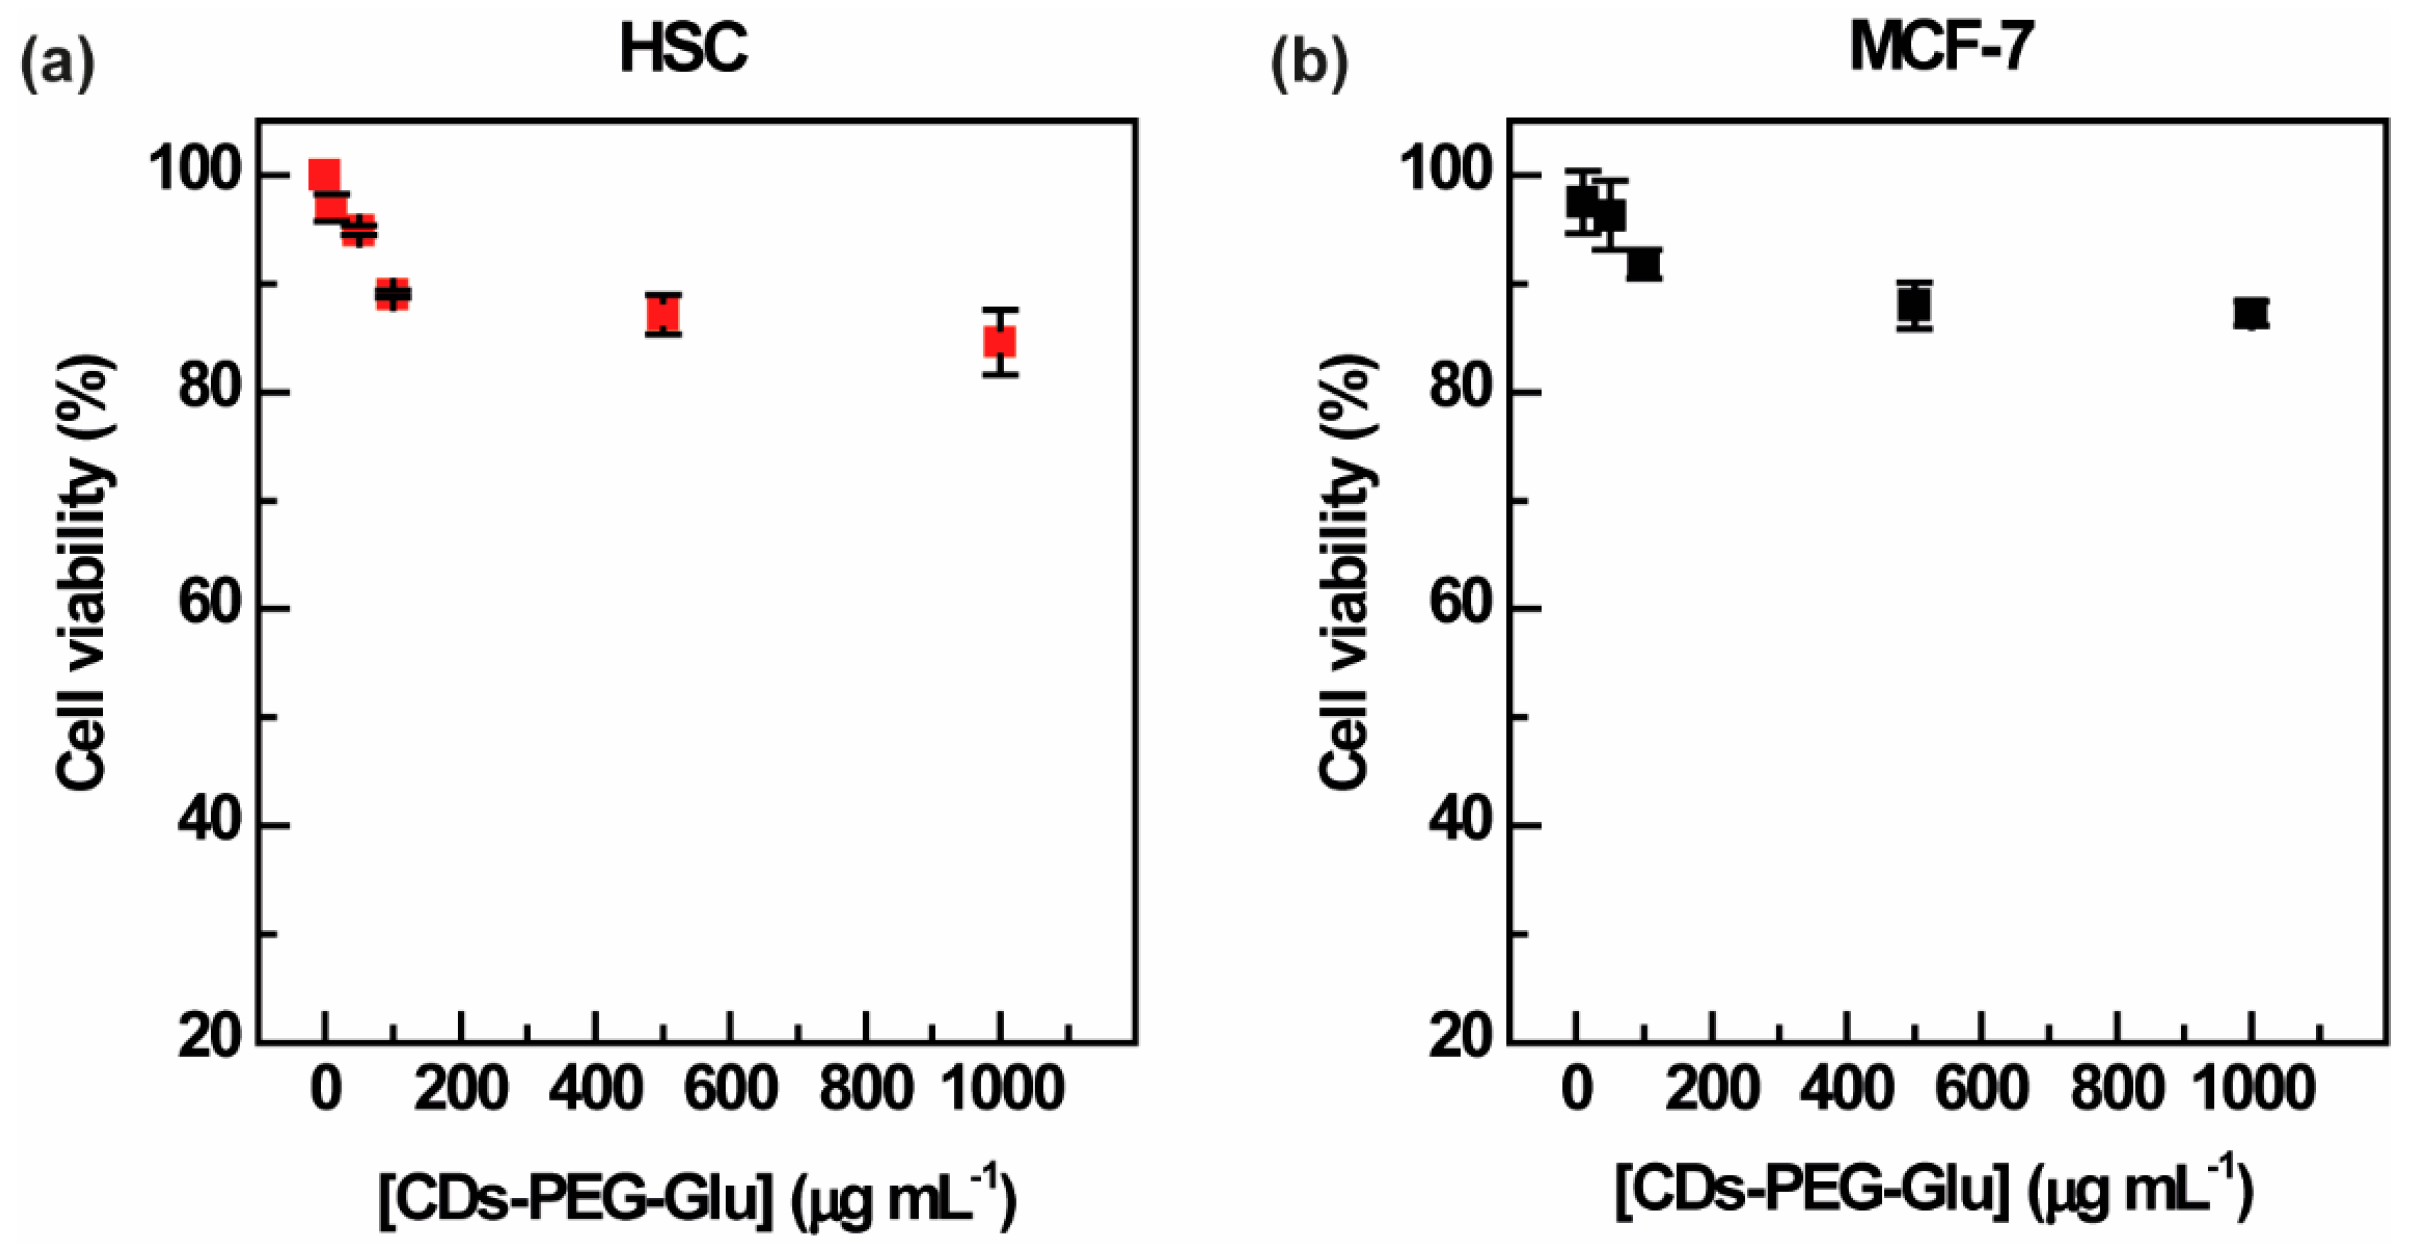
3.6. Cytocompatibility of AuCDs-PEG-Glu

The effect of 48 h incubation with increasing concentrations of AuCDs-PEG-Glu on the cell viability of HSC (Figure 9a) and MCF-7 (Figure 9b) was evaluated by MTS assay. The results show that AuCDs-PEG-Glu induced negligible cytotoxic effects on both the cell lines up to 1.0 mg mL−1. In fact, at the maximum concentration of 1 mg mL−1, the cell viability of HSC and MCF-7 was still beyond 85%, precisely 87.0 ± 3.0% and 87.1 ± 1.1%, respectively. These data suggest that the nanosystem is perfectly biocompatible and therefore suitable for biomedical applications.

4. Conclusions

In this study, we engineered a hybrid nanostructure comprising gold nanoseeds of 1–2 nm entrapped within a carbonaceous carbon nanodot core, coated with surface polar groups such as carboxyl and hydroxyl amide groups. This synthesis was achieved through the solvothermal decomposition of citric acid and urea in the presence of gold nanoseeds. A comprehensive series of complementary experiments demonstrated that pre-clustering the gold seeds before solvothermal decomposition of the urea/citric acid mixture facilitated the formation of ultrasmall nanohybrids of approximately 5 nm, exhibiting both fluorescence and CT contrast properties. The synthetic pathway employed yielded nanoscale carbon structures incorporating bioeliminable gold ultrasmall nanoparticles (with a diameter less than the renal cutoff). Leveraging surface carboxyl groups, the AuCDs hybrids were functionalized with PEG–glucose moieties using a straightforward and quantitative azido-alkyne click chemistry reaction (with 98% conversion). The tunable fluorescence in the blue–green region and remarkable X-ray attenuation capabilities of the AuCDs-PEG-Glu conjugate enabled synergistic multimodal imaging of cells, potentially valuable in image-guided cancer theranostics. We demonstrated the glucose-dependent entry of the conjugate into cancer cells, which was significantly heightened in cancer cells due to the Warburg effect. Conversely, AuCDs-PEG-Glu exhibited minimal entry into normal cells such as Schwann cells, indicating potential selective targeting towards breast cancer cells. The innovative use of glucose as a targeting agent represents a pioneering strategy for selectively directing nanoparticles towards cancer cells, exploiting the pronounced glucose uptake observed in tumors due to the Warburg effect. The demonstrated proficiency of cancer targeting through fluorescence imaging underscores the considerable promise of the proposed nanosystem for a diverse array of precision anticancer theranostic applications, spanning diagnostic and therapeutic pursuits.

Supplementary Materials

The following supporting information can be downloaded at https://www.mdpi.com/article/10.3390/c10020035/s1, Figure S1: UV–Vis absorption spectrum of gold seed solution; Figure S2: UV–Vis absorption spectra of the fractions (A–D) collected after the purification process of AuCDs by SEC; Figure S3: Emission spectra of the fractions (A–D) collected after the purification process of AuCDs by SEC; Figure S4: Schematic representation of the synthesis of the amino-PEG-alkyne (NH2-PEG-CC) (A) and 1H NMR spectrum (B).

Author Contributions

Writing—original draft preparation, data curation, formal analysis, validation, methodology, R.C.; writing—original draft preparation, formal analysis, methodology, S.S.; supervision, editing, funding acquisition, G.C.; conceived the project, supervision, writing—review and editing, data curation, N.M. All authors have read and agreed to the published version of the manuscript.

Funding

This research has received funding from the European Union—NextGenerationEU through the Italian Ministry of University and Research under PNRR—M4C2-I1.3 Project PE_00000019: “Health Extended ALliance for Innovative Therapies, Advanced Lab-research, and Integrated Approaches of Precision Medicine—HEAL ITALIA” to G.C. CUP: B73C22001250006. The views and opinions expressed are those of the authors only and do not necessarily reflect those of the European Union or the European Commission. Neither the European Union nor the European Commission can be held responsible for them.

Data Availability Statement

The original contributions presented in the study are included in the article/Supplementary Materials; further inquiries can be directed to the corresponding author.

Acknowledgments

We would like to acknowledge Paolo Bonomo, Advanced Technologies Network Center—ATeN Center, for the Mico-CT analysis reported in this work.

Conflicts of Interest

The authors declare no conflicts of interest.

Ethical Statement

The human Schwann cell (HSC) line-hTERT ipn02.3 2λ (ATCC CRL-3392) was obtained from ATCC. The MCF-7 cell line was provided by “Istituto Zooprofilattico Sperimentale della Lombardia e dell’Emilia Romagna”, Italy.

References

  1. Wang, M.; Thanou, M. Targeting Nanoparticles to Cancer. Pharmacol. Res. 2010, 62, 90–99. [Google Scholar] [CrossRef] [PubMed]
  2. Corrie, P.G. Cytotoxic Chemotherapy: Clinical Aspects. Medicine 2011, 39, 717–722. [Google Scholar] [CrossRef]
  3. Gavas, S.; Quazi, S.; Karpiński, T.M. Nanoparticles for Cancer Therapy: Current Progress and Challenges. Nanoscale Res. Lett. 2021, 16, 173. [Google Scholar] [CrossRef] [PubMed]
  4. Kim, B.Y.S.; Rutka, J.T.; Chan, W.C.W. Nanomedicine. N. Engl. J. Med. 2010, 363, 2434–2443. [Google Scholar] [CrossRef] [PubMed]
  5. Li, S.D.; Huang, L. Pharmacokinetics and Biodistribution of Nanoparticles. Mol. Pharm. 2008, 5, 496–504. [Google Scholar] [CrossRef] [PubMed]
  6. Wu, J. The Enhanced Permeability and Retention (Epr) Effect: The Significance of the Concept and Methods to Enhance Its Application. J. Pers. Med. 2021, 11, 771. [Google Scholar] [CrossRef]
  7. Islam, W.; Kimura, S.; Islam, R.; Harada, A.; Ono, K.; Fang, J.; Niidome, T.; Sawa, T.; Maeda, H. Epr-effect Enhancers Strongly Potentiate Tumor-targeted Delivery of Nanomedicines to Advanced Cancers: Further Extension to Enhancement of the Therapeutic Effect. J. Pers. Med. 2021, 11, 487. [Google Scholar] [CrossRef]
  8. Kang, H.; Rho, S.; Stiles, W.R.; Hu, S.; Baek, Y.; Hwang, D.W.; Kashiwagi, S.; Kim, M.S.; Choi, H.S. Size-Dependent EPR Effect of Polymeric Nanoparticles on Tumor Targeting. Adv. Healthc. Mater. 2020, 9, 1901223. [Google Scholar] [CrossRef]
  9. Sciortino, A.; Cannizzo, A.; Messina, F. Carbon Nanodots: A Review-From the Current Understanding of the Fundamental Photophysics to the Full Control of the Optical Response. C 2018, 4, 67. [Google Scholar] [CrossRef]
  10. Yang, S.T.; Wang, X.; Wang, H.; Lu, F.; Luo, P.G.; Cao, L.; Meziani, M.J.; Liu, J.H.; Liu, Y.; Chen, M.; et al. Carbon Dots as Nontoxic and High-Performance Fluorescence Imaging Agents. J. Phys. Chem. C 2009, 113, 18110–18114. [Google Scholar] [CrossRef]
  11. Hainfeld, J.F.; Slatkin, D.N.; Focella, T.M.; Smilowitz, H.M. Gold Nanoparticles: A New X-Ray Contrast Agent. Br. J. Radiol. 2006, 79, 248–253. [Google Scholar] [CrossRef] [PubMed]
  12. Sun, I.-C.; Eun, D.-K.; Koo, H.; Ko, C.-Y.; Kim, H.-S.; Kee Yi, D.; Choi, K.; Chan Kwon, I.; Kim, K.; Ahn, C.-H.; et al. Tumor-Targeting Gold Particles for Dual Computed Tomography/Optical Cancer Imaging. Angew. Chem. Int. Ed. 2011, 50, 9348–9351. [Google Scholar] [CrossRef]
  13. Kim, J.; Chhour, P.; Hsu, J.; Litt, H.I.; Ferrari, V.A.; Popovtzer, R.; Cormode, D.P. Use of Nanoparticle Contrast Agents for Cell Tracking with Computed Tomography. Bioconjug. Chem. 2017, 28, 1581–1597. [Google Scholar] [CrossRef]
  14. Chen, M.; He, X.; Wang, K.; He, D.; Yang, X.; Shi, H. Inorganic Fluorescent Nanoprobes for Cellular and Subcellular Imaging. TrAC Trends Anal. Chem. 2014, 58, 120–129. [Google Scholar] [CrossRef]
  15. Li, J.; Chaudhary, A.; Chmura, S.J.; Pelizzari, C.; Rajh, T.; Wietholt, C.; Kurtoglu, M.; Aydogan, B. A Novel Functional CT Contrast Agent for Molecular Imaging of Cancer. Phys. Med. Biol. 2010, 55, 4389–4397. [Google Scholar] [CrossRef] [PubMed]
  16. Zhou, Z.; Zhang, C.; Qian, Q.; Ma, J.; Huang, P.; Zhang, X.; Pan, L.; Gao, G.; Fu, H.; Fu, S.; et al. Folic Acid-Conjugated Silica Capped Gold Nanoclusters for Targeted Fluorescence/X-Ray Computed Tomography Imaging. J. Nanobiotechnol. 2013, 11, 17. [Google Scholar] [CrossRef] [PubMed]
  17. Yoo, J.; Park, C.; Yi, G.; Lee, D.; Koo, H. Active Targeting Strategies Using Biological Ligands for Nanoparticle Drug Delivery Systems. Cancers 2019, 11, 640. [Google Scholar] [CrossRef]
  18. Navarro, C.; Ortega, Á.; Santeliz, R.; Garrido, B.; Chacín, M.; Galban, N.; Vera, I.; De Sanctis, J.B.; Bermúdez, V. Metabolic Reprogramming in Cancer Cells: Emerging Molecular Mechanisms and Novel Therapeutic Approaches. Pharmaceutics 2022, 14, 1303. [Google Scholar] [CrossRef] [PubMed]
  19. Ediriweera, M.K.; Jayasena, S. The Role of Reprogrammed Glucose Metabolism in Cancer. Metabolites 2023, 13, 345. [Google Scholar] [CrossRef]
  20. Liberti, M.V.; Locasale, J.W. The Warburg Effect: How Does It Benefit Cancer Cells? Trends Biochem. Sci. 2016, 41, 211–218. [Google Scholar] [CrossRef]
  21. Heiden, M.G.V.; Cantley, L.C.; Thompson, C.B. Understanding the Warburg Effect: The Metabolic Requirements of Cell Proliferation. Science 2009, 324, 1029–1033. [Google Scholar] [CrossRef]
  22. Adekola, K.; Rosen, S.T.; Shanmugam, M. Glucose Transporters in Cancer Metabolism. Curr. Opin. Oncol. 2012, 24, 650–654. [Google Scholar] [CrossRef] [PubMed]
  23. Morais, M.; Machado, V.; Dias, F.; Figueiredo, P.; Palmeira, C.; Martins, G.; Fernandes, R.; Malheiro, A.R.; Mikkonen, K.S.; Teixeira, A.L.; et al. Glucose-Functionalized Silver Nanoparticles as a Potential New Therapy Agent Targeting Hormone-Resistant Prostate Cancer Cells. Int. J. Nanomed. 2022, 17, 4321. [Google Scholar] [CrossRef] [PubMed]
  24. Li, Y.; Hong, W.; Zhang, H.; Zhang, T.T.; Chen, Z.; Yuan, S.; Peng, P.; Xiao, M.; Xu, L. Photothermally Triggered Cytosolic Drug Delivery of Glucose Functionalized Polydopamine Nanoparticles in Response to Tumor Microenvironment for the GLUT1-Targeting Chemo-Phototherapy. J. Control. Release 2020, 317, 232–245. [Google Scholar] [CrossRef] [PubMed]
  25. Mamaeva, V.; Niemi, R.; Beck, M.; Ozliseli, E.; Desai, D.; Landor, S.; Gronroos, T.; Kronqvist, P.; Pettersen, I.K.N.; McCormack, E.; et al. Inhibiting Notch Activity in Breast Cancer Stem Cells by Glucose Functionalized Nanoparticles Carrying γ-Secretase Inhibitors. Mol. Ther. 2016, 24, 926. [Google Scholar] [CrossRef] [PubMed]
  26. Jiang, X.; Xin, H.; Ren, Q.; Gu, J.; Zhu, L.; Du, F.; Feng, C.; Xie, Y.; Sha, X.; Fang, X. Nanoparticles of 2-Deoxy-d-Glucose Functionalized Poly(Ethylene Glycol)-Co-Poly(Trimethylene Carbonate) for Dual-Targeted Drug Delivery in Glioma Treatment. Biomaterials 2014, 35, 518–529. [Google Scholar] [CrossRef] [PubMed]
  27. Younes, M.; Lechago, L.V.; Somoano, J.R.; Mosharaf, M.; Lechago, J. Wide Expression of the Human Erythrocyte Glucose Transporter Glut1 in Human Cancers. Cancer Res. 1996, 56, 1164–1167. [Google Scholar] [PubMed]
  28. Brown, R.S.; Wahl, R.L. Overexpression of Glut-1 Glucose Transporter in Human Breast Cancer An Immunohistochemical Study. Cancer 1993, 72, 2979–2985. [Google Scholar] [CrossRef] [PubMed]
  29. Okcu, O.; Sen, B.; Ozturk, C.; Findik Guvendi, G.; Bedir, R. GLUT-1 Expression in Breast Cancer. Turk Patoloji Derg. 2022, 38, 114–121. [Google Scholar] [CrossRef]
  30. Wang, J.; Ye, C.; Chen, C.; Xiong, H.; Xie, B.; Zhou, J.; Chen, Y.; Zheng, S.; Wang, L. Glucose Transporter GLUT1 Expression and Clinical Outcome in Solid Tumors: A Systematic Review and Meta-Analysis. Oncotarget 2017, 8, 16875–16886. [Google Scholar] [CrossRef]
  31. Pawar, S.; Duadi, H.; Fleger, Y.; Fixler, D. Design and Use of a Gold Nanoparticle-Carbon Dot Hybrid for a FLIM-Based IMPLICATION Nano Logic Gate. ACS Omega 2022, 7, 22818–22824. [Google Scholar] [CrossRef] [PubMed]
  32. Sidhu, J.S.; Singh, A.; Garg, N.; Kaur, N.; Singh, N. Gold Conjugated Carbon Dots Nano Assembly: FRET Paired Fluorescence Probe for Cysteine Recognition. Sens. Actuators B Chem. 2019, 282, 515–522. [Google Scholar] [CrossRef]
  33. Mauro, N.; Utzeri, M.A.; Varvarà, P.; Cavallaro, G. Molecules Functionalization of Metal and Carbon Nanoparticles with Potential in Cancer Theranostics. Molecules 2021, 26, 3085. [Google Scholar] [CrossRef] [PubMed]
  34. Sani, A.; Cao, C.; Cui, D. Toxicity of Gold Nanoparticles (AuNPs): A Review. Biochem. Biophys. Rep. 2021, 26, 100991. [Google Scholar] [CrossRef]
  35. Barreto, A.; Luis, L.G.; Pinto, E.; Almeida, A.; Paíga, P.; Santos, L.H.M.L.M.; Delerue-Matos, C.; Trindade, T.; Soares, A.M.V.M.; Hylland, K.; et al. Effects and Bioaccumulation of Gold Nanoparticles in the Gilthead Seabream (Sparus Aurata)—Single and Combined Exposures with Gemfibrozil. Chemosphere 2019, 215, 248–260. [Google Scholar] [CrossRef] [PubMed]
  36. Varvarà, P.; Tranchina, L.; Cavallaro, G.; Licciardi, M. Preparation and Characterization of Gold Nanorods Coated with Gellan Gum and Lipoic Acid. Appl. Sci. 2020, 10, 8322. [Google Scholar] [CrossRef]
  37. Giammona, G.; Drago, S.E.; Calabrese, G.; Varvarà, P.; Rizzo, M.G.; Mauro, N.; Nicotra, G.; Conoci, S.; Pitarresi, G. Galactosylated Polymer/Gold Nanorods Nanocomposites for Sustained and Pulsed Chemo-Photothermal Treatments of Hepatocarcinoma. Pharmaceutics 2022, 14, 2503. [Google Scholar] [CrossRef] [PubMed]
  38. Scialabba, C.; Sciortino, A.; Messina, F.; Buscarino, G.; Cannas, M.; Roscigno, G.; Condorelli, G.; Cavallaro, G.; Giammona, G.; Mauro, N. Highly Homogeneous Biotinylated Carbon Nanodots: Red-Emitting Nanoheaters as Theranostic Agents toward Precision Cancer Medicine. ACS Appl. Mater. Interfaces 2019, 11, 19854–19866. [Google Scholar] [CrossRef] [PubMed]
  39. Amendola, V.; Meneghetti, M. Size Evaluation of Gold Nanoparticles by UV-Vis Spectroscopy. J. Phys. Chem. C 2009, 113, 4277–4285. [Google Scholar] [CrossRef]
  40. Grzelczak, M.; Pérez-Juste, J.; Mulvaney, P.; Liz-Marzán, L.M. Shape Control in Gold Nanoparticle Synthesis. Chem. Soc. Rev. 2008, 37, 1783–1791. [Google Scholar] [CrossRef]
  41. Zhang, Y.; Newton, B.; Lewis, E.; Fu, P.P.; Kafoury, R.; Ray, P.C.; Yu, H. Cytotoxicity of Organic Surface Coating Agents Used for Nanoparticles Synthesis and Stability. Toxicol. Vitro 2015, 29, 762. [Google Scholar] [CrossRef] [PubMed]
  42. Sharma, A.; Jampani, V.S.R.; Lagerwall, J.P.F. Realignment of Liquid Crystal Shells Driven by Temperature-Dependent Surfactant Solubility. Langmuir 2019, 35, 11132–11140. [Google Scholar] [CrossRef] [PubMed]
  43. Xue, Y.; Li, X.; Li, H.; Zhang, W. Quantifying Thiol–Gold Interactions towards the Efficient Strength Control. Nat. Commun. 2014, 5, 4348. [Google Scholar] [CrossRef] [PubMed]
  44. Watt, J.; Hance, B.G.; Anderson, R.S.; Huber, D.L. Effect of Seed Age on Gold Nanorod Formation: A Microfluidic, Real-Time Investigation. Chem. Mater. 2015, 27, 6442–6449. [Google Scholar] [CrossRef]
  45. Mauro, N.; Utzeri, M.A.; Sciortino, A.; Messina, F.; Cannas, M.; Popescu, R.; Gerthsen, D.; Buscarino, G.; Cavallaro, G.; Giammona, G. Decagram-Scale Synthesis of Multicolor Carbon Nanodots: Self-Tracking Nanoheaters with Inherent and Selective Anticancer Properties. ACS Appl. Mater. Interfaces 2022, 14, 2551–2563. [Google Scholar] [CrossRef] [PubMed]
  46. Sciortino, A.; Mauro, N.; Buscarino, G.; Sciortino, L.; Popescu, R.; Schneider, R.; Giammona, G.; Gerthsen, D.; Cannas, M.; Messina, F. β-C3N4 Nanocrystals: Carbon Dots with Extraordinary Morphological, Structural, and Optical Homogeneity. Chem. Mater. 2018, 30, 1695–1700. [Google Scholar] [CrossRef]
  47. Park, J.W.; Shumaker-Parry, J.S. Structural Study of Citrate Layers on Gold Nanoparticles: Role of Intermolecular Interactions in Stabilizing Nanoparticles. J. Am. Chem. Soc. 2014, 136, 1907–1921. [Google Scholar] [CrossRef]
  48. Aldewachi, H.; Woodroofe, N.; Gardiner, P. Study of the Stability of Functionalized Gold Nanoparticles for the Colorimetric Detection of Dipeptidyl Peptidase IV. Appl. Sci. 2018, 8, 2589. [Google Scholar] [CrossRef]
  49. Shameli, K.; Ahmad, M.B.; Jazayeri, S.D.; Sedaghat, S.; Shabanzadeh, P.; Jahangirian, H.; Mahdavi, M.; Abdollahi, Y. Synthesis and Characterization of Polyethylene Glycol Mediated Silver Nanoparticles by the Green Method. Int. J. Mol. Sci. 2012, 13, 6639–6650. [Google Scholar] [CrossRef]
  50. Mauro, N.; Cillari, R.; Andrea Utzeri, M.; Costa, S.; Giammona, G.; Nicosia, A.; Cavallaro, G. Controlled Delivery of Sildenafil by β-Cyclodextrin-Decorated Sulfur-Doped Carbon Nanodots: A Synergistic Activation of ROS Signaling in Tumors Overexpressing PDE-5. Int. J. Pharm. 2023, 645, 123409. [Google Scholar] [CrossRef]
  51. Ernsting, M.J.; Murakami, M.; Roy, A.; Li, S.D. Factors Controlling the Pharmacokinetics, Biodistribution and Intratumoral Penetration of Nanoparticles. J. Control. Release 2013, 172, 782–794. [Google Scholar] [CrossRef] [PubMed]
  52. Schipper, M.L.; Iyer, G.; Koh, A.L.; Cheng, Z.; Ebenstein, Y.; Aharoni, A.; Keren, S.; Bentolila, L.A.; Li, J.; Rao, J.; et al. Particle Size, Surface Coating, and PEGylation Influence the Biodistribution of Quantum Dots in Living Mice. Small 2009, 5, 126–134. [Google Scholar] [CrossRef] [PubMed]
  53. Rao, J.; Dragulescu-Andrasi, A.; Yao, H. Fluorescence Imaging in Vivo: Recent Advances. Curr. Opin. Biotechnol. 2007, 18, 17–25. [Google Scholar] [CrossRef] [PubMed]
Figure 1. Scheme representing the synthesis pathway for AuCDs; gold seeds were prepared by reduction of Au3+, provided as HAuCl4, using NaBH4 as a reducing agent and CTAB as stabilizer, and then GSH was used to replace CTAB at the surface of the seeds. The obtained gold seeds participated in the formation of carbonaceous structures via solvothermal decomposition of citric acid and urea, obtaining hybrid gold/carbon nanoparticles.
Carbon 10 00035 g001
Figure 2. Structural characterization of AuCDs; AFM micrograph (a) and 3D projection of each single object height (a’); FT-IR spectrum of a sample of AuCDs prepared as KBr pellet, recorded in the 450–4000 cm−1 range (b).
Carbon 10 00035 g002
Figure 3. Synthetic pathway for the surface functionalization of AuCDs with 2-deoxy-D-glucose. The amino end-group of amino-PEG-alkyne was used for the amide coupling to the carboxylic functions at the AuCDs surface, and then the introduced alkyne functions were involved in the formation of the triazole by reacting with the azido group of 2-azido-2-deoxy-D-glucose.
Carbon 10 00035 g003
Figure 4. Surface functional characterization through FT-IR. FT-IR spectra of AuCDs, AuCDs-PEG-CC, and AUCDs-PEG-Glu samples, prepared as KBr pellets, in the 4000–490 cm−1 range (a); FT-IR spectra of AuCDs-PEG-Glu and precursors (AuCDs-PEG-CC and 2-azido-2-deoxy-glucose) samples, prepared as KBr pellets, in the 4000–490 cm−1 range (b), and details of the 1600–1150 cm−1 range (b’).
Carbon 10 00035 g004
Figure 5. AFM micrograph of AuCDs-PEG-Glu; 2D micrograph (a) and 3D projection of single object height (a’).
Carbon 10 00035 g005
Figure 6. Optical characterization of AuCDs-PEG-Glu and precursors. UV–Vis absorption spectra of AuCDs, AuCDs-PEG-CC, and AuCDs-PEG-Glu samples, prepared as aqueous solutions, in the 200–700 nm range (a); 3D fluorescence emission spectra of AuCDs (b) and AuCDs-PEG-Glu (b’) in the 360–750 nm range (lex 350–600 nm).
Carbon 10 00035 g006
Figure 7. CT contrast characterization of AuCDs-PEG-Glu. CT micrograph of the Au-CDs-PEG-Glu dispersion in comparison with ultrapure water (a): the dispersion is sealed in a glass capillary with a separate control of water (a’). Micro-CT measurements (b) and 3D reconstruction of the contrast signal (b’) of P. Italicum fungi hyphae incubated for 24 h with a dispersion of AuCDs-PEG-Glu (0.5 mg mL−1). Micro-CT measurements (c) and 3D reconstruction of the contrast signal (c’) of P. Italicum fungi hyphae in water (negative control).
Carbon 10 00035 g007
Figure 8. Fluorescence microscopy acquisitions after cellular uptake on breast cancer (MCF-7, (a,b)) and human Schwann cells (HSC, (cd)), with (ac) or without (bd) pre-incubation with D-glucose; AuCDs-PEG-Glu are self-fluorescent in blue ((lex 405 nm lem 461 nm) (ad), and slightly in green (lex 498 nm lem 517 nm) (aIdI); brightfield micrographs (aIIdII), and all channels merged (aIIIdIII). 100× magnification.
Carbon 10 00035 g008
Figure 9. In vitro cytocompatibility of AuCDs-PEG-Glu on (a) healthy (HSC) and (b) breast cancer (MCF-7) cells. The analysis was performed by MTS assay after 48 h of incubation with AuCDs-PEG-Glu at increasing concentrations in the 0.01–1 mg mL−1 range. Data are reported as average cell viability percentage ± SD.
Carbon 10 00035 g009
Disclaimer/Publisher’s Note: The statements, opinions and data contained in all publications are solely those of the individual author(s) and contributor(s) and not of MDPI and/or the editor(s). MDPI and/or the editor(s) disclaim responsibility for any injury to people or property resulting from any ideas, methods, instructions or products referred to in the content.

