Article

Observation of Structural Changes during Oxidation of Black and Brown Soot Using Raman Spectroscopy

Division of Combustion Physics, Department of Physics, Lund University, P.O. Box 118, SE-221 00 Lund, Sweden
*
Author to whom correspondence should be addressed.
Submission received: 5 February 2024 / Revised: 18 March 2024 / Accepted: 1 April 2024 / Published: 15 April 2024
(This article belongs to the Section Combustion Emissions)

Abstract

:
In this study, Raman spectroscopy has been used to evaluate the evolution of the structural modification of soot during oxidation processes at various preset temperatures up to 700 °C. Two types of well-characterized mini-CAST soot, representing black soot and brown soot, were examined. The major difference between the signals from the two types of soot was the higher photoluminescence (PL) signal for brown soot compared with black soot, in addition to some variations in the first-order Raman signatures such as oxygenated groups and their evolutions during thermal oxidation treatment. An interesting observation was the increase in the PL signal for brown soot at increasing temperatures up to 150 °C probably due to the formation of small oxidized polycyclic aromatic hydrocarbon and defects, followed by a decrease in the PL signal until the soot was fully oxidized. We also demonstrated that brown soot is prone to oxidation in ex situ measurements, a factor that should be considered in the Raman analysis of soot.

1. Introduction

Incomplete combustion or pyrolysis of hydrocarbons leads to soot emissions. Depending on the combustion or pyrolysis conditions, soot structures and their properties are highly diverse [1,2,3]. Once emitted into the atmosphere, soot properties, such as morphology are continuously changed due to transformations and reactions with other compounds in the environment during the soot aging processes [4,5,6]. Polycyclic aromatic hydrocarbons (PAHs) formed along with soot are major compounds that have long been known to oxidize as components of secondary organic aerosols [7].
Oxidation refers to the reaction of soot and PAH with both atomic and molecular oxygen including O3, O2, and OH, and oxygen-containing species such as CO2 or H2O at elevated temperatures [8]. In most cases, soot oxidation is uncompleted leading to incompletely oxidized and potentially harmful products. Oxidation is an important step in the atmospheric aging of soot, leading to the modification and fragmentation of soot nanoparticles [8,9]. The characterization and study of soot oxidation is crucial for understanding the environmental impact of soot, as well as its impact on climate and human health
Various diagnostic techniques, such as Raman scattering, ultra-violet absorption spectroscopy, Fourier-Transform Infrared (FTIR), X-ray diffraction, and transmission electron microscopy (TEM), have been widely used to study the structure of carbon nanomaterials including soot [1,5,10,11,12,13,14]. However, the results using some of these techniques may be affected by soot oxidation processes, leading to changes in soot properties [9,15]. The measurements are typically performed under atmospheric conditions in the presence of oxygen, as well as in the potential presence of water or OH radicals, which can cause the oxidation process. Specifically, too-high laser irradiation may heat the samples thereby accelerating the oxidation process [15,16,17]. Hence, in studies of soot oxidation during thermal treatment, unintended changes in soot structure due to laser radiation should be minimized.
Soot freshly emitted into the atmosphere shows a variety of characteristics depending on the combustion process and the emitting source. Often the so-called “brown soot” is characterized by amorphous carbon with less-efficient absorption and stronger wavelength dependence, whereas black soot contains a higher fraction of graphitic layers and has a higher absorption efficiency [11,18,19]. Soot with different properties on the scale from brown to black soot can be produced with a mini-CAST soot generator (Combustion Aerosol Standard, CAST, Jing Ltd.), which has been widely used in the aerosol community since 2006. The central unit of this instrument is a co-flow propane/air diffusion flame, which can produce various types of soot with specific sizes, concentrations, and organic compound fractions by operating at different conditions. Many studies have shown that mini-CAST soot has characteristics similar to real-world soot particles from vehicular emissions [20,21]. Under well-controlled conditions, the stable production of different soot types can be achieved [10,20,22].
In this study, we conducted a comprehensive examination of the oxidation of black soot and brown soot using ex situ Raman spectroscopy. We analyzed the structural transformations of the soot as a result of oxidation in air when exposed to successive heating from room temperature to elevated temperatures up to 700 °C, where it should be noted that the samples were completely oxidized at 800 °C. The Raman setup was configured in backscattering geometry and utilized an excitation wavelength of 532 nm. We also analyzed variations in the photoluminescence (PL) background and decomposed the Raman spectra into different spectral components for further analysis to gain insight into the structural modifications caused by oxidation processes.

2. Experiment

2.1. Sample Preparation

The mini-CAST 5201C soot generator is an apparatus that utilizes a co-flow propane/air diffusion flame to produce soot nanoparticles. Inside the generator, the soot is extracted from the diffusion flame and rapidly cooled to room temperature by a quenching nitrogen flow positioned at a fixed height. By adjusting the operation conditions, a range of soot types can be produced with varying structural, optical, chemical properties and morphologies. The produced soot is deposited on sapphire substrates positioned in the particle-laden flow from the soot generator for further ex situ Raman analysis.
In our investigation, we used two standard sets of flow and flame conditions, representing two types of soot—OP1 soot (black soot) with more graphitic structure, low fraction of organic compounds, and OP6 soot (brown soot) with less graphitic structure, high fraction of organic compounds [23]. Their high-resolution transmission electron microscope (HRTEM) images are shown in the Supplemental Material. OP6 soot has shorter fringe lengths, more amorphous nanostructures, and a higher organic carbon (OC) fraction, including PAH content and oxygen functional groups [11,23]. Their chemical, optical properties and morphology obtained from our previous studies are summarized in Table 1.
The soot samples collected on sapphire windows were placed in a Linkam heating stage 1200, where a low flow rate of air or nitrogen passed over the samples at a rate of 50 mL/min. This low flow prevented the deposition of vaporization products from the soot on the optical cell window, which could interfere with the Raman measurements of soot.

2.2. Experimental Setup

A home-built Raman setup that was developed in our previous studies was also utilized in this study [11,25]. Briefly, the sample was excited through a window inside the Linkam heating stage using a continuous-wave laser at a wavelength of 532 nm with a power density on the samples of around 6 × 10³ mW/mm2. The backscattering photons were optically filtered using notch and edge filters (NF533-17 and FEL0550, Thorlabs GmbH), and focused on a round-to-linear optical fiber bundle consisting of seven fibers (BFL200HS02, Thorlabs GmbH). The output of the fiber was a line of individual fibers directed to the entrance slit of an IsoPlane SCT320 spectrograph. Inside the spectrograph, the beam was diffracted using a grating with 600 grooves/mm. The spectrum was detected using a back-illuminated charge-coupled device (CCD) camera (Andor technologies, Newton DU94ON-BV). The Raman setup had a spectral resolution of 12 cm−1 in the spectral reason of interest. Each spectrum is an average of 10 spectra, each with 50 s of exposure time for OP1 and 10 s of exposure time for OP6 soot. For more details about the experimental setup, see our previous works [11,25].
The soot samples were exposed to either laser radiation or heat treated in air at atmospheric pressure. Each sample was placed in the ceramic cup of the Linkam heating stage, where the air was flowing at a rate of 50 mL/min. At a heating rate of 50 °C/min, the sample was heated to a higher temperature and kept at this new temperature for 1 min before cooling down to room temperature for the subsequent Raman measurements. The procedure was repeated until all of the soot particles were oxidized. Note that all of the spectra were acquired at room temperature. Using this approach, the structural changes of the sample during the measurements as well as the spectral interference from the thermal radiation of the Linkam ceramic cup at high temperature could be avoided. The measurements were repeated four times to ensure the repeatability of the study. It was observed that the evolution of the spectra was consistent across repetitions, with the spectral intensity varying by less than 10% in each measurement due to differences in the samples’ thickness.
For otherwise identical measurement conditions, the air flow was replaced by nitrogen flow. Hence, comparing Raman spectra from these two cases improved our understanding about the oxidation process [11].

3. Results and Discussion

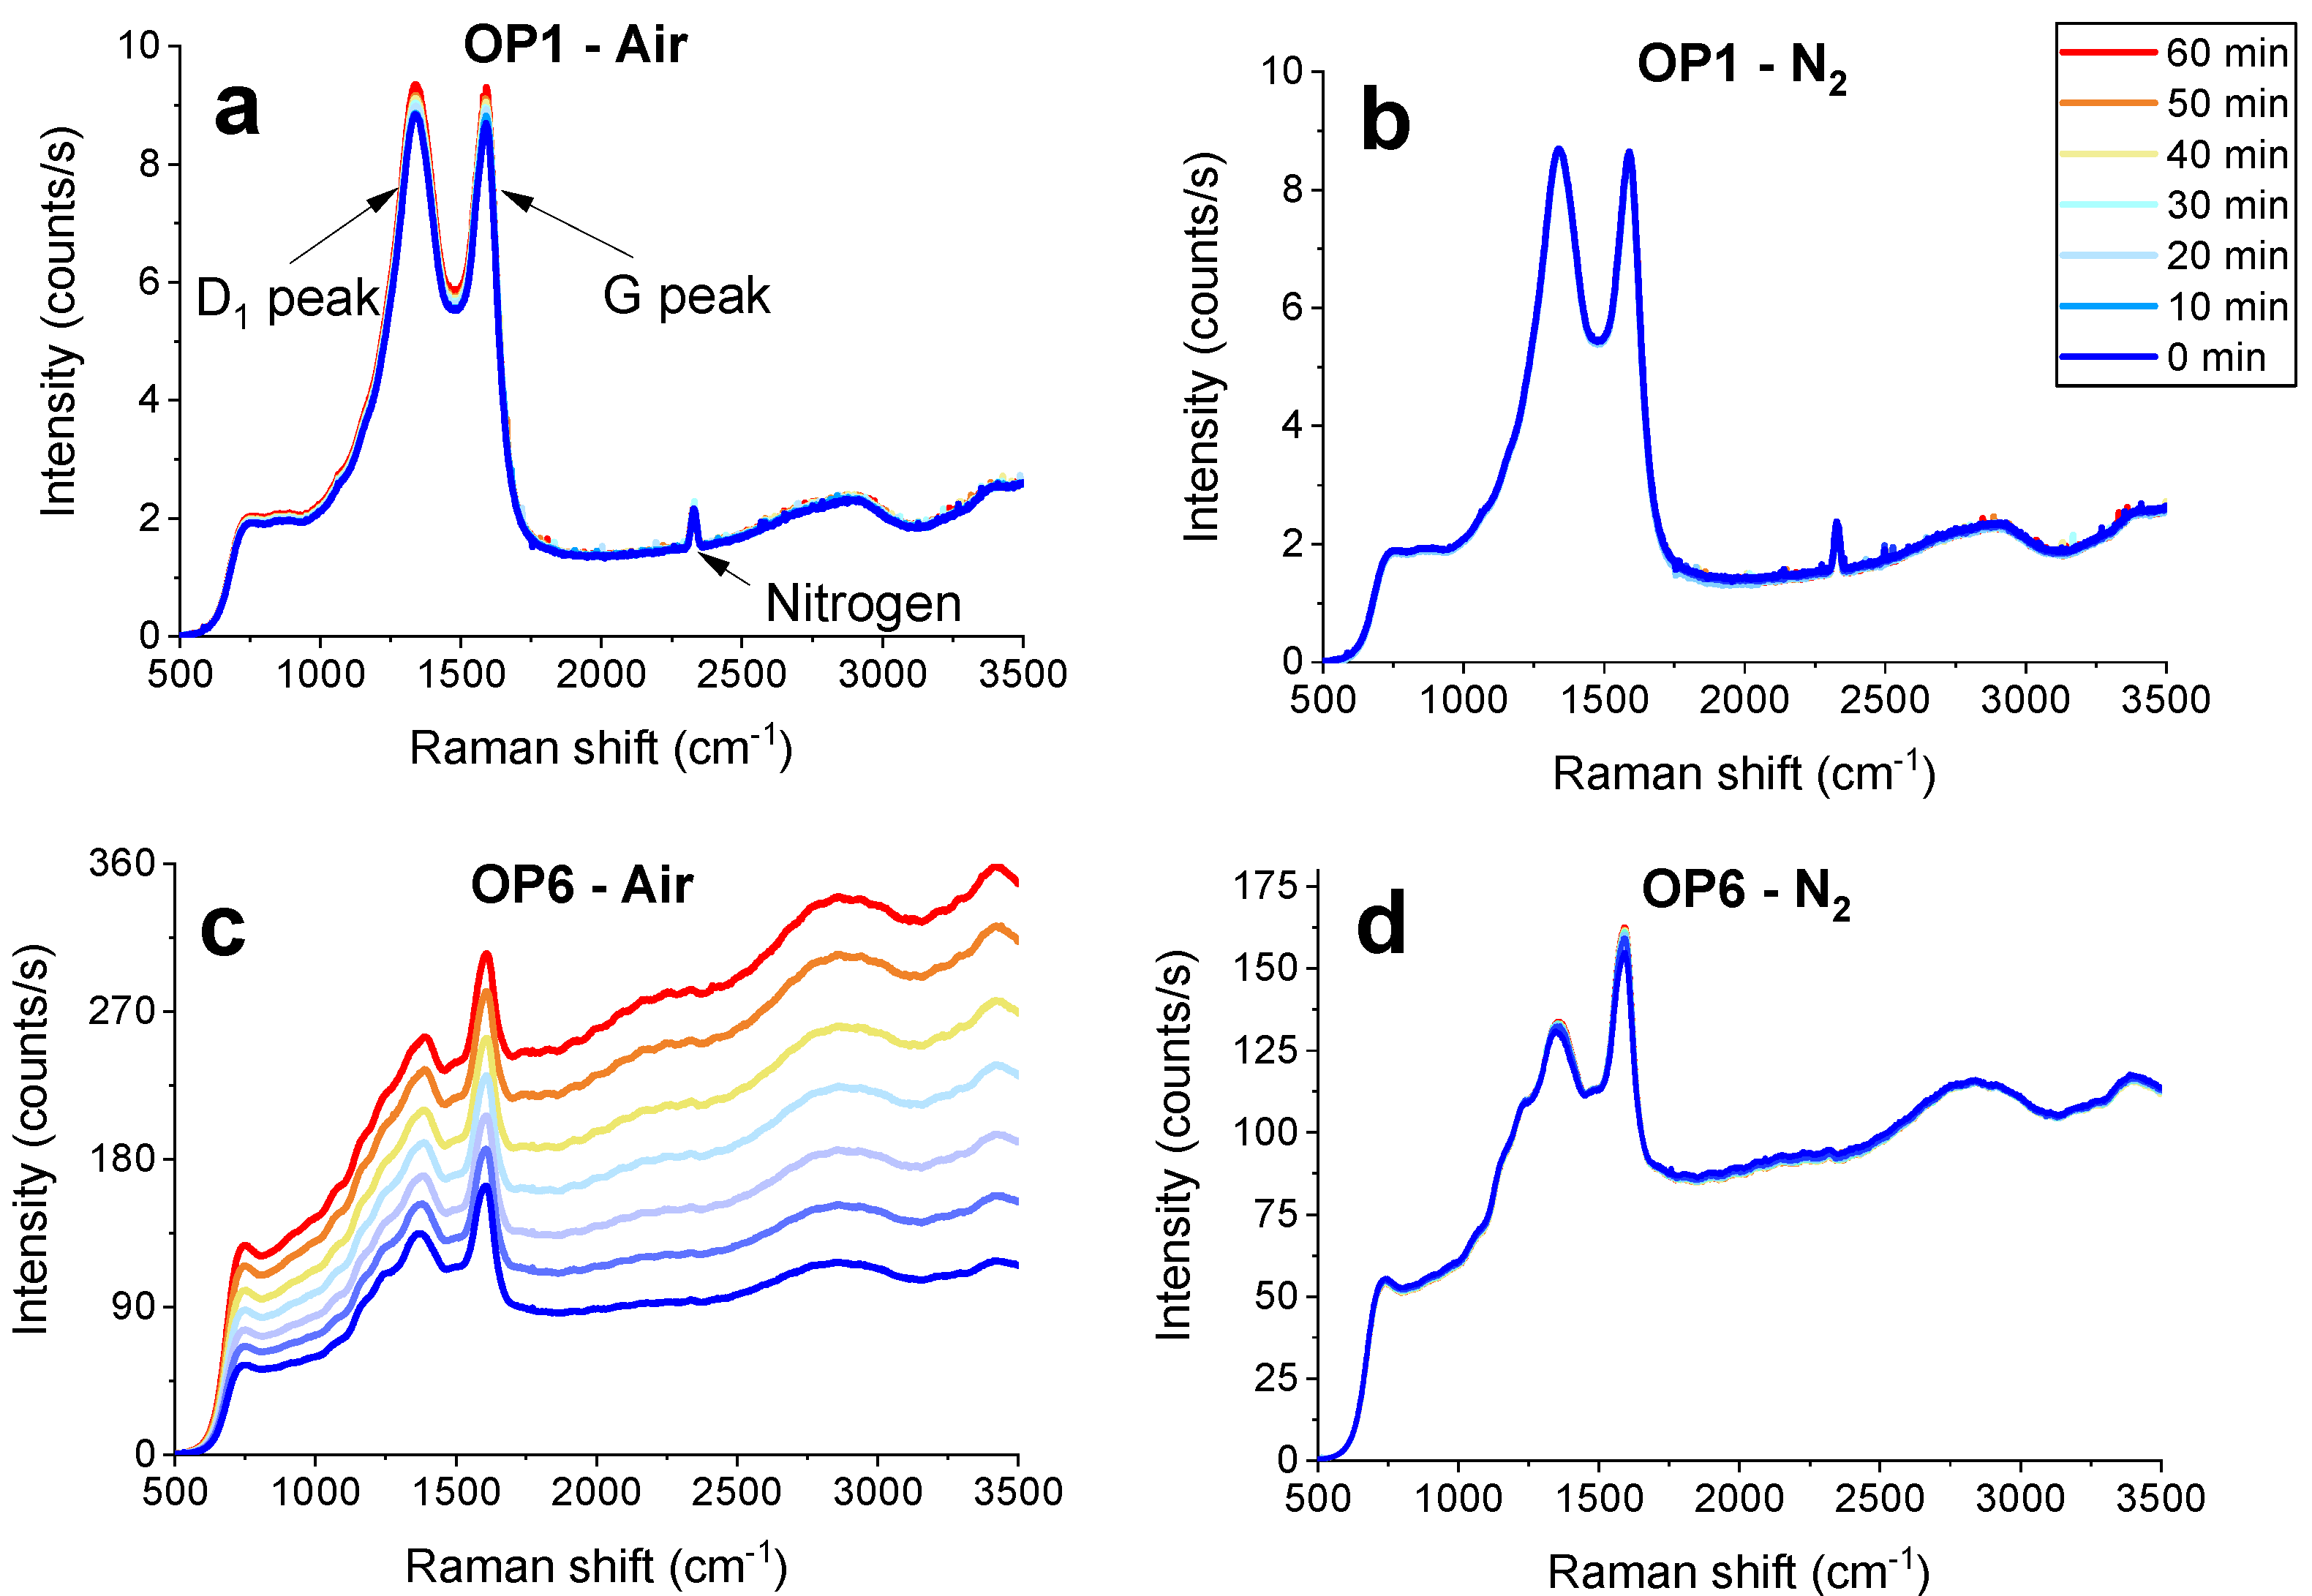
3.1. Exposure to Laser Radiation
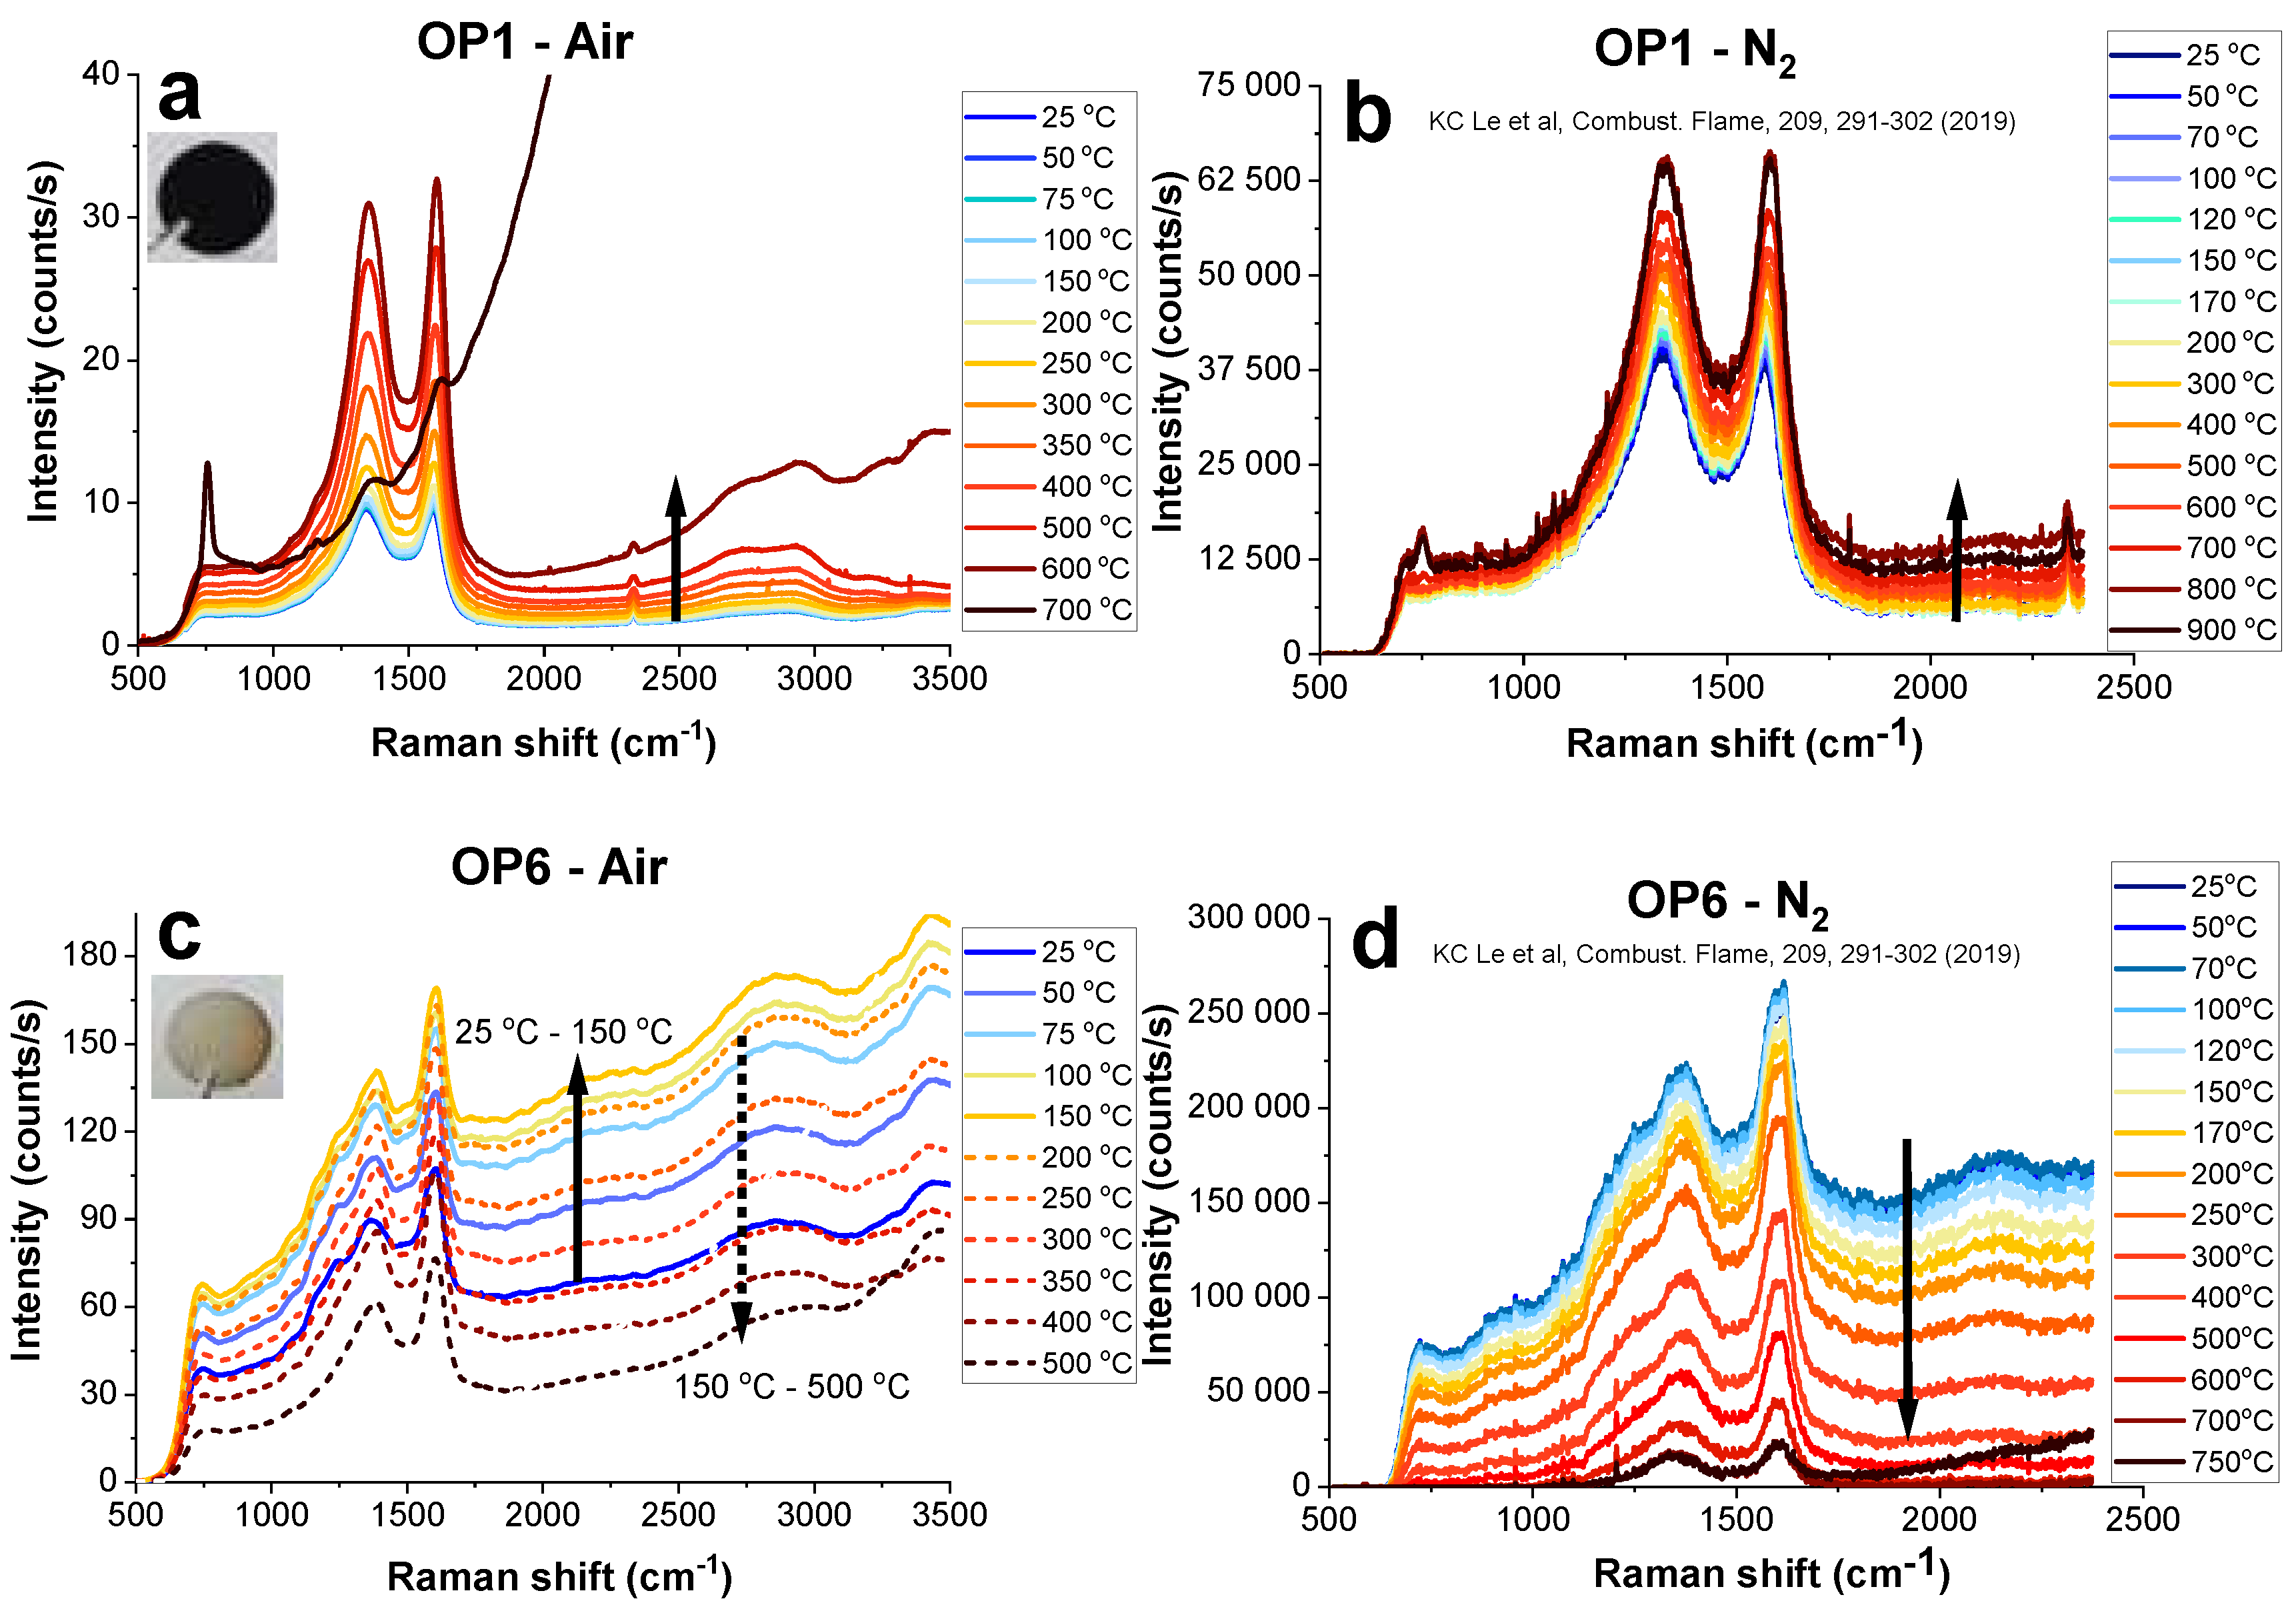
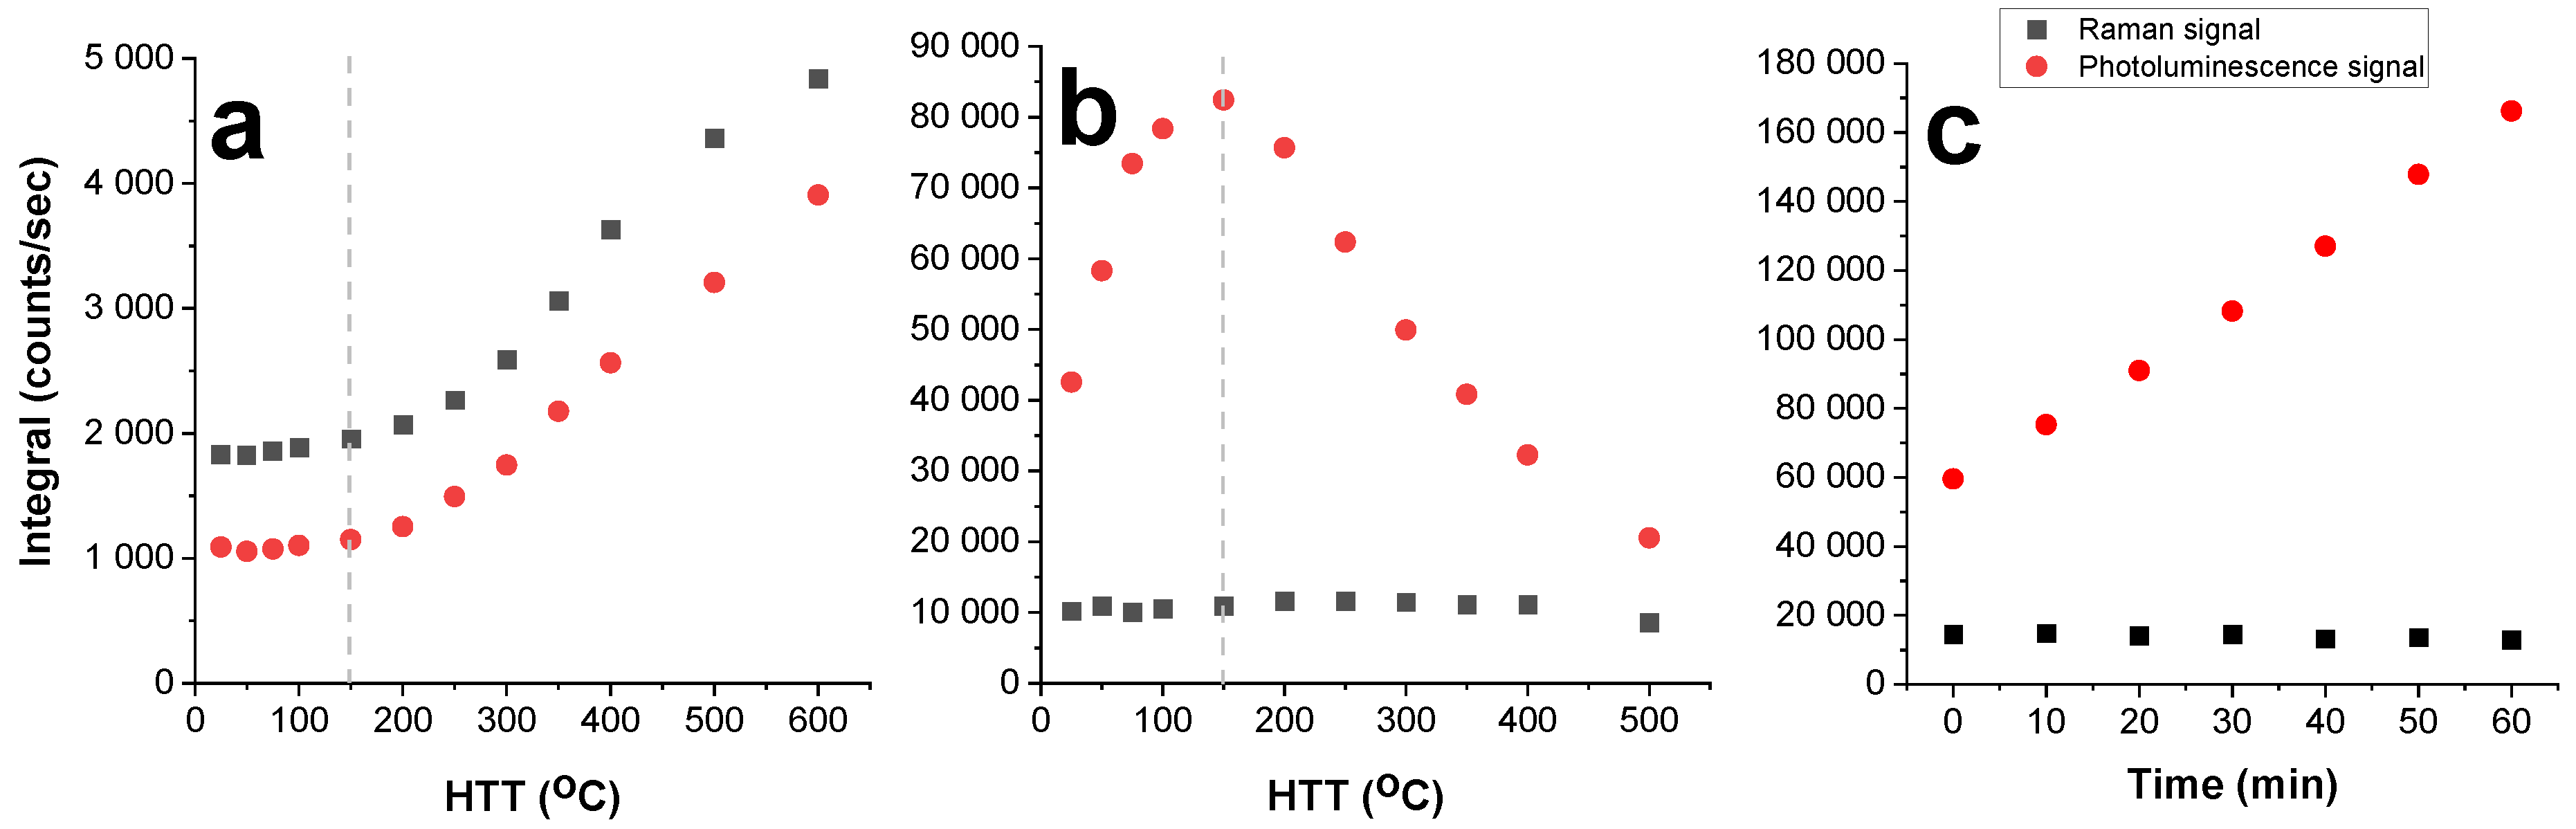
Initially, an experiment was performed to study the potential soot oxidation during ex situ Raman measurements. Figure 1 shows the Raman spectra of the OP1 and OP6 soot when the samples were exposed to the same laser radiation (in terms of the wavelength and power) with different exposure time in nitrogen and in air. In particular, after acquiring a Raman spectrum of the fresh soot, marked as unexposed to the laser (0 min), the sample was illuminated by the laser beam for 10 min before the next spectral acquirement. This process was repeated with a step of 10 min exposure time until the exposure time to the laser was 60 min, excluding the acquisition time. As can be seen in Figure 1, the Raman signals of soot were superimposed on a photoluminescence (PL) background. The spectral region covered the first order (800–2000 cm−1) and the second order (2000–3500 cm−1) Raman bands of the soot. Two typical peaks for carbonaceous material, D1 and G, were easily recognized in the first-order spectral region, while individual peaks in the second Raman band were barely discernable. The Raman signal of N2 from the air can also be observed at ~2331 cm−1.
When the samples were exposed to the laser radiation in either air or nitrogen, their spectra behaved differently. Particularly, the Raman signals of OP1 and OP6 soot in nitrogen were rather stable during laser exposure (Figure 1b,d). This also applied to the OP1 soot exposed to air (Figure 1a). However, for OP6 soot in air the PL background significantly grows as a function of exposure time (Figure 1c). The most plausible explanation for the observed PL increase was the oxidation of soot by molecular oxygen giving rise to fluorescing species.

3.2. Heat Treatment

Samples of OP1 and OP6 soot were heat treated according to the procedure outlined in Section 2.1. Figure 2a,c show the spectral evolution of OP1 and OP6 soot during heating in air and these spectra were compared with the spectral evolution of the same soot samples from a previous study [11], in which the samples were heated in nitrogen, see Figure 2b,d). It is important to note that the number of counts per second in the two studies were different due to the different detectors used. Specifically, an ICCD camera (PI-MAX IV, Princeton Inc.) was used in the previous work, while a CCD (Andor technologies, Newton DU94ON-BV) was used in this work. The first observation was that the samples disappeared from the substrate at a lower temperature in the air than in the nitrogen. Specifically, in this study the signals from the OP1 soot in air disappeared at a temperature at 800 °C and the OP6 soot at 600 °C.
As seen in Figure 2a,b, with the increase temperature, the Raman signals of OP1 soot increased in both air and nitrogen environments. In both cases, the spectral change was minimal for heating, up to ~150 °C, after which increasing the temperatures led to continuously stronger Raman signals for both cases, although the signal increase in the air atmosphere was more pronounced.
An interesting observation was made for the OP6 soot in Figure 2c, where the PL signal rapidly increased from 25 °C to 150 °C, and then showed a decline from 150 °C to 600 °C. This behavior was different from the signal evolution in the nitrogen atmosphere, as shown in Figure 2d, where the PL signal was relatively constant up to 120 °C, after which the PL background decreased for the increasing temperatures.
Another noteworthy observation is that the spectra for the highest temperatures in Figure 2a showed a strong signal increase at higher Raman shifts. The reason for this interfering signal is that the soot layer had become very thin and the signal contribution from the sapphire substrate started to interfere. This effect is further discussed in the next Section 3.3.
The heat treatment at elevated temperatures caused a change in the color of soot towards being more blackish due to the vaporization of volatile organic compounds (VOCs) and semi-volatile organic compounds (SVOCs), as well as changes in the carbon nanostructure. This means that heat treatment enhanced the soot absorption efficiency, which was consistent with previous work [19], where soot was pre-heated by laser pulses. That study showed that extensive absorption enhancement occurred for all types of soot as the soot was thermally annealed, which was manifested through decreasing the dispersion coefficient ξ and increasing the absorption function E(m) [19].

3.3. Photoluminescence (PL) Background Subtraction

In the spectral region of interest, the Raman peaks were observed on top of the photoluminescence (PL) from the samples. To better understand the origin of the PL, an attempt was made to isolate this signal contribution. To do this, an OP6 soot sample was heat treated at 500 °C in nitrogen for 1 min without any gas flow through the cell. At this temperature, the VOCs/SVOCs were demonstrated to evaporate [7,13] and deposit in the ceiling window of the Linkam heating stage, as shown in the inset of Figure 3a. Figure 3 compares the Raman spectra of non-heat-treated OP6 soot, the deposited VOCs/SVOCs, and heat-treated OP6 soot. As the PL background in the non-heat-treated soot spectrum agreed well with the PL from the deposited VOCs/SVOCs, this demonstrates that the PL originated mainly from VOCs/SVOCs. It should be noted that there was an additional PL signal contribution at higher Raman shifts for the spectrum of deposited VOCs/SVOCs, which was due to spectral contributions from the sapphire substrate. Figure 3b shows the PL spectrum from the clean sapphire window.
Another interesting observation in the VOCs/SVOCs spectrum in Figure 3 and Figure S2 in the Supplemental Material, is a small modulation. This interference between the incident light and the scattered light, which occurred for OP6 samples, made the background subtraction more challenging. Based on previous observations [26], a possible explanation is that the incident light penetrated through the OP6 samples and interfered with the scattered light, creating standing wave patterns on the sample. This can be seen as a sinusoidal function in the spectra in Figure 3a. This interference was not observed for OP1 soot, potentially due to its strong absorption properties at the excitation wavelength.
The Raman signal was obtained after subtraction of the PL signal, which often has an unknown shape. The PL signal was often assumed to be a linear line or a second polynomial function, which introduced some uncertainty to the Raman spectral shape. The uncertainties were larger in the case of brown soot (OP6), where the PL signal, substrate signal, and interference contributed together. In this work, the VOCs/SVOCs spectrum was rescaled to a similar strength of each soot spectrum background before being subtracted from the raw data. Using this method, we minimized the uncertainty of background subtraction on the Raman spectra of brown soot (OP6). More information is provided in Note 1 and Figure S3 in the supplemental material where we compare Raman signal of OP6 soot after subtracting the PL using three different line shapes including a straight line, a second polynomial function and the VOC/SVOC spectrum. As the contribution of PL was very low in the OP1 soot spectra and its baseline was quite flat, a line was applied for the background subtraction of OP1 soot.

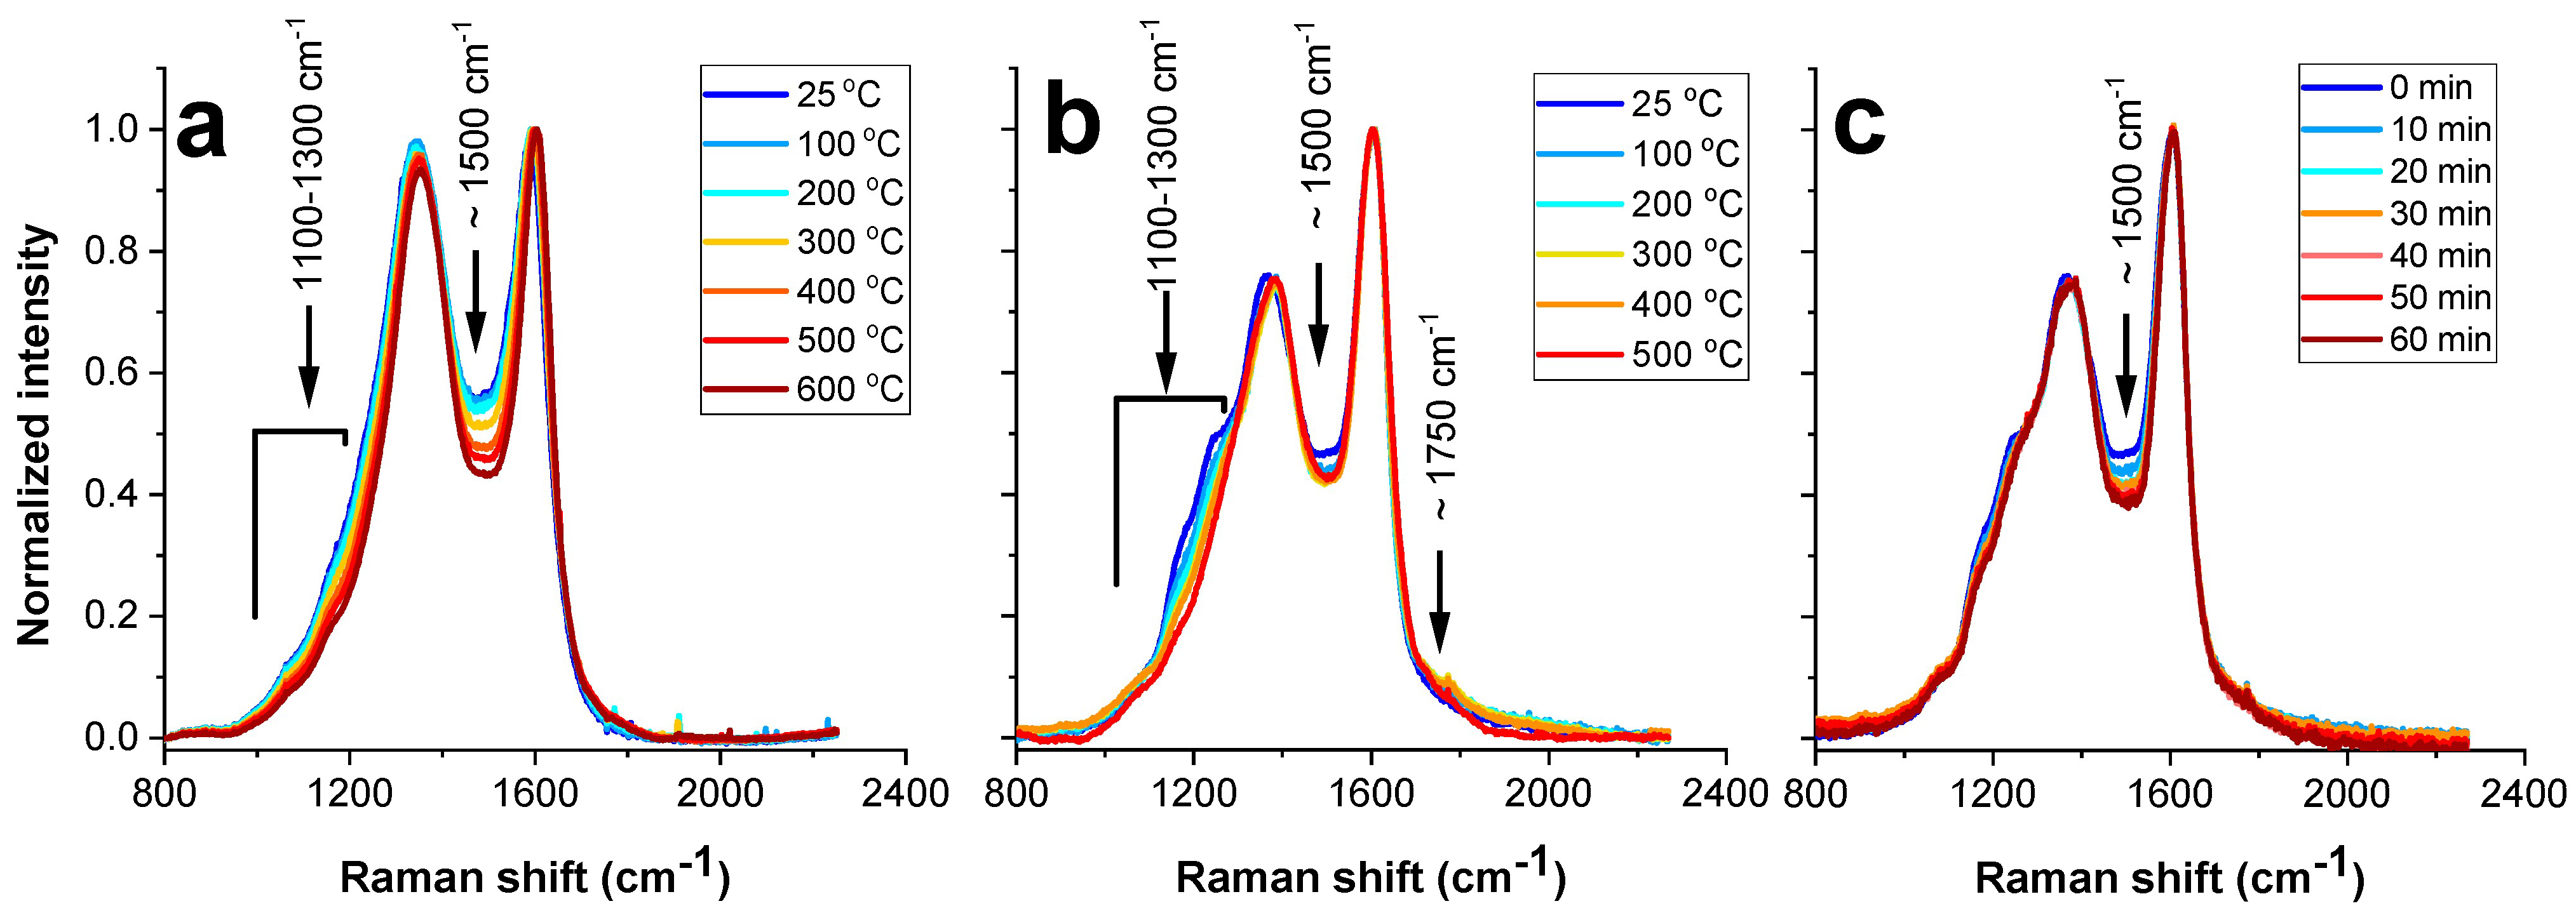
3.4. Evaluation of Raman Signal

3.4.1. General Analysis

After subtracting the background, as described in the previous section, Figure 4 illustrates the Raman spectra for OP1 soot (Figure 4a) and OP6 soot (Figure 4b) following heating in air. Additionally, it included spectra for OP6 soot exposed to laser irradiation in air for various exposure times (Figure 4c). The integrals of Raman and PL signals, which were also their total number of counts in the spectral region from 800 cm−1 to 2250 cm−1, are shown in Figure 5.
While the Raman and PL signals of black soot (OP1) followed a similar trend (Figure 5a), those of brown soot (OP6) were very different (Figure 5b). Particularly, in Figure 5a, the Raman and PL signals of OP1 soot remained unchanged when the heat-treated temperature (HTT) was below 150 °C. Above 150 °C, when HTT increased, the Raman signal increased strongly. As shown in Figure 5b, the PL signal of OP6 soot grew fast with the temperature, and reached the maximum at HTT of 150 °C before declining rapidly, while its Raman signal was rather constant. The growth of OP6 signals with irradiation time in Figure 5c was similar to the trend of soot oxidation in Figure 5b at a lower temperature (<100 °C).
To compare the spectral variation, the Raman spectra in Figure 4 were normalized to the G peak intensity and replotted in Figure 6. Apparently, the spectral regions at 1100–1300 cm−1, at ~1500 cm−1, and at ~1750 cm−1, remarked by the arrows were most affected by the oxidation. Figure S4 in the Supplementary shows how OP1 soot structure changes during the oxidation process. Spectral decomposition was performed to analyze the development of all of the functional groups. In this study, we used the same fitting procedure as shown in Table 2 and Figure 3 in our previous study [11], where each spectrum was fitted by a combination of three Lorentzian peaks (D4 at ~1180 cm−1, D’1 at ~1270 cm−1, D1 at ~1350 cm−1), one Breit−Wigner−Fano (BWF) (G at ~1600 cm−1), and six Gaussian peaks (C-H out-of-plane at ~900 cm−1, D3 at ~1500 cm−1, oxygenated groups at 1060 and 1750 cm−1 and sp bonds at ~1800–2200 cm−1). A detailed analysis of the decomposition process can be found in Section 4.1 and the Supplementary Information of our previous papers [11,25]. The adjusted R-square statistic indicating the quality of spectral decomposition was slightly close to one in the current study. Figure 7a illustrates the decomposed Raman spectrum of an OP6 soot sample that has been heat treated at 300 °C. The spectrum contained two common peaks associated with disordered carbonaceous materials, D1 (~1350 cm−1) and G (~1600 cm−1), which indicated the vibrational mode of aromatic rings in defective graphitic materials and the stretching mode of carbon−carbon double bonds in either aromatic rings or olefinic chains, respectively [27]. The complex structure of soot, especially soot with a high fraction of organic compounds, exhibited many additional peaks including various hybridizations (sp, sp2, and sp3) and oxygenated functional groups (ether, carbonyl) [11]. Despite the weakness, the Raman signal strengths of sp bonds and oxygenated groups can still be observed in the OP6 soot spectra. The oxygenated group in mini-CAST soot was also observed via X-ray photoelectron spectroscopy and near edge X-ray absorption fine structure techniques [28]. Although in that study, the authors used another type of mini-CAST soot generator, particularly mini-CAST 5206, several studies have shown that soot from various mini-CAST generators can have similar properties. [18,22,29].

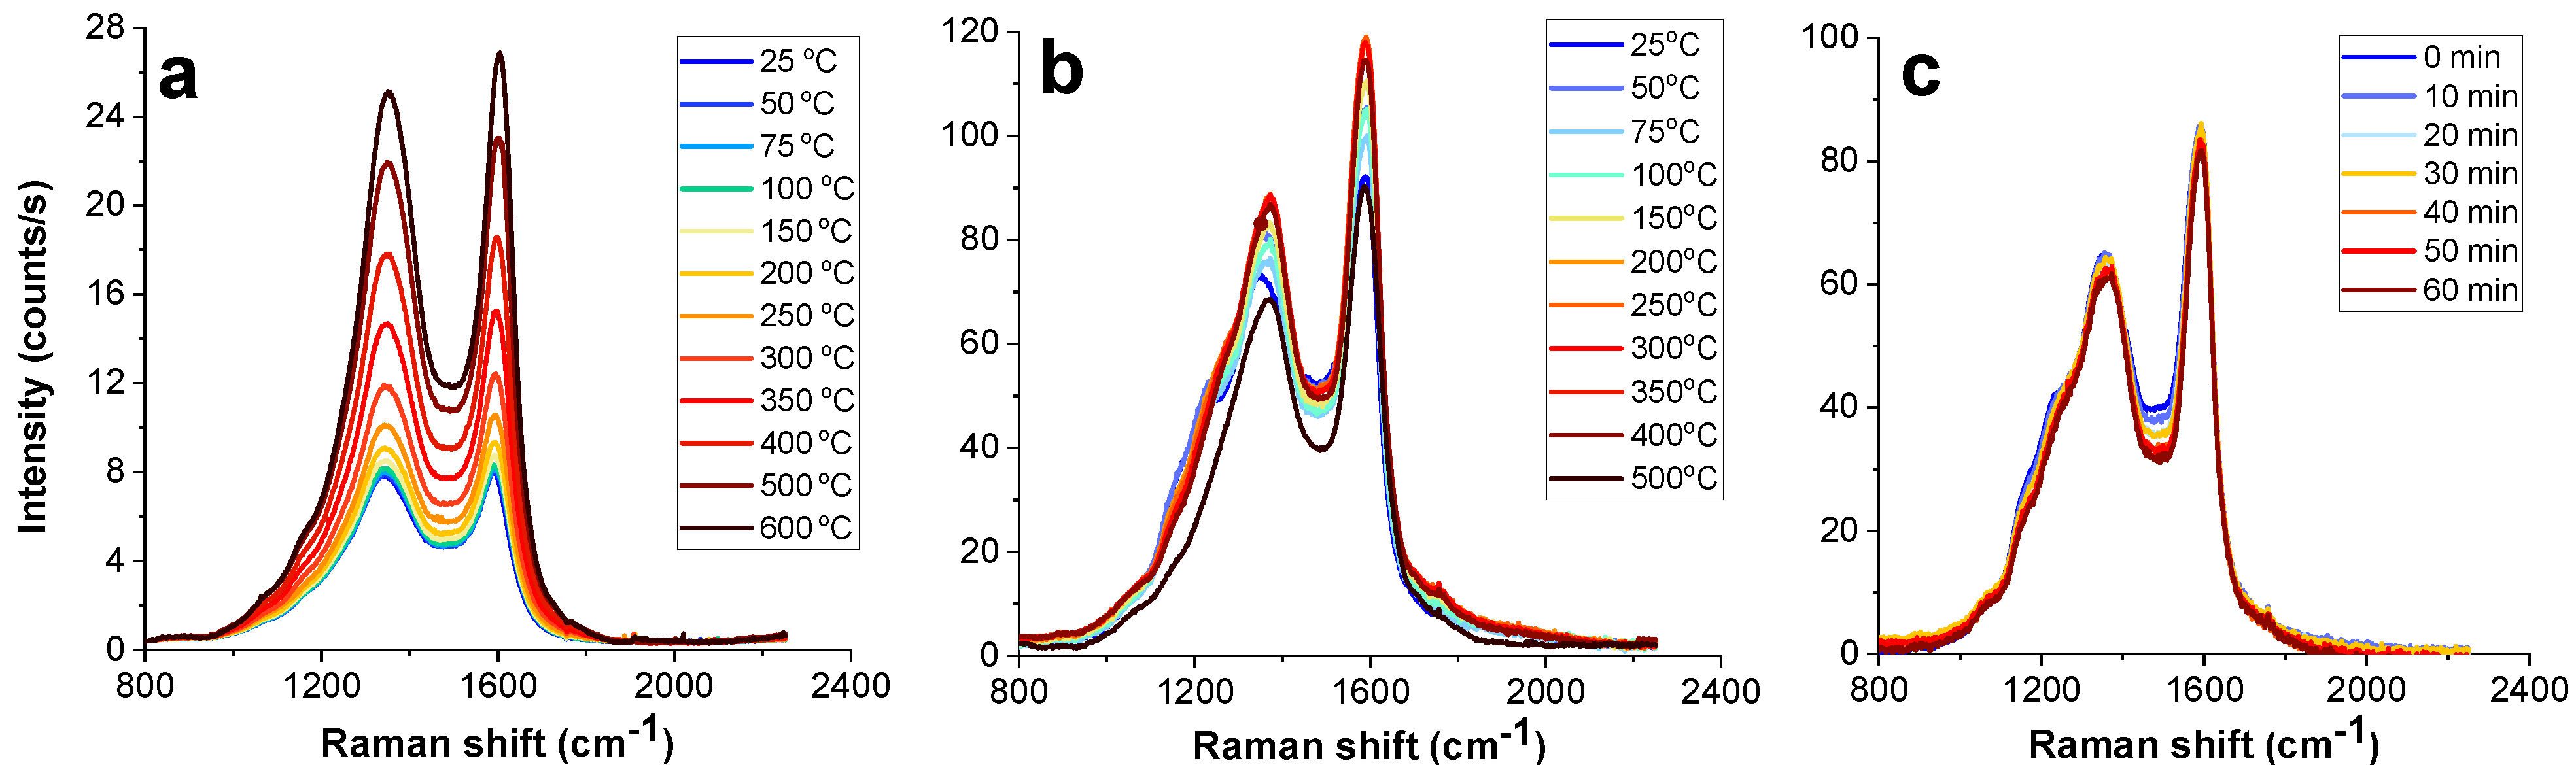
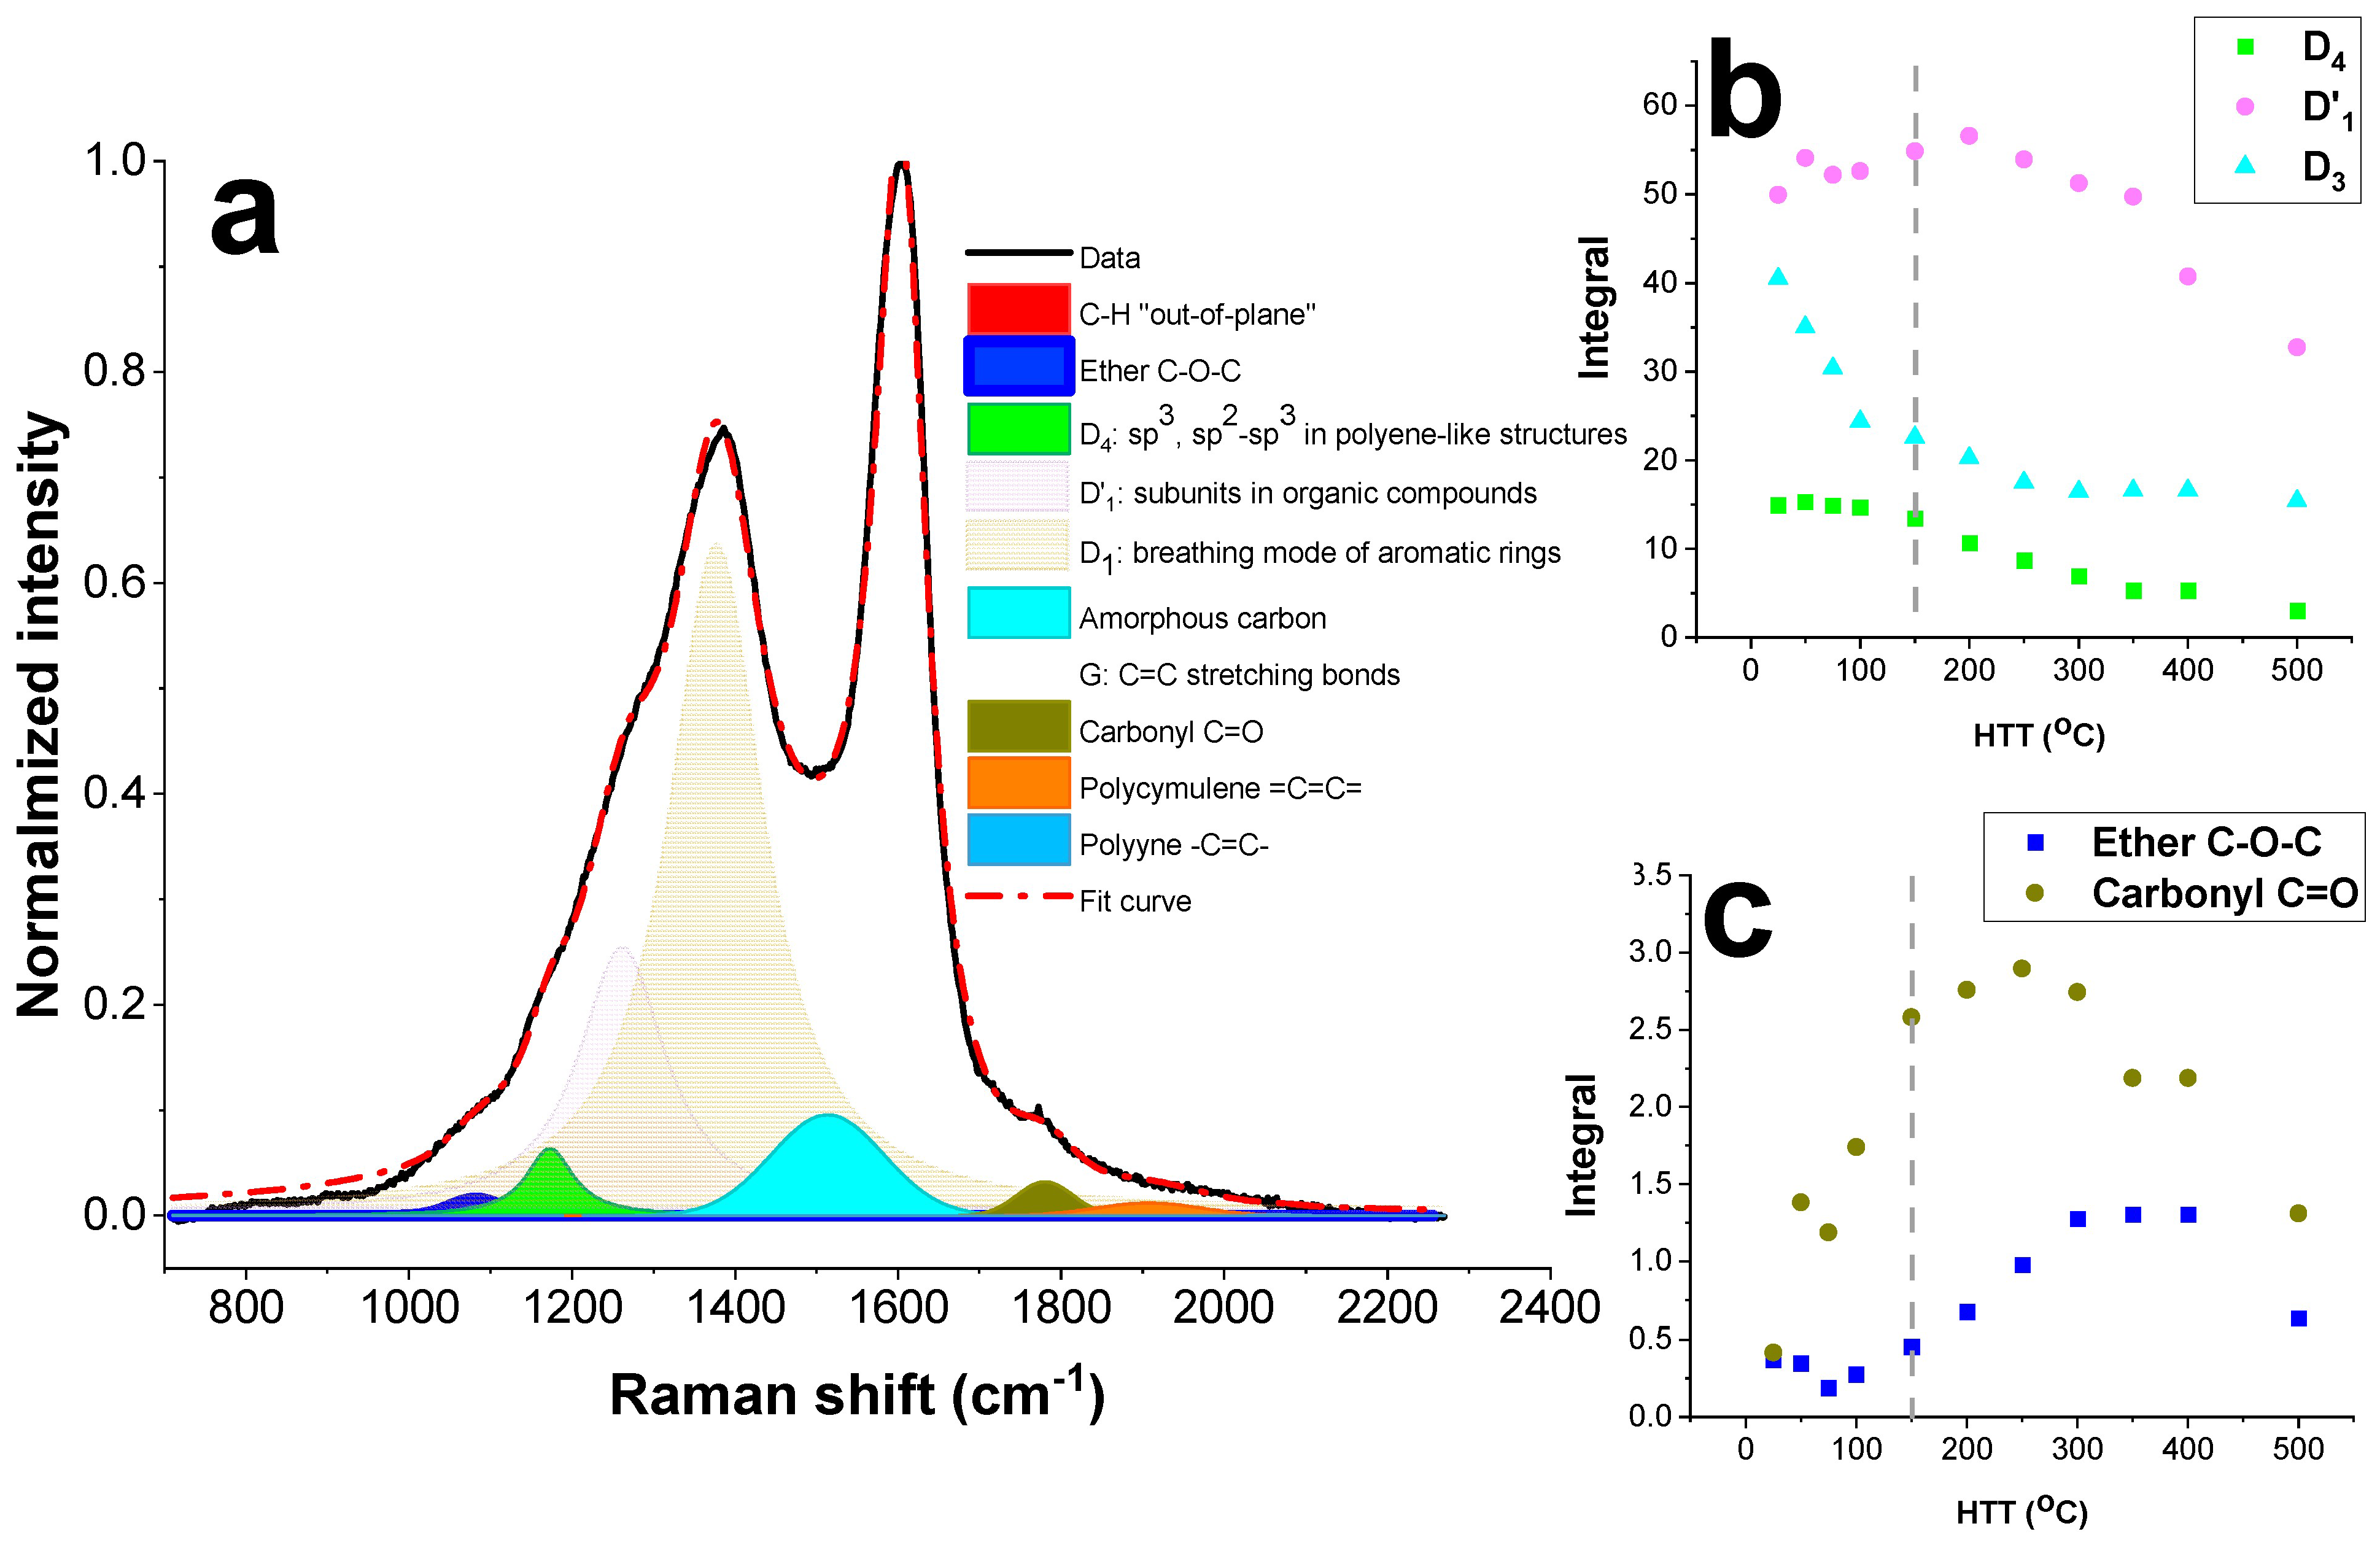
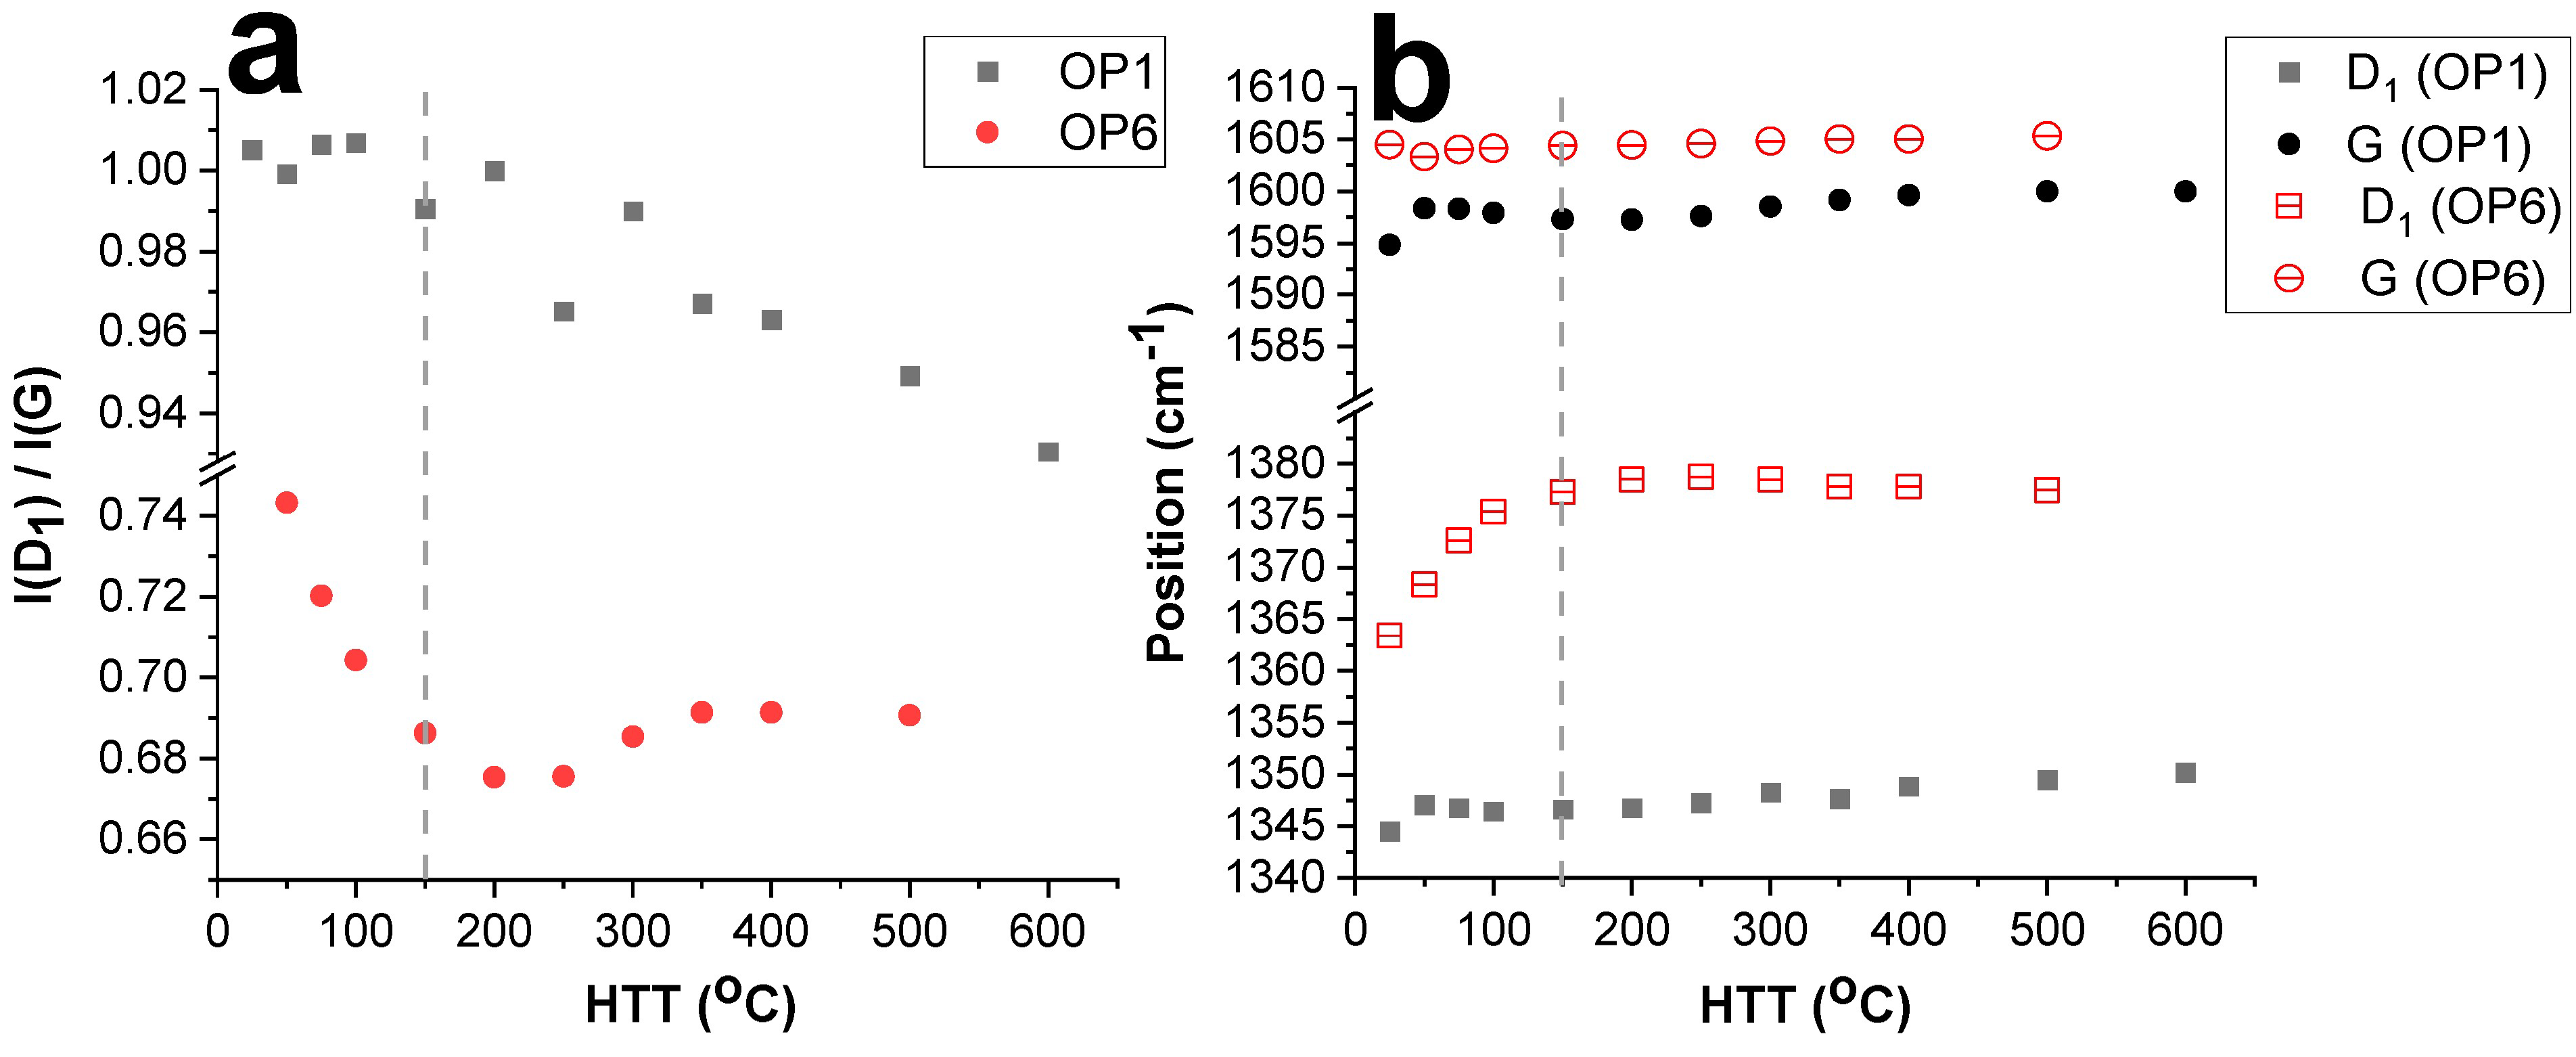
3.4.2. Detailed Spectral Analysis

Heat Treatment below 150 °C

Our results demonstrate that the Raman and PL signals of OP1 soot remained stable below 150 °C, exhibiting a consistent trend. In contrast, the signals of OP6 soot underwent changes that opposed each other (see Figure 5a,b). The PL signal of OP6 rose rapidly and reached the maximum value at a temperature of 150 °C before dropping continuously at higher temperatures. In Figure 7b, the D3 peak intensity at 1500 cm−1, indicating an amorphous content in the OP6 soot, dropped while the sub-bands in polyaromatic subunits and the sp3 content of the organic compounds assigned by the D 1 peak at 1270 cm−1 and D 4 peak at 1180 cm−1 [2,30,31] were steady in this temperature range. In contrast, the intensities of the ether group C-O-C (1060 cm−1) and the carbonyl C=O group (1750 cm−1) escalated with the temperature increase (Figure 7c).
The very different PL signal variation of the OP6 soot heated in nitrogen [11] and that heated in air in this work could be explained by soot oxidation. The semivolatile nature and mass range of PAHs allowed for solid−vapor equilibria, which permitted smaller PAH to exist in vapor form and larger PAH to adsorb onto or comprise solid particulate matter [32]. The small oxidized PAHs in the aerosol phase was transported away from the measurement volume by the air flow, so the signal from the evaporated species in the aerosol could be neglected. The appearance of the oxidized large PAHs adsorbing on the sample surface or loosely connecting to the graphitic structure by van der Waals force probably led to the rise in PL signal. The oxidation of PAHs was expected to result in oxygenated groups such as carbonyls and ethers [32]. Indeed, in this study, the Raman signals of these oxygenated groups (shown in Figure 7c) increased when HTT increased up to around 300 °C.
Another mechanism that could possibly explain the PL signal growth is the defect density. The number of defects in our soot samples, which was reflected by the intensity ratio between D1 and G peaks, increased. Indeed, for carbon materials with a small graphitic domain size ( 2 nm) such as soot, the D1 mode strength I(D1) is proportional to the cluster/graphitic area [27,33]. While heating below 200 °C, the I(D1) of the OP6 soot decreased with respect to its I(G), as shown in Figure 8a. Additionally, its D1 peak also shifted upwards, as shown in Figure 8b, for increasing temperatures below 200 °C. These two features indicate that the aromatic clusters or the graphitic domain size becomes smaller while being heated in the air at the low temperature [27]. In other words, the number of defects, consisting of bond-angle disorder, bond-length disorder and hybridization, increased during the soot oxidation.

Heat Treatment above 150 °C

When heating the soot samples above 150 °C towards higher temperatures, while the PL signal of black OP1 soot increased, that of the brown OP6 soot declined, as shown in Figure 5. At such high temperatures, most amorphous structures including VOCs/SVOCs were oxidized and evaporated leading to the reduction in PL signal in OP6 soot. The amorphous content and graphitic structure of the brown soot were quite stable at temperatures between 300 °C–500 °C, although the sp3 and intermediate sp2-sp3 states, as well as polyaromatic subunits assigned by D4 and D1′ peaks, respectively [2,30,34,35], fell off versus HTT, as plotted in Figure 7b. The signals from both ether and carbonyl species were slightly raised before clearly reducing for increasing the temperatures above 300 °C.
The OP1 and OP6 soot samples became increasingly more and more blackish while heated at higher temperatures. Indeed, while soot absorbed strongly in a large spectral range in UV, and steeply decreased towards the visible, the soot precursors including PAH in VOC/SVOC were found to be almost transparent to the visible light [36,37]. After heat treatment, their absorption efficiency in the visible was enhanced [19] resulting in a larger Raman cross section of the resonant Raman effect at the wavelength excitation of 532 nm. This can explain the increase in their integral Raman signal presented in Figure 5. Furthermore, the smaller graphitic domains of OP6 soot makes it less thermally stable than OP1 soot [11], so OP6 soot disappears earlier during heating, at 600 °C.

3.4.3. Discussion

When comparing our results with other studies on soot oxidation during heat treatment using Raman spectroscopy [10,12], two significant findings become apparent. Initially, it is observed that the Raman signal intensity of mature/black soot is comparatively lower than that of less-mature/brown soot particles (see Figure 4 in our study and the discussion on page 6 of De Falco’s study). Additionally, upon subjecting them to heat treatment, there is a notable increase in absorbance within the excitation wavelength region of 532 nm. This phenomenon can be attributed to resonance effects, leading to a substantial enhancement in the Raman signal of the soot samples (see Figure 4 in this paper and Raman signals obtained from Figure 5a,b in Ess’ paper).
Graphitization did not occur in our samples during the heat treatment, as evidenced by the decrease in the I(D1)/I(G) ratio. The PL signal in immature/brown soot notably diminishes as the soot is heat-treated to higher temperatures in [10,12]. This agrees well with our result when the heat treatment is above 150 °C. However, our findings reveal a contrary trend in the PL of brown soot when heated below 150 °C.

4. Conclusions

In this study, the structural changes of brown and black soot were investigated during oxidation in air at various temperatures up to 700 °C using ex situ Raman spectroscopy. A novel approach for PL subtraction, based on the signal from the evaporated species, was employed to minimize the uncertainty from the substrate and thin layer interference.
An important result is that the exposure of soot to laser irradiation during ex situ Raman measurement in air may lead to soot structural modification due to oxidation. The brown soot with a higher fraction of organic compounds was strongly affected, while the black soot with a very low organic content was hardly influenced. The organic compounds and amorphous content were oxidized resulting in a higher PL signal and lower D3 peak intensity.
During the thermal oxidation treatment, oxidation, thermal fragmentation, and evaporation happened simultaneously. The black soot and the brown soot showed a different behavior. Generally, no graphitization was observed in this work as the graphitic domain size became smaller and the number of defects increaseed. The free-oxidized large PAHs formed during the brown soot oxidation at increasing temperatures up to 200 °C were believed to mainly contribute to the rise in PL signal, which then decreased due to the evaporation at higher temperatures. Interestingly, the oxygenated group formation including ether and carbonyl bonds due to oxidation at low temperatures has been addressed by Raman spectroscopy for the first time. This may explain the soot solubility and water uptake ability in the atmosphere.

Supplementary Materials

The following supporting information can be downloaded at https://www.mdpi.com/article/10.3390/c10020038/s1, Figure S1: High resolution transmission electron microscopy images of OP1 soot and OP6 soot; Figure S2: Fringes appear in spectrum of the clean sapphire substrate (a) and in those of OP6 soot exposed to laser radiation at different time length (b); Figure S3: Comparing Raman spectra of OP6 soot exposed to laser irradiation after subtracting background as a straight line (a), a 2nd polynomial curve (b), and the signal from organic compounds (c); Figure S4: The structural evolution of OP1 soot observed via high resolution transmission electron microscopy.

Author Contributions

Conceptualization and methodology, K.C.L.; investigation, K.C.L., J.H.; supervision, K.C.L.; writing—original draft preparation, K.C.L.; writing—review and editing, K.C.L., S.B. and P.-E.B. All authors have read and agreed to the published version of the manuscript.

Funding

This work is supported by the Swedish Research Council [Project 2021-04068], [Project 2019-03530], Åforsk Foundation [23-216], The Crafoord Foundation, and Kungl. Fysiografiska Sällskapet i Lund.

Data Availability Statement

Data will be made available upon request.

Acknowledgments

HRTEM images of OP1 and OP6 were taken by Vilhem Malmborg and Kristen Kling. We would like to acknowledge their contribution.

Conflicts of Interest

The authors declare no conflicts of interest.

References

  1. Gavilan, L.; Le, K.C.; Pino, T.; Alata, I.; Giuliani, A.; Dartois, E. Polyaromatic amorphous carbons as carriers of the UV bump: FUV to mid-infrared spectroscopy of laboratory analogs. Astron. Astrophys. 2017, 607, A73. [Google Scholar] [CrossRef]
  2. Saffaripour, M.; Tay, L.-L.; Thomson, K.A.; Smallwood, G.J.; Brem, B.T.; Durdina, L.; Johnson, M. Raman spectroscopy and TEM characterization of solid particulate matter emitted from soot generators and aircraft turbine engines. Aerosol Sci. Technol. 2017, 51, 518–531. [Google Scholar] [CrossRef]
  3. Zhang, J.; Morawska, L. Combustion sources of particles: 2. Emission factors and measurement methods. Chemosphere 2002, 49, 1059–1074. [Google Scholar] [CrossRef] [PubMed]
  4. Riemer, N.; Vogel, H.; Vogel, B. Soot aging time scales in polluted regions during day and night. Atmos. Chem. Phys. 2004, 4, 1885–1893. [Google Scholar] [CrossRef]
  5. Lambe, A.T.; Ahern, A.T.; Wright, J.P.; Croasdale, D.R.; Davidovits, P.; Onasch, T.B. Oxidative aging and cloud condensation nuclei activation of laboratory combustion soot. J. Aerosol Sci. 2015, 79, 31–39. [Google Scholar] [CrossRef]
  6. Friebel, F.; Lobo, P.; Neubauer, D.; Lohmann, U.; van Dusseldorp, S.D.; Mühlhofer, E.; Mensah, A.A. Impact of isolated atmospheric aging processes on the cloud condensation nuclei activation of soot particles. Atmos. Chem. Phys. 2019, 19, 15545–15567. [Google Scholar] [CrossRef]
  7. Faccinetto, A.; Irimiea, C.; Minutolo, P.; Commodo, M.; D’anna, A.; Nuns, N.; Carpentier, Y.; Pirim, C.; Desgroux, P.; Focsa, C.; et al. Evidence on the formation of dimers of polycyclic aromatic hydrocarbons in a laminar diffusion flame. Commun. Chem. 2020, 3, 112. [Google Scholar] [CrossRef] [PubMed]
  8. Michelsen, H.A.; Colket, M.B.; Bengtsson, P.-E.; D’anna, A.; Desgroux, P.; Haynes, B.S.; Miller, J.H.; Nathan, G.J.; Pitsch, H.; Wang, H. A review of terminology used to describe soot formation and evolution under combustion and pyrolytic conditions. ACS Nano 2020, 14, 12470–12490. [Google Scholar] [CrossRef]
  9. Toth, P.; Jacobsson, D.; Ek, M.; Wiinikka, H. Real-time, in situ, atomic scale observation of soot oxidation. Carbon N. Y. 2019, 145, 149–160. [Google Scholar] [CrossRef]
  10. Ess, M.N.; Ferry, D.; Kireeva, E.D.; Niessner, R.; Ouf, F.-X.; Ivleva, N.P. In situ Raman microspectroscopic analysis of soot samples with different organic carbon content: Structural changes during heating. Carbon 2016, 105, 572–585. [Google Scholar] [CrossRef]
  11. Le, K.C.; Pino, T.; Pham, V.T.; Henriksson, J.; Török, S.; Bengtsson, P.-E. Raman spectroscopy of mini-CAST soot with various fractions of organic compounds: Structural characterization during heating treatment from 25 °C to 1000 °C. Combust. Flame 2019, 209, 291–302. [Google Scholar] [CrossRef]
  12. De Falco, G.; Bocchicchio, S.; Commodo, M.; Minutolo, P.; D’anna, A. Raman Spectroscopy of Nascent Soot Oxidation: Structural Analysis During Heating. Front. Energy Res. 2022, 10, 878171. [Google Scholar] [CrossRef]
  13. Le, K.C.; Lefumeux, C.; Bengtsson, P.-E.; Pino, T. Direct observation of aliphatic structures in soot particles produced in low-pressure premixed ethylene flames via online Raman spectroscopy. Proc. Combust. Inst. 2019, 37, 869–876. [Google Scholar] [CrossRef]
  14. Le, K.C.; Lefumeux, C.; Pino, T. Watching soot inception via online Raman spectroscopy. Combust. Flame 2022, 236, 111817. [Google Scholar] [CrossRef]
  15. Vehring, R.; Schweiger, G. Dispersive Raman spectroscopy on soot particles. Aerosol Sci. 1998, 29, 1251–1252. [Google Scholar] [CrossRef]
  16. Zhang, L.; Li, H.; Yue, K.-T.; Zhang, S.-L.; Wu, X.; Zi, J.; Shi, Z.; Gu, Z. Effects of intense laser irradiation on Raman intensity features of carbon nanotubes. Phys. Rev. B Condens. Matter Mater. Phys. 2002, 65, 073401–0734014. [Google Scholar] [CrossRef]
  17. Olevik, D.; Soldatov, A.V.; Dossot, M.; Vigolo, B.; Humbert, B.; McRae, E. Stability of carbon nanotubes to laser irradiation probed by Raman spectroscopy. Phys. Status Solidi Basic Res. 2008, 245, 2212–2215. [Google Scholar] [CrossRef]
  18. Török, S.; Malmborg, V.B.; Simonsson, J.; Eriksson, A.; Martinsson, J.; Mannazhi, M.; Pagels, J.; Bengtsson, P.-E. Investigation of the absorption Ångström exponent and its relation to physicochemical properties for mini-CAST soot. Aerosol Sci. Technol. 2018, 52, 757–767. [Google Scholar] [CrossRef]
  19. Török, S.; Mannazhi, M.; Bergqvist, S.; Le, K.C.; Bengtsson, P.-E. Influence of rapid laser heating on differently matured soot with double-pulse laser-induced incandescence. Aerosol Sci. Technol. 2022, 56, 488–501. [Google Scholar] [CrossRef]
  20. Moore, R.H.; Ziemba, L.D.; Dutcher, D.; Beyersdorf, A.J.; Chan, K.; Crumeyrolle, S.; Raymond, T.M.; Thornhill, K.L.; Winstead, E.L.; Anderson, B.E. Mapping the operation of the miniature combustion aerosol standard (Mini-CAST) soot generator. Aerosol Sci. Technol. 2014, 48, 467–479. [Google Scholar] [CrossRef]
  21. Moallemi, A.; Kazemimanesh, M.; Corbin, J.C.; Thomson, K.; Smallwood, G.; Olfert, J.S.; Lobo, P. Characterization of black carbon particles generated by a propane-fueled miniature inverted soot generator. J. Aerosol Sci. 2019, 135, 46–57. [Google Scholar] [CrossRef]
  22. Bescond, A.; Yon, J.; Ouf, F.-X.; Rozé, C.; Coppalle, A.; Parent, P.; Ferry, D.; Laffon, C. Soot optical properties determined by analyzing extinction spectra in the visible near-UV: Toward an optical speciation according to constituents and structure. J. Aerosol Sci. 2016, 101, 118–132. [Google Scholar] [CrossRef]
  23. Malmborg, V.B.; Eriksson, A.C.; Török, S.; Zhang, Y.; Kling, K.; Martinsson, J.; Fortner, E.C.; Gren, L.; Kook, S.; Onasch, T.B.; et al. Relating aerosol mass spectra to composition and nanostructure of soot particles. Carbon N. Y. 2019, 142, 535–546. [Google Scholar] [CrossRef]
  24. Török, S.; Mannazhi, M.; Bengtsson, P.-E. Laser-induced incandescence (2λ and 2C) for estimating absorption efficiency of differently matured soot. Appl. Phys. B Lasers Opt. 2021, 127, 96. [Google Scholar] [CrossRef]
  25. Le, K.C.; Henriksson, J.; Bengtsson, P. Polarization effects in Raman spectroscopy of light-absorbing carbon. Raman Spectrosc. 2021, 52, 1115–1122. [Google Scholar] [CrossRef]
  26. Ramsteiner, M.; Wild, C.; Wagner, J. Interference effects in the Raman scattering intensity from thin films: Errata. Appl. Opt. 1989, 28, 4017–4023. [Google Scholar] [CrossRef] [PubMed]
  27. Ferrari, A.; Robertson, J. Interpretation of Raman spectra of disordered and amorphous carbon. Phys. Rev. B 2000, 61, 14095–14107. [Google Scholar] [CrossRef]
  28. Ouf, F.-X.; Parent, P.; Laffon, C.; Marhaba, I.; Ferry, D.; Marcillaud, B.; Antonsson, E.; Benkoula, S.; Liu, X.-J.; Nicolas, C.; et al. First in-flight synchrotron X-ray absorption and photoemission study of carbon soot nanoparticles. Sci. Rep. 2016, 6, 36495. [Google Scholar] [CrossRef] [PubMed]
  29. Yon, J.; Bescond, A.; Ouf, F.-X. A simple semi-empirical model for effective density measurements of fractal aggregates. J. Aerosol Sci. 2015, 87, 28–37. [Google Scholar] [CrossRef]
  30. Dastanpour, R.; Momenimovahed, A.; Thomson, K.; Olfert, J.; Rogak, S. Variation of the optical properties of soot as a function of particle mass. Carbon N. Y. 2017, 124, 201–211. [Google Scholar] [CrossRef]
  31. Vidano, R.P.; Fischbach, D.B.; Willis, L.J.; Loehr, T.M. Observation of Raman band shifting with excitation wavelength for carbons and graphites. Solid State Commun. 1981, 39, 341–344. [Google Scholar] [CrossRef]
  32. Haynes, J.P.; Miller, K.E.; Majestic, B.J. Investigation into Photoinduced Auto-Oxidation of Polycyclic Aromatic Hydrocarbons Resulting in Brown Carbon Production. Environ. Sci. Technol. 2019, 53, 682–691. [Google Scholar] [CrossRef] [PubMed]
  33. Müllen, K.; Castiglioni, C.; Zerbi, G. Common force field for graphite and polycyclic aromatic hydrocarbons. Phys. Rev. B Condens. Matter Mater. Phys. 1999, 60, 12710–12725. [Google Scholar] [CrossRef]
  34. López-Ríos, T.; Sandré, É.; Leclercq, S.; Sauvain, É. Polyacetylene in diamond films evidenced by surface enhanced Raman scattering. Phys. Rev. Lett. 1996, 76, 4935–4938. [Google Scholar] [CrossRef] [PubMed]
  35. Jäger, C.; Henning, T.; Schlögl, R.; Spillecke, O. Spectral properties of carbon black. J. Non. Cryst. Solids 1999, 258, 161–179. [Google Scholar] [CrossRef]
  36. Minutolo, P.; Gambi, G.; Alessio, A.D.; Anna, A.D. Optical and spectroscopic characterization of rich premixed flames across the soot formation threshold. Conbust. Sci. Technol. 1994, 101, 309. [Google Scholar] [CrossRef]
  37. Russo, C.; Apicella, B.; Tregrossi, A.; Ciajolo, A.; Le, K.C.; Török, S.; Bengtsson, P.-E. Optical band gap analysis of soot and organic carbon in premixed ethylene flames: Comparison of in-situ and ex-situ absorption measurements. Carbon 2020, 158, 89–96. [Google Scholar] [CrossRef]
Figure 1. Raman spectra of OP1 and OP6 soot exposed to laser radiation in air and nitrogen environments. (a) OP1 soot in air; (b) OP1 soot in nitrogen; (c) OP6 soot in air; (d) OP6 soot in nitrogen.
Carbon 10 00038 g001
Figure 2. Spectral evolution of OP1 soot (a) and OP6 soot (c) for various heat treatment temperatures in air, in comparison with our previous study on OP1 soot (b) and OP6 soot (d) using various heat treatment temperatures in nitrogen [11].
Carbon 10 00038 g002
Figure 3. Raman spectra of (a) OP6 soot before and after heat treated at 500 °C, evaporated volatile/semivolatile organic compounds (VOC/SVOC), and (b) clean sapphire substrate.
Carbon 10 00038 g003
Figure 4. Background subtracted Raman spectra of (a) heat-treated OP1 soot (Figure 2a); (b) heat-treated OP6 soot (Figure 2c); and (c) OP6 soot using specific laser illumination (Figure 1c).
Carbon 10 00038 g004
Figure 5. Integrated signals from (a) OP1 soot and (b) OP6 soot as a function of heat-treated temperature (HTT), (c) Integrated Raman and PL signals of OP6 soot as a function of laser exposure time. The dashed line marks at 150 °C.
Carbon 10 00038 g005
Figure 6. (a) OP1 soot heated in the air; (b) OP6 soot heated in the air; and (c) OP6 soot illuminated by the laser in the air. All spectra are normalized on the G-peak at around 1600 cm−1.
Carbon 10 00038 g006
Figure 7. Raman spectral decomposition of brown OP6 soot heat treated at 300 °C (a). Integrated signals of polycyclic aromatic hydrocarbon (D4, D1′), amorphous content (D3) (b) and oxygenated groups (c), of OP6 soot vs. heat-treated temperature (HTT).
Carbon 10 00038 g007
Figure 8. Variation in the D1 and G peak intensity ratio (a) and their positions (b) with heat-treated temperature (HTT).
Carbon 10 00038 g008
Table 1. Summary of the characteristic properties of OP1 and OP6 mini-CAST soot obtained in our previous studies. OC: organic compounds; TC: total carbon; PC: pyrolytic carbon; PAH: polycylic aromatic hydrocarbon; E(m): absorption function; ξ : dispersion coefficient.
PropertiesOC/TC [18](OC + PC)/TC [18]PAH/TC [18]E(m,532) [24] ξ (25 °C) [18] ξ (500 °C) [24]
Soot
OP1 Carbon 10 00038 i0019%9%0.009%0.371.21.2
OP6 Carbon 10 00038 i00232%59%3.9%0.252.52.3
Disclaimer/Publisher’s Note: The statements, opinions and data contained in all publications are solely those of the individual author(s) and contributor(s) and not of MDPI and/or the editor(s). MDPI and/or the editor(s) disclaim responsibility for any injury to people or property resulting from any ideas, methods, instructions or products referred to in the content.

