Article

The Correlation between Amino Acids and Biogenic Amines in Wines without Added Sulfur Dioxide

by
Sorin Macoviciuc
1,
Marius Niculaua
2,
Constantin-Bogdan Nechita
2,
Bogdan-Ionel Cioroiu
2,* and
Valeriu V. Cotea
1
1
Horticulture Department, Ion Ionescu de la Brad University of Life Sciences, 3rd Mihail Sadoveanu Alley, 700490 Iași, Romania
2
Research Center of Oenology, Romanian Academy, Iași Branch, 9th Mihail Sadoveanu Alley, 700505 Iași, Romania
*
Author to whom correspondence should be addressed.
Fermentation 2024, 10(6), 302; https://doi.org/10.3390/fermentation10060302
Submission received: 5 May 2024 / Revised: 15 May 2024 / Accepted: 20 May 2024 / Published: 6 June 2024

Abstract

:
In classical methods of wine production, amino acids play a critical role, as they are fundamental to all types of fermentation. Beyond their consumption in fermentative processes, amino acids undergo several transformations, such as decarboxylation, which produces biogenic amines. These biogenic amines can increase under certain conditions, such as the presence of spoilage bacteria or during malolactic fermentation. Alternative methods of vinification were applied, using sulfur dioxide as a preservative (+SO2) and methods without added sulfites. Alternative methods of vinification were applied using sulfur dioxide as a preservative (+SO2) and methods without added sulfite (−SO2). Monitoring was conducted for Cabernet Sauvignon red (CS), Cabernet Sauvignon rosé (CSR), Fetească regală still (FR), and Fetească regală frizzante (FRF). Alternative procedures employed the use of Pichia kluyveri for its ability to block the oxidation reactions of grapes, malolactic fermentation for all wines without sulfur dioxide (−SO2) to ensure superior stability, and the use of several tannin mixtures to avoid oxidation reactions. Correlations were considered between the amino acids and biogenic amines that have a direct relation through decarboxylation or deamination. The pH of the wines, total acidity, and volatile acidity as principal factors of microbiological wine evolution remained constant. The highest mean concentrations of the detected biogenic amines were putrescine at 23.71 ± 4.82 mg/L (CSRSO2), tyramine at 14.62 ± 1.50 mg/L (FR-SO2), cadaverine at 4.36 ± 1.19 mg/L (CS-SO2), histamine at 2.66 ± 2.19 mg/L (FR + SO2), and spermidine at 9.78 ± 7.19 mg/L (FR + SO2). The wine conditions ensured the inhibition of decarboxylases, but some correlations were found with the corresponding amino acids such as glutamine (r = −0.885, p < 0.05) (CSR-SO2), tyrosine (r = −0,858, p < 0.05) (FR-SO2), lysine (r = −0.906, p < 0.05) (FR-SO2), and histamine (r = −0.987, p < 0.05) (CSR-SO2). Multivariate analysis was performed, and no statistical differences were found between samples with (+SO2) and without added sulfur dioxide (−SO2). The vinification conditions ensured the wines’ stability and preservation and the conditions of producing biogenic amines at the lowest levels in order to not interfere with the olfactive and gustative characteristics.

1. Introduction

Free amino acids are an important source of nitrogen in grape must. They are involved in yeast’s metabolic activity during the first stage of alcoholic fermentation. A low concentration of amino acids can lead to incomplete or sluggish fermentation. Conversely, high concentrations of amino acids increase the risk of producing wines with microbiological instability, which negatively impacts the quality of the wine [1].
Amino acids are crucial in winemaking because they play a key role in the fermentation processes, which are essential for achieving desirable aromas and characteristics in the wine. The levels of amino acids vary when procedures such as malolactic fermentation, tartaric stabilization, antioxidant treatments, deproteinization, and clarifications are employed [2]. Since amino acids are present from the early steps, they are involved in several dynamic reactions to produce related compounds such as carboxylic acids, ketoacids, superior alcohols, and biogenic amines [3]. All these compounds are mainly responsible for the wine’s aroma. For example, valine forms 1-methyl-1-propanol; leucine produces 3-methylbutanol; isoleucine forms 2-methylbutanol; aspartic acid produces 1-heptanol; tyrosine produces hydroxy-4-phenyl-2-ethanole [4].
Biogenic amines usually increase in certain conditions such as the pH, the existence of cofactors such as wine spoilage, Lactobacillus and Pediococcus bacteria, temperature, and sulfur dioxide [5]. Sulfur dioxide is often used because of the important role in wine quality, but alternative methods for wine production try to substitute this to ensure the corresponding biological media, and also to avoid oxidation reactions [6]. Sulfur dioxide has a naturally occurring fraction that is produced by yeast during fermentation, which is usually 10–20 mg/L, but for efficiency, the concentrations can range up to 200 mg/L [7]. Establishing overly high total concentrations of sulfur dioxide to minimize any undesirable reactions can have implications for human health. These implications are possible adverse reactions related to intolerance associated with biological responses, such as asthmatic reactions, headache, allergic responses, etc. The presence of sulfur dioxide may be perceptible with respect to olfactive descriptors, which alter the quality of the wine. On the other hand, biogenic amines are more potent substances, which at low levels may trigger other types of human health reactions [8]. In the range of 50–100 mg/L, these compounds can alter specific wine aromas by introducing metallic, meaty, or putrid sensations and modifying varietals’ characteristics [9]. Usually, the concentration threshold for biological reactions is 100 mg/L and causes respiratory diseases, heart palpitation, hyper- or hypotension, and several other allergenic disorders [10].
New trends in wine production use alternative compounds that replace the role of sulfur dioxide. From the perspective of oxidative reactions, one of the substances used contains non-Saccharomyces strains such as Pichia kluyveri for its ability to block oxidation reactions [11]. From the perspective of technological approaches, these trends include thermal treatments, high hydrostatic pressure, high ultrasound, ultraviolet irradiation, and low electric current [12].
In winemaking, lactic acid bacteria (LAB) play important roles in malolactic fermentation (MLF). MLF typically follows alcoholic fermentation, which is carried out by yeast. LAB, specifically species like Oenococcus oeni, are responsible for converting harsh malic acid (found in grape juice) into softer lactic acid, which can contribute to the smoothness and complexity of wine. During MLF, the pH of the wine can decrease slightly due to the production of lactic acid by LAB. The modification of the pH during MLF depends on various factors, including the initial pH of the wine, the strain of LAB used, the temperature, nutrient availability, and the presence of inhibitory factors such as sulfur dioxide (SO2). Biogenic amines are formed through the decarboxylation of amino acids by specific bacterial enzymes at a lower pH and influence the activity of decarboxylase enzymes in LAB, affecting the production of biogenic amines. The use of lactic acid bacteria (LAB) can have positive effects on wine oxidation due to their consumption of oxygen. This helps protect the wine from oxidation by reducing the amount of dissolved oxygen available. This can contribute to the overall stability of the wine and help preserve its freshness and fruitiness. Also, the use or the addition of gallic, condensed, and hydrolysable tannins during winemaking can influence the pH of the wine and the oxidation reactions. Moreover, this can have a buffering effect, which helps to stabilize the pH of the wine by resisting changes in acidity. This buffering effect can be beneficial in maintaining the overall balance and stability of the wine [13].
Acidity correction and vinification for dry wine may limit the formation of biogenic amines at low levels within normal limits. The pH characteristics of dry wines are some of the favorable media that partially inhibit the activity of the biological medium’s composition and ensure the wine’s stability [14].
The scope of the present study was to evaluate specific biogenic amines for wines in relation to amino acids by the determination of the correlations between the increase in biogenic amines and the decrease in the corresponding amino acids during the wine aging period and evaluate the role of several vinification procedures for wines produced with sulfur dioxide and without added SO2.

2. Materials and Methods

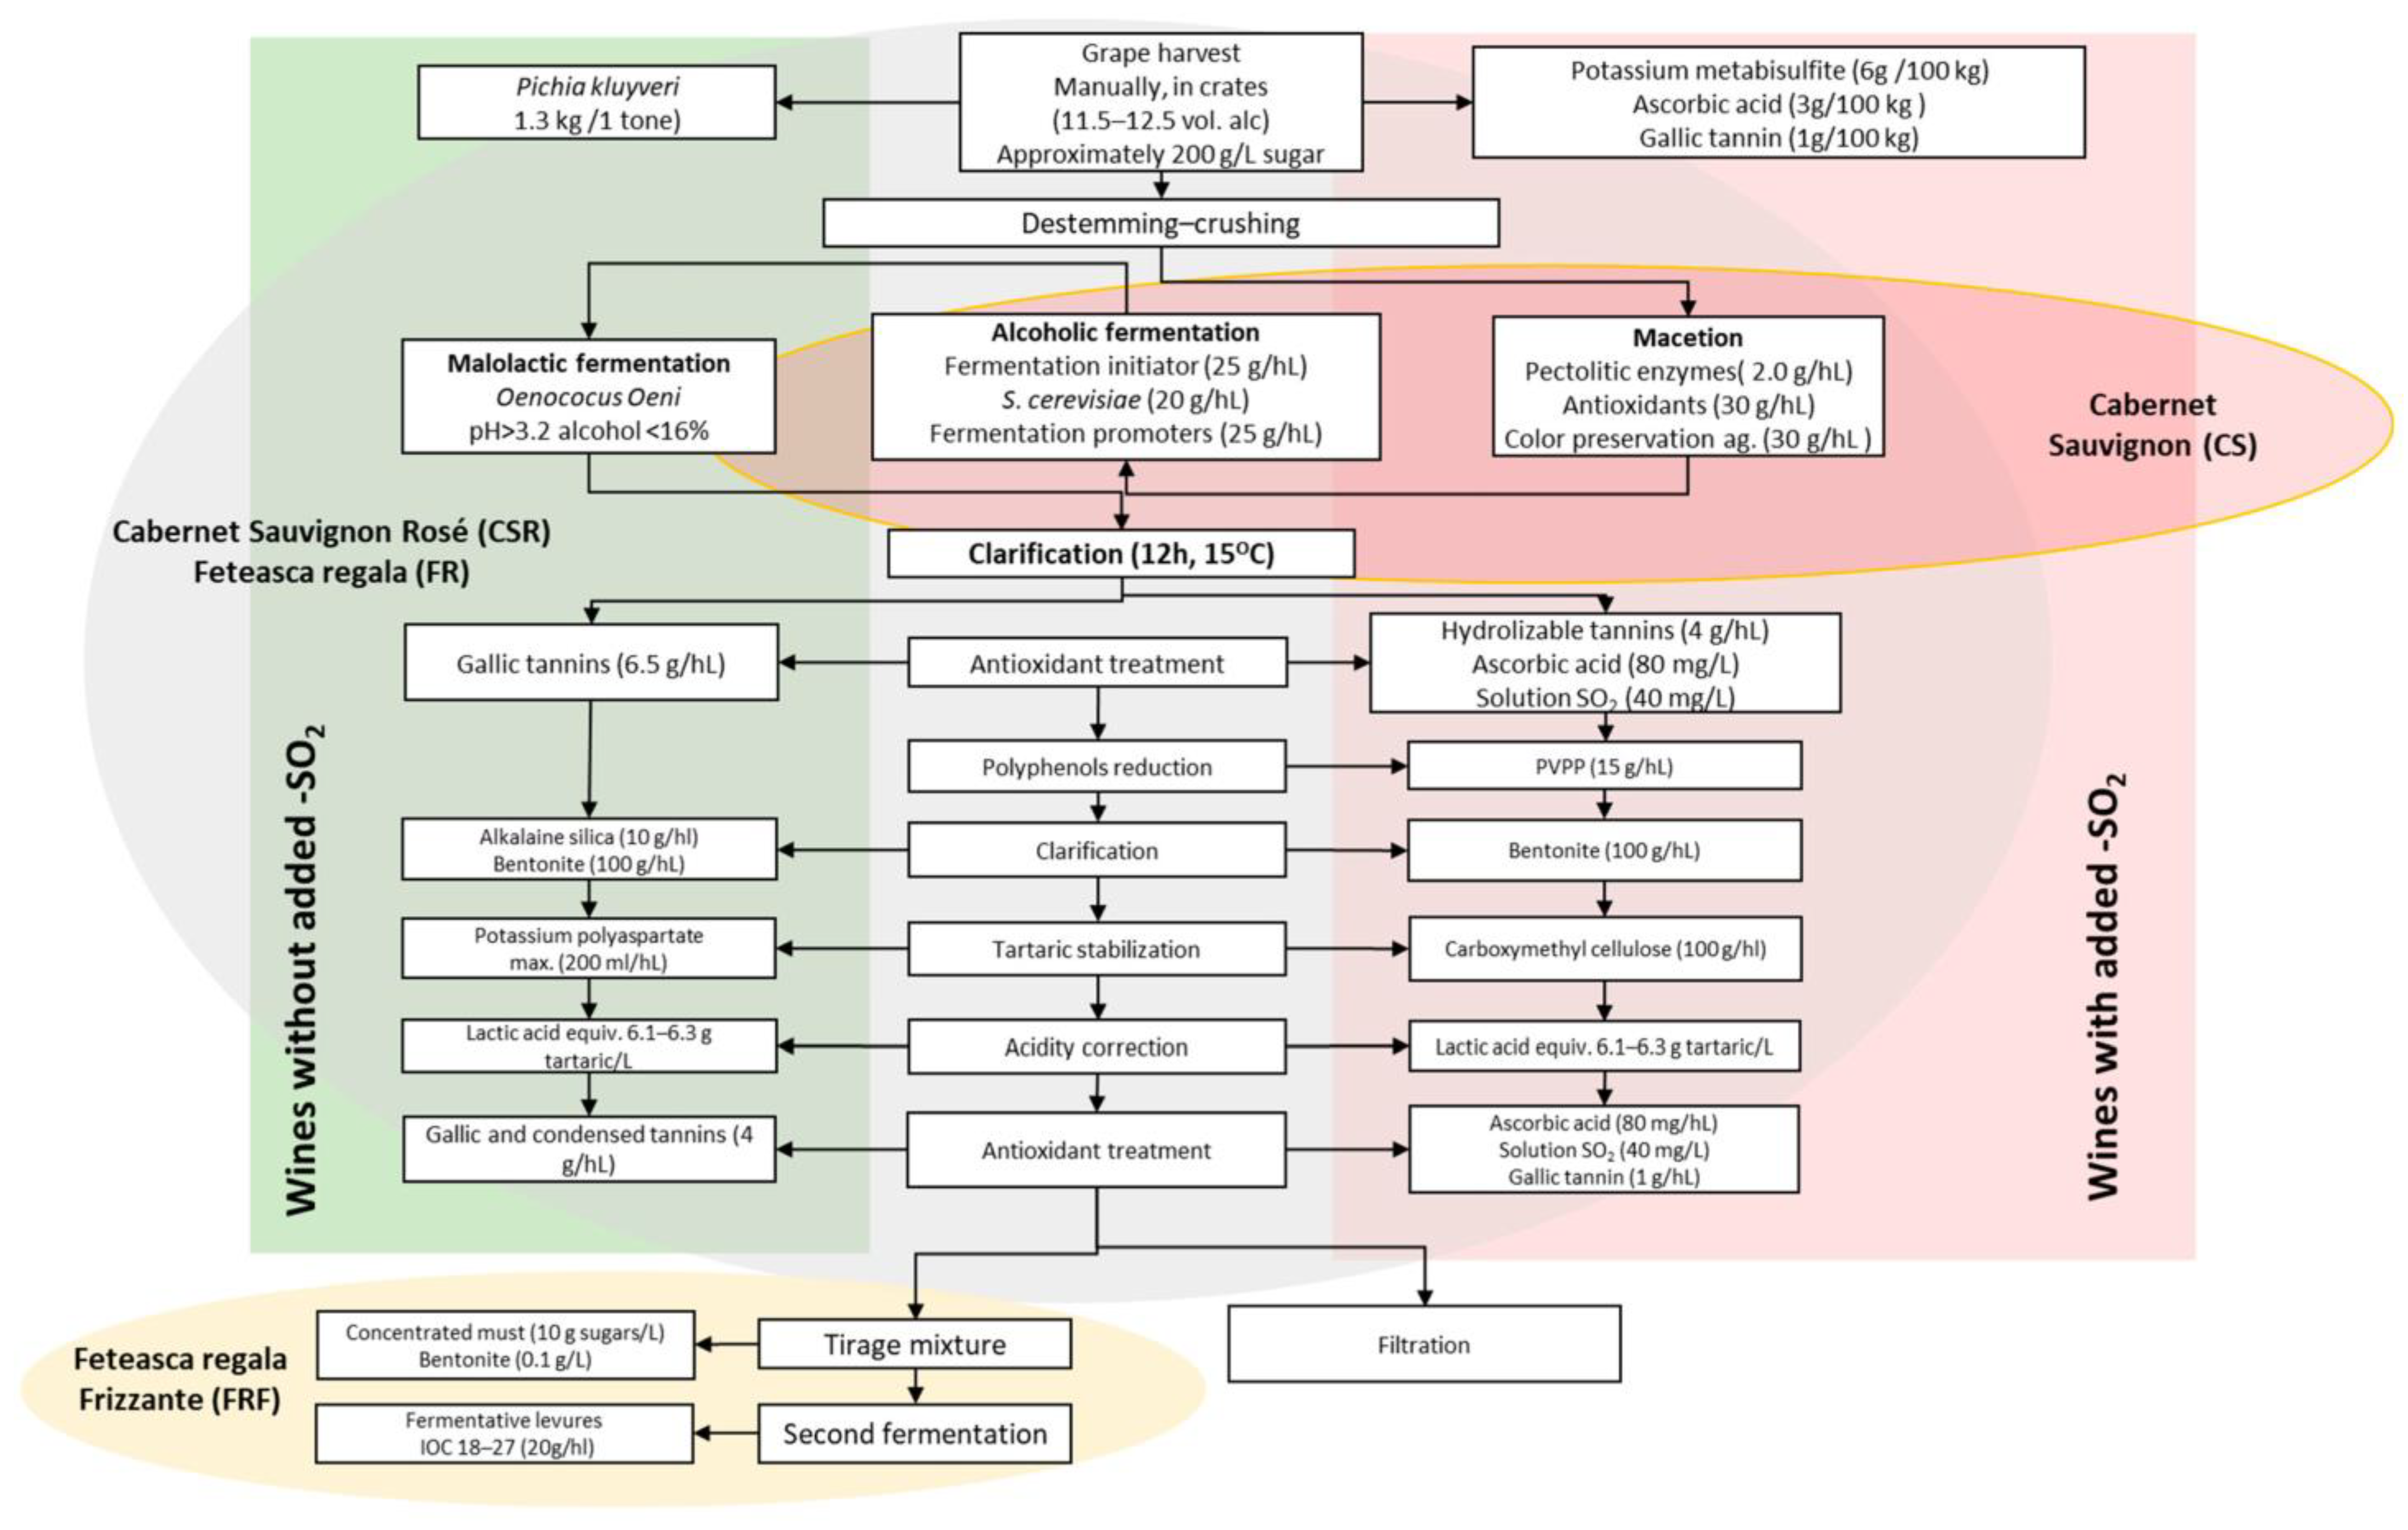
2.1. Wine Preparation Procedures

For each variety, vinification was carried out applying classical methods, with minor modifications corresponding to each variety of wine (Cabernet Sauvignon (CS), Cabernet Sauvignon rosé (CSR), Feteasca regală (FR), and Feteasca regală frizzante (FRF). Samples were distributed into two series regarding the use of sulfur dioxide, wines with added sulfur dioxide (+SO2) ((Cabernet Sauvignon (CS + SO2) (CS1), Cabernet sauvignon rosé (CSR + SO2) (CSR1), Feteasca regală (FR + SO2) (FR1), Feteasca regală frizzante (FRF + SO2) (FRF1)) and wines without added sulfur dioxide (−SO2) ((Cabernet Sauvignon (CS-SO2) (CS0), Cabernet Sauvignon rosé (CSR-SO2) (CSR0), Feteasca regală (FR-SO2) (FR0), and Feteasca regală frizzante (FRF-SO2) (FRF0).
For wines without sulfur dioxide, grape treatment against oxidation consisted of the use of Pichia kluyveri in doses of 1.3 kg/1 ton of grapes (1.0–3.0 × 10⁷ CFU/1 ton of grapes), while for the wines with sulfur dioxide, the treatment consisted of the use of potassium metabisulfite (6 g/100 kg of grapes), ascorbic acid (3 g/100 kg of grapes), and gallic tannin (1 g/100 kg of grapes).
Pectolytic enzymes from Aspergillus niger, rich in pectinases and complemented by cellulase activities, with activity expressed as polygalacturonase (PGNU) (6700 PGNU/g), were used for skin maceration in white grapes. They were employed for aroma extraction and enhancing fullness at temperatures of 16–20 °C for 3–8 h, using doses of 2 g/hL (FR, FRF, CSR).
Maceration of red wines was carried out through alcoholic fermentation using Saccharomyces cerevisiae in doses of 20 g/hL. Fermentation promoters were applied in two stages in doses of 25 g/hL, first with the role of fermentation initiator and, then, a second application to maintain optimal conditions. Two categories of Saccharomyces cerevisiae strains were used. All the strains were suitable for the recommended type of wine. Namely, for white wines, both still and sparkling, a specific type of S. cerevisiae was used to ensure fermentation at temperatures of 14 °C and a conversion factor of 16.4 g/L (grams of sugar to produce 1% alcohol (V/V)). For rosé and red wines, a specific type of S cerevisiae was employed to maintain the specific varietal characteristics of the wine (Cabernet Sauvignon), while also a low fermentation temperature and a short lag phase. All strains were high-alcohol tolerant, had a number of viable yeast of more than 1010 CFU/g, had a high nitrogen demand, and had very low to no capacity of producing indigenous sulfur dioxide or hydrogen sulfide.
In case of wines without added sulfur dioxide (CSR-SO2, FR-SO2, FRF-SO2, CS-SO2), malolactic fermentation was carried out using Oenococcus oeni (doses of 106 to 108 CFUs/mL) simultaneously with alcoholic fermentation (a pH higher than 3.2, low sulfur dioxide content, and alcohol content of less than 16% SO2). Co-inoculation was performed after 2 days from the start of alcoholic fermentation. All wines required acidity correction with lactic acid in doses equivalent to 6.1–6.3 g tartaric acid/L.
Maceration of Cabernet Sauvignon (CS-SO2 and CS + SO2) was carried out with enzymes (2 g/hL), antioxidant tannic extracts in doses of 30 g/hL, and tannins with the role of color stabilization (30 g/hL). Alcoholic fermentation (Saccharomyces cerevisiae (20 g/hL) and malolactic fermentation (Oenococcus oeni (106 to 108 CFUs/mL)) were performed for all types of Cabernet Sauvignon (CS) wine samples, both with and without sulfur dioxide.
Fetească regală frizzante underwent a second fermentation in the bottle, during which specific fermentative yeasts were added in doses of 20 g/hL. The mixture used for this process included concentrated must (10 g/L) and bentonite (0.1 g/L). An important stage was antioxidant protection, which was carried out in 2 different steps. For wines with added sulfur dioxide, antioxidant protection was performed after the end of fermentation with the addition of ascorbic acid in doses of 80 mg/L and free sulfur dioxide at 40 mg/L. The second correction was after tartaric stabilization using CMC or gum arabic (100 g/hL) and clarification with bentonite (100 g/hL), colloidal silica (5 g/hL), and fish glue (25 mL/hL). A schematic representation is given in Figure 1.
The samples were taken from the industrial plant of the Panciu Winery vinification facility, and the number of bottles was 3 taken from 3 vinification fermenters for the intermediate samples (RW) and 5 bottles from three series of wines, which had finalized stabilization processes (SW).
The monitorization period comprised between the years 2018 and 2021, and representative samples were allocated to be monitored accordingly. Given the slow formation of biogenic amines and the decarboxylation of amino acids after wine vinification, monitoring was conducted using a cross-sectional longitudinal study approach. This involved collecting complementary data from various samples (cross-sectional) and tracking the results over time (longitudinal). Finally, representative samples were subject to evaluation of amino acids and biogenic amines. This approach of analysis at the end of the 4 years after the vinification of the first sample series (2018) provided the possibility to observe the changes over time.

2.2. Reagents and Reference Materials

For the quantification of amino acids, a series of working standards was used, namely ethanolamine (ETH), putrescine (PUT), tyramine (TYRM), cadaverine (CAD), histamine (HISM), phenylethylamine (PHEM), tryptamine (TRPM), and spermidine (SPD) and L-Serine (SER), L-glutamine (GLU), L-phenylalanine (PHE), L-Tryptophan (TRP), L-tyrosine (TYR), L-lysine (LYS), L-arginine (ARG), and L-histidine (HIS) were purchased from Sigma Aldrich (purity of 98%) and heptafluorobutyric acid and methanol were supplied by Merck KGaA -Germany and had LC-MS purity. Type I water was produced by a Thermo Scientific GenPure UV-TOC.

2.3. Chromatographic Conditions

A mobile phase consisting of an aqueous solution of 0.1% heptaphluorobutyric acid in water (MFA) and 0.1% heptaphluorobutyric acid in methanol (MFB) was used. Elution used several gradients and isocratic conditions. Initially, the elution began with a mixture of mobile phase A (MFA) and mobile phase B (MFB) at a ratio of 85:15% (V/V) for 2 min. Subsequently, the composition was changed to 73% MFA for 3 min, followed by a transition to 50% MFA over 4 min. Elution remained isocratic for 2 min before re-equilibration over 3.5 min. A C18 chromatographic column, of 150 mm in length, with a 2.1 mm internal diameter, and with a particle size of 1.7 µm (Phenomenex Kinetex C18 XB), was used. For mass spectrometry analysis, a heated electrospray ionization (HESI) source was used for ionization in positive mode. Additionally, a collision cell (Q2) was employed to generate specific fragments for accurate identification of compounds in the study. An ionization potential of 3 kV was employed, an ionization source temperature of 350 °C, a nitrogen nebulization gas of 35 psi, and an auxiliary gas pressure of 10 psi. The capillary tube had a temperature of 350 °C. In these conditions, the transitions of the biogenic amines and amino acids were according to Table 1.

2.4. Statistical Analysis

All the statistical analyses were carried out using StatSoft Tibco Statistica, ver 14.0. The univariate analysis of variance was applied to compare the levels of biogenic amines in the case of different wine varieties (Cabernet Sauvignon, Cabernet Sauvignon rosé, Feteasca regală, Feteasca regală frizzante), as well as between the wines that were treated with and without sulfur dioxide. When different values of the concentrations were registered, the Least Significant Difference (LSD) test was applied to determine which mean values had significant differences. As sources of biogenic amines, the decarboxylation and deamination processes of amino acids were considered. The correlation factor for the direct relation of formation biogenic amines from the corresponding amino acid was evaluated through the monitoring of the variation in the corresponding amino acid levels and the respective biogenic amine from the samples. The variation in the concentration by year, variety, and treatment was considered. Principal component analysis was applied to evaluate the continuous variables’ distribution (biogenic amines and amino acids) in case of the existence of more grouping variables being highly correlated (fermentation, variety, year of wine production, SO2).

2.5. Sensory Analysis

For sensory analysis, representative samples from each variant were used. Sensory analyses were conducted with a panel of tasters, following the methodology developed and pre-approved.
From the evaluation sheet, the following parameters were selected as representative for this type of sample. Given the nature of wines with and without sulfite addition, three sets of parameters were configured to encompass a wide range of evaluations. Visual descriptors and olfactory parameters (fruity, floral, spicy, woody, mineral) were selected to define sensory typicity, the detection of varietal aromas, as well as any specific modifications developed following the use of substances involved in winemaking. The taste parameters aimed to evaluate sweetness, astringency, bitterness, persistence, as well as the intensity of the corresponding aromas. Profiles corresponding to the same wines are defined based on the winemaking technology, which is differentiated by the use of SO2/ascorbic acid and by malolactic fermentation and tannins added for antioxidant protection.

3. Results

3.1. Distribution of Amino Acids and Biogenic Amines in the Chromatographic Method

Regarding the spectra of biogenic amines, only ethanolamine (ETH), ethylamine (ETY), putrescine (PUT), tyramine (TYR), cadaverine (CAD), histamine (HIS), phenylethylamine (PHE), tryptamine (TRPM), and spermidine (SPD) were found in detectable concentrations. Other analyzed amines were not found or the detected concentration ranged between the limit of quantification and the limit of detection [15]. The corresponding chromatograms are presented in Figure 2.

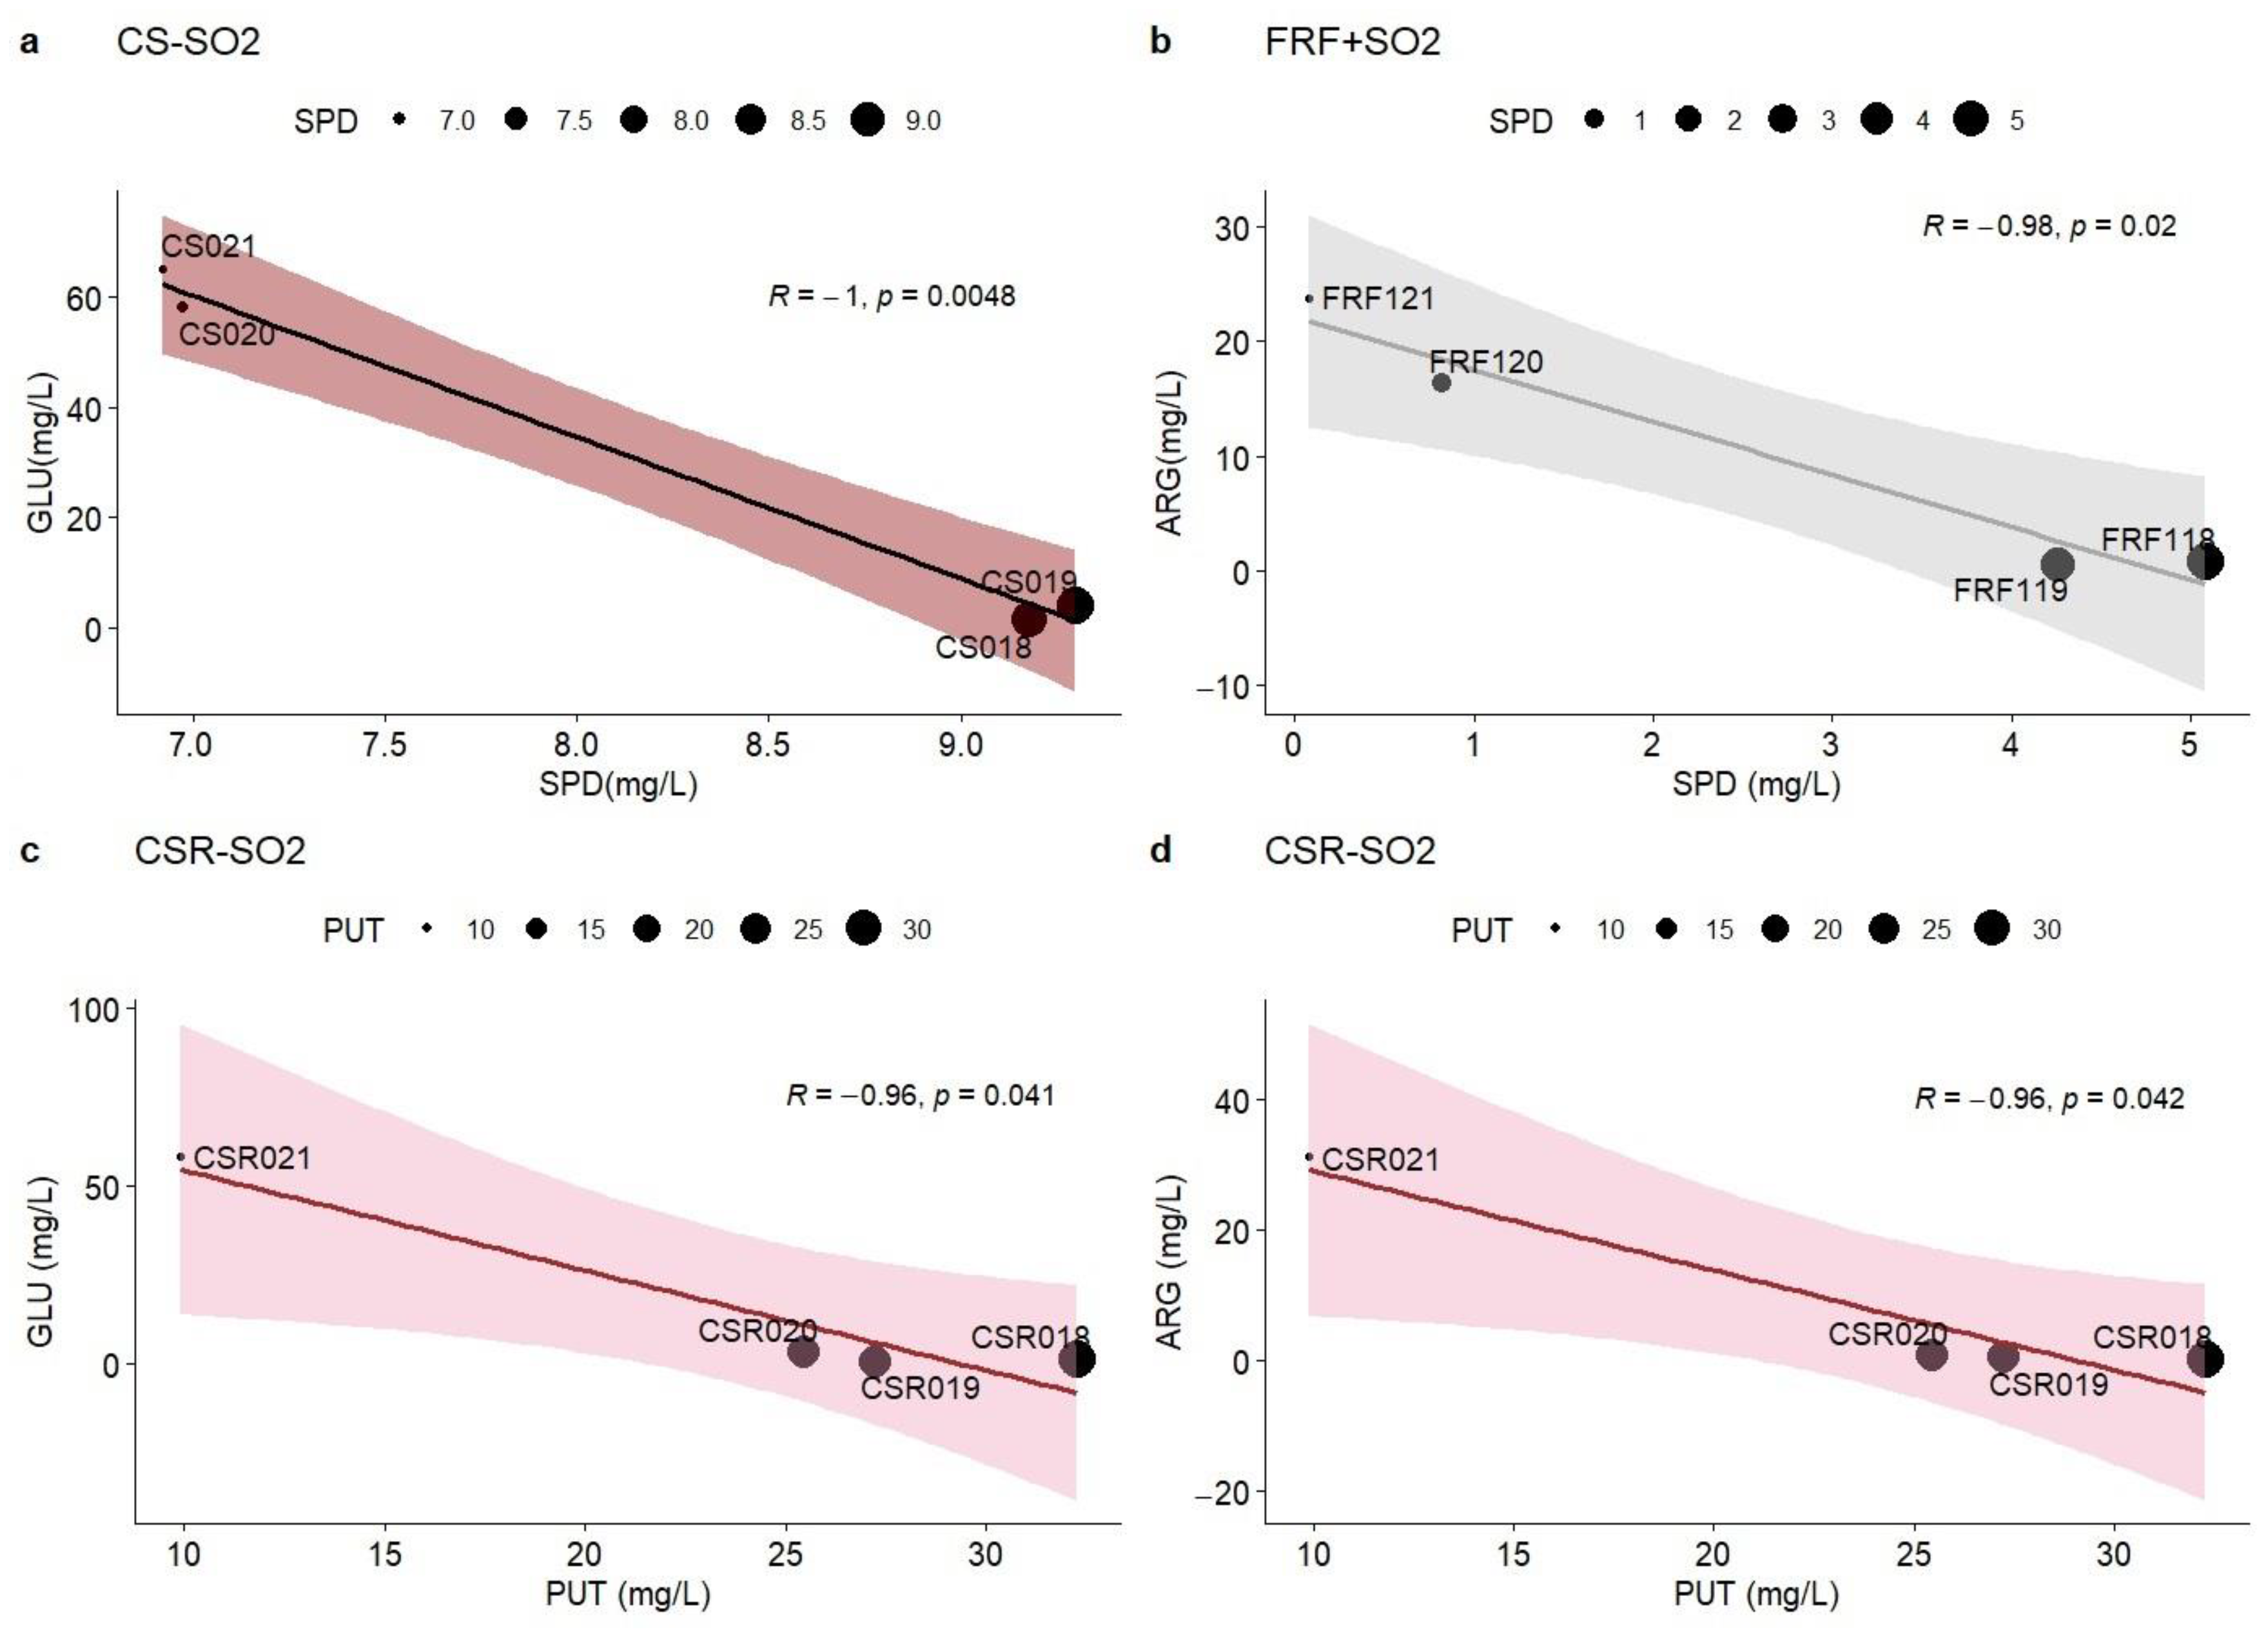
3.2. Amino Acids’ Concentration in Relation to Biogenic Amines

In several stages of winemaking, the primary step is alcoholic fermentation using Saccharomyces cerevisiae and fermentation promoters as nitrogen sources. The production of wines with a low content of sulfur dioxide is challenging because this facilitates the bacterial growth and oxidation processes [16].
Biogenic amines are provided by amino acids through decarboxylation and deamination reactions. The malolactic fermentation using lactic acid bacteria amplifies the process of biogenic amines’ formation. Decarboxylation is produced under the activity of enzymes, which are responsible for the biochemical processes. These decarboxylation enzymes are specific to the substrate of reaction and to the corresponding amino acids. Most of the biogenic amines have a single production pathway, so HISM can be formed by the conversion of HIS through histidine decarboxylase (HDC), LYS can be converted to CAD by lysine decarboxylase (LDC), and tyrosine decarboxylase (TDC) can transform tyrosine (TYR) and phenylalanine (PHE) into tyramine (TYRM) and phenylethylamine (PHEM) [17].
The contents of the biogenic amines correlated with the amino acids in the wines are synthesized in Table 2, with the evolution during monitoring for the correlations’ evolution in Table 3, and are presented as a function of the variety, type of wine, and maturation period.
TYRM levels were lower than the data reported in the literature with levels of 110.8 mg/L for white wines and 38.8 mg/L for red wines [18]. In our determinations, the values of 4.85 ± 3.2 mg/L (CS-SO2) and 14.62 ± 1.5 mg/L (CS + SO2) were the highest, in contrast with FR, which had 0.12± 0.04 mg/L (FR + SO2) and 0.25 ± 0.1 mg/L (FRF + SO2). TYR had a different behavior; CS + SO2, FR + SO2, and FRF + SO2 decreased during the storage period, but for the −SO2 samples, the evolution was different and showed an increase in TYRM, while TYR had a continuous decrease for CSR + SO2 (r = 0.915, p < 0.1).
LYS was one of most abundant amino acids in the analyzed samples, 13.0 ± 2.6 mg/L for FRF-SO2 and 41.54 ± 9.0 mg/L CSR + SO2. Significant differences were for FR, 26.85 ± 7.5 mg/L (FR + SO2) and 41.87 ± 5.3 mg/L (FR-SO2). Also, for +SO2 samples, a slight decrease in LYS from 30.0 ± 8.2 mg/L (2021) to 28.53 ± 3.9 mg/L (2018) occurred. Decarboxylation to CAD is favored by one of the highest values of the pH from the series of biogenic amines. Studies have shown that the reaction is favored by pH values up to 8.0 and high temperatures of 50 °C [19]. Direct correlations of CAD and LYS were registered for FRF-SO2 with a decrease in LYS and an increase in CAD, r = −0.998 (p < 0.05), but for FR + SO2, both compounds showed a lower correlation (Table 4). CS had a direct increase in LYS and CAD (r = 0.918, p < 0.1) for +SO2 samples, while in case of −SO2 samples, it produced an increase in LYS, while CAD decreased during the aging period from 1.41 ± 0.7 mg/L(2021) to 2.47 ± 0.7 mg/L (2019) and 1.92 ± 0.6 mg/L (CS018) (Table 3).
Significant correlations were found for FRF-SO2, which showed a decrease in HIS while HISM increased, the same as for CSR-SO2 r = −0.987 (p < 0.05), but the variation showed an increase in HIS and a decrease in HISM (Table 4).
Some evolutions were registered for CS + SO2: the PHE values were maintained from 15.25 ± 3.3 mg/L (2021) to 14.49 ± 1.8 mg/L (2018), while PHEM had the same trend of 0.15 ± 0.03 mg/L to 0.14 ± 0.03 mg/L, although some correlations were only found for FRF-SO2 (r = 0.912 (p < 0.1)) and FRF + SO2 (r = −0.998; p < 0.05) (Table 4).
Two different situations produced a variation in the increase in TRPM correlating with a decrease in TRP for CSR + SO2 (r = −0.995; p < 0.05)), but the inverse variation correlated with the degradation of both compounds (CS-SO2) (r = 0.956, (p < 0.05)), (FR-SO2) (r = 0.999; p < 0.05).
Evaluating at the variety level, different proportions were recorded, with higher values of GLU (14.29 ± 12.9 mg/L (CS + SO2) and 32.19 ± 17.1 mg/L (CS-SO2)) for CS samples, whereas the values for ARG were (9.42 ± 7.4 mg/L (CS + SO2) and 15.6 mg/L (CS-SO2)) (Table 2). In a different ratio, the GLU and ARG levels were found in FRF + SO2 to be 2.22 ± 1.0 mg/L (GLU) and 10.40 ± 5.8 mg/L (ARG), similar to the levels for FRF-SO2 (1.32 ± 0.3 mg/L (GLU) and 13.3 ± 5.4 mg/L (ARG)). The absence of GLU in white wines is attributed to the lower proportion of glutamic acid used during yeast fermentation (5.51 ± 1.01 mg/L (FRF-SO2)) and 29.62 ± 5.6 mg/L (FRF + SO2)), whereas for CS samples, GLU was mainly used. The correlations between glutamic acid and GLU showed inversely proportional variations with a high degree of correlation, especially in the case of FRF + SO2 (r = −0.940, p < 0.05) and FR + SO2 (r = −0.99, p < 0.05).
Regarding the variation and stability of GLU within the same series, it serves as a nitrogen donor in the yeast metabolic pathway and underwent various modifications, with values ranging from 33.47 ± 9.0 mg/L for samples from 2021 to 1.21 ± 0.1 mg/L for samples from 2018 (Table 3). However, differences were evident between samples with and without SO2, with levels slightly lower for all varieties in the study.
The absence of SO2 resulted in the increased activity of lactic acid bacteria, pyrroline-5-carboxylate synthase (P5CS) enzymes, hydrolytic enzymes, and yeasts, as well as cytoplasmic compounds such as peptides, fatty acids, and nucleotides present in wine samples [20].
Cabernet Sauvignon (CS, CSR) exhibited superior levels of GLU compared to FR wines (FR and FRF), ranging from 14.29 ± 12.9 mg/L for CS + SO2 to 32.19 ± 17.1 mg/L for CS-SO2, compared to 1.32 ± 0.3 mg/L for FRF-SO2 and 2.22 ± 1.0 mg/L for FRF + SO2. From the distribution of the values over the monitoring period, the evolutions were similar in their level of all red wines (CS0, CS1, CSR0, and CSR1), but higher instability towards degradation was observed in the case of white wines.
As with other amino acids, the levels of ARG were higher for red and rosé wines. For CS + SO2 and CS-SO2, the initial values were 9.42 ± 7.4 mg/L and 15.16 ± 8.0 mg/L, respectively. A comparative variation was registered for ARG, but at the end of the evolution, the levels were 23.04 ± 4.5 mg/L (2021) and 4.13 ± 3.1 mg/L (2018); similar values were registered for GLU, showing a similar trend in terms of degradation. Lower levels were found for FR, with average values of 5.37 ± 1.8 mg/L (FR + SO2) and 8.03 ± 4.2 mg/L (FR-SO2). SPD exhibited superior levels for red (CS) (r = −1.00, p < 0.05) (Figure 3a) and rosé (CSR) wines and also showed a tendency to increase from 3.42 ± 1.1 mg/L (2021) to 4.84 ± 1.1 mg/L (CSR018) (CS-SO2) (r = −0.96, p < 0.05) (Figure 3c). In the case of four samples, direct correlations were found between the decrease in ARG and the increase in SPD. FRF+SO2 registered a correlation coefficient r = −0.98 (p < 0.05) (Figure 3b), while the correlation of ARG with PUT showed a variation for CSR-SO2 (r = −0.960, p < 0.05) (Figure 3d).
The levels of PUT were highest with concentrations ranging from 35.91 ± 2.3 mg/L (CS + SO2) to 15.86 ± 4.7 mg/L (FRF-SO2). In fact, there was a direct correlation between PUT and SPD, with concentrations ranging from 2.56 ± 1.2 mg/L (FRF + SO2) to 9.79 ± 7.2 mg/L (FR + SO2). The registered values of PUT were the highest in the series of biogenic amines and were related to the effect of dl-lactic, L-malic, dl-malic, tartaric, and citric acids on the reaction of PUT formation, which is considered to have a significant influence. The results indicated that only l-lactic and tartaric acids modified putrescine synthesis, exhibiting a stimulatory effect, which linearly correlated with the organic acid concentration in the range of 1 to 10 g/L. Acidity corrections were carried out for all the wines in the study at various points before bottling, using doses of lactic acid of 6.0 ± 0.3 g/L equivalent in tartaric acid.
The composition of wine lees (or wine sediment) after fermentation consists of dead yeast cells, bacteria, cell walls, carbohydrates, proteins, and various phenolic material, all of which serve as sources of amino acids. Different levels of amino acids were calculated individually between finished stabilized wines (RS) and raw wine samples (RW) that were still in contact with the wine lees.
The elimination of lees sediments by using decantation reduced the content of wine media components that release further quantities of amino acids and biogenic amines. The clarifying agents used in the wine-clarification process, such as bentonite and gelatin, have a minor impact on the levels of amino acids in wine. These clarifying agents can bind to certain compounds in wine, including amino acids, during the clarification process [21].
For some amino acids and biogenic amines, complexation with the components of clarifying agents was confirmed: GLU (22.90 ± 12.1 mg/L (RS) → 0.87 ± 0.28 mg/L (RW)) (CSR), TRP (2.92 ± 0.6 mg/L (RS) → 0.60 ± 0.005 mg/L (RW)) (CS), and ARG (16.19 ± 0.40 mg/L (RS) → 0.40 ± 0.09 mg/L (RW)) (CSR). In other cases, the values were superior for the wines that were filtered and stabilized, confirmed by the values of SER (11.88 ± 3.37 mg/L (RS) → 11.90 ± 3.75 mg/L (RW) (FR), HIS (64.48 ± 2.96 mg/L (RS) → 69.10 ± 0.96 mg/L (RW) (CSR), LYS (21.98 ± 5.23 mg/L (RS) → 23.77 ± 6.67 mg/L (RW) (CS), and PHE (13.38 ± 1.02 mg/L (RS) → 13.71 ± 2.89 mg/L (RW) (CS) (Figure 4). According to the percentage of the concentrations remaining in the stabilized samples, the values were maintained in the following percentage ratios: SER (45:55), GLU (59:41), TYR (54:46), LYS (49:51), HYS (51:49), PHE (48:52), TRP (44:56), ARG (41:59), and biogenic amines (ETH (45:55), PUT (58:42), TYRM (66:34), CAD (47:53), HISM (16:84), PHEM (36:61), TRPM (56:44), and SPD (46:34) (%:%).
Malolactic fermentation had a significant influence on biogenic amines with the highest levels registered for FRF-SO2, which exhibited superior values of all biogenic amines in contrast with the corresponding amino acids. Aging was identified as a possible cofactor, especially for FRF, where the lees remained in contact with the wine [22]. Comparing the samples with stabilization, the most important differences in relation to the raw wines were observed for PUT (+4.92 mg/L), ETH (+1.80 mg/L), CAD (+1.20 mg/L), and SPD with a reduction of −1.57 mg/L, while other amino acids also had superior values, but lower modifications. In direct correlation were SER, LYS, HIS, PHE, and ARG. For malolactic fermentation, Oenococcus oeni with doses of 25 g/hL was used [23]. For CS, superior levels of some biogenic amines were produced because of maceration, which permitted transfer from the grapes. PUT with 35.90 ± 2.3 mg/L for CS1, 26.26 ± 6.99 mg/L for FR0, and 20.77 ± 3.16 mg/L for FRF1 are representative.
Volatile acidity for the −SO2 samples was similar to that of the +SO2 samples. These values were between the optimum interval of 0.12 and 0.45 g acetic acid/L, indicating that the wines did not exhibit any problems regarding the conservation or other organoleptic properties. This was further confirmed by the levels of proline, which showed good stability. The reducing sugars of the recently finished wines were less than 5 g/L, indicating that fermentation had reached dryness. The decrease in reducing sugars after stabilization and aging of the wines could influence microbial activity due, probably, to the presence of lactic and acetic bacteria (Table 5).

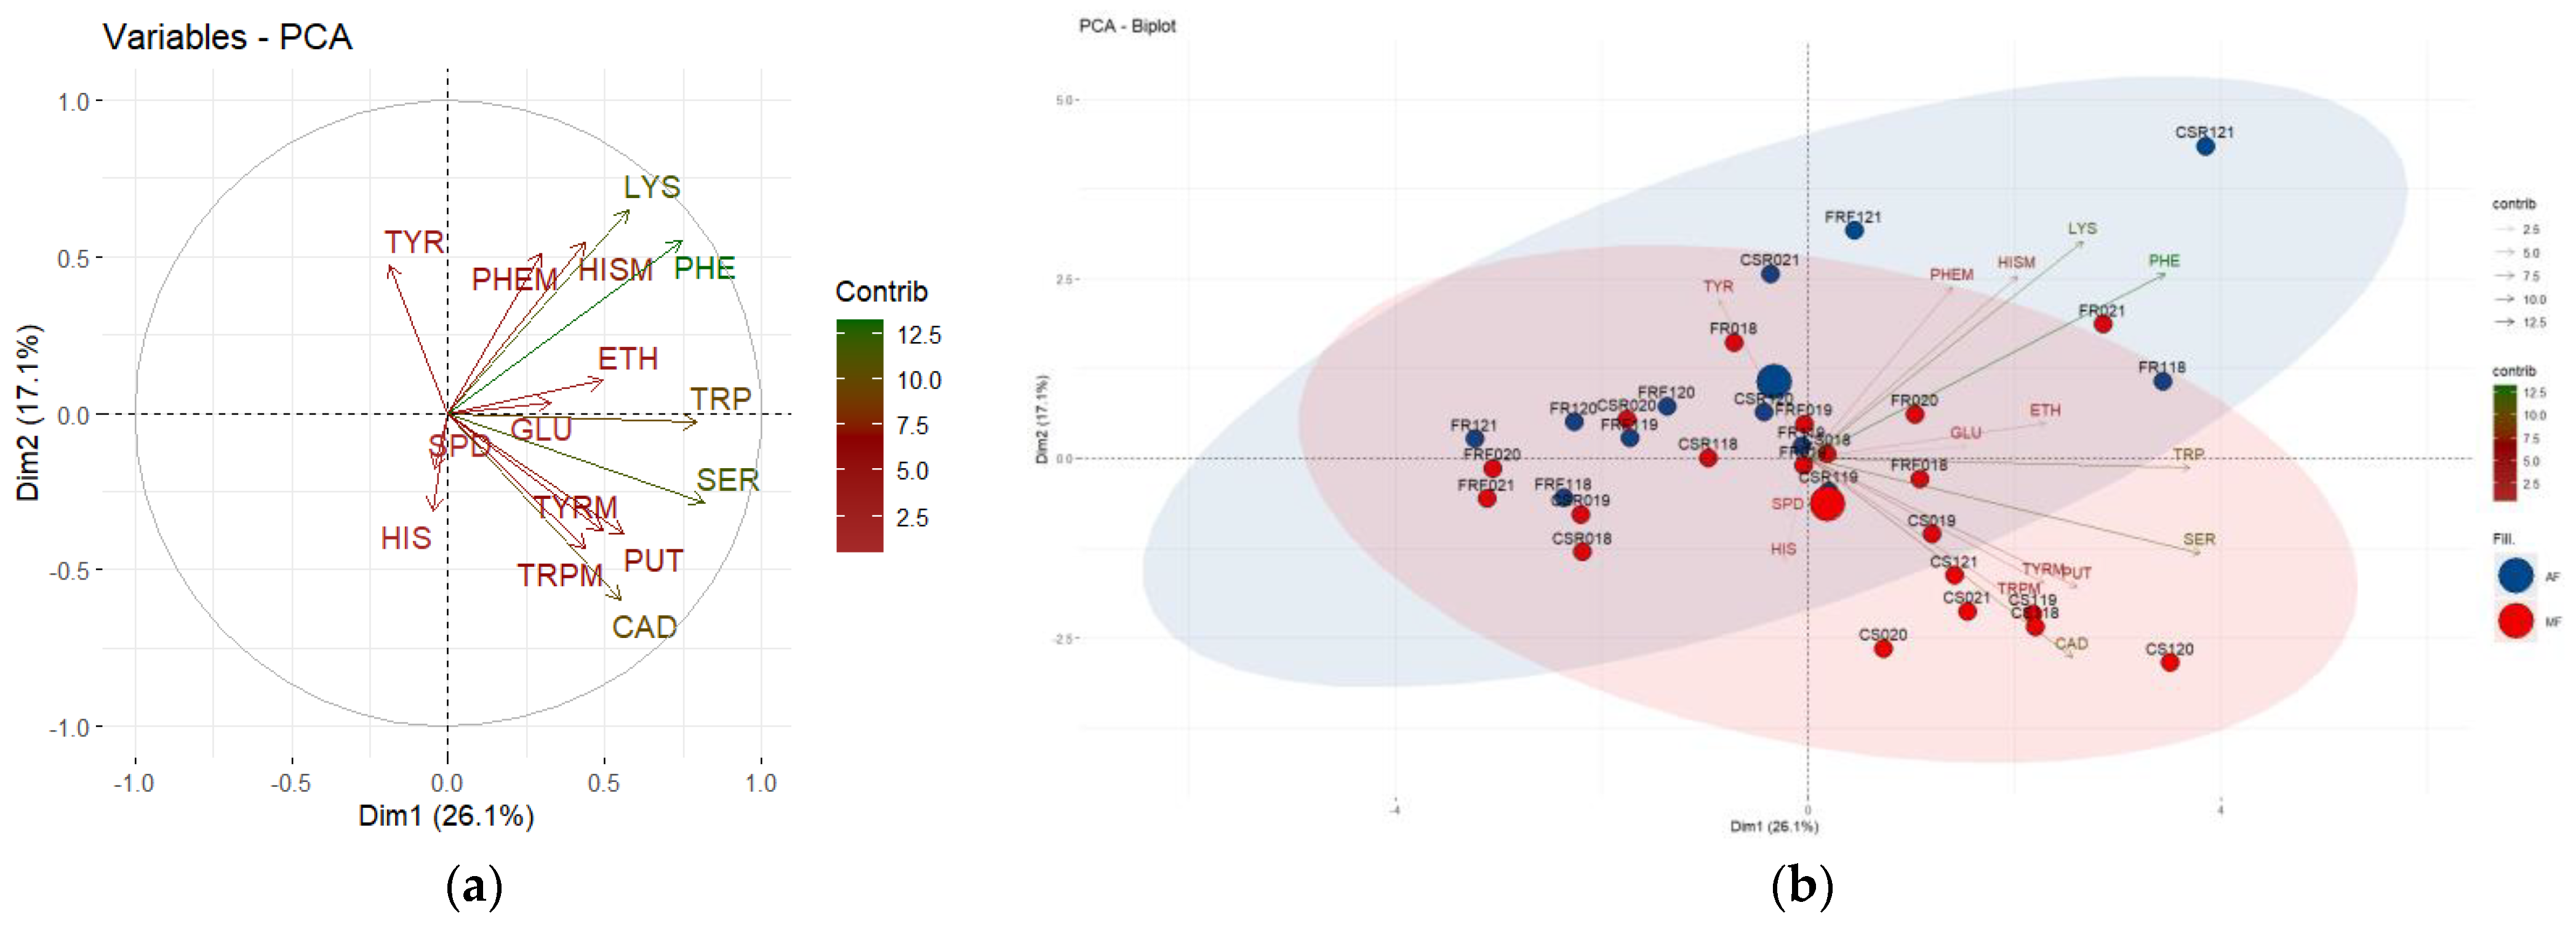
3.3. Principal Component Analysis

The categorization of samples with correlated grouping variables allowed for the evaluation of whether there was a clear difference between the amino acids and biogenic amines in both classes of wines. Samples with malolactic fermentation were associated with the absence of sulfur dioxide. From previous data, the absence of SO2 did not influence the stability of the samples, so a classification of the distribution from the perspective of malolactic and alcoholic fermentation was produced using principal component analysis [24].
Figure 5 depicts the two dimensions of the PCA model applied for every wine variety to identify the specific clusters, with each one identifying the contribution of the model variables to the wine characterizations. In the case of every variety, the distribution of component classification was different. The first principal component (PC1) can be associated with the variety, namely CS, CSR, FR, and FRF, having a contribution of 26.1%, and PC2, which characterized the type of fermentation (malolactic fermentation and alcoholic fermentation), having a contribution of 17.1%. The presence of sulfur dioxide was not a factor that influenced the principal components and was, therefore, not considered a criterion for differentiation. Significant values were applied for single-factor ANOVA (varieties), and the variables that were statistically different were SER, LYS, CAD, and TYRM. In this context, the observations from the multivariate test analysis using the Tukey post hoc test showed that the results were not statistically different when the sulfur dioxide criterion was applied. The analysis confirmed the behavior of the amino acids and biogenic amines on the loading factors with influence on the variables in the data projection. With the exception of TYR, HIS, and SPD (Figure 5a), the biogenic amines and the remaining amino acids were positively correlated along principal component 1 (PC1), which differentiates the wine varieties included in the study [25]. According to principal component 2 (PC2), the highest contributions were determined by the biogenic amines produced through decarboxylation reactions. Biogenic amines produced under decarboxylation deamination reactions, such as SPD and PUT, were negatively correlated with PC2 and did not have a significant contribution, indicating a likelihood of production under mixed conditions. The data are in agreement with the values found previously, where finite trends were found for biogenic amines and amino acids [26]. From the point of view of biogenic amines, PHEM, HISM, and ETH were exceptions, showing a positive correlation with PC1. This suggests that other biogenic amines were responsible for differentiating between years of production. On the other hand, negatively correlated variables according to PC2 included values for the CS and CSR samples (Figure 5b), which resulted in a relatively separated cluster, but with no significant variation.

4. Discussion

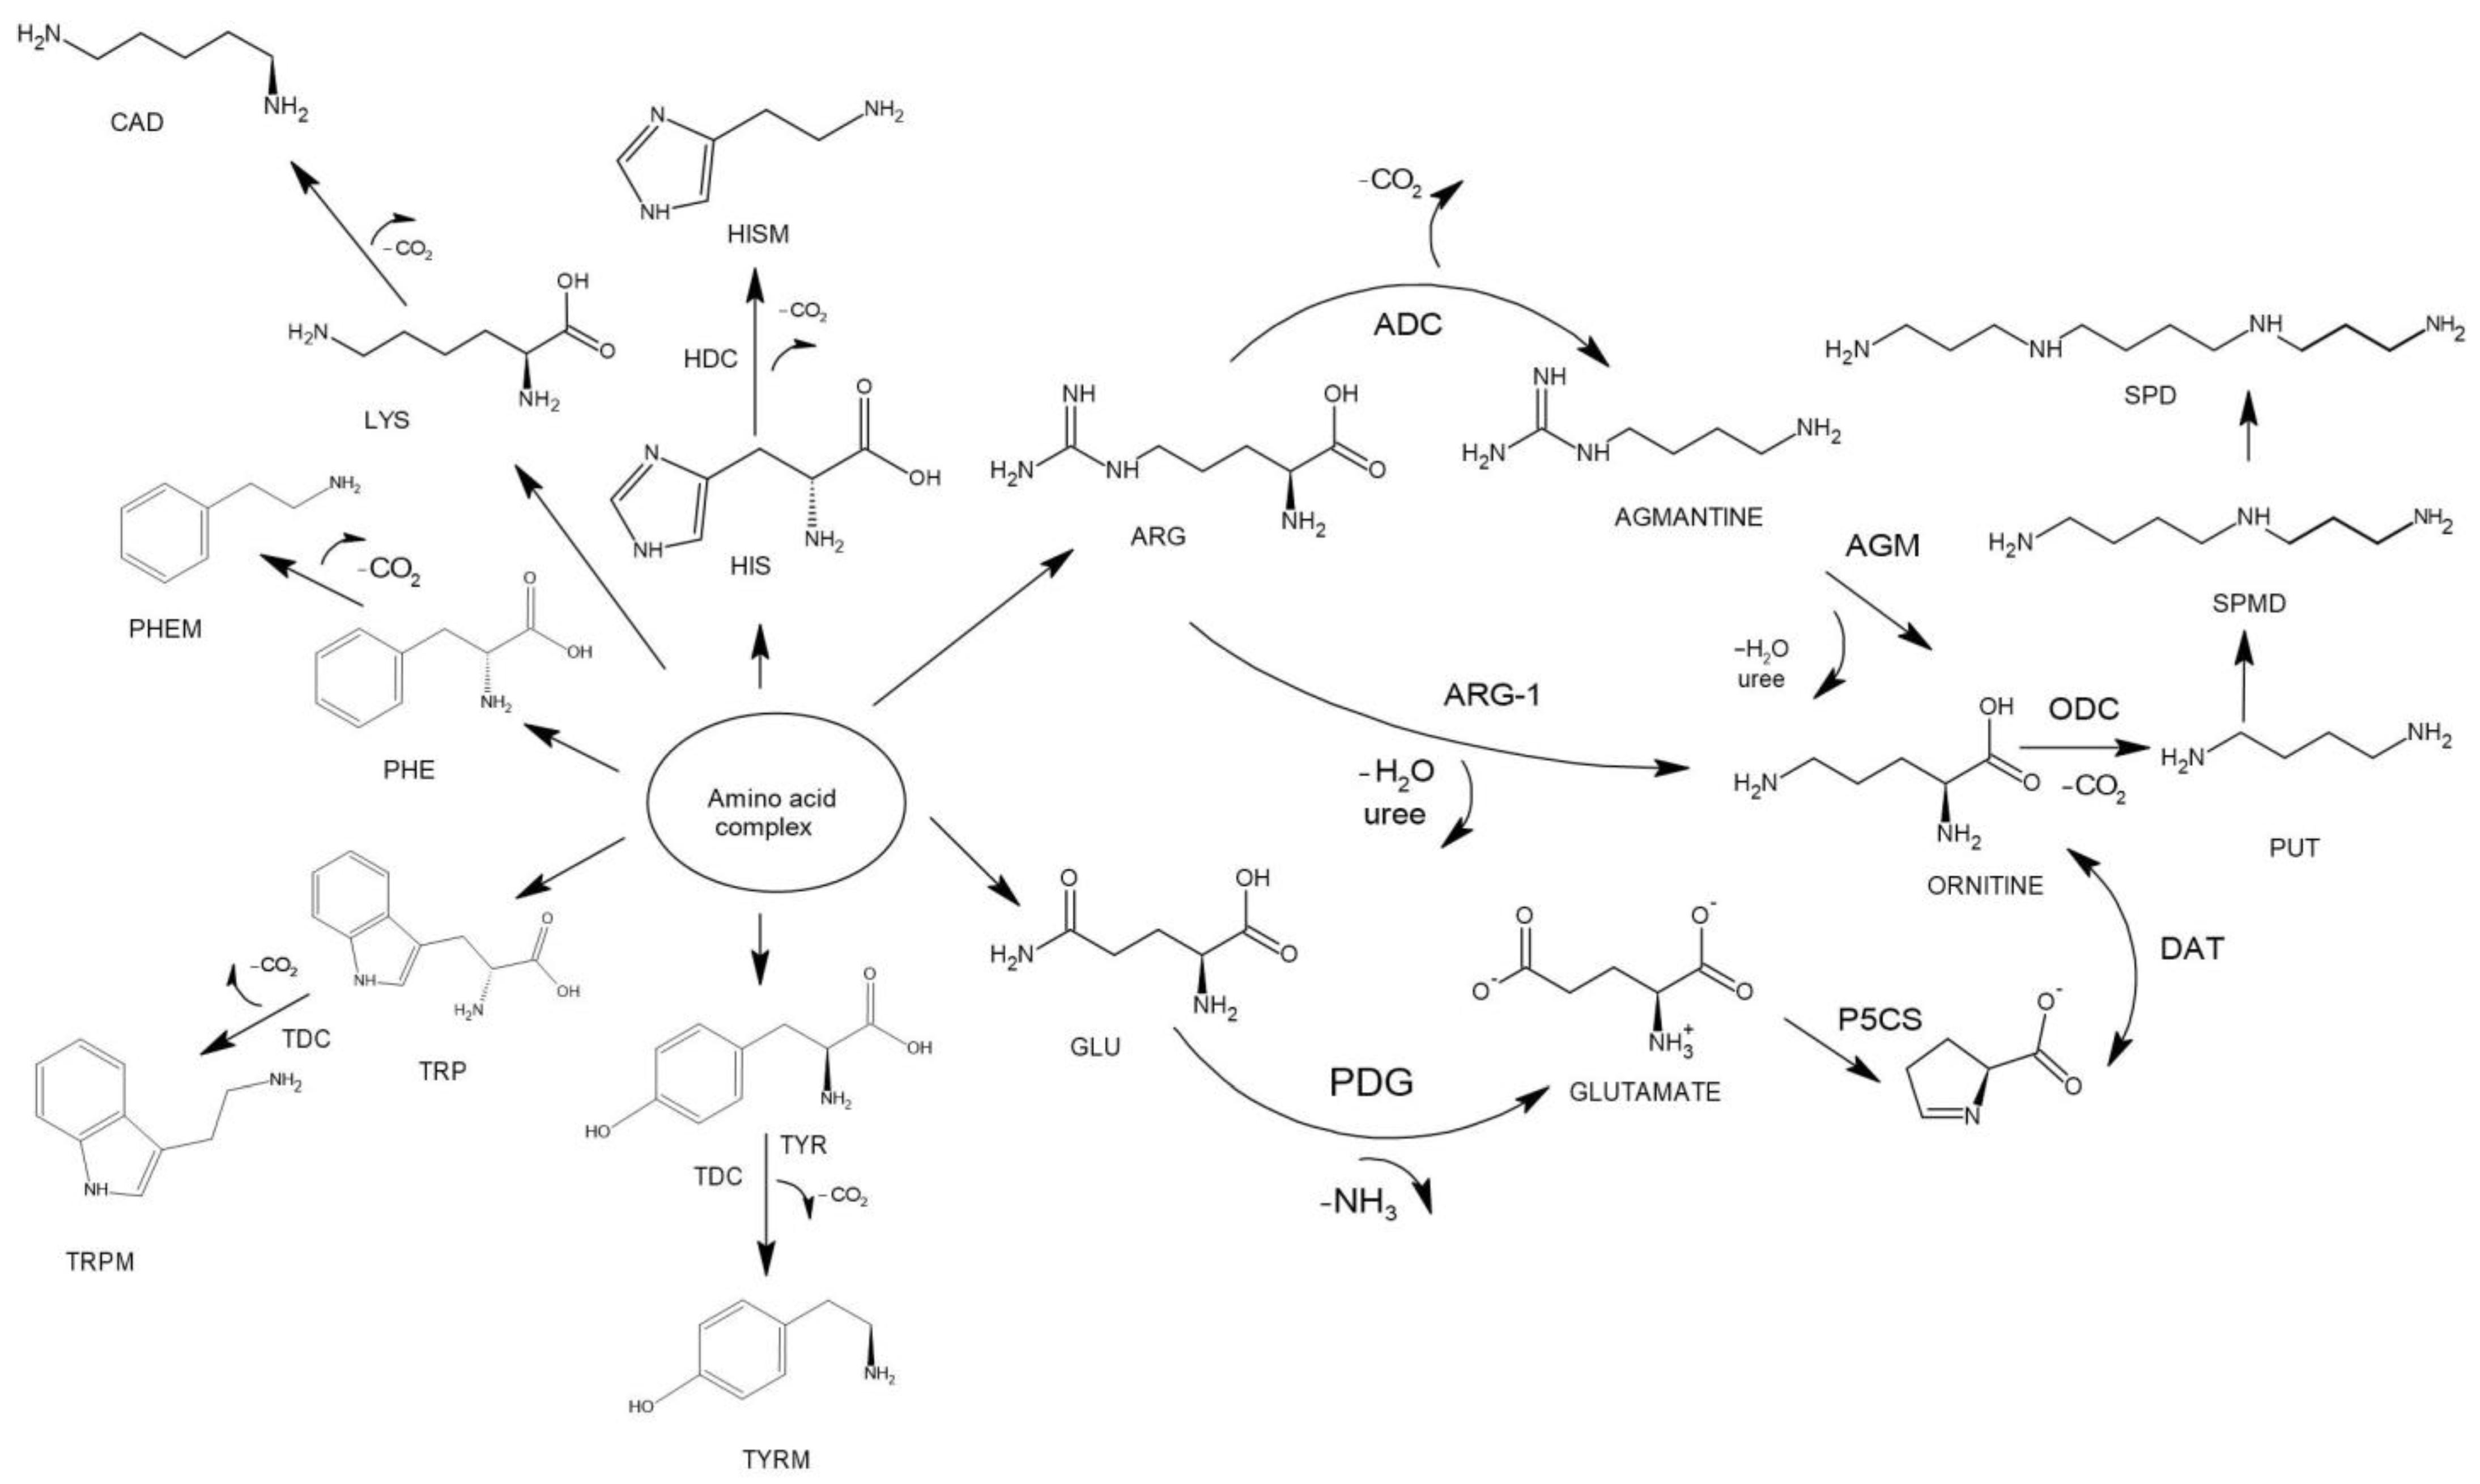
4.1. Proposed Mechanisms of Biogenic Amines’ Production in Wine Samples

Several correlations were monitored to verify the direct relation of the formations of biogenic amines from amino acids. Amino acids as precursors for biogenic amines undergo decarboxylation or deamination reactions in which a carboxyl group is substituted with a hydroxyl group. In these conditions, HISM is produced by HIS, TYRM by TYR, and PUT by GLU, which ARG is a precursor of SPD. PUT and SPD can be formed by two different pathways. First, under the action of ornithine decarboxylase (ODC), ornithine can be converted to PUT [27]. Second is the formation of PUT after deamination of agmatine using agmatinase (AGM). SPM and SPD are polyamines derived from PUT. The agmatine system consists of three enzymes: agmatine deiminase, putrescine carbamoyltransferase, and carbamate kinase. The relation between the sources of amino acids is determined by GLU and ARG because both are implicated in the production of the intermediates agmatine and ornithine.
The products of GLU metabolism have been shown to be primarily glutamate and ammonia, with relatively small amounts of ornithine formed. The formation of glutamate and ammonia from glutamine follows reactions like oxidative dehydrogenation. The synthesis of ornithine from GLU is currently considered to occur through the action of a regulatory enzyme in ornithine synthesis from GLU, namely P5C synthase P5CS28 [28]. There is a relation between SPD and SPM. SPM is transformed into SPD using propylamine as an intermediate. Since propyl-amine is consumed in the reaction, it was not found in the wines. The correlation between SPD and ARG is related to the formation of agmatine and PUT as intermediates. Additionally, PUT is produced by GLU through the double reaction of deamination and decarboxylation using the intermediate ornithine. Ornithine derived from GLU could have been subsequently converted from ARG, as the levels of ARG were comparable to GLU. A new possible mechanism is considered for the formation of agmatine, which is synthesized after the decarboxylation of ARG by arginine decarboxylase (ADC). The biosynthesis of agmatine depends on the availability of ARG. Arginase converts ARG into ornithine, which enters the urea cycle. In all species, agmatine can be metabolized by hydrolysis into PUT, the precursor of the polyamines spermine and SPD, by the enzyme agmatinase [29]. ARG was considered in relation to PUT and SPD. The conversion of SPD from arginine was evaluated by the ratio of the transformation determined by the decrease in ARG concentrations and the positive evolution of SPD. Because spermine (SPM) was not detected, the sequence of formation ARG > AGM (agmatine) > SPM > SPD was considered possible. A proposed schema is presented in Figure 6:

4.2. Influence of Wine Stability on Production of Biogenic Amines

The red wines (CS) had significantly higher levels of biogenic amines of 49.54 ± 2.45 mg/L (523 μmol/L) in total content, continuing with the rosé wines CSR of 49.08 ± 1.48 mg/L (452 μmol/L), FR of 44.91 ± 2.03 mg/L (386.5 μmol/L), and finally, FRF of 43.59 ± 2.00 mg/L (302.3 μmol/L).
pH influences decarboxylase enzymes through catalytic activation, decarboxylase activities being maximal when the pH is low. Biogenic amines constitute a protective mechanism against low pH, and lactic acid produced under malolactic fermentation conditions favors the equilibrium process [30].
For histidine decarboxylase (HDC), the optimal pH is 4.8; for tyrosine decarboxylase (TDC), the optimal pH is 5.0; for ornithine decarboxylase (ODC), the optimal pH is 5.8 [31].
Nitrogen is a major nutrient for plants and regulates grape vigor and development. The optimum quantity of nitrogen influences fermentation kinetics and parameters such as wine flavors [32]. Total acidity or pH is important for the production of biogenic amines. The rate of the decarboxylation of amino acids is favored by the pH. The optimum values for biogenic amines were 4.7–5.0 [33]. The pH for the wines was maintained at a level of 3.1–3.3 at the time of vinification. The pH, acidity, alcoholic content, volatile acidity and sugar content were monitored to verify the primary condition that led to the activation of lactic acid bacteria (Table 5). Regarding the pH, CS showed pH values ranging from 3.00 to 3.74 for −SO2 samples and 2.91–3.72 for +SO2 samples. A similar evaluation was performed for CSR (3.12–3.51) for −SO2 samples and 3.38–3.82 for +SO2 samples.
FR had pH values in the same interval, ranging from 3.25 to 3.57, and FRF had values ranging from 3.13 to 3.44. pH modifications are determined by organic acids that contribute to total acidity. An increase in pH, correlated with a slight decrease in total acidity, may be caused by the precipitation of tartaric acid, which is considered unstable. Malolactic fermentation for the −SO2 samples was necessary because of the microbiological instability of malic acid and citric acid.
The control of microbes and bacterial food sources was important in the context of a low content of sulfur dioxide, and one of the most important possible sources of instability is malic acid. Grapes naturally have a significant amount of malic acid, and the environment harbors a high quantity of microbes, especially Lactobacillus and Oenococcus, which digest it into lactic acid and release carbon dioxide and aromatic compounds (like diacetyl, which smells like popcorn butter) in the process.
While all yeast consume some oxygen during their lifecycle, the use of Pichia kluivery yeast in the grapes’ preservation was chosen due to its lower overall oxygen requirement. This can be beneficial to minimize oxidation by reducing the oxygen exposure, which helps prevent browning and other negative effects of oxidation on the wine’s flavor and aroma, as well as enhances the fruit character by promoting the preservation of fruity and floral aromas in wines. Also, studies have suggested that Pichia kluivery produces certain compounds, such as extracellular polysaccharides and peptides, which exhibit antioxidant properties. These compounds can help scavenge free radicals and reduce oxidative stress in grape tissues. As a result, treating grapes with Pichia kluivery may contribute to the preservation of color, flavor, and overall quality during winemaking [34].
The best way to prevent malic acid refermentation in the bottle is to inoculate with a known, strong malolactic bacteria culture such as Oenococcus oeni, which is efficient in the conditions of a high-alcohol environment or a low pH wine.
The presence of LAB facilitated the production of BA in the same way compared with samples that had only alcoholic fermentation. This evolution was confirmed by evaluating the oldest wines with the newest samples from 2021. The levels of biogenic amines and amino acids were higher for samples with SO2 and without MF. This was attributed to the short contact, higher acidity of fresh samples, and wine characteristics, which influence the indigenous flora with different decarboxylase activity. With aging, the pH and acidity of wines increased to higher values, around 3.5–4.0, which permitted the formation of biogenic amines. Additionally, a degradation process was also involved in this phenomenon [35].
The variation of the pH and total acidity conditions of the wines did not show any statistical differences between these samples, so no wine developed any growth of bacterial medium capable of producing supplementary concentrations of biogenic amines. Only CAD had significantly different values between the varieties. Additionally, under the same conditions, biogenic amines that originated from SER, TYR, HIS, and TRP did not show statistical differences between the +SO2 samples and −SO2 samples.
After stabilization and aging, the parameter did not have any specific increases, indicating that the protective properties in both test and control wines remained constant. Volatile acidity is produced by microbial alterations, oxidation, or a reduction process and is favored by the oxygen introduced during the aging period. Ash values and alkalinity were similar for all of the recently obtained wines and independent of the must clarification treatment [36].
The constituents of yeast sediments after alcoholic/malolactic fermentation are mannoproteins, proteic and tannate substances, inactive yeast autolysates, and yeast walls. The evaluation was performed for intermediate samples that were taken directly from the fermentation tank (raw samples (RWs)) and samples that were stabilized and conditioned (stabilized wines (RS)). Clarification produced the elimination of sediment constituents that were sources of the further transformation/production of amino acids.
Since the pH of the wines did not have an important variation, biogenic amines and amino acids had different behaviors. FRF is a sparkling wine, where the second fermentation is produced in contact with yeast cultures after the correction of the sugar to doses of 24 g/L and fermentation starters. This is a favorable medium for the release of amino acids and further reactions for biogenic amines because the wine remained in contact with lysates, even though the alcoholic concentration was sufficient to inhibit any decarboxylation or deamination enzymes. The weight balance of the amino acids and biogenic amines indicated that the concentrations were not significantly different from the other type of wines. An increase in the content of SER and TRP in relation to the mean values was registered for FRF samples, with values of 7.13 ± 1.8 mg/L (FRF1) and 6.85 ± 3.6 mg/L, while TRP had 10.40 ± 5.8 mg/L (FRF1) and 13.13 ± 5.4 mg/L (FRF0). As in the case of the FR samples, GLU (2.22 ± 1.0 mg/L (FRF1) and 1.32 ± 0.3 mg/L (FRF1) had the lowest values in the series and were significantly different than other samples such as the CS1 samples. HIS and PHE were close to the average values, but showed differences compared to CSR0 and CSR1, respectively. In direct correlation to GLU, PUT had the highest concentrations with 20.78 ± 3.2 mg/L and 15.86 ± 4.7 mg/L which can be explained by the continuous decrease because of residual biological activity. Some differences were registered for CAD and TYRM, but the differences were associated with CS samples. All the mentioned statistical differences were evaluated using the Tukey honestly significant difference test with p < 0.05. This stability is explained by the possibility that these compounds are excreted during aging due to sources of excretion such as autolysis from residual yeast [37]. Alternative sources that are involved are represented by aging compounds such as manno-proteins [38]. Malolactic fermentation was important in the vinification of the wines and occurred concomitantly with alcoholic fermentation. This was performed for CS, also CSR, FR, and FRF, but only in the case of −SO2 samples. Biogenic amines increase in the presence of different microorganisms associated with biological media. In this situation, the production of biogenic amines in the presence of yeast was relatively insignificant compared to the case when lactic acid bacteria were present.

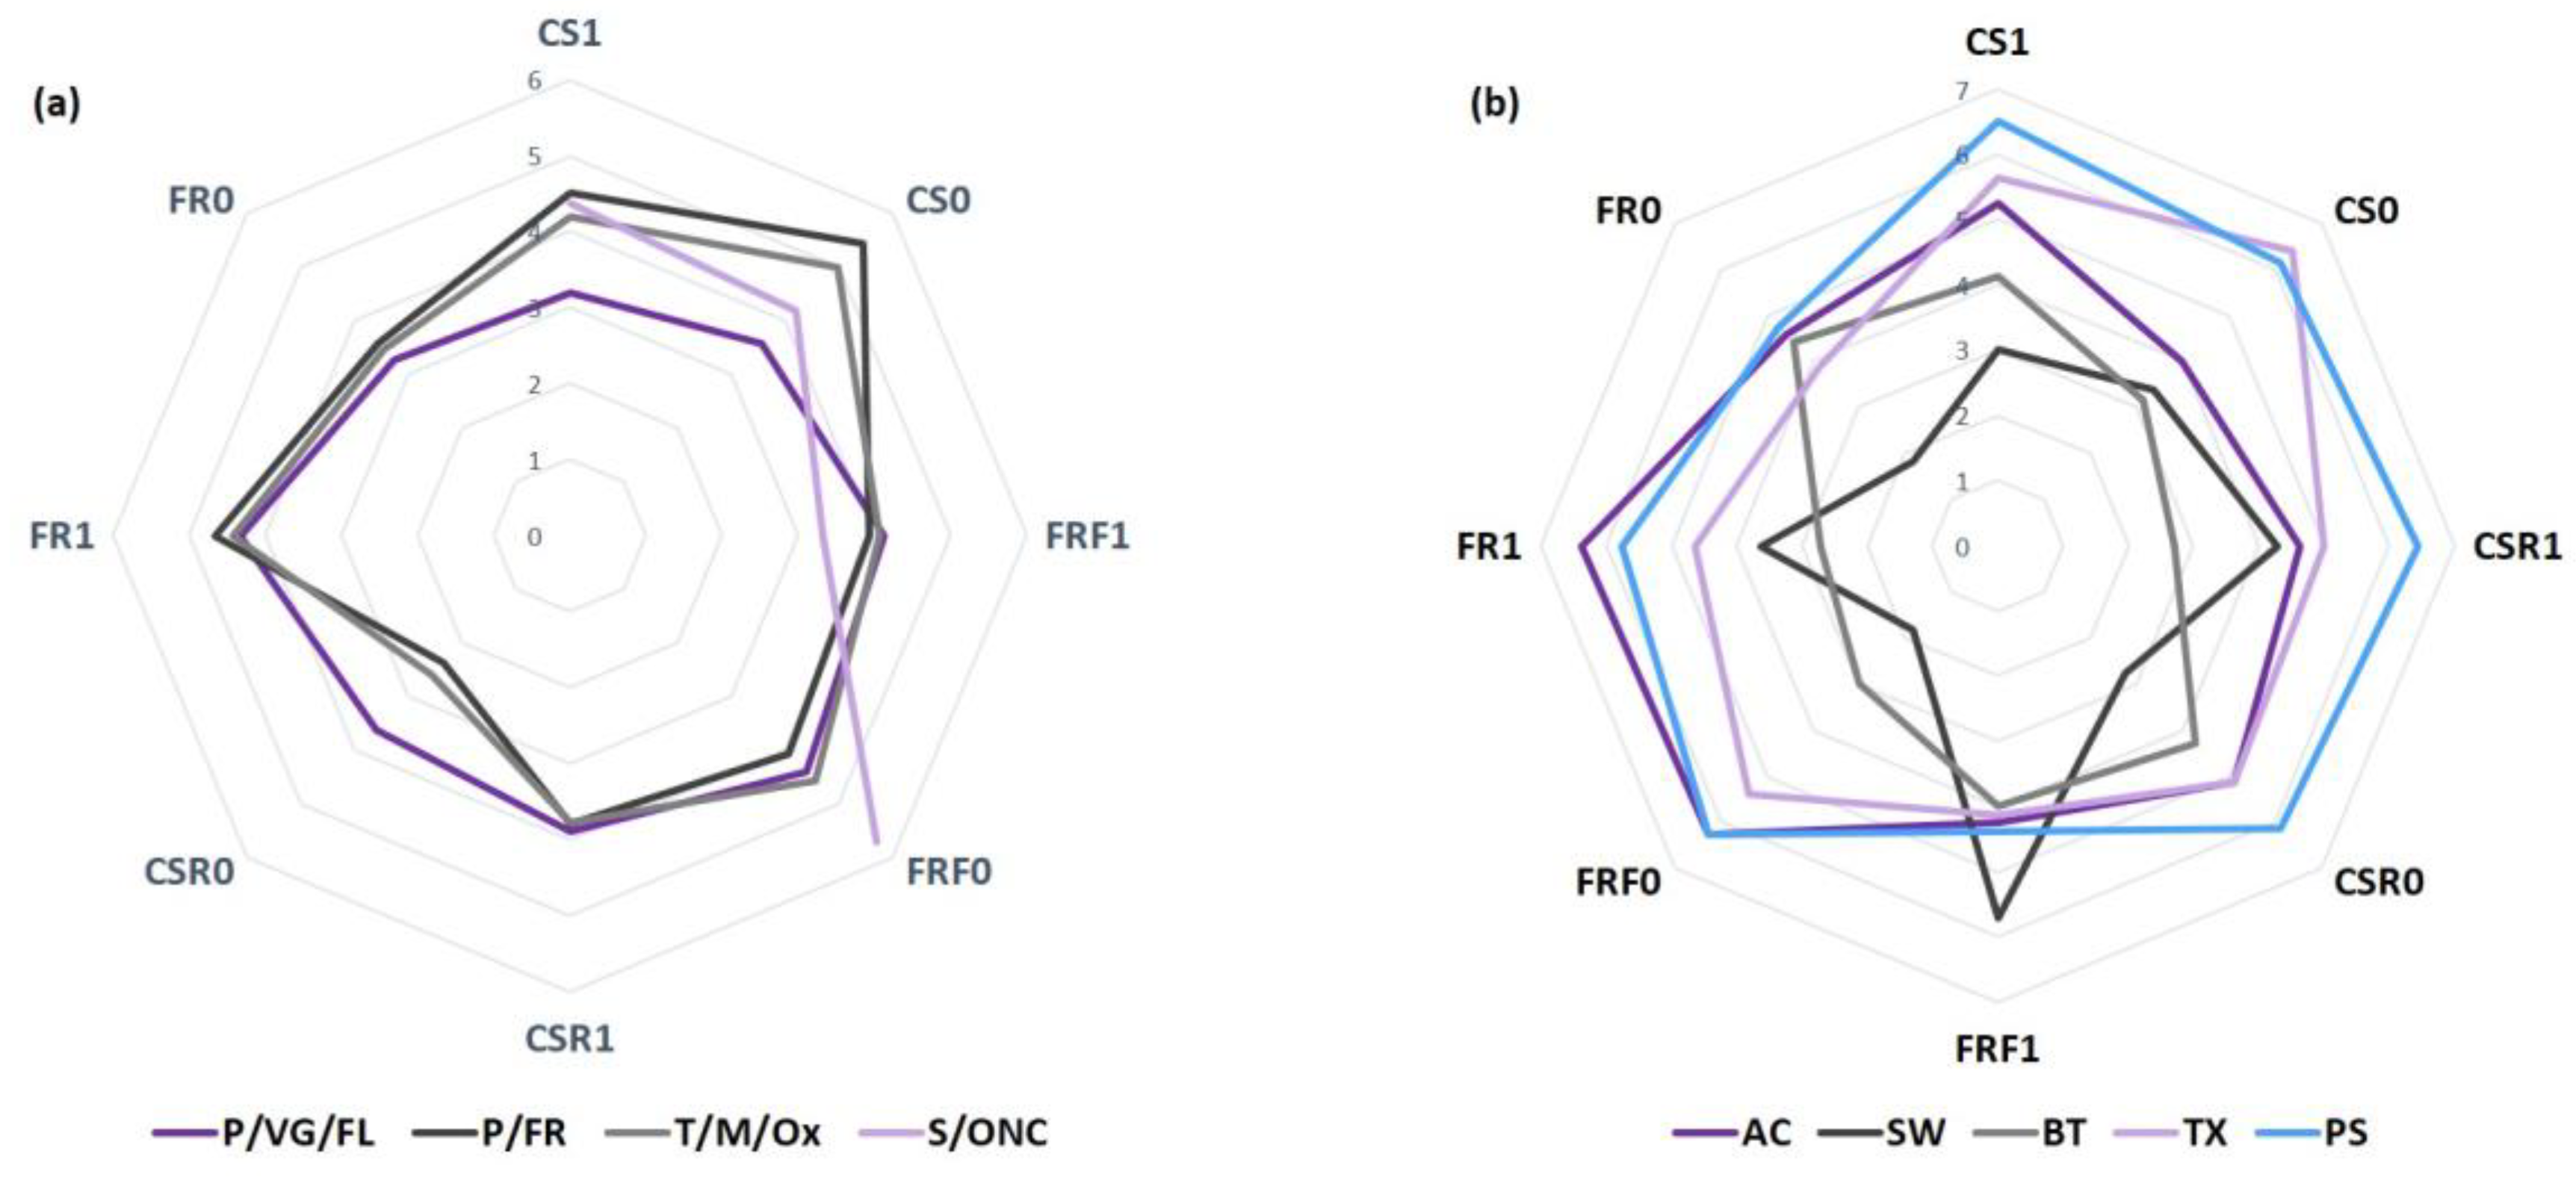
4.3. Sensory Analysis

Alternative winemaking methods involving the substitution of sulfur dioxide with tannin components and the protection of wines against refermentation had an impact on the levels of biogenic amines resulting from the transformations undergone by the amino acids. As mentioned, the amino acid reactions primarily involved decarboxylation, but there is a close relationship between amino acid variation and the production of volatile compounds, which can impact the sensory characteristics of wines.
Regarding olfactory descriptors, they were categorized into characteristic groups. Thus, they were grouped into categories such as primary (floral aromas, vegetal aromas, fruity (exotic fruits, red fruits, citrus fruits, and spicy)). On the other hand, secondary aromas were also grouped, including autolytic aromas (unctuous) and oak aromas, as well as tertiary aromas in the category characteristic of aging in the bottle (jam, tanned leather, dried plums (CS)) and deliberate oxidation (coffee, chocolate) (Figure 7a).
The sulfite-treated wine samples exhibited stronger aromas for fruity notes in all types of varieties included in the study: CS1 (4.51 ± 0.52), FR1 (3.93 ± 0.67), and FRF1 (3.93 ± 0.75). Although the values for floral notes were lower, it is noteworthy that, regarding the average values, they did not represent statistically significant differences compared to samples without sulfite addition.
A similar distribution was determined for fruity notes, especially fresh fruit notes, which are not associated with ripeness, and oxidative notes, which could bring unpleasant sensations to the wines. The average values for fruity aromas were higher for CSR1 (3.79 ± 1.25) compared to CSR0 (2.36 ± 0.58). Due to the dry wine character, values for tertiary aromas were lower for CSR0 (2.58 ± 1.12) compared to CSR1 (3.77 ± 0.65). The evident character of tertiary notes for rosé and red wines detected in the −SO2 samples could be explained by the higher content of volatile oxidation compounds, especially “roasted” fruits. Higher values were noted for CS0-type samples (5.44 ± 1.02), whereas for CS1, slightly superior perceptions were noted (4.51 ± 0.32). For the CSR0 variety (2.58 ± 1.56), lower values were noted for tertiary aromas compared to CSR1 (3.77 ± 0.62).
The sensory evaluation indicated that the timing and method of inoculation for malolactic fermentation (MLF) significantly affected the taste and aroma of the wines. In general, malolactic fermentation diversified the aromatic profile of the wines. Wines that underwent co-inoculation were observed to have higher levels of fruity, fresh, and floral sensations compared to wines that underwent sequential malolactic fermentation. The spontaneous process was perceived to produce wines with buttery and bitter aromas: 5.71 ± 0.25 (FRF0) and 3.33 ± 0.65 (FRF1). Pleasantly balanced aromas of butter and nut were also found in co-inoculated CS-type wines (CS0 (4.19 ± 1.25) and CS1 (4.38 ± 0.54)). Wines after sequential and spontaneous processes did not have nut aromas, but instead, strong butter aromas were noted [39].
Comparing the taste evaluation of different wine samples (Figure 7b), wines subjected to treatments without SO2 showed a slightly higher level of bitterness, but a comparable level of body and balance compared to the other wines. No significant differences were observed regarding taste and aroma between the two wine samples. Upon evaluation, wines subjected to treatment without SO2 presented a lower overall assessment, particularly concerning the quality of aroma and taste, compared to the reference wine samples. In general, the most noticeable differences were in the perception of acidity, for which CSR0 (5.13 ± 0.52) and FRF0 (6.25 ± 1.62) had slightly higher values compared to the reference samples. Conversely, the FR0 and CS0 samples had lower values compared to the reference samples, with significant differences in the case of FR, being 4.57 ± 0.52 (FR0) compared to 6.38 ± 1.25 (FR1).
The oxidative degradation of white wines quickly leads to the loss of their sensory qualities, especially the loss of floral and fruity aromas specific to young wines or the formation of new unusual aromas associated with wine deterioration, and subsequently, to undesirable chromatic changes (the development of brown color) [40].

5. Conclusions

The evaluation of biogenic amines and amino acids in wines with low sulfur dioxide content was conducted, considering their significance in various stages of wine production, including must preparation, fermentation, corrections, and treatments. As expected, the highest concentrations of amino acids were found for Cabernet Sauvignon, continuing with Cabernet Sauvignon rosé and white wines (Fetească regală and Fetească regală frizzante). Mechanisms of biogenic amine production were proposed, focusing on direct decarboxylation reactions, as well as alternative pathways, particularly for putrescine and spermidine production. Considering the two major alternative sources of biogenic amine production from glutamine and arginine, a double correlation was considered to verify which yielded a higher direct correlation based on the results obtained for all types of wine, differentiated based on added sulfur dioxide.
The evaluation of the wines without sulfur dioxide did not show any drastic changes of the biogenic amines or amino acids that could be attributed to specific reactions in the wine samples. The pH was a key factor for the production of BA; for instance, from the series of biogenic amines, decarboxylation to CAD is favored by one of the highest values of the pH. Studies have shown that the reaction is favored by pH values up to 8.0 at high temperatures of 50 °C. We verified the pH values of all the wines, and the stability values showed that, in all cases, the values were maintained at a maximum of 3.9–4.0. This ensured minimization of the reactions. As a result, only putrescine showed slightly increased values, although they remained below the perception threshold. This occurred because studies have indicated that the use of lactic acid can enhance the formation of cadaverine. In our case, to mitigate the astringency of the wines, acidity correction was performed using lactic acid instead of tartaric acid. To limit the content of amino acids and biogenic amines, one approach was the use of bentonite and other clarification agents that impact all protein components. Therefore, we conducted a comparative study between stabilized samples and intermediate samples for frizzante wines. These wines were in contact with wine lees due to the second fermentation in bottles. This comparison revealed some differences with respect to other types of wines. Regarding the sensory impact, the increase in the aroma intensity score in sulfited wines is possibly related to the presence of sulfur dioxide. A clear difference was observed in malolactic-fermented wines compared to sulfited wines, while the taste balance in wines with malolactic fermentation was still comparable. Finally, the aroma quality, body, aftertaste, and overall acceptance of the tannin-treated wine samples were highly appreciated and received the highest scores.

Author Contributions

Conceptualization, S.M. and V.V.C.; methodology, B.-I.C. and M.N.; software, C.-B.N.; validation, B.-I.C., M.N. and V.V.C.; formal analysis, B.-I.C.; investigation, S.M.; resources, S.M.; writing—original draft preparation, B.-I.C.; writing—review and editing, M.N.; supervision, V.V.C.; project administration, V.V.C. All authors have read and agreed to the published version of the manuscript.

Funding

This research received no external funding.

Institutional Review Board Statement

Not applicable.

Informed Consent Statement

Not applicable.

Data Availability Statement

Details regarding the data supporting the reported results can be found at the Research Center of Oenology, Romanian Academy, Iași Branch, 9th Mihail Sadoveanu Alley, 700505 Iași, Romania, [email protected].

Conflicts of Interest

The authors declare no conflicts of interest.

References

  1. Zamora, F. Biochemistry of Alcoholic Fermentation. In Wine Chemistry and Biochemistry; Victoria Moreno-Arribas, M., Carmen Polo, M., Eds.; Springer: New York, NY, USA, 2009; pp. 3–26. [Google Scholar]
  2. Cosme, F.; Vilela, A. Chitin and chitosan in the alcoholic and non-alcoholic beverage industry: An overview. Appl. Sci. 2021, 11, 11427. [Google Scholar] [CrossRef]
  3. López-Rituerto, E.; Avenoza, A.; Busto, J.H.; Peregrina, J.M. Evidence of metabolic transformations of amino acids into higher alcohols through 13c nmr studies of wine alcoholic fermentation. J. Agric. Food Chem. 2010, 58, 4923–4927. [Google Scholar] [CrossRef] [PubMed]
  4. Lilly, M.; Bauer, F.F.; Styger, G.; Lambrechts, M.G.; Pretorius, I.S. The effect of increased branched-chain amino acid transaminase activity in yeast on the production of higher alcohols and on the flavour profiles of wine and distillates. FEMS Yeast Res. 2006, 6, 726–743. [Google Scholar] [CrossRef] [PubMed]
  5. García-Ruiz, A.; González-Rompinelli, E.M.; Bartolomé, B.; Moreno-Arribas, M.V. Potential of wine-associated lactic acid bacteria to degrade biogenic amines. Int. J. Food Microbiol. 2011, 148, 115–120. [Google Scholar] [CrossRef] [PubMed]
  6. Yıldırım, H. Alternative methods of sulfur dioxide used in wine production. J. Microbiol. Biotechnol. Food Sci. 2020, 9, 675–687. [Google Scholar] [CrossRef]
  7. Santos, M.C.; Nunes, C.; Saraiva, A.J.; Coimbra, J.A. Chemical and physical methodologies for the replacement/reduction of sulfur dioxide use during winemaking: Review of their potentialities and limitations. Eur. Food Res. Technol. 2012, 234, 1–12. [Google Scholar] [CrossRef]
  8. Guo, Y.Y.; Yang, Y.P.; Peng, Q.; Han, Y. Biogenic amines in wine: A review. Int. J. Food Sci. Technol. 2015, 50, 1523–1532. [Google Scholar] [CrossRef]
  9. Stojanović, Z.; Kos, J. Detection of Metabolites of Microbial Origin in Beverages with Harmful Effect on Human Health—Biogenic Amines and Mycotoxins. In Safety Issues in Beverage Production; Grumezescu, A., Holban, A.M., Eds.; Elsevier: San Diego, CA, USA, 2020; pp. 39–77. [Google Scholar]
  10. Lonvaud-Funel, A. Biogenic amines in wines: Role of lactic acid bacteria. FEMS Microbiol. Lett. 2001, 199, 9–13. [Google Scholar] [CrossRef] [PubMed]
  11. Casas-Godoy, L.; Arellano-Plaza, M.; Kirchmayr, M.; Barrera-Martínez, I.; Gschaedler-Mathis, A. Preservation of non-Saccharomyces yeasts: Current technologies and challenges. Compr. Rev. Food Sci. Food Saf. 2021, 20, 3464–3503. [Google Scholar] [CrossRef]
  12. Morata, A.; Loira, I.; Vejarano, R.; González CCallejo, M.J.; Suárez-Lepe, J.A. Emerging preservation technologies in grapes for winemaking. Trends Food Sci. Technol. 2017, 67, 36–43. [Google Scholar] [CrossRef]
  13. Mendes Ferreira, A.; Mendes-Faia, A. The role of yeasts and lactic acid bacteria on the metabolism of organic acids during winemaking. Foods 2020, 9, 1231. [Google Scholar] [CrossRef] [PubMed]
  14. Pereira, V.; Pereira, A.C.; Pérez Trujillo, J.P.; Cacho, J.; Marques, J.C. Amino acids and biogenic amines evolution during the estufagem of fortified wines. J. Chem. 2015, 2015, 494285. [Google Scholar] [CrossRef]
  15. Scutarașu, E.C.; Luchian, C.E.; Cioroiu, I.B.; Trincă, L.C.; Cotea, V.V. Increasing amino acids content of white wines with enzymes treatments. Agronomy 2022, 12, 1406. [Google Scholar] [CrossRef]
  16. Tedesco, F.; Siesto, G.; Pietrafesa, R.; Romano, P.; Salvia, R.; Scieuzo, C.; Falabella, P.; Capece, A. Chemical methods for microbiological control of winemaking: An overview of current and future applications. Beverages 2022, 8, 58. [Google Scholar] [CrossRef]
  17. Costantini, A.; Vaudano, E.; Pulcini, L.; Carafa, T.; Garcia-Moruno, E. An overview on biogenic amines in wine. Beverages 2019, 5, 19. [Google Scholar] [CrossRef]
  18. Henríquez-Aedoa, K.; Galarce-Bustos, O.; Aqueveque, P.; García, A.; Aranda, M. Dynamic of biogenic amines and precursor amino acids during Cabernet Sauvignon vinification. LWT 2018, 97, 238–244. [Google Scholar] [CrossRef]
  19. Smit, A.Y.; du Toit, W.J.; du Toit, M. Biogenic amines in wine: Understanding the headache. South Afr. J. Enol. Vitic. 2008, 29, 109–127. [Google Scholar] [CrossRef]
  20. Cruzat, V.; Rogero, M.M.; Keane, K.N.; Curi, R.; Newsholme, P. Glutamine: Metabolism and immune function, supplementation and clinical translation. Nutrients 2018, 10, 1564. [Google Scholar] [CrossRef] [PubMed]
  21. Clemente, G.S.; van Waarde, A.; Antunes, I.F.; Dömling, A.; Elsinga, P.H. Arginase as a potential biomarker of disease progression: A molecular imaging perspective. Int. J. Mol. Sci. 2020, 21, 5291. [Google Scholar] [CrossRef]
  22. Ayestaran, B.; Acin, C.; Corroza, M.; Garrido, J. Changes in free amino acid concentration during stabilization and aging of wines derived from garnacha and viura musts clarified by static sedimentation. Food Control 1996, 7, 157–163. [Google Scholar] [CrossRef]
  23. González-Royo, E.; Pascual, O.; Kontoudakis, N.; Esteruelas, M.; Esteve-Zarzoso, B.; Mas, A.; Canals, J.M.; Zamora, F. Oenological consequences of sequential inoculation with non-Saccharomyces yeasts (Torulaspora delbrueckii or Metschnikowia pulcherrima) and Saccharomyces cerevisiae in base wine for sparkling wine production. Eur. Food Res. Technol. 2015, 240, 999–1012. [Google Scholar] [CrossRef]
  24. Doeun, D.; Davaatseren, M.; Chung, M.S. Biogenic amines in foods. Food Sci. Biotechnol. 2017, 26, 1463–1474. [Google Scholar] [CrossRef] [PubMed]
  25. Héberger, K.; Csomós, E.; Simon-Sarkadi, L. Principal component and linear discriminant analyses of free amino acids and biogenic amines in hungarian wines. J. Agric. Food Chem. 2003, 51, 8055–8060. [Google Scholar] [CrossRef] [PubMed]
  26. Płotka-Wasylka, J.; Simeonov, V.; Morrison, C.; Namieśnik, J. Impact of selected parameters of the fermentation process of wine and wine itself on the biogenic amines content: Evaluation by application of chemometric tools. Microchem. J. 2018, 142, 187–194. [Google Scholar] [CrossRef]
  27. Arena, M.E.; Landete, J.M.; Manca de Nadra, M.C.; Pardo, I.; Ferrer, S. Factors affecting the production of putrescine from agmatine by Lactobacillus hilgardii X1B isolated from wine. J. Appl. Microbiol. 2008, 105, 158–165. [Google Scholar] [CrossRef] [PubMed]
  28. Anlı, R.E.; Bayram, M. Biogenic amines in wines. Food Rev. Int. 2009, 25, 86–102. [Google Scholar] [CrossRef]
  29. Paramithiotis, S.; Stasinou, V.; Tzamourani, A.; Kotseridis, Y.; Dimopoulou, M. Malolactic fermentation—Theoretical advances and practical considerations. Fermentation 2022, 8, 521. [Google Scholar] [CrossRef]
  30. Esposito, F.; Montuori, P.; Schettino, M.; Velotto, S.T.; Stasi SRomano, R.; Cirillo, T. Level of biogenic amines in red and white wines, dietary exposure and histamine-mediated symptoms upon wine ingestion. Molecules 2019, 24, 3629. [Google Scholar] [CrossRef] [PubMed]
  31. Beneduce, L.; Romano, A.; Capozzi, V.; Lucas, P.; Barnavon, L.; Bach, B.; Vuchot, P.; Grieco, F.; Spano, G. Biogenic amine in wines. Ann. Microbiol. 2010, 60, 573–578. [Google Scholar] [CrossRef]
  32. Perestrelo, R.; Silva, C.; Gonçalves, C.; Castillo, M.; Câmara, J.S. An approach of the Madeira wine chemistry. Beverages 2020, 6, 12. [Google Scholar] [CrossRef]
  33. Jacob, F.F.; Striegel, L.; Rychlik, M.; Hutzler, M.; Methner, F.J. Spent yeast from brewing processes: A biodiverse starting material for yeast extract production. Fermentation 2019, 5, 51. [Google Scholar] [CrossRef]
  34. Karamanidou, A.; Kallithraka, S.; Hatzidimitriou, E. Fining of red wines: Effects on their analytical and sensory parameters. J. Int. Sci. Vigne. Vin. 2010, 45, 47–60. [Google Scholar] [CrossRef]
  35. Buxaderas, S.; López-Tamames, E. Sparkling wines: Features and trends from tradition. Adv. Food Nutr. 2012, 66, 1–45. [Google Scholar]
  36. Espinase Nandorfy, D.; Watson, F.; Likos, D.; Siebert, T.; Bindon, K.; Kassara, S.; Shellie, R.; Keast, R.; Francis, I.L. Influence of amino acids, and their interaction with volatiles and polyphenols, on the sensory properties of red wine. Aust. J. Grape Wine Res. 2022, 28, 621–637. [Google Scholar] [CrossRef]
  37. Dimopoulou, M.; Troianou, V.; Paramithiotis, S.; Proksenia, N.; Kotseridis, Y. Evaluation of malolactic starters in white and rosé winemaking of Moschofilero wines. Appl. Sci. 2022, 12, 5722. [Google Scholar] [CrossRef]
  38. Prida, A.; Chatonnet, P. Impact of oak-derived compounds on the olfactory perception of barrel-aged wines. Am. J. Enol. Vitic. 2010, 61, 408–413. [Google Scholar] [CrossRef]
  39. Lloret, A.; Boido, E.; Lorenzo, D.; Medina, K.; Carrau, F.; Dellacassa, E. Aroma variation in Tannat wines: Effect of malolactic fermentation on ethyl lactate level and its enantiomeric distribution. IJFS 2002, 14, 175–180. [Google Scholar]
  40. Ferreira, A.C.S.; De Pinho, P.G.; Rodrigues, P.; Hogg, T. Kinetics of oxidative degradation of white wines and how they are affected by selected technological parameters. J. Agric. Food Chem. 2002, 50, 5919–5924. [Google Scholar] [CrossRef]
Figure 1. Schematic representation of principal steps of vinification procedure.
Fermentation 10 00302 g001
Figure 2. Chromatograms for biogenic amines: (a) FENM-Rt = 8.91; TRPM-Rt = 7.72; ETH-Rt = 4.27; TYRM-Rt = 3.85; HISM-Rt = 3.71; PUT-Rt = 3.48; CAD-Rt = 3.62; SPD-Rt = 9.92. (b) SER-Rt = 1.67; GLU-Rt = 1.67; FEN-Rt = 6.71; TRP-Rt = 8.30; TYR-Rt = 4.01; LYS-Rt = 2.89; ARG-Rt = 2.52.; HIS-Rt = 3.22.
Fermentation 10 00302 g002
Figure 3. Correlation coefficients for multiple evaluations of the continuous evolution of the concentrations for biogenic amines (BAs) in relation to the corresponding amino acids (AAs). (a) CS, Pres: −SO2 GLU:SPD: r = −0.9985; p < 0.05; (b) FRF, Pres: +SO2 ARG:SPD: r = 0.9877; p < 0.05; (c) CSR, Pres: −SO2 PUT:GLU: r = −0.9595; p < 0.05; (d) CSR, Pres: −SO2 PUT:GLU: r = −0.9625; p < 0.05.
Fermentation 10 00302 g003
Figure 4. Ratio of concentrations (mg/L) for AAs in raw wines (RWs) and in stabilized wines (RS).
Fermentation 10 00302 g004
Figure 5. Principal component analysis. (a) Correlation between variables and principal components (PCs) PC1 (26.1%) vs. PC2 (17.1%). (b) Biplot of the distribution of samples on the factor map.
Fermentation 10 00302 g005
Figure 6. Proposed mechanism of decarboxylation and deamination to convert amino acids in biogenic amines ethanollamine (ETH), putrescine (PUT), tyramine (TYRM), cadaverine (CAD), histamine (HISM), phenylethylamine (PHEM), tryptamine (TRPM), and spermidine (SPD) and L-Serine (SER), L-glutamine (GLU), L-phenylalanine (PHE), L-Tryptophan (TRP), L-tyrosine (TYR), L-lysine (LYS), L-arginine (ARG), and L-histidine (HIS).
Fermentation 10 00302 g006
Figure 7. Radar chart graphs corresponding to the sensory analysis results for the wines included in the study. (a) Olfactory parameters (primary vegetal/floral (P/VG/FL), primary fruity (P/FR), secondary unctuous/mineral (S/ONC), tertiary maturation/oxidation (T/M/Ox)); (b) taste parameters: AC-Acidic; SW-Sweet; BT-bitter; TX–Texture; PS-persistence.
Fermentation 10 00302 g007
Table 1. Mass spectrometry conditions for the determination of amino acids and biogenic amines. Molecular ion [M + H]+ (m/z), [M − N]+ characteristic fragment (m/z); CE (V)-optimized collision energy in Q2.
[M + H]+ (m/z)[M − N]+ (m/z)CE (V)Retention Time (min)
L-Serine (SER)106.160.18101.67
L-glutamine (GLU)147.2184.1171.67
L-Phenylalanine (PHE)166.1120.16106.71
L-Tryptophan (TRP)205.1146.02108.30
L-Tyrosine (TYR)182.1991.05274.01
L-Lysine (LYS)147.1984.11152.89
L-Arginine (ARG)175.270.2112.52
L-Histidine (HIS)156.1110.5103.22
Phenylamine (PHEM)120.2102.06148.91
Tryptamine (TRPM)161.3144.07107.72
Ethanolamine (ETH)177.25160.0584.27
Tyramine (TYRM)138.1121.1283.85
Histamine (HISM)112.195.1123.71
Putrescine (PUT)89.1572.2183.48
Cadaverine (CAD)103.186.1473.62
Spermidine (SPD)203.2112.12109.92
Table 2. Distribution of biogenic amines and amino acids according to the variety (CS, CSR, FR, and FRF) and according to the SO2 treatment (T—type of fermentation; V—wine variety).
TV.ETHSERPUTGLUTYRMTYRCADLYSHYSMHYSPHEMPHETRPMTRPSPDARG
MFCS112.31 ± 1.820.18 ± 2.935.91 ± 2.314.29 ± 12.914.62 ± 1.51.19 ± 0.84.44 ± 1.022.61 ± 2.90.63 ± 0.067.66 ± 0.60.12 ± 0.0213.82 ± 1.00.06 ± 0.024.42 ± 0.47.27 ± 0.19.42 ± 7.4
AFCSR19.51 ± 1.910.02 ± 1.517.01 ± 2.413.67 ± 10.91.97 ± 1.52.87 ± 1.31.44 ± 0.641.54 ± 9.02.00 ± 1.667.60 ± 0.50.15 ± 0.118.65 ± 3.90.06 ± 0.022.73 ± 0.75.49 ± 1.412.40 ± 9.2
AFFR110.03 ± 2.910.13 ± 4.223.77 ± 5.54.38 ± 2.30.12 ± 0.043.86 ± 1.60.55 ± 0.226.85 ± 7.52.67 ± 2.268.64 ± 2.30.17 ± 0.012.04 ± 3.40.04 ± 0.02.88 ± 1.39.79 ± 7.25.37 ± 1.8
AFFRF112.78 ± 2.37.13 ± 1.820.78 ± 3.22.22 ± 1.00.43 ± 0.34.48 ± 1.30.28 ± 0.024.13 ± 6.50.44 ± 0.166.79 ± 1.10.15 ± 0.112.43 ± 2.80.03 ± 0.011.98 ± 0.82.56 ± 1.210.40 ± 5.8
MFCS013.18 ± 2.611.73 ± 1.931.25 ± 2.932.19 ± 17.14.85 ± 3.22.52 ± 0.64.36 ± 1.223.15 ± 8.00.85 ± 0.168.03 ± 1.00.09 ± 0.0113.28 ± 2.90.06 ± 0.012.83 ± 0.88.09 ± 0.715.16 ± 8.0
MFCSR06.06 ± 2.35.25 ± 0.623.72 ± 4.815.63 ± 14.20.59 ± 0.24.53 ± 1.20.92 ± 0.324.06 ± 4.01.08 ± 0.664.83 ± 4.10.09 ± 0.0211.03 ± 2.10.04 ± 0.011.37 ± 0.84.05 ± 1.78.14 ± 7.7
MFFR011.93 ± 1.313.67 ± 2.326.26 ± 7.08.94 ± 6.50.06 ± 0.065.79 ± 2.11.28 ± 0.541.87 ± 5.32.33 ± 2.066.96 ± 1.40.14 ± 0.0118.20 ± 2.70.05 ± 0.02.24 ± 0.72.94 ± 0.98.03 ± 4.2
MFFRF014.58 ± 1.36.85 ± 3.615.86 ± 4.71.32 ± 0.30.25 ± 0.13.77 ± 1.01.48 ± 0.813.21 ± 2.60.17 ± 0.070.97 ± 0.60.21 ± 0.19.79 ± 3.20.05 ± 0.020.85 ± 0.10.99 ± 0.213.13 ± 5.4
Table 3. Average values for biogenic amines and amino acids as a function of the variation during the wine aging period.
YEARETHSERPUTGLUTYRMTYRCADLYSHISMHISPHEMPHETRPMTRPSPDARG
20189.05 ± 1.7011.38 ± 2.427.78 ± 4.51.21 ± 0.13.39 ± 2.13.35 ± 0.81.92 ± 0.628.53 ± 3.92.51 ± 1.369.00 ± 0.80.14 ± 0.0314.49 ± 1.80.06 ± 0.012.07 ± 0.84.84 ± 1.14.13 ± 3.1
201912.42 ± 1.411.34 ± 1.426.77 ± 2.22.09 ± 0.52.18 ± 1.52.77 ± 0.52.47 ± 0.726.55 ± 3.00.47 ± 0.168.37 ± 0.50.13 ± 0.0313.11 ± 1.10.05 ± 0.0022.04 ± 0.44.73 ± 1.13.51 ± 2.2
202010.43 ± 1.410.68 ± 2.922.35 ± 2.99.54 ± 6.92.42 ± 1.93.27 ± 0.71.57 ± 0.723.62 ± 4.10.51 ± 0.167.97 ± 1.10.13 ± 0.0211.77 ± 1.60.04 ± 0.012.38 ± 0.57.58 ± 3.510.35 ± 3.0
202113.30 ± 1.59.07 ± 2.320.37 ± 4.033.47 ± 9.03.46 ± 2.25.11 ± 1.41.41 ± 0.730.00 ± 8.21.59 ± 0.765.39 ± 2.00.15 ± 0.0315.25 ± 3.30.05 ± 0.013.16 ± 0.43.42 ± 1.123.04 ± 4.5
Table 4. Average values for biogenic amines and amino acids as a function of the variation during the wine aging period (* p < 0.05).
CSCSRFRFRF
(r/p)−SO2+SO2−SO2+SO2−SO2+SO2−SO2+SO2
SPD:ARG−0.991 *0.3000.561−0.915−0.991 *0.3630.201−0.980 *
0.010.700.440.090.010.640.800.02
TRPM:TRP0.956 *−0.814−0.763−0.995 *0.999 *0.9090.903−0.736
0.040.190.240.010.000.090.100.26
PHEM:PHE0.862−0.4080.6940.682−0.1890.6010.998 *0.912
0.140.590.310.320.810.400.000.09
HYSM:HYS−0.376−0.632−0.987 *−0.2470.3900.563−0.8570.453
0.620.370.010.750.610.440.140.55
CAD:LYS−0.7860.919−0.5080.499−0.9060.964 *0.998 *−0.593
0.210.080.490.500.090.040.000.41
TYRM:TYR0.7420.7680.915−0.652−0.8590.8610.1760.493
0.260.230.080.350.140.140.820.51
ETH:SER0.703−0.0470.625−0.4030.3850.9390.8230.919
0.300.950.380.600.620.060.180.08
PUT:GLU−0.052−0.747−0.883−0.2560.555−0.7570.767−0.909
0.950.250.120.740.450.240.230.09
Table 5. Average values for TA—total acidity (g tartaric acid/L), AC—alcohol content (g/L), VA—volatile acidity (g acetic acid/L), SO2 free—content of free sulfur dioxide (mg/L); SO2 total—content of total sulfur dioxide (mg/L); RS—residual sugar (g/L).
VarietyACTAVASO2 FreeSO2 TotalRSpH
CS+SO213.4 ± 0.076.7 ± 1.010.43 ± 0.0620.3 ± 0.2849.2 ± 1.064.5 ± 0.733.6 ± 0.01
−SO213.4 ± 0.206.6 ± 0.320.66 ± 0.034.9 ± 0.1110.1 ± 0.292.9 ± 0.903.1 ± 0.02
CSr+SO212.3 ± 0.956.9 ± 0.900.47 ± 0.0741.0 ± 1.750.6 ± 11.549.0 ± 0.603.1 ± 0.06
−SO213.6 ± 0.036.1 ± 0.070.63 ± 0.074.7 ± 0.310.2 ± 0.350.7 ± 0.013.1 ± 0.03
FR+SO212.1 ± 0.566.1 ± 0.030.48 ± 0.0438.5 ± 0.750.5 ± 4.958.0 ± 1.313.1 ± 0.04
−SO212.2 ± 0.076.1 ± 0.100.34 ± 0.017.5 ± 3.512.0 ± 2.821.6 ± 0.033.2 ± 0.07
FRF+SO212.9 ± 0.426.0 ± 0.740.37 ± 0.1836.0 ± 1.856.5 ± 9.191.8 ± 0.043.2 ± 0.05
−SO211.3 ± 0.706.1 ± 0.030.34 ± 0.044.9 ± 0.2110.5 ± 0.700.7 ± 0.353.2 ± 0.07
Disclaimer/Publisher’s Note: The statements, opinions and data contained in all publications are solely those of the individual author(s) and contributor(s) and not of MDPI and/or the editor(s). MDPI and/or the editor(s) disclaim responsibility for any injury to people or property resulting from any ideas, methods, instructions or products referred to in the content.

