Abstract
While the transcriptional responses of yeast cells to a variety of individual stress conditions have been extensively studied, their responses to sequential stress conditions are less well understood. In this study, we present a comparative analysis of the transcriptome of an industrial strain and a laboratory strain exposed to different sequential stresses to establish a common response profile and also to identify genes whose expression is strain-dependent. Both strains induce pathways related to oxidative stress and osmotic stress response including those involved in glycerol synthesis, glutathione metabolism, and NADPH regeneration. Other genes that may also play an important role in this response include the transcription factor ADR1, SYM1, and most of the heat shock proteins. Induction of genes related to autophagy of mitochondria occurred only in the laboratory strain while possible stress tolerance factors, such as additional genes involved in glutathione production and detoxification, were uniformly enhanced only in the industrial strain. The analysis of the stress response to sequential stresses of two different strains allowed more precise identification of the response of yeast to complex environments. Identification of genes uniquely induced in the industrial strain can also be used to develop strategies to optimize various fermentation processes.
1. Introduction
Fermentation is an established process for producing alcoholic beverages, fuel, and other byproducts. Commercial fermentation is most often achieved by use of Saccharomyces cerevisiae strains since their fermentative behavior and technological properties are well characterized and the strains yield uniform products of reproducible quality [1]. During fermentation, yeast cells experience sequential changes in environmental conditions, subjecting them to different stressors such as high osmolarity, increased ethanol, and elevated temperature. Understanding the complexity of this response is an important step in manipulating the strains’ physiology for optimal fermentation [2,3].
Yeast maintains homeostasis in response to changing environments primarily through transcriptional regulation [4,5,6]. The transcriptional stress response in the yeast S. cerevisiae has been characterized through many case studies, including those performed on industrial strains [7,8,9,10] as well as laboratory strains [6,11,12,13]. However, the yeast response to sequential stresses is less well understood.
Our recent study [14], which investigated the yeast response to sequential stresses in a stress-resistant industrial strain, provided a global overview of the response and highlighted several processes that may be involved in tolerance acquisition. However, since yeast strains exhibit genetic variations that have a direct impact on gene expression and phenotypic diversity [15], we compare here the transcriptional response of an industrial multi-tolerant strain with that of a laboratory strain to investigate the strain-specific similarities and diversities in the stress response [14]. Identification of genes induced uniquely in the tolerant strain could be used to predict interesting phenotypes and serve as baseline knowledge to construct more tolerant and stress-resistant strains.
2. Materials and Methods
2.1. Yeast Strain, Culture Conditions, and Experimental Design
Strain Y3854 (W303 MATa MSN2-GFP) was derived from strain W303. Yeast cells were grown at 30 °C with aeration in a liquid Synthetic Complete medium (SC, yeast nitrogen base without amino acids, 2% glucose) to the exponential growth phase before exposure to sequential stresses. The following stress treatments were applied:
1. Osmotic stress followed by ethanol stress: cells were incubated in liquid SC containing 1 M sorbitol for 30 min at 28 °C followed by incubation in SC supplemented with 8% (v/v) ethanol for 30 min at 28 °C at 160 rpm.
2. Oxidative stress followed by ethanol stress: oxidative stress was applied with hydrogen peroxide by incubating the cells in SC complemented with 0.6 mM H2O2 for 30 min and then the cells were incubated in SC supplement with 8% (v/v) ethanol for 30 min at 28 °C at 160 rpm.
3. Glucose withdrawal followed by ethanol stress: glucose withdrawal was performed with inoculation of yeast cells in SC with 0.05% of glucose for 30 min followed by incubation in SC supplement with 8% (v/v) ethanol for 30 min at 28 °C at 160 rpm.
In all treatments, the samples were collected before the first stress (control), after the first stress, and after the second stress (ethanol stress) for RNA extraction. Experiments were performed in triplicate.
2.2. RNA Preparation, Library Construction, and Sequencing
The total RNA from three biological replicates for each treatment was extracted using the Qiagen RNeasy Mini kit (Qiagen, Hilden, Germany). Samples were quantified on a Nanodrop 2000 spectrophotometer (Thermo Scientific, Waltham, MA, USA) and their integrity was evaluated by the Agilent Bioanalyzer 2100 system using the RNA Nano 6000 Assay Kit (Agilent Technologies, Santa Clara, CA, USA). Poly-A tailed RNA was captured and reverse transcribed to complementary DNA (cDNA) for library preparation. Paired-end reads were sequenced on an Illumina NovaSeq6000 instrument.
2.3. Mapping, Annotation, and Gene Expression Analysis
After trimming and filtering, paired-end reads were aligned to the reference genome of S. cerevisiae S288c via HISAT2 software (v. 2.0.1) [16]. HTSeq (v. 0.11.2) was used to count the number of read pairs per gene [17]. Paired read counts were also generated using HTSeq for the BT0510 dataset described by Costa et al. [14]. Downstream analysis was performed with R (v. 4.3.1) [18]. Read counts were imported into edgeR (v. 3.42.4) and counts were normalized to library size [19]. Differential gene expression was performed with Limma-Voom [20]. Genes showing an absolute value of the log2-fold change between treatment and control greater than 1 with a p-value < 0.05 (following the Benjamini and Hochberg correction) were considered to be differentially expressed genes (DEGs). Pathway analysis was performed using Cluster Profiler (v. 4.8.3) [21] and DAVID [22,23]. The enriched pathways highlighted in DAVID Functional Annotation tool were retrieved from the Kyoto Encyclopedia of Genes and Genomes (KEGG) database. GO terms with FDR < 0.05 were considered to be significantly enriched within the gene set. The identified enriched KEGG pathways (FDR < 0.05) are reported. Volcano plots and graphs were produced using ggplot2 [24].
2.4. Comparative Analysis
The list of genes differentially expressed in all stress treatments was compared with the DEGs from an industrial strain, BT0510, that was exposed to the same sequential stresses. The BT0510 transcriptome was analyzed in a previous work to assess the sequential stress response in a multi-tolerant strain [14].
3. Results and Discussion
3.1. Stress Response Profile Comparisons for the Industrial and the Laboratory Yeast Strains
In a previous study [14], we investigated the transcriptional responses to sequential stresses in an industrial, multi-stress tolerant strain. Transcriptome analysis provided a global view of the response and revealed a number of genes that were induced in all stresses and may play a role in tolerance. Most industrial strains have evolved to be exceptionally capable of surviving sudden and harsh environmental changes and identification of tolerant strains and their characteristics is important for the improvement of different fermentative processes [25]. Understanding the similarities and differences between the stress response of an industrial and a laboratory strain could provide baseline knowledge to understand the ongoing progress and nature of stress response. In this study, we examined the transcriptional response of a laboratory strain to the three different sequential stress regimens we had previously subjected an industrial strain to. Supervised clustering of the transcript levels of the most variable 2000 genes of the 2 strains in the 3 different stress regimens reveal a number of distinct patterns but indicate that the 2 strains behave similarly for the most part (Figure 1).
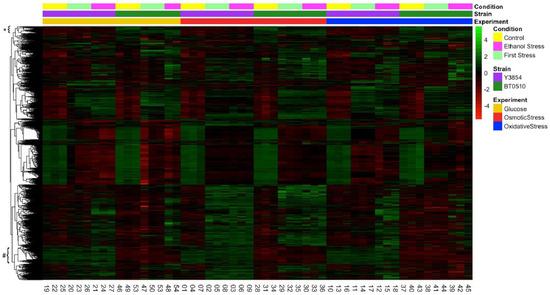
Figure 1.
Comparative responses of an industrial and a laboratory strain to sequential stress. Shown is a heat map of the relative transcript levels of the 2000 most variable genes in 2 strains during exponential growth in a rich medium (Control), following transfer to 1 of 3 stress conditions (First Stress, as indicated in the legend under Experiment), and then followed by transfer to ethanol medium (Ethanol Stress). All experiments were performed in triplicate with all samples shown separately. The values for each gene were mean normalized across all experiments for that gene and data were hierarchically clustered by row. A starred bracket indicates the cluster of genes whose expressions are uniformly higher in the industrial strain (BT0510) than the laboratory strain (Y3854). A hash mark bracket indicates the cluster of genes whose expressions are uniformly higher in the laboratory strain than the industrial strain.
For both strains, we could identify hundreds of stress-induced and repressed genes when subjected to different treatments, as shown in the volcano plots of the transcriptional responses of both the laboratory and industrial strains (Figure 2).
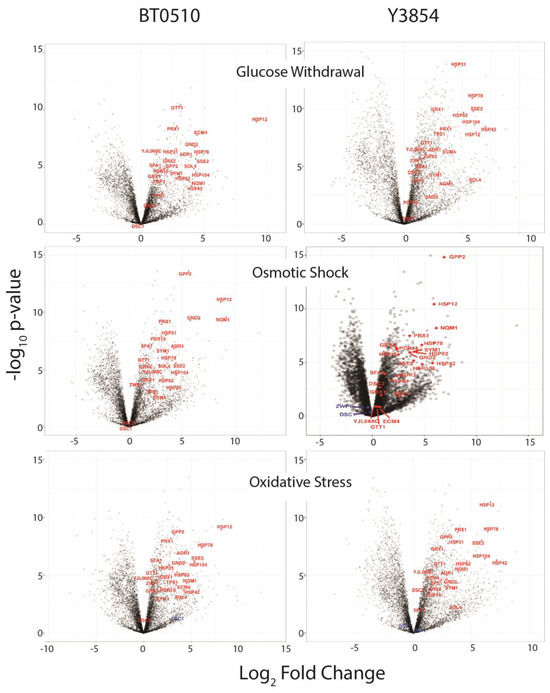
Figure 2.
Transcriptional response of an industrial and a laboratory strain to different sequential stresses. Shown are volcano plots of the transcriptional responses of strains BT0510 and Y3854 to oxidative stress, osmotic shock, or glucose withdrawal, each followed by addition of ethanol. The average log2 fold change (x-axis) for each gene following treatment relative to untreated cells is plotted versus the −log10 p-value, so that the fold change is due to chance.
In the laboratory strain 1051, differentially expressed genes (DEGs) were induced relative to untreated cells upon osmotic stress followed by ethanol treatment and 920 genes were repressed (Figure 3A,C). A total of 1143 genes were induced by oxidative stress followed by ethanol treatment and 1130 were repressed. Upon glucose withdrawal stress followed by ethanol treatment, 1115 genes were induced and 1049 were repressed. Consistent with the presence of a common stress response, we noted that 496 genes were upregulated in all treatments and 682 were repressed (Figure 3A,C). Comparing those common induced genes in the laboratory strain to those previously identified in the industrial strains [14], we determined that 275 genes were common between the two strains, while 221 genes were exclusive to the laboratory strain and 168 genes were exclusive to the industrial strain (Figure 3E). The upregulated genes that were common between the two strains encode much of the general stress response and are discussed further below.
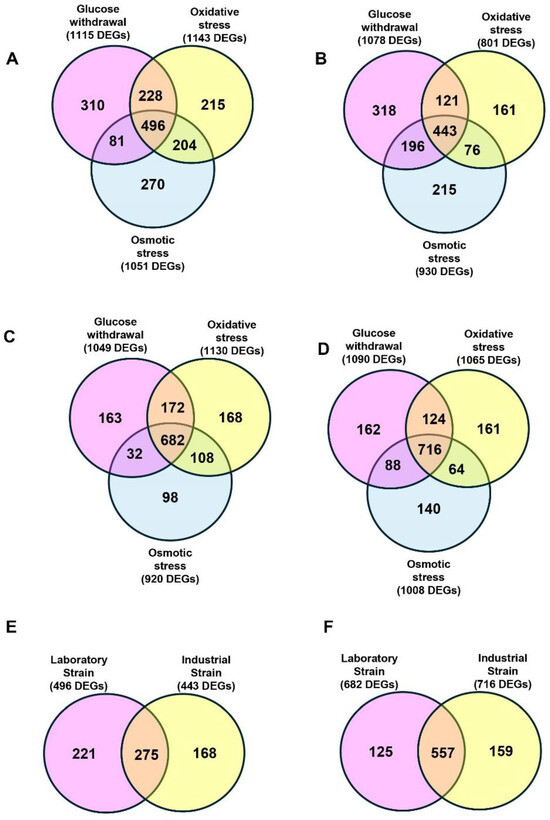
Figure 3.
Comparison between the laboratory and industrial strains of induced and repressed genes. Venn diagram of genes induced (A) in the laboratory strain Y3854 or the industrial strain BT0510 (B) after glucose withdrawal followed by ethanol stress (pink), oxidative stress followed by ethanol stress (yellow), and osmotic stress followed by ethanol stress (blue). Venn diagrams summarizing the genes repressed after glucose withdrawal followed by ethanol stress (pink), oxidative stress followed by ethanol stress (yellow), and osmotic stress followed by ethanol stress (blue) in Y3854 (C) and BT0510 (D). The intersections and differences between genes induced (E) or repressed (F) under all sequential stresses in the laboratory and industrial strains are shown.
The 557 common downregulated genes (Figure 3F) are dominated by those involved in growth and proliferation, as has been well documented in previous studies on the stress response [2,6,26]. These include components of the translational apparatus—ribosomal proteins, rRNA, tRNA and initiation factors—their synthesis, processing and assembly, as well as amino acid metabolism.
The 275 genes identified as common induced genes in the sequential stress response in both strains Y3854 and BT0510 were further analyzed via the DAVID Functional Annotation Tool. Some significant terms were annotated in all three categories of Gene Ontology (GO). In the GO category of Biological Process (BP), terms indicating de novo protein folding, carbohydrate metabolism, response to oxidative and chemical stress, response to abiotic stimulus, and the pentose metabolic process were enriched. The two terms enriched in the Cellular Component (CC) show several genes belonging to the cytoplasm and GID complex, and the results in the Molecular Function (MF) category indicate increased cell catalytic activity, oxidoreductase activity, and especially NADH activity. The GO classification indicates that sequential stresses modulate important biological processes, particularly affecting carbon metabolism and inducing a number of genes related to the oxidative and osmotic response.
The general stress response is induced by a combination of generic and stress-specific signaling pathways. One of the major pathways, the high osmolarity pathway (HOG), has been primarily associated with the response to high osmolarity conditions, but in fact responds to a variety of stimuli and is central to the general stress response [13]. Genes enriched in the response to osmotic stress (DSC1, DCS2 and GPP2) are associated with glycerol metabolism and glycerol plays an important role in the physiological processes that reduce osmotic stress, manage cytosolic phosphate levels, and maintain NAD +/NADH redox balance. Other genes enriched in response to sequential stresses suggest that the cell has additional strategies to combat the increase in ROS during and after stress, such as trehalose synthesis (TPS1, TSL1), which protects cell membranes from lipid peroxidation during oxidative injury [27], and both glutathione-dependent oxidoreductase (GRX2) and peroxidase activity (PRX1), which play a role in ROS scavenging in the cytoplasm and in the mitochondria, respectively [28,29].
KEGG analysis of DEGs in response to sequential stresses in both strains returned pathways related to carbon and amino acid metabolism. Two genes, GND2 and NQM1, belonging to the pentose phosphate metabolism (PPP) pathway were enriched, indicating a possible shift of the carbon metabolism to the PPP. Such a transition is central to the stress response and is a conserved first-line response to oxidative stress [30]. This pathway is the primary source of NADPH, which provides electrons for several anabolic reactions, such as fatty acid biosynthesis, nucleotide biosynthesis, and glutathione reduction. The first steps of PPP are upregulated in BT0510, and two of these genes are present in the response for both yeast strains, indicating their importance in both responses. The NQM1 gene, a paralog of the transaldolase TAL1, was also enriched in PPP by KEGG. Its role in the pentose phosphate pathway is not clear, but it has been shown to be repressed by glucose and induced under different stress conditions and may be related to stress tolerance [31]. This “secondary” isoenzyme may also contribute to the enhancement of L-arabinose and xylose metabolism in certain strains [32,33].
Some genes belonging to the response to sequential stresses in both strains were not specified in any enriched pathway, but are noteworthy nonetheless. They were HSP12, HSP31, HSP42, HSP78, HSP82, HSP104, SSE2, SYM1, and ADR1. Four of them belong to the heat shock proteins (HSP) family, which are known molecular chaperones and have been shown to be upregulated by a variety of stress conditions. The HSP12, HSP31, and HSP42 genes are small heat shock proteins (sHsps), a conserved family across species that occurs in all kingdoms of life and has subunits with molecular masses of 12–43 kDa [34]. These chaperones have a specific mode of action by inhibiting or modulating protein aggregation and enhancing disaggregation processes after stress. They are efficient in preventing irreversible aggregation processes by trapping non-native proteins in a state where they can be refolded to the native state using ATP-dependent chaperones [35]. Hsp104p, unlike most chaperones that prevent protein aggregation, in conjunction with Ssa1 and a co-chaperone, Ydj1, helps to disassemble protein aggregates to clear them after stress [36]. The HSP78 gene is homologous to the HSP104 and is found in the mitochondrial matrix in S. cerevisiae [37]. HSP82 is a member of the Hsp90 family that has been shown to interact directly with Hsp70 (Ssa1) in vitro and is required for the folding of difficult-to-fold proteins from nascent polypeptides and the refolding of denatured proteins to the native conformation [38,39]. Unlike the general response shown by both strains, the laboratory strains presented several additional heat shock proteins that represent a more focused role in refolding and aggregate degradation.
The SSE2 gene belongs to the Hsp110 subclass of Hsp70 proteins, which have two main functions in the cell; firstly, they act as nucleotide exchange factors catalyzing the release of ADP and rebinding of ATP by Hsp70 during protein refolding, and secondly they act as a “holdase” that binds unfolded peptides and keeps their substrate in a folded state by preventing misfolding and aggregation [40,41]. Chaperones, which play a role in maintaining protein structure, appear to be necessary for both strains in their response to successive stresses.
SYM1 is a mitochondrial gene that is also present in the gene set of both strains and may be another strategy for general cellular defense and enhancement of ethanol tolerance. Bravim et al. [8] had shown that overexpression of SYM1 increases fermentative capacity in the BT0510 strain. The SYM1 gene also appears to play a role in the stress response in the laboratory strain. This gene has been found to be required for both metabolism and tolerance to ethanol during heat shock, and has been suggested to play an important metabolic role in mitochondrial function during heat shock [42]. The upregulation of SYM1 in the industrial and laboratory strains may indicate its role in the global response to different fermentative stresses.
We also identified a gene transcriptional regulator that was upregulated following sequential stresses: ADR1. This gene encodes a transcriptional activator that controls the balance between fermentation and respiration in yeast and is associated with several processes that we identified in our analysis as ethanol metabolism and glycerol metabolism [43,44,45]. Overexpression of genes involved in transcriptional regulation has shown positive effects on cell tolerance and fermentation capacity in yeast cells. Overexpression of SNF1, a serine/threonine protein kinase involved in many cellular activities such as the cell cycle, proliferation, endocytosis, metabolism, and stress, has been shown to confer cell resistance to freezing [46]. Overexpression of the major TFs from the general stress response, MSN2 and MSN4, also improved cell resistance to starvation and heat [47]. ADR1 has been proposed as a globally acting factor in the response to transient oxidative stress [48] and our analysis supports its role in the response to sequential stresses.
3.2. Differences in Expression of the Industrial and Laboratory Strain
In order to gain insights into the features relevant to efficient fermentation, we examined the difference in expression between the laboratory and industrial strain, both at basal levels and in response to stress. Hierarchical clustering of the transcription levels of the most variable genes reveals a group of genes that are uniformly high in the industrial strain and low in the laboratory strain (Figure 1, starred bracket). Examining the relationships among this group of more highly expressed genes identifies functional subclusters potentially relevant to the fermentative activity of industrial strain. In particular, the group of genes including several FLO genes as well as IME4, CSS1 and PGU1 (Figure 4B, FDR = 0.0004) reflects and may account for the enhanced flocculation ability of the industrial strain. In contrast, a number of genes is uniformly expressed at a higher level in the lab strain than in the industrial strain. One group of genes including DAL80, GAT1, GAP1 and MEP2 may indicate a more robust regulation of nitrogen metabolism in the laboratory strain (Figure 4A). Similarly, a group of genes including MAL11, MAL13, HXT9 and IMA2 may indicate a more diverse ability of the laboratory strain for disaccharide metabolism (Figure 4A). These gene features may reflect the more diverse nutritional environment of the laboratory strain relative to that of the industrial strain.
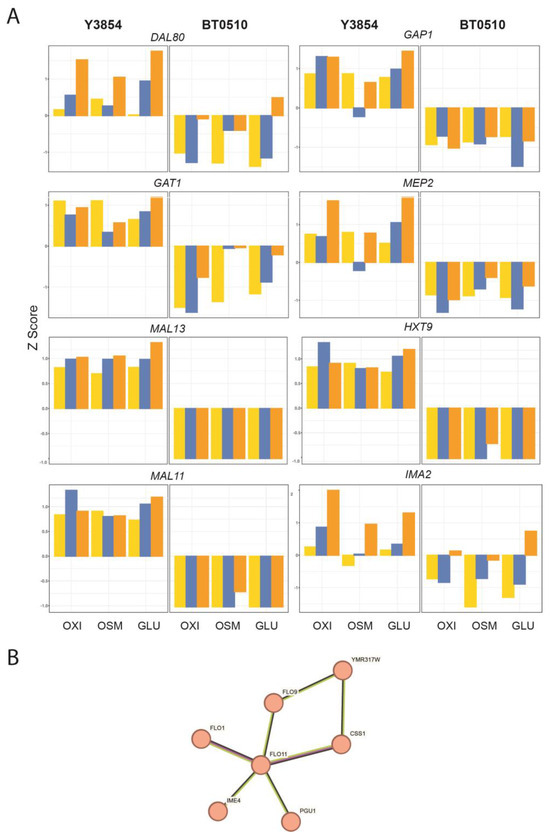
Figure 4.
Genes showing uniformly higher expression in one strain. (A) More in laboratory (Y3854) than industrial (BT0510) strain. Relative expression of several genes uniformly upregulated in Y3854 relative to BT0510, plotted as Z-score variance of counts per million over all the conditions for each gene. Yellow: Control, Blue: Initial Stress, Orange: Ethanol treatment. OXI: oxidative stress followed by ethanol addition; OSM: osmolarity stress followed by ethanol addition; GLU: glucose depletion followed by ethanol addition. (B) More in industrial (BT0510) than in laboratory (Y3854) strain. String subnetwork of flocculation-related genes showing uniformly higher expression in BT0510. Nodes denote the related genes and edges indicate the nature of their connectivity: black, co-expression; purple, experimentally determined; yellow-green, text mining.
As noted in Figure 3, although both strains are similar in their responses to sequential stresses, both strains also induced a number of genes that were not significantly induced by the other. Strain Y3854 induced 221 genes under all three conditions that strain BT0510 did not, while strain BT0510 induced 168 genes not significantly induced in strain Y3854. Similarly, both strains exhibited reduced expression in all three conditions of genes whose changes in expression in the other strain did pass the threshold: 159 for strain BT0510 and 125 for strain Y3854. The vast majority of these repressed genes encoded components of the translation machinery, their processing, or their function. These are in the same families as those commonly repressed in the two strains but simply had not risen to the threshold for inclusion in one or the other strain.
Each strain had a distinct set of induced genes (Figure 2), possibly indicating different strategies to survive the stresses. A cluster of genes involved in phagophore assembly are induced specifically in the lab strain (Figure 5A). A network of 14 genes associated with starch and sucrose metabolism and aldo-keto reductase activity, likely promoting enhanced carbohydrate usage, are specifically induced in the industrial strain (Figure 5B). This may suggest different strategies used by the two strains to address nutrient limitations under stress, recycling internal material in the lab strain and metabolizing external nutrients in the industrial strain. In addition to and consistent with the multi-stress tolerance of the industrial strain, BT0510 induced genes in glutathione metabolism (13 genes, FDR = 0.019) and in detoxification (8 genes, FDR = 0.026) in all stress conditions, while Y3452 induced them only in some stress conditions. Included in the glutathione metabolism group are YJL068C (S-formylglutathione hydrolase), ECM4 (Glutathione S-transferase 2), SFA1 (5-(hydroxymethyl)glutathione dehydrogenase), GRX1 (Glutaredoxin-1), and GTT1 (Glutathione S-transferase 1). Glutathione reduction is an important reaction in the response to oxidative stress and occurs when reactive oxygen species (ROS) chemically oxidize glutathione with the thiol group (SH), resulting in the formation of a sulfur bridge between two glutathione molecules. Certain enzymes break the sulfur bridge using the cofactor NADPH as an electron acceptor [49]. NADPH is also a cofactor involved in the regeneration of oxidized thioredoxins and oxidized peroxiredoxins [50]. This ties enhanced glutathione production in the industrial strain to the increased dependence on the pentose phosphate pathway mentioned above and discussed below. In addition to its role in protecting against oxidative damage, glutathione serves to detoxify certain small-molecule toxins, such as formaldehyde [51], and the enzymes involved in this role are induced more consistently in the industrial strain. Enhanced cellular detoxification in the industrial strain is also promoted by induction of several genes including PDR15, an ATP-dependent permease. In all, these features may be important for the ability of BT0510 to successfully serve as a fermentation catalyst.
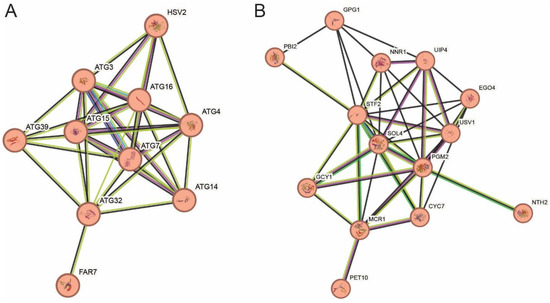
Figure 5.
Network of stress response genes unique to each strain. String subnetwork of genes induced uniquely in strain Y3452 (A) or BT0510 (B). Nodes and edges as described in legend to Figure 4. The network in A highlights the enrichment in phagophore assembly gene induction in the laboratory strain and the network in B highlights the carbohydrate metabolism gene enrichment in the industrial strain.
One member of the DUP240 family, PRM8, was induced exclusively in the Y3854 stress response. The DUP gene family is one of the largest yeast gene families and may have a role in membrane trafficking, particularly in the secretory pathway, and in endocytosis. They could also be moderators that activate and stabilize membrane proteins [52]. Interestingly, whole-genome analysis of the industrial strain BT0510 showed that the PRM8 gene is absent, as well as a cluster of DUP240 family genes on the right arm of chromosome 1 [53]. These results may indicate alterations in internal transport in this strain, but the transcriptome reveals a number of other genes related to transport that are upregulated in this strain following stress, which may mitigate the absence of the DUP240 genes [14].
A gene encoding a key enzyme in the pentose phosphate pathway (PPP) was differentially upregulated (Figure 6). The ZWF1 gene, which is responsible for the first step of the oxidative branch of PPP that is irreversible and rate-limiting, was upregulated in BT0510 but not in all stresses for Y3854. Most of the other genes in the PPP, SOL4, GND2, TKL1 and NQM1, were upregulated in both strains. The PPP has two specific segments: a unidirectional oxidative part with glucose-6-phosphate dehydrogenase as the key enzyme in the generation of NADPH, and a non-oxidative part that has several reversible reactions that interchange metabolites from PPP and glycolysis. The oxidative branch is vital for the oxidative stress response and the non-oxidative branch provides precursors for the synthesis of nucleic, fatty, and aromatic amino acids [54]. It is possible that Y3854 requires these metabolites in its response to successive stresses.
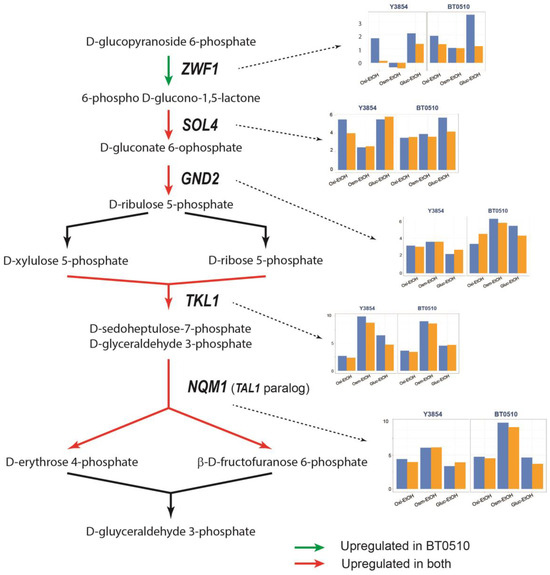
Figure 6.
Changes in the expression of the gene-encoding enzymes of the pentose phosphate pathway after sequential stresses. Red arrows indicate enzymes upregulated in both BT0510 (industrial strain) and Y3854 (laboratory strain); green arrows indicate an enzyme that was only upregulated in the BT0510 strain. The expression of the genes [Log2(FC)] encoding each enzyme is shown in the graphics close to them: blue columns represent gene expression after the first applied stress and the orange columns represent gene expression after the second stress (sequential stress). The graphics show gene expression after three different sequential stresses: Oxi-EtOH was oxidative stress followed by ethanol stress; Osm- EtOH was osmotic stress followed by ethanol stress and Gluc- EtOH was glucose withdrawal followed by ethanol stress. ZWF1: glucose-6-phosphate 1-dehydrogenase; SOL4: 6-phosphogluconolactonase; GND2: 6-phosphogluconate dehydrogenase; TAL1: transaldolase; NQM1: transaldolase of unknown function.
4. Conclusions
Here, we provide a comparative analysis of the transcriptome of two strains in response to sequential stresses, allowing us to highlight the transcriptional similarities and differences between the strains and to indicate key genes in this response. Both strains have shown similar strategies indicating induction of the response to oxidative and osmotic stress through glycerol synthesis, glutathione metabolism, NADPH regeneration, and others. The results show an important role of HSPs in protein stabilization in both strains. Through this study, we were able to highlight the role of the pentose phosphate pathway and a more robust glutathione production as possible tolerance inducers in the industrial strain, but further studies need to be performed to confirm their role in the response. Overall, these results provide a better understanding of the response to sequential stresses and knowledge for the improvement of all fermentation-based processes.
Author Contributions
A.C.T.C., P.M.B.F. and J.R.B. conceived and designed the study. A.C.T.C. and M.R. conducted the experiments. All authors analyzed and discussed the results. A.C.T.C., L.S., A.A.R.F., P.M.B.F. and J.R.B. wrote the manuscript. All authors have read and agreed to the published version of the manuscript.
Funding
This research was funded by an NIH grant GM076562 to J.R.B. P.M.B.F. was funded by CNPq and FAPES (research productivity award # 308306/2021 and 269) and A.C.T.C. by CAPES (scholarship # 88882.385022/2009-01 and 88881.187871/2018-01).
Institutional Review Board Statement
Not applicable.
Informed Consent Statement
Not applicable.
Data Availability Statement
The RNA sequencing data obtained in this study are available at NCBI Gene Expression Omnibus (GEO, http://www.ncbi.nlm.nih.gov/geo/accessed). The yeast strain used in this study is stored at Penn State College of Medicine.
Conflicts of Interest
The authors declare no conflict of interest.
References
- Maicas, S. The Role of Yeasts in Fermentation Processes. Microorganisms 2020, 8, 1142. [Google Scholar] [CrossRef]
- Gasch, A.P. The environmental stress response: A common yeast response to diverse environmental stresses. In Yeast Stress Responses; Hohmann, S., Mager, W.H., Eds.; Springer: Berlin/Heidelberg, Germany, 2003; pp. 11–70. [Google Scholar]
- Zakrzewska, A.; van Eikenhorst, G.; Burggraaff, J.E.; Vis, D.J.; Hoefsloot, H.; Delneri, D.; Oliver, S.G.; Brul, S.; Smits, G.J. Genome-wide analysis of yeast stress survival and tolerance acquisition to analyze the central trade-off between growth rate and cellular robustness. Mol. Biol. Cell 2011, 22, 4435–4446. [Google Scholar] [CrossRef]
- Attfield, P.V. Stress tolerance: The key to effective strains of industrial baker’s yeast. Nat. Biotechnol. 1997, 15, 1351–1357. [Google Scholar] [CrossRef]
- Berry, D.B.; Guan, Q.; Hose, J.; Haroon, S.; Gebbia, M.; Heisler, L.E.; Nislow, C.; Giaever, G.; Gasch, A.P. Multiple means to the same end: The genetic basis of acquired stress resistance in yeast. PLoS Genet. 2011, 7, e1002353. [Google Scholar] [CrossRef]
- Gasch, A.P.; Spellman, P.T.; Kao, C.M.; Carmel-Harel, O.; Eisen, M.B.; Storz, G.; Botstein, D.; Brown, P.O. Genomic expression programs in the response of yeast cells to environmental changes. Mol. Biol. Cell 2000, 11, 4241–4257. [Google Scholar] [CrossRef]
- Araujo, T.M.; Souza, M.T.; Diniz, R.H.S.; Yamakawa, C.K.; Soares, L.B.; Lenczak, J.L.; de Castro Oliveira, J.V.; Goldman, G.H.; Barbosa, E.A.; Campos, A.C.S.; et al. Cachaca yeast strains: Alternative starters to produce beer and bioethanol. Antonie van Leeuwenhoek 2018, 111, 1749–1766. [Google Scholar] [CrossRef]
- Bravim, F.; Lippman, S.I.; da Silva, L.F.; Souza, D.T.; Fernandes, A.A.; Masuda, C.A.; Broach, J.R.; Fernandes, P.M. High hydrostatic pressure activates gene expression that leads to ethanol production enhancement in a Saccharomyces cerevisiae distillery strain. Appl. Microbiol. Biotechnol. 2013, 97, 2093–2107. [Google Scholar] [CrossRef][Green Version]
- Palhano, F.L.; Gomes, H.L.; Orlando, M.T.; Kurtenbach, E.; Fernandes, P.M. Pressure response in the yeast Saccharomyces cerevisiae: From cellular to molecular approaches. Cell Mol Biol (Noisy-Le-Grand) 2004, 50, 447–457. [Google Scholar]
- Vianna, C.R.; Silva, C.L.; Neves, M.J.; Rosa, C.A. Saccharomyces cerevisiae strains from traditional fermentations of Brazilian cachaca: Trehalose metabolism, heat and ethanol resistance. Antonie van Leeuwenhoek 2008, 93, 205–217. [Google Scholar] [CrossRef]
- Chasman, D.; Ho, Y.H.; Berry, D.B.; Nemec, C.M.; MacGilvray, M.E.; Hose, J.; Merrill, A.E.; Lee, M.V.; Will, J.L.; Coon, J.J.; et al. Pathway connectivity and signaling coordination in the yeast stress-activated signaling network. Mol. Syst. Biol. 2014, 10, 759. [Google Scholar] [CrossRef] [PubMed]
- Gasch, A.P.; Yu, F.B.; Hose, J.; Escalante, L.E.; Place, M.; Bacher, R.; Kanbar, J.; Ciobanu, D.; Sandor, L.; Grigoriev, I.V.; et al. Single-cell RNA sequencing reveals intrinsic and extrinsic regulatory heterogeneity in yeast responding to stress. PLoS Biol. 2017, 15, e2004050. [Google Scholar] [CrossRef]
- Gutin, J.; Sadeh, A.; Rahat, A.; Aharoni, A.; Friedman, N. Condition-specific genetic interaction maps reveal crosstalk between the cAMP/PKA and the HOG MAPK pathways in the activation of the general stress response. Mol. Syst. Biol. 2015, 11, 829. [Google Scholar] [CrossRef]
- Costa, A.C.T.; Russo, M.; Fernandes, A.A.R.; Broach, J.R.; Fernandes, P.M.B. Transcriptional Response of Multi-Stress-Tolerant to Sequential Stresses. Fermentation 2023, 9, 195. [Google Scholar] [CrossRef]
- Kvitek, D.J.; Will, J.L.; Gasch, A.P. Variations in stress sensitivity and genomic expression in diverse S. cerevisiae isolates. PLoS Genet. 2008, 4, e1000223. [Google Scholar] [CrossRef]
- Kim, D.; Paggi, J.M.; Park, C.; Bennett, C.; Salzberg, S.L. Graph-based genome alignment and genotyping with HISAT2 and HISAT-genotype. Nat. Biotechnol. 2019, 37, 907–915. [Google Scholar] [CrossRef]
- Anders, S.; Pyl, P.T.; Huber, W. HTSeq—A Python framework to work with high-throughput sequencing data. Bioinformatics 2015, 31, 166–169. [Google Scholar] [CrossRef]
- Team, R.C. R: A Language and Environment for Statistical Computing. Available online: https://www.R-project.org/ (accessed on 23 July 2024).
- Robinson, M.D.; McCarthy, D.J.; Smyth, G.K. edgeR: A Bioconductor package for differential expression analysis of digital gene expression data. Bioinformatics 2010, 26, 139–140. [Google Scholar] [CrossRef]
- Law, C.W.; Chen, Y.; Shi, W.; Smyth, G.K. voom: Precision weights unlock linear model analysis tools for RNA-seq read counts. Genome Biol. 2014, 15, R29. [Google Scholar] [CrossRef]
- Wu, T.; Hu, E.; Xu, S.; Chen, M.; Guo, P.; Dai, Z.; Feng, T.; Zhou, L.; Tang, W.; Zhan, L.; et al. clusterProfiler 4.0: A universal enrichment tool for interpreting omics data. Innov. (Camb) 2021, 2, 100141. [Google Scholar] [CrossRef]
- Huang, D.W.; Sherman, B.T.; Lempicki, R.A. Systematic and integrative analysis of large gene lists using DAVID bioinformatics resources. Nat. Protoc. 2009, 4, 44–57. [Google Scholar] [CrossRef] [PubMed]
- Sherman, B.T.; Hao, M.; Qiu, J.; Jiao, X.; Baseler, M.W.; Lane, H.C.; Imamichi, T.; Chang, W. DAVID: A web server for functional enrichment analysis and functional annotation of gene lists (2021 update). Nucleic Acids Res. 2022, 50, W216–W221. [Google Scholar] [CrossRef]
- Wickham, H. ggp2lot; Springer: New York, NY, USA, 2009. [Google Scholar]
- Saini, P.; Beniwal, A.; Kokkiligadda, A.; Vij, S. Response and tolerance of yeast to changing environmental stress during ethanol fermentation. Process Biochem. 2018, 72, 1–12. [Google Scholar] [CrossRef]
- Broach, J.R. Nutritional control of growth and development in yeast. Genetics 2012, 192, 73–105. [Google Scholar] [CrossRef]
- Herdeiro, R.S.; Pereira, M.D.; Panek, A.D.; Eleutherio, E.C. Trehalose protects Saccharomyces cerevisiae from lipid peroxidation during oxidative stress. Biochim. Biophys. Acta 2006, 1760, 340–346. [Google Scholar] [CrossRef]
- Pedrajas, J.R.; Miranda-Vizuete, A.; Javanmardy, N.; Gustafsson, J.A.; Spyrou, G. Mitochondria of Saccharomyces cerevisiae contain one-conserved cysteine type peroxiredoxin with thioredoxin peroxidase activity. J. Biol. Chem. 2000, 275, 16296–16301. [Google Scholar] [CrossRef]
- Pedrajas, J.R.; Porras, P.; Martinez-Galisteo, E.; Padilla, C.A.; Miranda-Vizuete, A.; Barcena, J.A. Two isoforms of Saccharomyces cerevisiae glutaredoxin 2 are expressed in vivo and localize to different subcellular compartments. Biochem. J. 2002, 364, 617–623. [Google Scholar] [CrossRef]
- Ralser, M.; Wamelink, M.M.; Kowald, A.; Gerisch, B.; Heeren, G.; Struys, E.A.; Klipp, E.; Jakobs, C.; Breitenbach, M.; Lehrach, H.; et al. Dynamic rerouting of the carbohydrate flux is key to counteracting oxidative stress. J. Biol. 2007, 6, 10. [Google Scholar] [CrossRef]
- Michel, S.; Keller, M.A.; Wamelink, M.M.; Ralser, M. A haploproficient interaction of the transaldolase paralogue NQM1 with the transcription factor VHR1 affects stationary phase survival and oxidative stress resistance. BMC Genet. 2015, 16, 13. [Google Scholar] [CrossRef]
- Matsushika, A.; Goshima, T.; Fujii, T.; Inoue, H.; Sawayama, S.; Yano, S. Characterization of non-oxidative transaldolase and transketolase enzymes in the pentose phosphate pathway with regard to xylose utilization by recombinant Saccharomyces cerevisiae. Enzym. Microb. Technol. 2012, 51, 16–25. [Google Scholar] [CrossRef]
- Wisselink, H.W.; Cipollina, C.; Oud, B.; Crimi, B.; Heijnen, J.J.; Pronk, J.T.; van Maris, A.J. Metabolome, transcriptome and metabolic flux analysis of arabinose fermentation by engineered Saccharomyces cerevisiae. Metab. Eng. 2010, 12, 537–551. [Google Scholar] [CrossRef] [PubMed]
- Bakthisaran, R.; Tangirala, R.; Rao Ch, M. Small heat shock proteins: Role in cellular functions and pathology. Biochim. Biophys. Acta 2015, 1854, 291–319. [Google Scholar] [CrossRef]
- Haslbeck, M.; Weinkauf, S.; Buchner, J. Small heat shock proteins: Simplicity meets complexity. J. Biol. Chem. 2019, 294, 2121–2132. [Google Scholar] [CrossRef]
- Grimminger-Marquardt, V.; Lashuel, H.A. Structure and function of the molecular chaperone Hsp104 from yeast. Biopolymers 2010, 93, 252–276. [Google Scholar] [CrossRef]
- Abrahao, J.; Mokry, D.Z.; Ramos, C.H.I. Hsp78 (78 kDa Heat Shock Protein), a Representative AAA Family Member Found in the Mitochondrial Matrix of. Front. Mol. Biosci. 2017, 4. [Google Scholar] [CrossRef]
- Kravats, A.N.; Hoskins, J.R.; Reidy, M.; Johnson, J.L.; Doyle, S.M.; Genest, O.; Masison, D.C.; Wickner, S. Functional and physical interaction between yeast Hsp90 and Hsp70. Proc. Natl. Acad. Sci. USA 2018, 115, E2210–E2219. [Google Scholar] [CrossRef]
- Nathan, D.F.; Vos, M.H.; Lindquist, S. In vivo functions of the Saccharomyces cerevisiae Hsp90 chaperone. Proc. Natl. Acad. Sci. USA 1997, 94, 12949–12956. [Google Scholar] [CrossRef]
- Easton, D.P.; Kaneko, Y.; Subjeck, J.R. The hsp110 and Grp1 70 stress proteins: Newly recognized relatives of the Hsp70s. Cell Stress. Chaperones 2000, 5, 276–290. [Google Scholar] [CrossRef]
- Shaner, L.; Wegele, H.; Buchner, J.; Morano, K.A. The yeast Hsp110 Sse1 functionally interacts with the Hsp70 chaperones Ssa and Ssb. J. Biol. Chem. 2005, 280, 41262–41269. [Google Scholar] [CrossRef]
- Trott, A.; Morano, K.A. SYM1 is the stress-induced Saccharomyces cerevisiae ortholog of the mammalian kidney disease gene Mpv17 and is required for ethanol metabolism and tolerance during heat shock. Eukaryot. Cell 2004, 3, 620–631. [Google Scholar] [CrossRef] [PubMed][Green Version]
- Peltier, E.; Friedrich, A.; Schacherer, J.; Marullo, P. Quantitative Trait Nucleotides Impacting the Technological Performances of Industrial Saccharomyces cerevisiae Strains. Front. Genet. 2019, 10, 683. [Google Scholar] [CrossRef] [PubMed]
- Tachibana, C.; Yoo, J.Y.; Tagne, J.B.; Kacherovsky, N.; Lee, T.I.; Young, E.T. Combined global localization analysis and transcriptome data identify genes that are directly coregulated by Adr1 and Cat8. Mol. Cell Biol. 2005, 25, 2138–2146. [Google Scholar] [CrossRef]
- Young, E.T.; Dombek, K.M.; Tachibana, C.; Ideker, T. Multiple pathways are co-regulated by the protein kinase Snf1 and the transcription factors Adr1 and Cat8. J. Biol. Chem. 2003, 278, 26146–26158. [Google Scholar] [CrossRef]
- Meng, L.; Yang, X.; Lin, X.; Jiang, H.Y.; Hu, X.P.; Liu, S.X. Effect of overexpression of SNF1 on the transcriptional and metabolic landscape of baker’s yeast under freezing stress. Microb. Cell Fact. 2021, 20, 10. [Google Scholar] [CrossRef]
- Estruch, F. Stress-controlled transcription factors, stress-induced genes and stress tolerance in budding yeast. FEMS Microbiol. Rev. 2000, 24, 469–486. [Google Scholar] [CrossRef]
- Koerkamp, M.G.; Rep, M.; Bussemaker, H.J.; Hardy, G.P.; Mul, A.; Piekarska, K.; Szigyarto, C.A.; De Mattos, J.M.; Tabak, H.F. Dissection of transient oxidative stress response in Saccharomyces cerevisiae by using DNA microarrays. Mol. Biol. Cell 2002, 13, 2783–2794. [Google Scholar] [CrossRef]
- Nielsen, J. Yeast cells handle stress by reprogramming their metabolism. Nature 2019, 572, 184–185. [Google Scholar] [CrossRef]
- Yadav, S.; Mody, T.A.; Sharma, A.; Bachhawat, A.K. A Genetic Screen To Identify Genes Influencing the Secondary Redox Couple NADPH/NADP(+) in the Yeast Saccharomyces cerevisiae. G3 (Bethesda) 2020, 10, 371–378. [Google Scholar] [CrossRef]
- Wangsanut, T.; Pongpom, M. The Role of the Glutathione System in Stress Adaptation, Morphogenesis and Virulence of Pathogenic Fungi. Int. J. Mol. Sci. 2022, 23, 645. [Google Scholar] [CrossRef]
- Despons, L.; Wirth, B.; Louis, V.L.; Potier, S.; Souciet, J.L. An evolutionary scenario for one of the largest yeast gene families. Trends Genet. 2006, 22, 10–15. [Google Scholar] [CrossRef] [PubMed]
- Costa, A.C.T.; Hornick, J.; Antunes, T.F.S.; Santos, A.M.C.; Fernandes, A.A.R.; Broach, J.R.; Fernandes, P.M.B. Complete genome sequence and analysis of a Saccharomyces cerevisiae strain used for sugarcane spirit production. Braz. J. Microbiol. 2021, 52, 1087–1095. [Google Scholar] [CrossRef] [PubMed]
- Bertels, L.K.; Fernandez Murillo, L.; Heinisch, J.J. The Pentose Phosphate Pathway in Yeasts-More Than a Poor Cousin of Glycolysis. Biomolecules 2021, 11, 725. [Google Scholar] [CrossRef]
Disclaimer/Publisher’s Note: The statements, opinions and data contained in all publications are solely those of the individual author(s) and contributor(s) and not of MDPI and/or the editor(s). MDPI and/or the editor(s) disclaim responsibility for any injury to people or property resulting from any ideas, methods, instructions or products referred to in the content. |
© 2024 by the authors. Licensee MDPI, Basel, Switzerland. This article is an open access article distributed under the terms and conditions of the Creative Commons Attribution (CC BY) license (https://creativecommons.org/licenses/by/4.0/).