Abstract
This study aimed to use waste figs as an alternative substrate for bacterial cellulose (BC) production by Komagataeibacter xylinus and optimize the identified process parameters to maximize the concentration of BC. Among the nutrients screened by Plackett–Burman (PB) design, yeast extract was found to be significant in BC production. Response surface methodology was used to investigate the effect of fermentation parameters on BC production. A maximum BC concentration of (8.45 g/L), which is among the highest BC concentrations reported so far, was achieved at the optimum levels of fermentation variables (initial pH 6.05, initial sugar concentration 62.75 g/L, temperature 30 °C). The utilization of response surface methodology (RSM) proved valuable in both optimizing and finding the interactions between process variables during BC production. Scanning electron microscope (SEM) analysis showed a dense structure of BC, characterized by ribbon-like nanofibrils with diameters ranging from 23 to 90 nm while the attenuated total reflection–Fourier transform infrared (ATR-FTIR) spectrum of BC confirmed that the material obtained was cellulose. The X-ray diffraction (XRD) analysis showed that the crystallinity of the BC samples was 70% for BC produced on waste fig medium and 61% for BC produced on Hestrin–Schramm (HS) medium. This is the first detailed study on the production of BC from waste figs, and the findings of this study demonstrated that waste figs can be used as an effective substrate for the production of BC.
1. Introduction
Cellulose is the most prevalent polymer found in nature that is traditionally extracted from plants. However, plant cellulose contains both hemicellulose and lignin, and those components should be removed in order to obtain pure cellulose. This typically requires the use of chemical processes that rely on harsh acid and alkali treatments, which can cause environmental pollution [1]. Bacterial cellulose (BC) is an extracellular monopolymer formed by attaching β-1,4 D-glucose units with glycosidic bonds. Although it has similar chemical properties to plant cellulose, BC is a pure polymer with outstanding physicochemical properties, including exceptional purity, remarkable hydrophilicity, ultrafine interwoven structure, high tensile strength, crystallinity, and biocompatibility. Consequently, BC finds utility across a diverse range of applications, including health foods, biomedical and pharmaceutical products, and cosmetics, as well as serving as a reinforcing agent for high-quality papers and an additive for paints and coatings [2].
The food industry’s waste products contribute significantly to environmental pollution, which is the main reason for global warming. A key aspect of achieving sustainable industrial production lies in the ability to recover and repurpose these wastes as valuable resources within a circular economy [3]. Consequently, researchers have lately focused on utilizing food industry wastes for bioproduct formation. By employing waste biomass that contains carbon and nitrogen in bioprocesses, environmental pollution will be reduced, and an economical, resilient, and sustainable production framework will be established [4].
Innovative and efficient biotechnological conversion systems have significant potential for development using low-cost renewable resources and waste materials. The cost of the substrate is one of the major expenses in a bioprocess, and it is believed that using low-cost substrates can reduce the overall cost of the BC production process. Many studies have been conducted on the production of BC using agricultural and industrial waste sources, including wheat straw [5], hydrolysate of spruce [6], hot water extract of wood [7], pineapple agro-industrial wastes [8], different fruit juices such as orange, pineapple, pear juices [9], rotten fruits discarded in free markets and milk whey [10], cotton-based waste textiles [11], molasses [1], grape skin extract, cheese whey, crude glycerol and sulfite pulping liquor [12], soya bean whey [13], stillage from rice wine industry [14], wastewater from candied jujube processing [15], waste of confectionary and biodiesel processing industries [16], wastewater of acetone–butanol–ethanol fermentation [17], carob and haricot bean [18], side-stream of Corinthian currants finishing and cheese whey [19], maple syrup [20], grape pomace hydroysate [21], juices of pineapple peel and sugar cane [22], brewery waste [23], cheese whey and olive mill wastewater [24], and extract of tobacco waste [25].
Fig fruit (Ficus carica L.) is a fruit typically grown in regions along the Mediterranean coast with an annual production of over one million tons. Fig fruit contains abundant amounts of sugar, vitamins, minerals, organic acids, and phenolic compounds, such as flavones, flavonols, proanthocyanidins, and phenolic acids [26,27,28]. Between 2010 and 2019, the top three fig producers worldwide were Turkey, Egypt, and Algeria [26]. Fig fruit can regularly be found on the market either in fresh form or dried form for direct consumption or as an ingredient in culinary dishes. Nevertheless, a significant quantity of fresh figs is lost annually due to physicochemical damage that occurs during the harvesting and storage processes [28]. During the natural drying process of figs on wooden pallets under the sun, industrial figs, known as waste figs, are separated, and the remaining intact figs are stored in warehouses and subjected to the classification process. Waste figs can be defined as figs that have lost their value due to various physicochemical damages during the preharvest, postharvest, and storage processes of fresh figs. Due to their high nutritional value, waste figs are especially used in alcohol production and in the formulation of products such as jam, marmalade, and paste. Based on the literature results, there is only one paper about BC production using figs. Abol-Fotouh et al. [29] produced bacterial nanocellulose from palm date, fig, and sugarcane molasses substrates using Komagataeibacter saccharivorans MD1. They used the hydrothermal extraction method for obtaining fig extract. They obtained the highest BC production of 3.9 g/L on molasses medium, while date and fig extracts yielded lower cellulose concentrations of 3.1 and 1.1 g/L, respectively. Even though the authors achieved limited cellulose concentration when utilizing figs as the substrate without employing any optimization techniques, it is possible that waste figs could serve as a cost-effective and abundant resource for fermentation processes, such as BC production.
Optimizing the process is a crucial part of a biotechnological procedure, just as it is in any other type of process. Traditional methods for improving the culture medium and operational conditions involve a time-consuming and labor-intensive process, where one variable is modified while keeping all others constant. Moreover, when dealing with numerous variables, determining optimal values can be misleading because it might overlook the interactions between these variables. A dependable approach for optimization involves the use of statistical techniques like factorial experiments, such as Plackett–Burman (PB) design, to determine the important process variables. Finally, the significant variables are integrated into response surface methodology (RSM) to determine the impacts of factors and search for the ideal conditions to achieve desirable results. Finally, a second-degree polynomial model is built to either minimize or maximize the response variable [30,31,32].
The objective of this study was to utilize waste figs as a substrate for BC production and optimize process parameters, such as initial sugar concentration, initial pH, and temperature to maximize cellulose concentration. To the best of our knowledge, there are currently no research articles on enhancing BC production with Komagataeibacter xylinus using waste figs as the substrate. This work represents the first detailed article demonstrating that waste figs are an efficient substrate for BC production.
2. Materials and Methods
2.1. Microorganism and Culture Conditions
Komagataeibacter xylinus ATCC 700178 (formerly known as Gluconacetobacter xylinus) was kindly donated by Prof. Dr. Elif Esin HAMEŞ (Ege University, Department of Bioengineering). The strain was stored in Hestrin–Schramm (HS) medium with a composition of 2 wt.% glucose, 0.5% yeast extract, 0.5% peptone, 0.27% disodium phosphate, 0.115% citric acid at 4 °C for 4 weeks before being subcultured to freshly prepared HS medium incubated at 30 °C/48 h. The cell count of the inoculum culture was 6.50 × 10⁶ cfu/mL. A total of 2% (v/v) of this inoculum was used to inoculate the fermentation medium (100 mL) to reach a microbial population of 1.3 × 10⁵ cfu/mL. After adjusting the pH to 5.0, the fermentation medium was sterilized at 121 °C/15 min before inoculation. Inoculation and fermentation experiments were performed under static culture conditions. Waste figs were supplied by Işık Tarım A.S.-Izmir and stored at 4 °C. The image of waste figs obtained from the company under UV light is presented in Supplementary Figure S1. The composition of waste fig samples was water, 15.8 ± 1.05%; sugar, 52.20 ±4.75%; protein, 3.4 ± 0.4%; mineral, 2.6 ± 0.4%, pH 4.6; and water activity (aw), 0.60 ± 0.03, as analyzed and declared by the supplier.
2.2. Waste Fig Extract Production
The method suggested by Moosavi-Nasab et al. [33] for date fruit juice was modified and used in order to extract carbon, nitrogen, and other nutrients from waste fig samples. For this purpose, 50 g of waste dried figs was mixed with 250 mL of distilled water (1:5, w/v) at 80 °C and blended for 4 min in a standard house blender. After waiting for 30 min, the solution was centrifuged at 6000 rpm for 15 min (Hettich Universal 320 R, Tuttlingen, Germany). Distilled water was used to dilute the supernatant (waste fig extract) to contain 20 g/L of initial sugar (unless otherwise specified) for the fermentation studies. The waste fig extract prepared by this method contained 8.98 ± 0.11% initial sugar, 4.33 ± 0.03% fructose, 4.30 ± 0.02% glucose, and 4.13 ± 0.03% protein.
Gel formation was observed in fig extract obtained at initial sugar concentrations exceeding 40 g/L, attributed to the presence of polymeric substances such as pectin in fig fruit [26]. In order to avoid gel formation, the undiluted waste fig extract underwent a clarification process using a commercial enzyme preparation containing pectinase and cellulase activities. The enzyme used for this purpose was Rapidase FC, supplied by DSM Food Specialties B.V., Netherlands. Rapidase FC is a liquid blend of Aspergillus niger pectinases and Trichoderma longibrachiatum cellulolytic activities with a declared optimum temperature of 45–55 °C and optimum pH of 4.0–5.0. For this purpose, 0.2 mL of Rapidase FC commercial enzyme (150–200 g/ton as declared by the supplier) was added to 1 L of fig extract and incubated at 45 °C/1 h. The enzyme-treated extract was used in fermentation experiments as stated below for BC production.
2.3. Fermentation Experiments
BC production was performed in Erlenmeyer flasks (250 mL) with 100 mL of waste fig extract medium containing 20 g/L of initial sugar (unless otherwise specified). Prior to sterilization of the fermentation medium at 121 °C for 15 min, the pH level was adjusted to 5.0 using 1 M HCl. The fermentation experiments (30 °C/7 days) were carried out under static culture conditions. One flask was taken at certain time intervals, and BC concentration and pH were measured. The effect of different yeast extract concentrations (3, 5, 7, 10, 13, 15 g/L), initial pH value (pH 4.0, 5.0, 6.0, 6.5, 7.0), initial sugar concentration (20, 40, 60, 80 g/L), and fermentation temperature (25 °C, 30 °C, 35 °C) on BC production was investigated.
2.4. Experimental Design for BC Production
2.4.1. Plackett–Burman Design
PB design was used for screening and determining the effect of HS medium components (yeast extract, peptone, citric acid, and disodium phosphate) when waste fig extract was used as substrate in BC production. The fermentation media were prepared by diluting waste fig extract to have an initial sugar concentration of 20 g/L. These media were then supplemented with low (−) and high (+) levels of each component, as indicated in Table 1. The concentration levels of each ingredient were determined based on the original HS medium: the upper levels matched the original concentration, while the lower levels were set at 1/10 of the original values. The influence of four parameters was determined by eight runs using PB design, and Table 1 shows the BC concentrations obtained for each experiment. Fermentation media prepared according to the PB design is presented in Supplementary Figure S2.

Table 1.
Experimental design and results of Plackett–Burman design.
2.4.2. Face-Centered Central Composite Design
Optimization of the significant variables (initial sugar concentration, initial pH, and fermentation temperature) was performed by RSM for BC synthesis. The level of the factors was determined following a series of early trials. A face-centered central composite design (α = 1) was used for optimization studies. The fermentation parameters were investigated at three different levels of −1, 0, and +1, where 0 represents the central point, as shown in Table 2. Equation (1) was used to find the coded values of each factor by using the actual levels. All experiments were performed in triplicates, and the mean concentration of BC (g/L) was used as response (Y). Quadratic regression analysis was then applied to the data to establish a model that correlates the response with the independent variables. A polynomial equation of the second order (Equation (2)) was used to characterize the model system [34].
where X1, X2, and X3 stand for the levels of the factors given in Table 2, and β0, β1 … β23 present coefficient estimates, where β0 represents the equation’s constant term. Optimum levels of all three independent variables were found by the solution of the regression equation. Minitab Statistical Software (Release 13.20) was used to statistically evaluate the data for PB and RSM.
Table 2.
Levels of factors used in the experimental design and results.
2.5. Analytical Methods
For the purification of BC produced by fermentation, the method used by Algar et al. [8] was modified and used. Cellulosic membrane samples collected from the culture media were rinsed with tap water. The BC samples were then treated with 2% (w/v) NaOH solution at 80 °C for 2 h and at 30 °C for 48 h to remove bacterial cell residues and noncellulosic impurities. After extensive washing with distilled water until neutral pH, the weight of the cellulosic membranes was found by drying to a constant weight at 60 °C. The result was recorded as gram cellulose per liter of fermentation medium (g/L). Dried samples were also used for further structural characterization experiments. Unpurified and purified bacterial cellulose samples are shown in Supplementary Figure S3.
The sugar content of waste fig extract was found by using the phenol sulfuric acid method [35]. The protein content of the waste fig extract was found by the Kjeldahl method [36]. Protein concentration was determined by multiplying the nitrogen concentration by a factor of 6.25. The sugar profile of the fig extract was determined by an Agilent 1200 Infinity Liquid Chromatograph (Agilent, Santa Clara, CA, USA) equipped with an Agilent 1200 Infinity Series-RID Detector, a gradient elution pump and vacuum degasser, an autosampler system, and a thermostatic column compartment. The chromatographic column was Inertsil NH2 (5 μm particle size, 250 mm, 4.6 mm i.d.). The spread plate method was used to determine viable bacterial cell numbers present in the inoculum [37]. The pH of the fermentation medium was recorded periodically using a WTW basic benchtop pH meter (WTW Inolab 7110, Weilheim, Germany).
Each experiment was conducted in triplicate, and the results were calculated as the mean ± standard deviation. Statistical analyses were performed using the software IBM SPSS (Version 25). One-way analysis of variance was applied to analyze the data, and Duncan’s test at p < 0.05 was used to test the significant differences. The factors displayed on the x-axis of the figures with different letters are considered significantly different (p < 0.05).
2.6. Structural Characterization of Bacterial Cellulose Samples
2.6.1. Attenuated Total Reflection–Fourier Transform Infrared Spectrophotometry (ATR-FTIR)
ATR-FTIR analysis of dried BC samples was performed by ATR-FTIR spectrophotometer (Perkin Elmer Spectrum Two, ABD). Scans were obtained in 600–4000 cm−1 spectral range at a resolution of 4 cm−1.
2.6.2. Scanning Electron Microscope (SEM)
SEM images of the nanofiber structure of the purified BC samples were taken by SEM (Thermo Scientific Apreo S, Waltham, MA, USA) at an accelerated voltage of 7.50 kV. BC samples were coated with a 7 nm gold–palladium layer to increase conductivity. The BC nanofibers diameters were obtained by analyzing the SEM micrographs with ImageJ software (Version 1.54j, National Institutes of Health, Bethesda, MD, USA). Using Origin Pro 24 (Origin Lab, Northampton, MA, USA), size distribution histograms for BC samples were generated based on the diameters of fibers.
2.6.3. X-ray Diffraction (XRD)
XRD patterns of dried BC samples were found by an X-ray diffractometer (Rigaku XRD Ultima-IV, Osaka, Japan) using Cu Kα radiation (λ = 1.542 nm). The XRD pattern was recorded in a 2θ angle range of 10–90. Visualization of the XRD graphs and the calculation of the crystallinity value were performed using Origin Pro 24. The crystallinity value of the samples was determined by calculating the ratio of the total area of crystalline peaks to the total area, as given by the following equation (Equation (3)) [38]:
3. Results and Discussion
3.1. Screening of Nutrients for Cellulose Production Using Plackett–Burman Design
Since different nutrients can result in different metabolic effects and can change metabolite production levels in BC synthesis, PB design was used to investigate the effect of nutrients used in HS medium. Hence, the extract obtained from waste figs was diluted to contain 20 g/L initial sugar and the influence of HS medium components (peptone, yeast extract, Na2HPO4, and citric acid) was evaluated according to their main effects by PB design using stationary culture technique. Glucose in HS medium was replaced by sugars (mainly glucose and fructose) in the fig extract. Eight experimental runs were performed using different combinations of medium components as suggested by the design (Table 1), and the main effect, estimated regression coefficients, standard coefficients, and t- and p-values are given in Table 3. p-value was used to test the significance of the examined parameters. The parameters with a p-value smaller than 0.05 (p < 0.05) were accepted as statistically significant. As seen in Table 3, yeast extract was the only factor that was highly significant (p < 0.05). The results of PB design also show that peptone, Na2HPO4, and citric acid were insignificant (p > 0.05) nutrient supplements in BC production from waste fig extract.
Table 3.
Effects and coefficients obtained for cellulose production with the Plackett–Burman design.
Bilgi et al. [18] used PB design to evaluate the significant factors in cellulose synthesis using carob and haricot beans, and they found that protein concentration, fermentation time, and inoculum ratio were the most significant parameters in BC production. Zeng et al. [20] statistically optimized culture conditions in BC production using maple syrup as the substrate. By using PB design, they found that fermentation time, concentration of maple syrup, shaking speed, and inoculum size had significant effects on BC production (p < 0.1). In our study, HS medium nutrients were screened for BC production, and yeast extract was found to be the only significant factor in BC production. The significance of yeast extract was anticipated in light of the fact that nitrogen sources are crucial for the growth of Gluconacetobacter xylinus since proteins constitute 8–14% of bacterial cells [18].
3.2. Effect of Yeast Extract Concentration
Nitrogen plays crucial roles in bacterial growth since it forms the primary constituent of microbial biomass, and they are associated with the formation of end products [30]. To investigate the impact of yeast extract concentration, which was identified as a crucial nutrient in BC production through PB design, fermentation was conducted using waste fig extract containing 20 g/L of initial sugar at pH 5.0 and 30 °C for a 7-day period. As seen in Figure 1a, yeast extract concentration had a significant effect on BC production by Komagataeibacter xylinus ATCC 700178. BC increased steadily up to 15 g/L yeast extract concentration, resulting in a cellulose concentration of 4.03 ± 0.07 g/L. Cellulose concentrations obtained with 10 and 13 g/L of yeast extract were 3.53 ± 0.11 and 3.65 ± 0.09 g/L, respectively. Since no significant differences were observed in cellulose concentrations obtained at yeast extract concentrations higher than 10 g/L, this specific concentration was selected for further experiments due to the economy of the process and the feasibility of cellulose production. A separate fermentation experiment was performed using glucose-based standard HS medium with Komagataeibacter xylinus ATCC 700178. It was observed that Komagataeibacter xylinus produced 1.72 g/L ± 0.12 of BC in standard HS medium, which was lower than the BC concentration obtained (2.39 g/L ± 0.15, as seen in Figure 1a, using waste fig medium containing 2% substrate and 0.5% yeast extract.
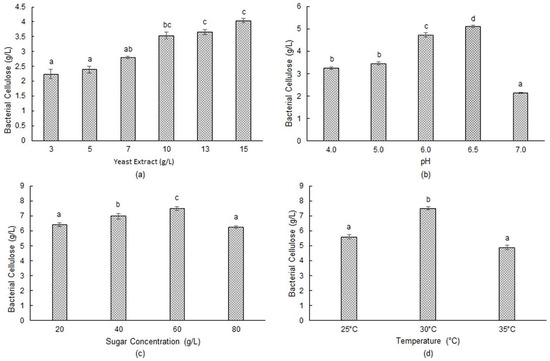
Figure 1.
Effect of various parameters on BC synthesis by Komagataeibacter xylinus ATCC 700178: (a) yeast extract concentration; (b) initial pH; (c) sugar concentration; (d) temperature. Different letters indicate significant differences, and the same letters or no letters indicate no significant differences (p > 0.05).
Carreira et al. [12] produced BC by using different agro-industrial wastes. They observed the highest BC production by using either yeast extract alone or a mixture of yeast extract and KH2PO4 in the culture medium when crude glycerol was used as the substrate. Bekatorou et al. [19] also found that the addition of nitrogen sources (peptone and yeast extract) doubled BC yield when Corinthian currant finishing was employed for this purpose. Kurosumi et al. [9] added peptone and yeast extract to various fruit juices and found that BC concentration was increased by the supplementation of the mentioned nitrogen sources. Consistent with the findings in the literature, the results of this study clearly prove that yeast extract promotes the synthesis of BC by the cells of Komagataeibacter xylinus ATCC 700178.
3.3. Effect of Initial pH
The pH shows an important impact on the synthesis of BC, as it affects the microorganism’s physiology by influencing factors such as nutrient solubility, nutrient uptake, enzyme activity, and oxidative–reductive reactions [39]. The effect of the pH of the fermentation medium was tested within a pH range of 4.0–7.0 using waste fig extract containing 20 g/L initial sugar and 10 g/L yeast extract as the source of nitrogen. Fermentation trials were performed at 30 °C/7 days. Since the pH of the medium altered following sterilization, the initial pH value was the pH value measured after sterilization. As seen in Figure 1b, the highest cellulose concentration of 5.11 ± 0.05 g/L was obtained at an initial pH value of 6.5. Lower cellulose concentrations were obtained at higher and lower pH values. Among the pH values tested, the lowest cellulose concentration of 2.14 ± 0.03 g/L was obtained at pH 7.0. Our results reveal that Komagataeibacter xylinus ATCC 700178 produced substantial amounts of BC across a wide pH spectrum (4.0–6.5), with the highest cellulose concentration observed at pH 6.5. Other researchers have also stated the importance of medium pH on BC synthesis. Parallel to our results, Son et al. [40] studied the effect of medium pH on BC synthesis using Acetobacter sp. A9 and obtained the highest cellulose concentration (3.8 g/L) at an initial pH of 6.5. Hungund and Gupta [41] also found an optimum initial pH value of 6.5 for BC production using a standard HS medium with Gluconacetobacter xylinus. Rani and Appaiah [42] tested different initial pH values for cellulose production and found a maximum BC concentration of 7.40 g/L at an initial pH of 5.5 under stationary conditions using Gluconacetobacter hansenii. Yang et al. [43] studied the effect of initial pH on BC production with Gluconacetobacter xylinus and found the highest cellulose concentration of 5.68 g/L at pH 5.0. They also stated that BC production increased as the pH elevated from 3.0 to 5.0 and BC synthesis was almost zero at a pH of 8.0. Rangaswamy et al. [44] used the strain Gluconacetobacter sp. RV28 for BC production using HS medium and obtained 2.1 g/L of cellulose at an optimum initial pH of 6.0.
In this study, the final pH values obtained were 3.51, 4.02, 4.19, 4.44, and 4.54 for initial pH values of 4.0, 5.0, 6.0, 6.5, and 7.0, respectively. When using Komagataeibacter xylinus for BC synthesis, glucose dehydrogenase enzyme, which is bound to the cell membrane, oxidizes glucose and produces gluconic acid, which lowers the pH to as low as 3.0. This decrease in pH acts as an inhibitory factor for BC synthesis [18,20]. Krystynowicz et al. [45] found that a significant portion of glucose was metabolized to keto—or gluconic—acids in BC production, which decreases the acidity of the fermentation medium to pH 3.5. Zeng et al. [20] used glucose in buffered media for BC synthesis and found that the pH of the fermentation medium decreased to 3.7. When waste fig was used as the substrate in this study, the pH of the media only decreased to 4.0–4.5 (except for the media with a pH starting at 4.0), most probably due to the buffering capacity of the complex fermentation medium being rich in nutrients and components derived from the fig fruit.
3.4. Effect of Initial Sugar Concentration
To investigate the impact of sugar concentration on the production of BC, distilled water was added to the extract obtained from waste figs to contain 20, 40, 60, and 80 g/L of sugar. After inoculating the fermentation medium containing 10 g/L yeast extract with 2% inoculum, fermentation was performed at 30 °C/7 days. The pH of the fermentation medium was adjusted to 6.5 by using 1 M NaOH, since this pH value was found optimum for BC production above sugar concentrations of 40 g/L; the fermentation media exhibited gelation upon pH adjustment to 6.5. This was probably due to the presence of complex polymeric compounds, such as pectin originating from the fig fruit. To prevent gel formation, a commercial enzyme preparation containing pectinase and cellulase activities (Rapidase FC) was employed, as detailed in the Section 2. As shown in Figure 1, BC production was enhanced with increasing concentrations of sugar up to 60 g/L, but it decreased afterward. The highest cellulose concentration of 7.50 ± 0.13 g/L was obtained at a sugar concentration of 60 g/L. At 20, 40, and 80 g/L of initial sugar concentrations, the cellulose concentrations obtained were 6.40 ± 0.13, 6.98 ± 0.18, and 6.26 ± 0.08 g/L, respectively. BC concentration decreased at 80 g/L sugar concentration, most probably due to inhibition observed at high sugar concentrations, which is typical for batch cultures. The substrate conversion percentages (g bacterial cellulose/g initial sugar × 100) of 32.00%, 17.45%, 12.50%, and 7.83% were obtained for 20, 40, 60, and 80 g/L initial sugar concentrations, respectively. It was observed that as the concentration of sugars in the medium increased, the efficiency of the microorganism to utilize them for bacterial cellulose biosynthesis decreased. Similarly, Son et al. [40] and Rani and Appaiah [42] observed a rise in BC production as glucose amounts increased up to 4%, followed by a subsequent decrease. Yang et al. [43] studied BC production from crude and pure glycerol by Gluconacetobacter xylinus KCCM 41431. They obtained 5.68 g/L of cellulose using static culture conditions at a glycerol concentration of 20 g/L. They also reported an inhibitory effect of glycerol at concentrations higher than 40 g/L. Masaoka et al. [46] attributed the decrease in BC production at elevated substrate concentrations to excessive production of gluconic acid in the fermentation medium. This excessive production resulted in the reduction in medium pH below optimal levels, consequently inhibiting the growth and production of BC.
In our study, it is important to highlight that incorporating Rapidase FC enzyme in the preparation of waste fig extract led to an elevation in BC concentration from 5.11 to 6.40 g/L under conditions of 60 g/L initial sugar concentration and pH 6.5. This enhancement could be attributed to the increased solubilization of sugar and other nutrients within the fig extract, consequently rendering these nutrients more accessible and readily available for Komagataeibacter xylinus.
3.5. Effect of Temperature
The role of temperature in BC synthesis is very important, since it has a significant impact on both microbial growth and BC production. In order to investigate the effect of fermentation temperature on BC production, experiments were performed at 25, 30, and 35 °C. Waste fig extract containing 60 g/L of initial sugar (pH 6.5) and 10 g/L yeast extract was used for fermentation experiments. The highest cellulose production of 7.50 ± 0.11 g/L was obtained at 30 °C, while 5.59 ± 0.14 and 4.87 ± 0.14 g/L BC concentrations were obtained at 25 and 35 °C, respectively. Rani and Appaiah [42] used different temperatures (18–40 °C) for BC production and found the highest BC concentration of 7.40 g/L at 27 °C. Rangaswamy et al. [44] investigated the impact of temperature from 20 to 45 °C for BC synthesis using the strain Gluconacetobacter sp. RV28. They concluded that the ideal temperature for BC synthesis was 28–30 °C. Son et al. [40] stated that the Acetobacter sp. A9 strain exhibited cellulose production between 25–30 °C, with peak production observed at 30 °C.
3.6. Optimization of BC Production
The optimum initial sugar, initial pH, and temperature levels that maximize BC synthesis were identified using RSM. Yeast extract, which was found as a significant nutrient in PB design, was excluded from the optimization experiments. This decision was due to the inability of a second-order polynomial function to explain its effect on cellulose production. Including yeast extract would have resulted in a significant lack-of-fit value, indicating a poor fit between the data obtained experimentally and the model. The influence of the three specified variables at three different levels, as well as their interactions on cellulose synthesis, was investigated through the execution of 20 experiments (Table 2) provided by the face-centered statistical design. Rapidase FC enzyme (150–200 g enzyme/kg extract, 45 °C for 1 h) was used to avoid gelation of the waste fig extract. Sugar concentration (X1), pH (X2), and temperature (X3) were the variables tested for optimization trials. The results for the 20 trials (Table 2) reveal notable variations in BC production based on the three independent variables that are important for cellulose synthesis. The analysis of variance (ANOVA) results for cellulose concentration show that the fitted model explains 98.8% of the variability in BC concentration with an R2 value of 0.988. The F-test in the regression yielded a statistically significant result at a 5% level (p < 0.05), suggesting that the model sufficiently describes the variations in BC concentration within the range of factors given in the model. If the F-test for lack of fit were significant, it would imply the need for a more complex model in order to make the data fit to the model. However, Table 4 shows that the lack of fit (0.148) was not significant (p > 0.05), implying that the experimental data were well suited to the proposed model. These results demonstrate that the selected model effectively explains the impacts of sugar concentration, pH, and temperature on cellulose synthesis by Komagataeibacter xylinus ATCC 700178 for a fermentation medium prepared from waste figs containing 10 g/L of yeast extract.
Table 4.
ANOVA and estimated regression coefficients for bacterial cellulose concentration (R2 = 0.988).
Twenty experiments were performed based on the face-centered design. After multiple regression analysis was applied to the experimental data, the subsequent polynomial equation (Equation (4)) of the second order was derived to describe BC production by Komagataeibacter xylinus.
where Y is the BC concentration in g/L. and X1, X2, and X3 are the actual levels of initial sugar concentration, initial pH, and temperature, respectively.
The experimental data were subjected to regression analysis, and the results show that independent variables of initial sugar, initial pH, and temperature showed a statistically significant impact on BC synthesis (p < 0.05). The positive coefficients for initial sugar (X1), pH (X2), and temperature (X3) show that these parameters have a linear effect on cellulose synthesis. The importance of each of the coefficients was determined using probability (p) values. The higher p-value implies a stronger correlation with the related coefficient. The highest linear coefficient (9.174) suggested that the initial pH had the greatest effect on cellulose concentration among the three parameters studied, followed by temperature (5.292) and initial sugar concentration (0.277). These factors likewise had substantial negative quadratic impacts on BC synthesis, which means that BC concentration increased as these parameters increased and reduced above a certain threshold limit. Low p-values (p < 0.05) for interactive terms show significant interactions among these parameters.
Minitab Statistical Software was used to plot response surfaces to investigate the impacts of factors and their interactions on cellulose synthesis. Figure 2, Figure 3 and Figure 4 display surface plots and contour plots of cellulose synthesis for each pair of factors, while the third factor remained constant at its midlevel. These 3D response surface plots and contour plots help to find the optimum levels of the independent variables and facilitate understanding the interactions between variable pairs. While the elliptical nature of contours shows the significance of interactions, the smallest ellipse on the contour diagram represents the highest value of the variable predicted by the model. For instance, as seen in Figure 2, with constant sugar concentration, cellulose concentration decreased as the levels of pH and temperature shifted from midrange to high levels. Figure 3 indicates that cellulose concentration increased with higher sugar concentration and temperature, peaking at the midrange values of the mentioned parameters. Further increase in these factors decreased BC synthesis. Lastly, as seen in Figure 4, BC concentration exhibited an upward trend with midrange levels of temperature while sugar concentration and pH increased, reaching approximately 63 g/L and pH 6.0, respectively.
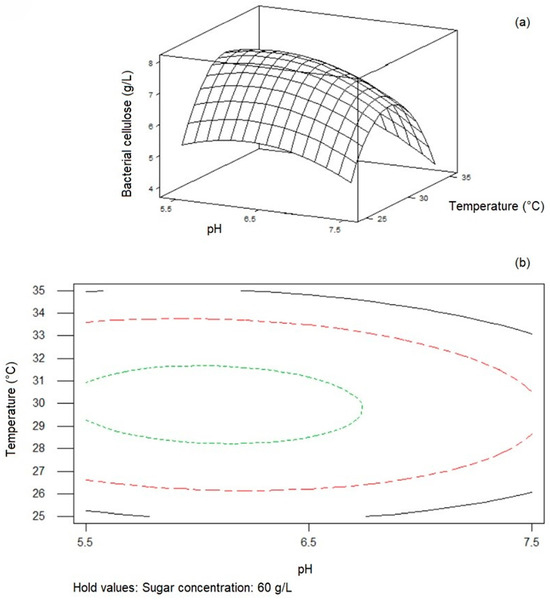
Figure 2.
Response surface plot (a) and contour plot (b) of temperature and initial pH on BC cellulose synthesis by Komagataeibacter xylinus ATCC 700178 with constant initial sugar concentration (60 g/L).
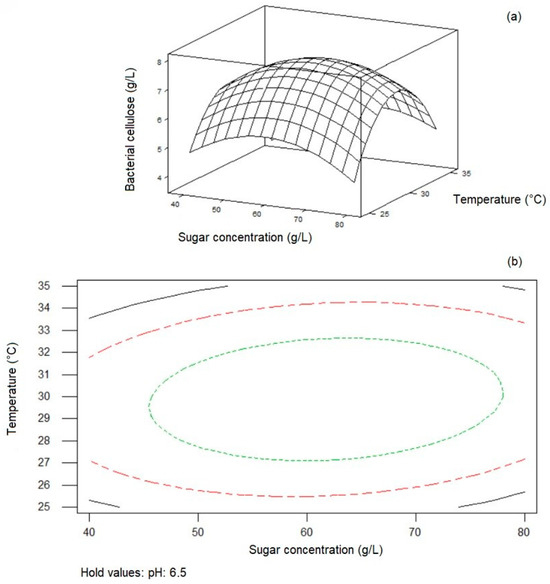
Figure 3.
Response surface plot (a) and contour plot (b) of initial sugar concentration and temperature on BC synthesis by Komagataeibacter xylinus ATCC 700178 with constant initial pH (6.5).
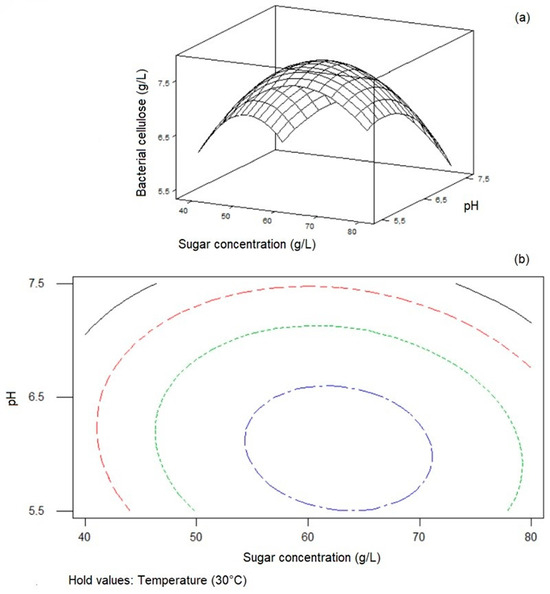
Figure 4.
Response surface plot (a) and contour plot (b) of initial sugar concentration and initial pH on BC synthesis by Komagataeibacter xylinus ATCC 700178 with constant temperature (30 °C).
The highest BC concentration associated with the optimum initial sugar concentration, initial pH, and temperature levels was determined using a second-order polynomial model. The estimation of the levels of sugar concentration (X1 = 62.75 g/L), pH (X2 = 6.05), and temperature (X3 = 30.0 °C) yielding the highest BC concentration of 8.36 g/L was performed by fitting the data obtained by the experiments to Equation (4). The data mentioned above represent the optimization of BC synthesis from waste figs using Komagataeibacter xylinus ATCC 700178 in batch culture.
The validation experiment was performed using waste fig medium with the optimum levels of initial sugar concentration (62.75 g/L), initial pH (6.05), and temperature (30.0 °C) obtained by using the model. A BC concentration of 8.45 ± 0.51 g/L, which was minimally higher than the value obtained using the model (8.36 g/L), was achieved on the 7th day of fermentation. The residual sugar concentration at the end of the fermentation period was 4.4 g L−1. The productivity (p, g cellulose produced per liter fermentation medium per day) and product yield per consumed sugar (YP/S, g cellulose g consumed sugar−1) values under the optimized conditions were 1.194 ± 0.02 g L−1 d−1 and 0.145 ± 0.02 g g−1, respectively. Higher or lower productivity values were found in the literature for thin stillage medium (1.48 g L−1 d−1) by Wu and Liu [14], jujube juice medium (0.375 g L−1 d−1) by Li et al. [15], maple syrup (0.07 g L−1 d−1) by Zeng et al. [20], and industrial hardwood spent sulfite liquor (0.07 g L−1 d−1) by Carreira et al. [12].
The BC concentration obtained in this study using waste figs as the substrate was higher than that of 3.9 g/L for molasses, 3.1 g/L date extract and 1.1 g/L for fig extract [29], 1.8 g/L for carob and haricot bean medium [18], 1.51 g/L for maple syrup [20], 2.25 g/L for wastewater of candied jujube-processing industry [15], 10.8 g/L for cotton-based waste textiles [11], 2.8 g/L for pineapple peel juice [22], 8.2 g/L for spruce hydrolysate [6], 3.24 g/L for pineapple residues [8], 4.03 g/L for soya bean whey [13], 3.82 g/L for R2-treated pineapple peel waste hydrolysate [47], 2.94 g/L for enzymatically hydrolyzed prickly pear peels [48], 1.88 g/L for atmospheric cold plasma -untreated sugarcane bagasse hydrolysate group [49], and 5.2 g/L for extract of tobacco waste [25]. Wu and Liu [14] managed to produce 5.2 g/L of cellulose by utilizing thin stillage from the rice winery industry. By introducing thin stillage as a supplement to the HS medium, they were able to achieve a higher production of BC, reaching 10.38 g/L. Bekatorou et al. [19] obtained a BC concentration of 18.9 g/L for Corinthian currants finishing/whey mixture. Dubey et al. [50] reported that the highest BC concentration of 26.2 g/L was obtained from the hot water extract of sweet lime pulp waste supplemented with the components of HS medium. Guo et al. [51] achieved a bacterial nanocellulose yield of 12.8 g/L using cotton hydrolysate. In the literature, the development of cell-free systems has been developed for improved BC production. Ullah et al. [52] produced 3.72 g/L of BC with a yield of 57.68% through a cell-free system developed by disrupting Gluconacetobacter hansenii PJK. They reported that the improved yield based on glucose indicated the superiority of a cell-free system. The differences in bacterial cellulose yields reported in these studies might be due to the strain of microorganism used, the type of substrate used in BC production, or the specific process conditions applied.
This study shows that one of the most noteworthy concentrations of BC ever recorded was successfully attained through the utilization of waste figs as the substrate.
3.7. Characterization of Bacterial Cellulose
The morphology, structure, and crystallinity of BC samples obtained using the optimum culture conditions were characterized by SEM, ATR-FTIR, and XRD analysis, respectively. Since the distinctive fiber structure of cellulose is important in determining its exceptional properties and applications, SEM analysis was conducted to examine the morphological properties of BC produced by Komagataeibacter xylinus. The micrographs of the surface of BC obtained from HS medium and waste fig medium are presented in Figure 5a and Figure 5b, respectively. BC from HS medium and waste fig medium exhibit a 3D network structure consisting of randomly arranged ribbon-shaped ultrafine fibers. Nanofibers derived from HS medium exhibit a fiber diameter distribution ranging from 18 to 69 nm, and an average diameter of 36 nm. BC obtained from waste fig medium displays nanofibers with diameters of 23 to 90 nm and an average diameter of 44 nm. Hence, SEM analysis did not show any significant differences in the diameters of BC fibers from HS and waste fig medium. However, both BC samples grown on HS and waste fig medium were found to have different morphologies as seen in Figure 5. The flake-like structures in Figure 5b might be residuals of the complex fermentation medium, which might have remained due to improper washing of BC after harvesting.
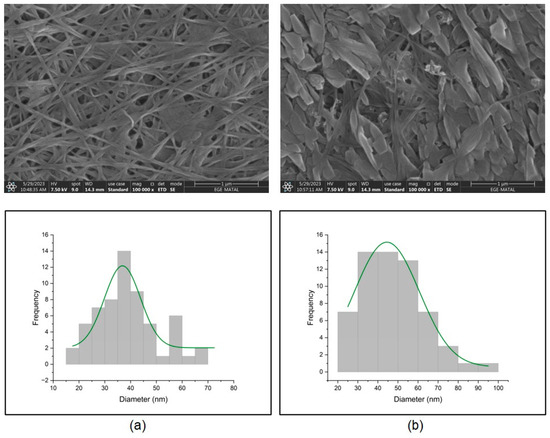
Figure 5.
SEM micrographs and fiber diameter histograms of BC produced by Komagataeibacter xylinus ATCC 700178 from (a) HS medium and (b) waste fig medium.
Parallel to our results, Volova et al. [53] showed that BC nanofibrils obtained from galactose-enriched HS medium had an average diameter of 40 nm. Vazquez et al. [54] reported that BC obtained from various carbon sources had a highly fibrous network-like structure with fibril diameters of 35–70 nm. Cheng et al. [55] and Jittaut et al. [56] obtained similar results for BC fibrils obtained from acetic acid hydrolysate of bagasse and agricultural byproducts (pineapple peel and banana extract), respectively.
An ATR-FTIR spectrum covering the 600–4000 cm−1 range was employed to identify functional groups of the BC. In Figure 6, the prominent absorption peak at 3346 and 2894 cm−1 signifies the stretching vibrations of OH groups and C-H groups, respectively [57]. At 1424 cm−1, a CH2 scissoring motion in cellulose can be observed, while the 1314 cm−1 band corresponds to CH2 wagging, as previously stated by Spiridon et al. [58] and Vazquez et al. [54]. The band at 1161 cm−1 indicates the cellulose C–O–C bridges. The spectral band at 1109 cm−1 reflects the stretching of C–O bonds in cellulose, and the peak at approximately 847 cm−1 represents vibrations associated with β-1,4 bonds [54,57]. The band around 898–894 cm−1 possibly corresponds to the stretching vibrations of the C–O–C bonds found in the β-1,4-glycosidic linkages. Additionally, there were observable out-of-plane bending motions of the C–O–H bonds within the 660–662 cm−1 range [59]. FTIR spectrum obtained from HS medium also showed similar significant peaks compared with the FTIR spectrum obtained from waste fig medium, as shown in Figure 6. The FTIR spectrum obtained in this study proved that the product from waste figs was cellulose. Similar results were reported when utilizing alternative fermentation media to produce BC, such as molasses media [1,57], apple wastes and a mixture of green and black tea [59], tofu liquid waste and rice-washed water [60], and the waste of mango peel [61].
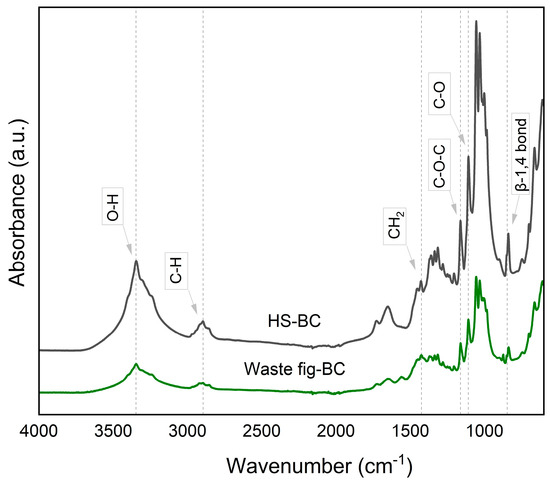
Figure 6.
ATR-FTIR spectra of BC by Komagataeibacter xylinus from HS medium and from waste fig medium.
The XRD patterns derived from the BC samples are displayed in Figure 7. In accordance with the data provided by the International Centre for Diffraction Data® (ICDD®), the diffraction peaks of native cellulose are situated at approximately 2θ values of 14.90°, 16.49°, and 22.84°, corresponding to the crystal lattice planes (001), (110), and (002), respectively [62]. The XRD peaks from the BC membrane obtained from HS are located at 2θ = 14.60°, 16.65°, and 22.85°, while XRD peaks from the waste fig medium are found at 2θ = 14.55°, 16.40°, and 22.85°. These peaks showed the characteristic diffraction pattern associated with cellulose I. Amorim et al. [59] and Vazquez et al. [54] showed similar peaks in their study on BC production from low-cost production media and stated that the BC sheet obtained in their works was native cellulose I. As a result, both BC samples exhibited the typical structure of cellulose with similar crystallinity values of 61 and 70% for BC synthesis from HS and waste fig medium, respectively.
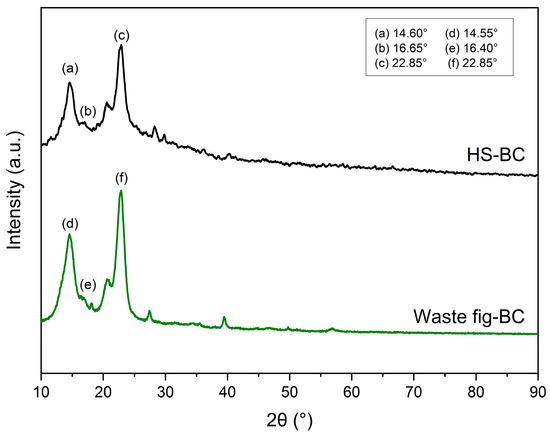
Figure 7.
X-ray diffraction patterns of BC produced by Komagataeibacter xylinus from HS medium and waste fig medium.
4. Conclusions
RSM was successfully used in this work to find the effects of process factors on BC production. Using the optimum levels of initial sugar concentration (62.75 g/L), initial pH 6.05, and temperature (30.0 °C), 8.45 g/L of BC was produced. The synthesis of BC in waste fig medium was almost five times higher than in regular synthetic HS medium. In this study, a BC concentration that ranks among the highest reported so far has been successfully achieved by using waste figs as the substrate. Structural characterization studies showed that the polymer synthesized by Komagataeibacter xylinus was cellulose. The findings of this study demonstrated that waste figs are a cost-effective and efficient substrate for producing BC. Additionally, waste figs can serve as a substrate for generating bioproducts with enhanced value. Future research will focus on optimizing product yield in relation to sugar consumption, water retention and release properties, and the mechanical and thermal characteristics of BC samples.
Supplementary Materials
The following supporting information can be downloaded at https://www.mdpi.com/article/10.3390/fermentation10090466/s1, Figure S1: The image of waste figs obtained from the company under UV light.; Figure S2: Fermentation media prepared according to the Plackett–Burman design; Figure S3: (a) Unpurified bacterial cellulose sample and (b) purified bacterial cellulose sample.
Author Contributions
Y.G. conceived and designed the project and wrote the manuscript; M.Y. conducted experiments and analyzed data. All authors have read and agreed to the published version of the manuscript.
Funding
This research was funded by The Scientific and Technological Research Council of Turkey, TUBITAK (Project No: 222O183). Merve Yilmaz was supported by TUBITAK fellowship (BIDEB 2210-D).
Institutional Review Board Statement
Not applicable.
Informed Consent Statement
Not applicable.
Data Availability Statement
Data are contained within the article and supplementary materials.
Acknowledgments
The authors would like to thank The Scientific and Technological Research Council of Turkey for funding the project and Işık Tarım Urunleri San. ve Tic. A.S. for collaborating throughout the project and supplying waste figs.
Conflicts of Interest
The authors declare no conflicts of interest.
References
- Çakar, F.; Özer, I.; Aytekin, A.Ö.; Şahin, F. Improvement production of bacterial cellulose by semi-continuous process in molasses medium. Carbohydr. Polym. 2014, 106, 7–13. [Google Scholar] [CrossRef]
- El-Gendi, H.; Taha, T.H.; Ray, J.B.; Saleh, A.K. Recent advances in bacterial cellulose: A low-cost effective production media, optimization strategies and applications. Cellulose 2022, 29, 7495–7533. [Google Scholar] [CrossRef]
- Günerhan, Ü.; Us, E.; Dumlu, L.; Yılmaz, V.; Carrère, H.; Perendeci, A.N. Impacts of chemical-assisted thermal pretreatments on methane production from fruit and vegetable harvesting wastes: Process optimization. Molecules 2020, 25, 500. [Google Scholar] [CrossRef] [PubMed]
- Mehri, D.; Perendeci, N.A.; Goksungur, Y. Utilization of whey for red pigment production by Monascus purpureus in submerged fermentation. Fermentation 2021, 7, 75. [Google Scholar] [CrossRef]
- Chen, L.; Hong, F.; Yang, X.X.; Han, S.F. Biotransformation of wheat straw to bacterial cellulose and its mechanism. Bioresour. Technol. 2013, 135, 464–468. [Google Scholar] [CrossRef] [PubMed]
- Guo, X.; Cavka, A.; Jönsson, L.J.; Hong, F. Comparison of methods for detoxification of spruce hydrolysate for bacterial cellulose production. Microb. Cell Fact. 2013, 12, 93. [Google Scholar] [CrossRef] [PubMed]
- Erbas-Kiziltas, E.; Kiziltas, A.; Gardner, D.J. Synthesis of bacterial cellulose using hot water extracted wood sugars. Carbohydr. Polym. 2015, 124, 131–138. [Google Scholar] [CrossRef] [PubMed]
- Algar, I.; Fernandes, S.C.M.; Mondragon, G.; Castro, C.; Garcia-Astari, C.; Gabilondo, N.; Retegi, A.; Eceiza, A. Pineapple agroindustrial residues for the production of high value bacterial cellulose with different morphologies. J. Appl. Polym. Sci. 2014, 132, 41237. [Google Scholar] [CrossRef]
- Kurosumi, A.; Sasaki, C.; Yamashita, Y.; Nakamura, Y. Utilization of various fruit juices as carbon source for production of bacterial cellulose by Acetobacter xylinum NBRC 13693. Carbohydr. Polym. 2009, 76, 333–335. [Google Scholar] [CrossRef]
- Jozala, A.F.; Pértile, R.A.N.; dos Santos, C.A.; de Carvalho Santos-Ebinuma, V.; Seckler, M.M.; Gama, F.M.; Pessoa, A. Bacterial cellulose production by Gluconacetobacter xylinus by employing alternative culture media. Appl. Microbiol. Biotechnol. 2014, 99, 1181–1190. [Google Scholar] [CrossRef]
- Hong, F.; Guo, X.; Zhang, S.; Han, S.; Yang, G.; Jönsson, L.J. Bacterial cellulose production from cotton-based waste textiles: Enzymatic saccharification enhanced by ionic liquid pretreatment. Bioresour. Technol. 2012, 104, 503–508. [Google Scholar] [CrossRef] [PubMed]
- Carreira, P.; Mendes, J.A.S.; Trovatti, E.; Serafim, L.S.; Freire, C.S.R.; Silvestre, A.J.D.; Neto, C.P. Utilization of residues from agro-forest industries in the production of high value bacterial cellulose. Bioresour. Technol. 2011, 102, 7354–7360. [Google Scholar] [CrossRef]
- Suwanposri, A.; Yukphan, P.; Yamada, Y.; Ochaikul, D. Statistical optimisation of culture conditions for biocellulose production by Komagataeibacter sp. PAP1 using soya bean whey. Maejo Int. J. Sci. Technol. 2014, 8, 1–14. [Google Scholar] [CrossRef]
- Wu, J.M.; Liu, R.H. Thin stillage supplementation greatly enhances bacterial cellulose production by Gluconacetobacter xylinus. Carbohydr. Polym. 2012, 90, 116–121. [Google Scholar] [CrossRef] [PubMed]
- Li, Z.; Wang, L.; Hua, J.; Jia, S.; Zhang, J.; Liu, H. Production of nano bacterial cellulose from waste water of candied jujube-processing industry using Acetobacter xylinum. Carbohydr. Polym. 2015, 120, 115–119. [Google Scholar] [CrossRef]
- Tsouko, E.; Kourmentza, C.; Ladakis, D.; Kopsahelis, N.; Mandala, I.; Papanikolaou, S.; Paloukis, F.; Alves, V.; Koutinas, A. Bacterial cellulose production from industrial waste and by-product streams. Int. J. Mol. Sci. 2015, 16, 14832–14849. [Google Scholar] [CrossRef]
- Huang, C.; Yang, X.Y.; Xiong, L.; Guo, H.J.; Luo, J.; Wang, B.; Zhang, H.R.; Lin, X.Q.; Chen, X.D. Evaluating the possibility of using acetone-butanol-ethanol (ABE) fermentation wastewater for bacterial cellulose production by Gluconacetobacter xylinus. Lett. Appl. Microbiol. 2015, 60, 491–496. [Google Scholar] [CrossRef]
- Bilgi, E.; Bayir, E.; Sendemir-Urkmez, A.; Hames, E.E. Optimization of bacterial cellulose production by Gluconacetobacter xylinus using carob and haricot bean. Int. J. Biol. Macromol. 2016, 90, 2–10. [Google Scholar] [CrossRef]
- Bekatorou, A.; Plioni, I.; Sparou, K.; Maroutsiou, R.; Tsafrakidou, P.; Petsi, T.; Kordouli, E. Bacterial cellulose production using the corinthian currant finishing side-stream and cheese whey: Process optimization and textural characterization. Foods. 2019, 8, 193. [Google Scholar] [CrossRef]
- Zeng, X.; Small, D.P.; Wan, W. Statistical optimization of culture conditions for bacterial cellulose production by Acetobacter xylinum BPR 2001 from maple syrup. Carbohydr. Polym. 2011, 85, 506–513. [Google Scholar] [CrossRef]
- Kurt, A.S.; Cekmecelioglu, D. Bacterial cellulase production using grape pomace hydrolysate by shake-flask submerged fermentation. Biomass Convers. Biorefin. 2021, 2, 1–8. [Google Scholar] [CrossRef]
- Castro, C.; Zuluaga, R.; Putaux, J.L.; Caro, G.; Mondragon, I.; Gañán, P. Structural characterization of bacterial cellulose produced by Gluconacetobacter swingsii sp. from Colombian agroindustrial wastes. Carbohydr. Polym. 2011, 84, 96–102. [Google Scholar] [CrossRef]
- Ha, J.H.; Shehzad, O.; Khan, S.; Lee, S.Y.; Park, J.W.; Khan, T.; Park, J.K. Production of bacterial cellulose by a static cultivation using the waste from beer culture broth. Korean J. Chem. Eng. 2008, 25, 812–815. [Google Scholar] [CrossRef]
- Brugnoli, M.; La China, S.; Lasagni, F.; Romeo, F.V.; Pulvirenti, A.; Gullo, M. Acetic acid bacteria in agro-wastes: From cheese whey and olive mill wastewater to cellulose. Appl. Microbiol. Biotechnol. 2023, 107, 3729–3744. [Google Scholar] [CrossRef] [PubMed]
- Ye, J.; Zheng, S.; Zhang, Z.; Yang, F.; Ma, K.; Feng, Y.; Yang, X. Bacterial cellulose production by Acetobacter xylinum ATCC 23767 using tobacco waste extract as culture medium. Bioresour. Technol. 2019, 274, 518–524. [Google Scholar] [CrossRef]
- Ayuso, M.; Carpena, M.; Taofiq, O.; Albuquerque, T.G.; Simal-Gandara, J.; Oliveira, M.B.P.; Barros, L. Fig “Ficus carica L.” and its by-products: A decade evidence of their health-promoting benefits towards the development of novel food formulations. Trends Food Sci. Technol. 2022, 127, 1–13. [Google Scholar] [CrossRef]
- Buenrostro-Figueroa, J.J.; Velázquez, M.; Flores-Ortega, O.; Ascacio-Valdés, J.A.; Huerta-Ochoa, S.; Aguilar, C.N.; Prado-Barragán, L.A. Solid state fermentation of fig (Ficus carica L.) by-products using fungi to obtain phenolic compounds with antioxidant activity and qualitative evaluation of phenolics obtained. Process Biochem. 2017, 62, 16–23. [Google Scholar] [CrossRef]
- Gharibzahedi, S.M.T.; Smith, B.; Guo, Y. Ultrasound-microwave assisted extraction of pectin from fig (Ficus carica L.) skin: Optimization, characterization and bioactivity. Carbohydr. Polym. 2019, 222, 114992. [Google Scholar] [CrossRef]
- Abol-Fotouh, D.; Hassan, M.A.; Shokry, H.; Roig, A.; Azab, M.S.; Kashyout, A.E.H.B. Bacterial nanocellulose from agro-industrial wastes: Low-cost and enhanced production by Komagataeibacter saccharivorans MD1. Sci. Rep. 2020, 10, 3491. [Google Scholar] [CrossRef] [PubMed]
- Gomes, R.J.; Ida, E.I.; Spinosa, W.A. Nutritional supplementation with amino acids on bacterial cellulose production by Komagataeibacter intermedius: Effect analysis and application of response surface methodology. Appl. Biochem. Biotechnol. 2022, 194, 5017–5036. [Google Scholar] [CrossRef]
- Dagbagli, S.; Goksungur, Y. Optimization of β-galactosidase production in Stirred Tank Bioreactor using Kluyveromyces lactis NRRL Y-8279. Food Sci. Biotechnol. 2009, 18, 1342–1350. [Google Scholar] [CrossRef]
- Silbir, S.; Goksungur, Y. Natural red pigment production by Monascus purpureus in submerged fermentation systems using a food industry waste: Brewer’s spent grain. Foods. 2019, 8, 161. [Google Scholar] [CrossRef]
- Moosavi-Nasab, M.; Layegh, B.; Aminlari, L.; Hashemi, M.B. Microbial production of levan using date syrup and investigation of its properties. World Acad. Sci. Eng. Technol. 2010, 44, 1248–1254. [Google Scholar]
- Myers, R.H.; Montgomery, D.D. Response Surface Methodology: Process and Product Optimization Using Designed Experiments, 1st ed.; John Wiley & Sons: New York, NY, USA, 1995; pp. 1–67. [Google Scholar]
- Miller, G.L. Use of dinitrosalicylic acid reagent for determination of reducing sugar. Anal Chem. 1959, 31, 426–428. [Google Scholar] [CrossRef]
- Kjeldahl, J.G.C. En ny Methode til Kvaelstofvestemmelse i organiske Stoffer. Z. Anal. Chem. 1883, 22, 366–382. [Google Scholar] [CrossRef]
- Mikkelsen, D.; Flanagan, B.M.; Dykes, G.A.; Gidley, M.J. Influence of different carbon sources on bacterial cellulose production by Gluconacetobacter xylinus strain ATCC 53524. J. Appl. Microbiol. 2009, 107, 576–583. [Google Scholar] [CrossRef]
- Mohamad, S.; Abdullah, L.C.; Jamari, S.S.; Al Edrus, S.S.O.; Aung, M.M.; Mohamad, S.F.S. Influence of drying method on the crystal structure and thermal property of oil palm frond juice-based bacterial cellulose. J. Mater. Sci. 2022, 57, 1462–1473. [Google Scholar] [CrossRef]
- Panesar, P.S.; Chavan, Y.; Chopra, H.K.; Kennedy, J.F. Production of microbial cellulose: Response surface methodology approach. Carbohydr. Polym. 2012, 87, 930–934. [Google Scholar] [CrossRef]
- Son, H.J.; Heo, M.S.; Kim, Y.G.; Lee, S.J. Optimization of fermentation conditions for the production of bacterial cellulose by a newly isolated Acetobacter sp. A9 in shaking cultures. Biotechnol. Appl. Biochem. 2001, 33, 1–5. [Google Scholar] [CrossRef]
- Hungund, B.S.; Gupta, S.G. Factors affecting production of bacterial cellulose from Gluconacetobacter xylinus. Asian J. Microbiol. Biotechnol. Environ. Sci. 2010, 12, 517–522. [Google Scholar]
- Rani, M.U.; Appaiah, A. Optimization of culture conditions for bacterial cellulose production from Gluconacetobacter hansenii UAC09. Ann. Microbiol. 2011, 61, 781–787. [Google Scholar] [CrossRef]
- Yang, H.J.; Take, L.; Kim, J.R.; Choi, Y.E.; Park, C. Improved production of bacterial cellulose from waste glycerol through investigation of inhibitory effects of crude glycerol-derived compounds by Gluconacetobacter xylinus. J. Ind. Eng. Chem. 2019, 75, 158–163. [Google Scholar] [CrossRef]
- Rangaswamy, B.E.; Vanitha, K.P.; Hungund, B.S. Microbial Cellulose Production from Bacteria Isolated from Rotten Fruit. Int. J. Polym. Sci. 2015, 2015, 280784. [Google Scholar] [CrossRef]
- Krystynowicz, A.; Czaja, W.K.; Wiktorowska-Jezierska, A.; Gonçalves-Mi’skiewicz, M.; Turkiewicz, M.; Bielecki, S. Factors affecting the yield and properties of bacterial cellulose. J. Ind. Microbiol. Biotechnol. 2002, 29, 189–195. [Google Scholar] [CrossRef] [PubMed]
- Masaoka, S.; Ohe, T.; Sakota, N. Production of cellulose from glucose by Acetobacter xylinum. J. Ferment. Bioeng. 1993, 75, 18–22. [Google Scholar] [CrossRef]
- Santoso, S.P.; Lin, S.P.; Wang, T.Y.; Ting, Y.; Hsieh, C.W.; Yu, R.C.; Angkawijaya, A.E.; Soetaredjo, F.E.; Hsu, H.Y.; Cheng, K.C. Atmospheric cold plasma-assisted pineapple peel waste hydrolysate detoxification for the production of bacterial cellulose. Int. J. Biol. Macromol. 2021, 175, 526–534. [Google Scholar] [CrossRef]
- El-Gendi, H.; Salama, A.; El-Fakharany, E.M.; Saleh, A.K. Optimization of bacterial cellulose production from prickly pear peels and its ex situ impregnation with fruit byproducts for antimicrobial and strawberry packaging applications. Carbohydr. Polym. 2023, 302, 120383. [Google Scholar] [CrossRef]
- Lin, S.P.; Huang, S.H.; Ting, Y.; Hsu, H.Y.; Cheng, K.C. Evaluation of detoxified sugarcane bagasse hydrolysate by atmospheric cold plasma for bacterial cellulose production. Int. J. Biol. Macromol. 2022, 204, 136–143. [Google Scholar] [CrossRef]
- Dubey, S.; Singh, J.; Singh, R.P. Biotransformation of sweet lime pulp waste into high-quality nanocellulose with an excellent productivity using Komagataeibacter europaeus SGP37 under static intermittent fed-batch cultivation. Bioresour Technol. 2018, 247, 73–80. [Google Scholar] [CrossRef]
- Guo, X.; Chen, L.; Tang, J.; Jönsson, L.J.; Hong, F.F. Production of bacterial nanocellulose and enzyme from [AMIM]Cl-pretreated waste cotton fabrics: Effects of dyes on enzymatic saccharification and nanocellulose production. J. Chem. Technol. Biothnol. 2015, 91, 1413–1421. [Google Scholar] [CrossRef]
- Ullah, M.W.; Ul-Islam, M.; Khan, S.; Kim, Y.; Park, J.K. Innovative production of bio-cellulose using a cell-free system derived from a single cell line. Carbohydr. Polym. 2015, 132, 286–294. [Google Scholar] [CrossRef]
- Volova, T.G.; Prudnikova, S.V.; Sukovatyi, A.G.; Shishatskaya, E.I. Production and properties of bacterial cellulose by the strain Komagataeibacter xylinus B-12068. Appl. Microbiol. Biotechnol. 2018, 102, 7417–7428. [Google Scholar] [CrossRef]
- Vazquez, A.; Foresti, M.L.; Cerrutti, P.; Galvagno, M. Bacterial cellulose from simple and low cost production media by Gluconacetobacter xylinus. J. Polym. Environ. 2012, 21, 545–554. [Google Scholar] [CrossRef]
- Cheng, Z.; Yang, R.; Liu, X. Production of bacterial cellulose by Acetobacter xylinum through utilizing acetic acid hydrolysate of bagasse as low-cost carbon source. BioResources 2017, 12, 1190–1200. [Google Scholar] [CrossRef]
- Jittaut, P.; Hongsachart, P.; Audtarat, S.; Dasri, T. Production and characterization ofc bacterial cellulose produced by Gluconacetobacter xylinus BNKC 19 using agricultural waste products as nutrient source. Arab. J. Basic Appl. Sci. 2023, 30, 221–230. [Google Scholar] [CrossRef]
- Atykyan, N.; Revin, V.; Shutova, V. Raman and FT-IR Spectroscopy investigation the cellulose structural differences from bacteria Gluconacetobacter sucrofermentans during the different regimes of cultivation on a molasses media. AMB Express 2020, 10, 84. [Google Scholar] [CrossRef]
- Spiridon, I.; Teaca, C.; Bodirlau, R. Structural changes evidenced by FTIR spectroscopy in cellulosic materials after pre-treatment with ionic liquid and enzymatic hydrolysis. BioResources 2011, 6, 400–413. [Google Scholar] [CrossRef]
- Amorim, L.F.A.; Li, L.; Gomes, A.P.; Fangueiro, R.; Gouveia, I.C. Sustainable bacterial cellulose production by low cost feedstock: Evaluation of apple and tea by-products as alternative sources of nutrients. Cellulose 2023, 30, 5589–5606. [Google Scholar] [CrossRef]
- Apriyana, A.Y.; Andriani, D.; Karina, M. Production of bacterial cellulose from tofu liquid waste and rice-washed water: Morphological property and its functional groups analysis. IOP Conf. Ser. Earth Environ. Sci. 2020, 483, 012005. [Google Scholar] [CrossRef]
- Hasanin, M.S.; Abdelraof, M.; Hashem, A.H.; El Saied, H. Sustainable bacterial cellulose production by Achromobacter using mango peel waste. Microb. Cell Fact. 2023, 22, 24. [Google Scholar] [CrossRef]
- Rusdi, R.A.A.; Halim, N.A.; Norizan, M.N.; Abidin, Z.H.Z.; Abdullah, N.; Ros, F.C.; Ahmad, N.; Azmi, A.F.M. Pre-treatment effect on the structure of bacterial cellulose from Nata de Coco (Acetobacter xylinum). Polimery 2022, 67, 110–118. [Google Scholar] [CrossRef]
Disclaimer/Publisher’s Note: The statements, opinions and data contained in all publications are solely those of the individual author(s) and contributor(s) and not of MDPI and/or the editor(s). MDPI and/or the editor(s) disclaim responsibility for any injury to people or property resulting from any ideas, methods, instructions or products referred to in the content. |
© 2024 by the authors. Licensee MDPI, Basel, Switzerland. This article is an open access article distributed under the terms and conditions of the Creative Commons Attribution (CC BY) license (https://creativecommons.org/licenses/by/4.0/).