Article

Bioinformatics Analysis of Diadenylate Cyclase Regulation on Cyclic Diadenosine Monophosphate Biosynthesis in Exopolysaccharide Production by Leuconostoc mesenteroides DRP105

1
Engineering Research Center of Agricultural Microbiology Technology, Ministry of Education & Heilongjiang Provincial Key Laboratory of Plant Genetic Engineering and Biological Fermentation Engineering for Cold Region & Key Laboratory of Microbiology, College of Heilongjiang Province & School of Life Sciences, Heilongjiang University, Harbin 150080, China
2
Guangxi Key Laboratory for Polysaccharide Materials and Modifications, School of Marine Sciences and Biotechnology, Guangxi Minzu University, Nanning 530008, China
*
Authors to whom correspondence should be addressed.
These authors contributed equally to this work.
Fermentation 2025, 11(4), 196; https://doi.org/10.3390/fermentation11040196
Submission received: 6 March 2025 / Revised: 3 April 2025 / Accepted: 4 April 2025 / Published: 7 April 2025

Abstract

:
Lactic acid bacteria exopolysaccharides (EPS) have a variety of excellent biological functions and are widely used in the food and pharmaceutical industries. The complex metabolic system of lactic acid bacteria and the mechanism of EPS biosynthesis have not been fully analyzed, which limits the wider application of EPS. EPS synthesis is regulated by cyclic diadenosine monophosphate (c-di-AMP), but the exact mechanism remains unclear. Dac and pde are c-di-AMP anabolic genes, gtfA, gtfB and gtfC are EPS synthesis gene clusters, among which gtfC was the key gene for EPS synthesis in Leuconostoc mesenteroides DRP105. In order to explore whether diadenylate cyclase (DAC) can catalyze the synthesis of c-di-AMP from ATP, the sequence of DAC was analyzed by bioinformatics based on the whole genome sequence. DAC was a CdaA type diadenylate cyclase containing the classical domain DisA_N and DGA and RHR motifs. The secondary structure was mainly composed of α-helices, and AlphaFold2 was used to model the 3D structure of the protein and evaluate the rationality of the DAC protein structure model. A total of 8 salt bridges, 21 hydrogen bonds and 221 non-bonded interactions were found between DAC and GtfC. Molecular docking simulations revealed ATP1 and ATP2 fully occupied the binding pocket of DAC and interacted directly with the binding site residues of DAC. The molecular dynamics simulations showed that the binding of DAC to ATP molecules was relatively stable. Gene and enzyme correlation analysis found that dac and gtfC gene expression were significantly positively correlated with DAC enzyme activity, c-di-AMP content and EPS production, and had no significant correlation with PDE enzyme activity responsible for c-di-AMP degradation. Bioinformatics analysis of the regulatory role of DAC in the synthesis of EPS by lactic acid bacteria was helpful to fully reveal the biosynthetic mechanism of EPS and provide theoretical basis for large-scale industrial production of EPS.

1. Introduction

Exopolysaccharides (EPS) are a kind of secondary metabolite secreted into the extracellular space of lactic acid bacteria during growth and metabolism [1]. EPS has a variety of biological functions, such as antioxidant, anti-tumor, intestinal barrier repair and anti-virus, and is widely used in various fields [2,3,4,5,6]. At present, the research on EPS mainly focuses on the synthesis and characterization of EPS, but the regulation mechanisms of EPS synthesis are relatively few. Glucansucrase is a glycosyltransferase belonging to the glycoside hydrolase family 70 (GH70) [7]. It is a key enzyme in the synthesis of EPS, which catalyzes the synthesis of EPS and oligosaccharides using the glucose unit of a sucrose donor [8]. Although glucansucrase regulates the synthesis of EPS in lactic acid bacteria, the complex metabolic system of lactic acid bacteria makes it such that EPS is not only regulated by glucansucrase synthesis, but also regulated by other metabolic pathways. The metabolic regulation mechanism of bacterial EPS by quorum sensing (QS) system and two-component regulatory system (TCS) has been gradually clarified [9,10]. In recent years, second messengers have been gradually discovered to be important regulators that can affect EPS biosynthesis, although the specific metabolic regulation mechanism remains to be revealed [11].
Cyclic diadenosine monophosphate (c-di-AMP) is a common second messenger in bacteria, which is responsible for the regulation of transcription initiation, mRNA post-initiation regulation, allosteric regulation of translated proteins, and regulation of the anabolism of related substances [12]. There has been a boom in c-di-AMP research, revealing many important cellular pathways mediated by c-di-AMP. Bacterial intracellular c-di-AMP levels are maintained by two enzymes with opposite functions: diadenylate cyclase (DAC) and phosphodiesterase (PDE) [13]. DAC is responsible for c-di-GMP synthesis, while PDE is responsible for its degradation. Furthermore, fluctuations in c-di-AMP levels are a direct trigger of signal transduction pathways that regulate different bacterial physiological processes [14]. Up to now, many types of DAC have been found, mainly including five types, including DisA, CdaA (also known as DacA), CdaS, CdaM, and CdaZ [15]. All five types of DAC have the same domain, the DisA_N domain, which is responsible for the catalytic synthesis of c-di-AMP from ATP molecules. This domain is originally characterized as an N-terminal domain in the DNA integrity scanning protein DisA [16]. C-di-AMP is synthesized by many bacteria and archaea and binds to a large number of proteins and riboswitches in them, and is usually involved in potassium and osmotic homeostasis. C-di-AMP synthesis by the diadenylate cyclase CdaA is modulated by the peptidoglycan biosynthesis enzyme GlmM in Lactococcus lactis [17]. Herzberg et al. [18] investigated the physiological role of c-di-AMP in Bacillus subtilis and found that c-di-AMP inhibits the expression and activity of the potassium uptake system by binding to riboswitches and transport proteins and activates potassium exporter activity. In Streptococci, c-di-AMP may affect bacterial growth, morphology, biofilm formation, competence programs, drug resistance, and bacterial pathogenesis [19]. C-di-AMP is a multifaceted regulator of central metabolic and osmotic homeostasis in Listeria monocytogenes [20]. Du et al. [21] conducted multiple sequence alignment of DAC in Lactobacillus plantarum and showed that DAC contained a DisA_N domain, DGA motif (metal ion-binding region) and RHR motif (ATP-binding region), which were essential for c-di-AMP synthesis. There are a large number of rigid regions in the middle region of DAC, which should be the link domain connecting the N-terminal and C-terminal domains of the protein. The C-terminal domain may be related to DNA damage repair. In addition, the RHR motif is essential for the activity of the DAC protein, which is responsible for the binding of ATP. In the study by Bai et al. [22], the conserved RHR motif in Mycobacterium tuberculosis Rv3586 DacA was mutated to AAA, completely eliminating the c-di-AMP activity of DacA. In addition to this, the conserved residues located before and after the RHR are also critical for the activity of the enzyme. In this study, we used computer simulations to the RHR motif in DAC of Leuconostoc mesenteroides DRP105.
At present, studies on the regulation of glucansucrase by c-di-AMP mainly focus on pathogenic bacteria such as Streptococcus mutans [23]. The understanding of this regulatory mechanism in lactic acid bacteria is still limited. Although it has been reported that lactic acid bacteria regulate the expression and activity of glucansucrase through the c-di-AMP signaling pathway [17], the interaction between DAC and glucansucrase in EPS synthesis has not been comprehensively studied. Therefore, exploring the roles of DAC, c-di-AMP and glucansucrase in the synthesis of EPS in lactic acid bacteria can understand the biosynthetic pathway of EPS and provide new ideas and theoretical basis for the industrial production of EPS.

2. Materials and Methods

2.1. Dac Sequence Analysis

In a previous study, L. mesenteroides DRP105, a strain producing EPS, was isolated from sauerkraut in northeast China. After whole genome sequencing, c-di-AMP anabolic gene (dac) and EPS synthesis gene (gtfC) were identified [24]. The dac sequences were input to the NCBI database (https://www.ncbi.nlm.nih.gov/) (accessed on 2 March 2023). “Nucleotide BLAST” was selected, and the target protein gene sequence was entered in the empty box for homology analysis. The dac sequences were translated into protein sequences, and protein multiple sequence alignment was performed through the NCBI database. The eight and twenty protein sequences with the highest homologies were selected and saved in “fasta” format. The fasta file of the above eight protein sequences were imported into Clustal X (version 2.1; University College Dublin (UCD), Dublin, Ireland) software. We selected “Alignment”–“Do Complete Alignment” and saved the path as “desktop” [25]. We then clicked OK, and saved the file as an msf file. Then, the msf file was imported into GeneDock (version 2.7; NRBSC Institute Inc., Pittsburgh, PA, USA) software. Comparison of the results of multiple sequence alignment was ultimately conducted using Hiplot cloud platform (https://hiplot.com.cn/home/index.html) (accessed on 2 March 2023) beautification analysis [26].

2.2. DAC Protein Evolutionary Tree Analysis

The fasta files of 20 protein sequences obtained in the above “Protein BLAST” were aligned using MEGA (version 11; Temple University, Philadelphia, PA, USA) software [27], selecting “ALIGN” on the homepage of MEGA 11 and clicking “Edit/Build Alignment”. We then selected “Create new alignment”, and then selected “Protein”, before clicking “Edit”, selecting “Insert Sequence From File” to import the sequence, and selecting Clustal W (version 2.1; European Bioinformatics Institute (EMBL-EBI), Hinxton, Cambridge, UK) according to the default parameters for comparison. After pruning the asymmetric sequences on both sides, we clicked “Data” and selected “Phylogenetic Analysis” for phylogenetic analysis. Then, the phylogenetic tree of DAC proteins was constructed by the Neighbor-Joining Algorithm (NJ) [28]. FigTree (version 1.4.4; Andrew Rambaut, Institute of Evolutionary Biology, University of Edinburgh, Edinburgh, UK) software was used for beautification.

2.3. DAC Secondary Structure and Tertiary Structure Prediction

The online SOPMA (NPSP@ SOPMA secondary structure prediction results, NPSA, Lyon, France (inserm.fr)) server was used to predict the secondary structure [29]. Using the AlphaFold2 to predict protein tertiary structure, we entered the AlphaFold2 website (http://colab.research.google.com) (accessed on 2 March 2023), input the protein sequence in the “query_sequence”, clicked “Runtime”, and selected all run [30]. After the prediction, the credibility score is displayed directly in the results. The higher the score, the greater the credibility. We downloaded the results package, which contained the predicted protein structure results in the PDB file. Chimera X (version 1.8; University of California, San Francisco (UCSF), San Francisco, CA, USA) is able to visualize the AlphaFold2 prediction results, as well as show the tertiary structure of proteins and the results of protein–protein interactions [31]. We then open the PDB format files for all prediction models in Chimera X, such that visual pictures of the accuracy of the protein models are obtained. These pictures can more intuitively judge the quality of protein structure prediction.

2.4. Evaluation of DAC Protein Conformation

Protein conformational plausibility was assessed using the Saves server [32]. The file was input to an online web site (https://saves.mbi.ucla.edu/) (accessed on 2 March 2023). The Laplace plot checked whether the angles of the two sides of protein Cα were reasonable, and gave a series of stereochemical parameters (backbone) for the submitted model, using the high-resolution crystal structure parameters in the PDB as reference. The output results included the following: the Laplace diagram, overall G-coefficient, secondary structure diagram, hydrogen bond energy, etc. The number of non-bonded interactions (side chains) formed between different atom-type pairs within 0.35 nm was calculated.

2.5. DAC-Targeted Mutagenesis and ATP Docking

In the pubchem database (https://pubchem.ncbi.nlm.nih.gov/) (accessed on 3 March 2023), a PDB file for the ATP molecules (pubchem CID: 86711126) was downloaded online, and the tertiary structure of the DAC protein constructed by AlphaFold2 was used as the docking receptor. The receptor and ligand molecules were hydrogenated using Autodock Vina (version 1.2.0; Oleg Trott, Scripps Research, La Jolla, CA, USA) and the file was saved in PDBQT format [33]. After molecular docking, the receptor–ligand complex with the highest score was selected, and the generated conformation was visualized by PyMoL (version 1.7.2.1; DeLano Scientific LLC, San Carlos, CA, USA), and the docking results were analyzed.
A rational design-based site-directed mutagenesis (SDM) approach was employed to specifically replace the arginine (Arg, R) residue at position 137 within the conserved RHR motif of DAC. The wild-type amino acid sequence at this position was Arg (R), encoded by the codon CGG. A substitution mutation (C→A) was introduced to replace the original codon CGG with CAG, resulting in an amino acid substitution from Arg to glutamine (Gln, Q).

2.6. Prediction of Interaction Between DAC and Glucansucrase Proteins

The 3D structure of GtfC was constructed using AlphaFold2, and the specific construction method was the same as 2.3 [30]. The PDB file of the resulting GtfC molecule was used as the ligand for molecular docking, and the acceptor was the DAC protein tertiary structure constructed by AlphaFold2 as described above. Then, the receptor and ligand molecules were hydrogenated using the Autodock Vina software and the file format was saved as PDBQT. The docking parameters’ XYZ centers were 1.635, −0.803, −4.612, the XYZ sizes were 79.733, 61.461, and 93.022, exhaustiveness was set to 10, num-modes were set to 20. After molecular docking, the receptor–ligand complex with the highest score was selected, and the generated conformation was visualized by PyMoL software. The interaction between GtfC and DAC was analyzed using PDBsum (version 1.0; Wellcome Sanger Institute, Hinxton, Cambridge, UK) software and protein–ligand interaction profiler (PLIP) software (version 1.0; University of Leipzig (UL), Leipzig, Saxony, Germany).

2.7. Molecular Dynamics (MD) Simulation of DAC and ATP

The Gromacs (version 2022.3; University of Groningen (UG), Groningen, The Netherlands) software was used for molecular dynamics simulation [34,35]. AmberTools (version 22, USA) was used for small molecule pretreatment to add generalized amber force field (GAFF) to small molecules, and Gaussian (version 16W; Gaussian, Inc., Wallingford, CT, USA) was used for small molecule hydrogenation and restrained electrostatic potential (RESP) potential calculation [36]. Potential data were added to the molecular dynamics system topology file [37]. The simulation conditions were carried out at a static temperature of 300 K and atmospheric pressure (1 Bar) using Amber 99 sb-ildn for the force field with water molecules as solvent, and the total charge of the simulation system was neutralized by adding an appropriate number of Na+ ions. In the molecular dynamics simulation system, the steepest descent method was used for energy minimization, and then the isothermal isovolumetric ensemble (NVT) equilibration and isothermal isopressure ensemble (NPT) equilibration were performed for 100,000 steps, respectively, with a coupling constant of 0.1 ps and a duration of 150 ps [38]. Finally, the free molecular dynamics simulation was run with a total of 5,000,000 steps, a step size of 2 fs, and a total time of 150 ns. After the simulation, the trajectories were analyzed by the built-in tool of the software, and the root mean square deviation (RMSD), root mean square fluctuation (RMSF), binding free energy (MMGBSA), radius of gyration (Rg), solvent-accessible surface area (SASA), defining secondary structure of proteins (DSSP), hydrogen bond analysis, and free energy landscape of each amino acid trajectory were calculated.

2.8. Determination of EPS Content

L. mesenteroides DRP105 was inoculated into MRS-S medium at a final concentration of 5% sucrose. Cultures were incubated at 30 °C and 120 rpm for 72 h, and samples were taken at 6 h intervals. Samples were centrifuged at 10,000 rpm for 30 min at 4 °C to remove cells and debris. Subsequently, three times the volume of 95% (w/v) ethanol was added at 4 °C to precipitate and isolate EPS. From this, crude EPS can be obtained. The content of EPS produced by L. mesenteroides DRP105 was determined according to the phenol–sulfuric acid method, and the standard curve was drawn with glucose as the standard [39].

2.9. Determination of Glucansucrase Activity

The glucose group of sucrose in the substrate can release fructose under the action of glucansucrase. Fructose is a reducing sugar, so enzyme activity can be measured at a rate that reflects the formation of middle fructose. The unit of enzyme activity was defined as 1 U equal to 1 μM fructose [40]. Fructose content can be determined by the improved DNS method, and the specific method of experimental determination was slightly modified according to the literature [41]. The reaction was initiated by adding 0.1 mL of crude enzyme solution and 9 mL of reaction substrate buffer to the reaction system in a total volume of 1 mL, followed by the addition of 1 mL of DNS reagent in a water bath at 30 °C for 30 min and boiling and heating in a water bath at 100 °C for 5 min. After cooling to room temperature, 8 mL of milli-Q water was added and shaken, and absorbance values were measured at 520 nm by UV spectrophotometry. Experiments were performed in triplicate for each sample, and the enzyme activities in the samples were calculated by the standard curve formula.

2.10. Detection of c-di-AMP Content and Related Enzyme Activities

The supernatant was removed by centrifugation of the fermentation broth, and the cells were resuspended in milli-Q water. Cell fragmentation was carried out using a cell fragmentation apparatus with the following parameters: ice bath, 20% power or 200 W, 3 s sonication, 5 s interval, and 30 repetitions. An enzyme-linked immunosorbent assay was used to determine the activities of DAC and PDE and the content of c-di-AMP [42], according to the instructions for the operation of the content of the test. Absorbance was measured at the optical density (OD) at 450 nm, and the enzyme activity of the fermentation broth was calculated according to the standard curve.

2.11. Determination of Relative Gene Expression

Total RNA was extracted by FreeZol Reagent kit. NanoDrop 2000 ultramicrospectrophotometer was used to measure the concentration of total RNA and the ratio of the OD at 260 nm and 280 nm. The purity of RNA was judged according to the ratio of the OD at 260 nm and 280 nm, and the integrity of extracted RNA was detected by 1% agarose gel electrophoresis. The extracted total RNA was used as a template for reverse transcription of RNA from different treatment groups and time points using the HiScript III RT SuperMix for qPCR (+gDNA wiper) reverse transcription kit. The resulting cDNA was stored in a −80 °C refrigerator until use. The obtained cDNA was used as a template for qRT-PCR using the designed fluorescent quantitative PCR primers for each gene. According to the cycle threshold (Ct, the Ct value represents the number of amplification cycles when the fluorescence signal of the amplified product reaches the set fluorescence threshold) value of each sample, the relative quantification 2−∆∆Ct method was used for analysis, and 16S rDNA was used as the reference gene [43]. After 2−∆∆Ct calculation, the expression level of the target gene in the control group was set to 1, and the expression level of the remaining experimental groups relative to the control group was 2−∆∆Ct. The relative mRNA expression of each gene in each sample can be obtained. The calculation formula was as follows:
∆Ct Control group = Ct Control group Target gene − Ct Control group reference gene
∆Ct Experimental group = Ct Experimental group Target gene − Ct Experimental group reference gene
∆∆Ct= ∆CtExperimental group − ∆Ct Control group

2.12. Data Statistical Methods

The data used in this trial were shown by the mean and standard deviation of the three groups of data. Adobe Illustrator (version 2021; Adobe Inc., San Jose, CA, USA), Origin (version 2021; OriginLab Corporation, Northampton, MA, USA) and GraphPad Prism (version 10.0; GraphPad Software, San Diego, CA, USA) software were used for statistical analysis of the data and chart analysis. A t-test was used to analyze the significance of the difference between the two groups of test data. When p < 0.05, the difference was statistically significant and indicated by *. p < 0.01 was considered statistically significant and indicated by **. p < 0.001 was considered an extremely significant statistical difference and was indicated by ***. The Pearson correlation coefficient was used for intra-group and inter-group correlation analysis. The analysis result of correlation heatmap plot were generated using the R software packages “corrplot” througn the CNSknowall (https://cnsknowall.com/index.html#/HomePage) (accessed on 25 March 2023), a comprehensive web service for biomedical data analysis and visualization. The Mantel test was performed using the OmicStudio tools (https://www.omicstudio.cn/tool) (accessed on 25 March 2023) [44].

3. Results

3.1. Dac Sequence Analysis and Multiple Sequence Alignment

The full-length dac sequence of L. mesenteroides DRP105 was 627 base pairs (bp). Alignment of the dac sequence using the NCBI BLAST tool revealed a 100% coverage rate with the sequence from L. mesenteroides CBA3607 (Accession: CP046064.1). Dac sequences were translated into protein sequences and analyzed by NCBI online BLAST alignment. Eight protein sequences exhibiting strong homology were selected. As illustrated in Figure 1A, the DAC sequence exhibited a high degree of sequence similarity with c-di-AMP in various positive bacteria, including Streptococcus pneumoniae [45], B. subtilis [46], and Lactobacillus rhamnosus [47]. Moreover, the DAC sequences contained motifs such as DGA and RHR, which were common to other sequences. The DGA motif served as the binding site for metal ions, while the RHR motif constituted the catalytic site for ATP. These characteristic structures within the DAC domain were conserved in the crystal structure of DisA from Thermotoga maritima and were crucial for the catalytic process [48]. Additionally, there were other proteins containing DAC domains, such as CdaA proteins, which may interact with other functional proteins and possess diverse biological functions [22]. The protein phylogenetic tree constructed by the Neighbor-Joining method was shown in Figure 1B, and indicated that DAC had the closest genetic relationship with L. mesenteroides. It was speculated that DAC may belong to the Class III nucleotide cyclase family. They have similar biological functions.

3.2. Prediction of DAC Secondary and Tertiary Structure

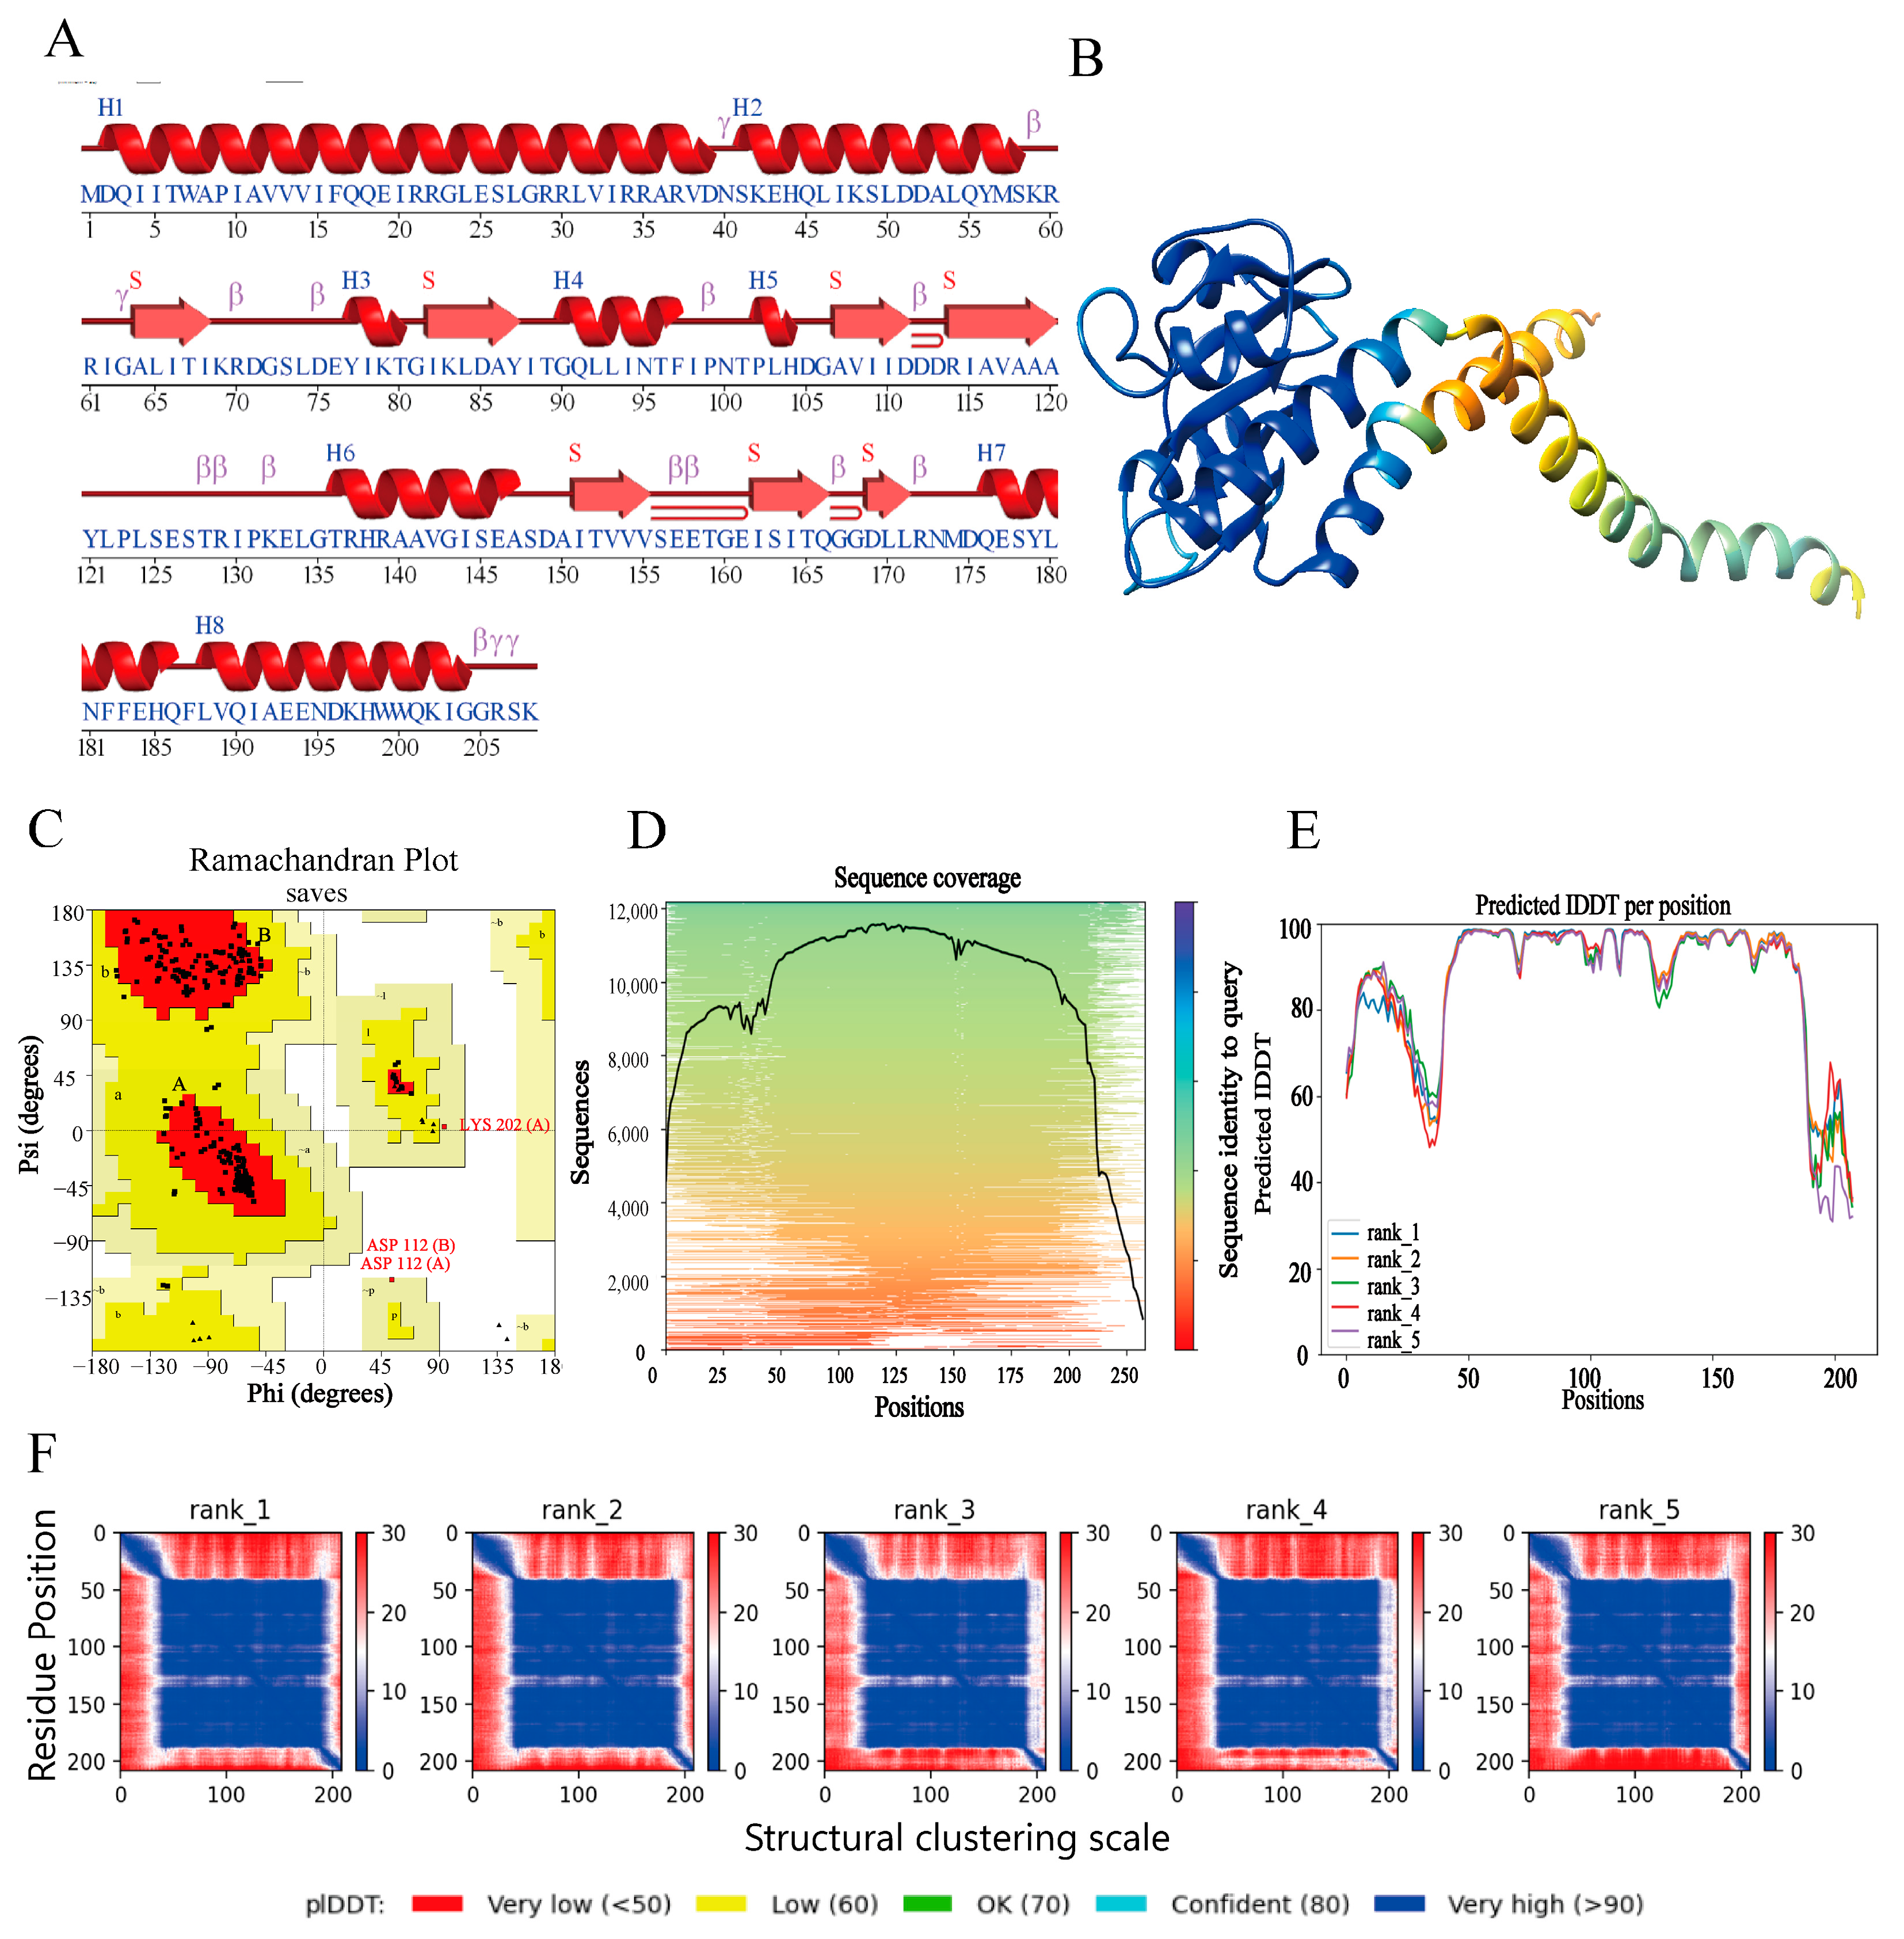
Proteins were involved in the vast majority of physiological reactions in the body. Although proteins were composed of a variety of amino acids, protein activity and function require the folding of amino acids into a specific steric conformation. Understanding the spatial structure of the protein helped to understand its mechanism of action and catalytic mechanism and was crucial for subsequent experiments. The secondary structure of DAC was simulated and predicted by SOPMA database. As shown in Figure 2A, the secondary structure of DAC was mainly composed of α-helices, including 95 α-helices, accounting for 45.67% of the total amino acids. Moreover, DAC also had 40 extended chains accounting for 19.23%, 17 β-folds accounting for 8.17%, and 56 random coils accounting for 26.92%.
The LDDT scores of all residue Cα atoms of the AlphaFold2-predicted structures were called predicted local distance difference test (pLDDT) scores (per-residue LDDT-Cα), ranging from 0 to 100, with higher scores indicating higher confidence [49]. As an LDDT-based confidence measure, pLDDT also reflected local confidence in the structure and was commonly used to assess confidence within individual domains. Figure 2B shows the prediction of DAC tertiary structure by AlphaFold2, which was the most accurate of several prediction models. The visual analysis using Chimera X software was colored with pLDDT (amino acid residue confidence), with darker colors (blue) representing higher confidence and lower colors (orange) representing lower confidence [50]. The predicted pLDDT and per-residue accuracy estimate (PAE) of the top five models were shown in Figure 2D,F. PLDDT reflected the accuracy of the predicted protein model. Figure 2E can clearly see the prediction accuracy of different regions of the protein. The higher the peak value, the more accurate the prediction accuracy. Through this figure, the PDB file with the most accurate prediction results was selected for visualization, so rank 1 was selected for subsequent analysis.

3.3. Saves Server for DAC Protein Evaluation

Model validation and the evaluation of proteins were necessary, both in whole and for individual regions. The DAC protein was evaluated by the Saves server. The Ramachandran plot was used to evaluate the rotation angle φ (phi) of the Cα-N single bond and the rotation angle ψ (psi) of the Cα-C single bond in the protein structure. The pair φ and ψ related to the same Cα were called dihedral angles of the protein in the reasonable region [51]. The plausibility of testing protein conformations can be assessed. The conformation of the protein was justified if more than 90% of the residues in the protein fall in the red (allowed region) and positive yellow (extra allowed region), and the residues falling in other regions should be checked and corrected. As shown in Figure 2C, 261 residues in most favorable regions (A, B, L) accounted for 91.3%. There were 22 residues in additional allowed regions, accounting for 7.7%, and no residues in the disallowed regions. The number of non-glycine and non-proline residues was 286, the number of terminal residues was 4, and the numbers of glycine and proline residues were 20 and 8, respectively. Ramachandran plot analysis showed the constructed protein model was accurate.
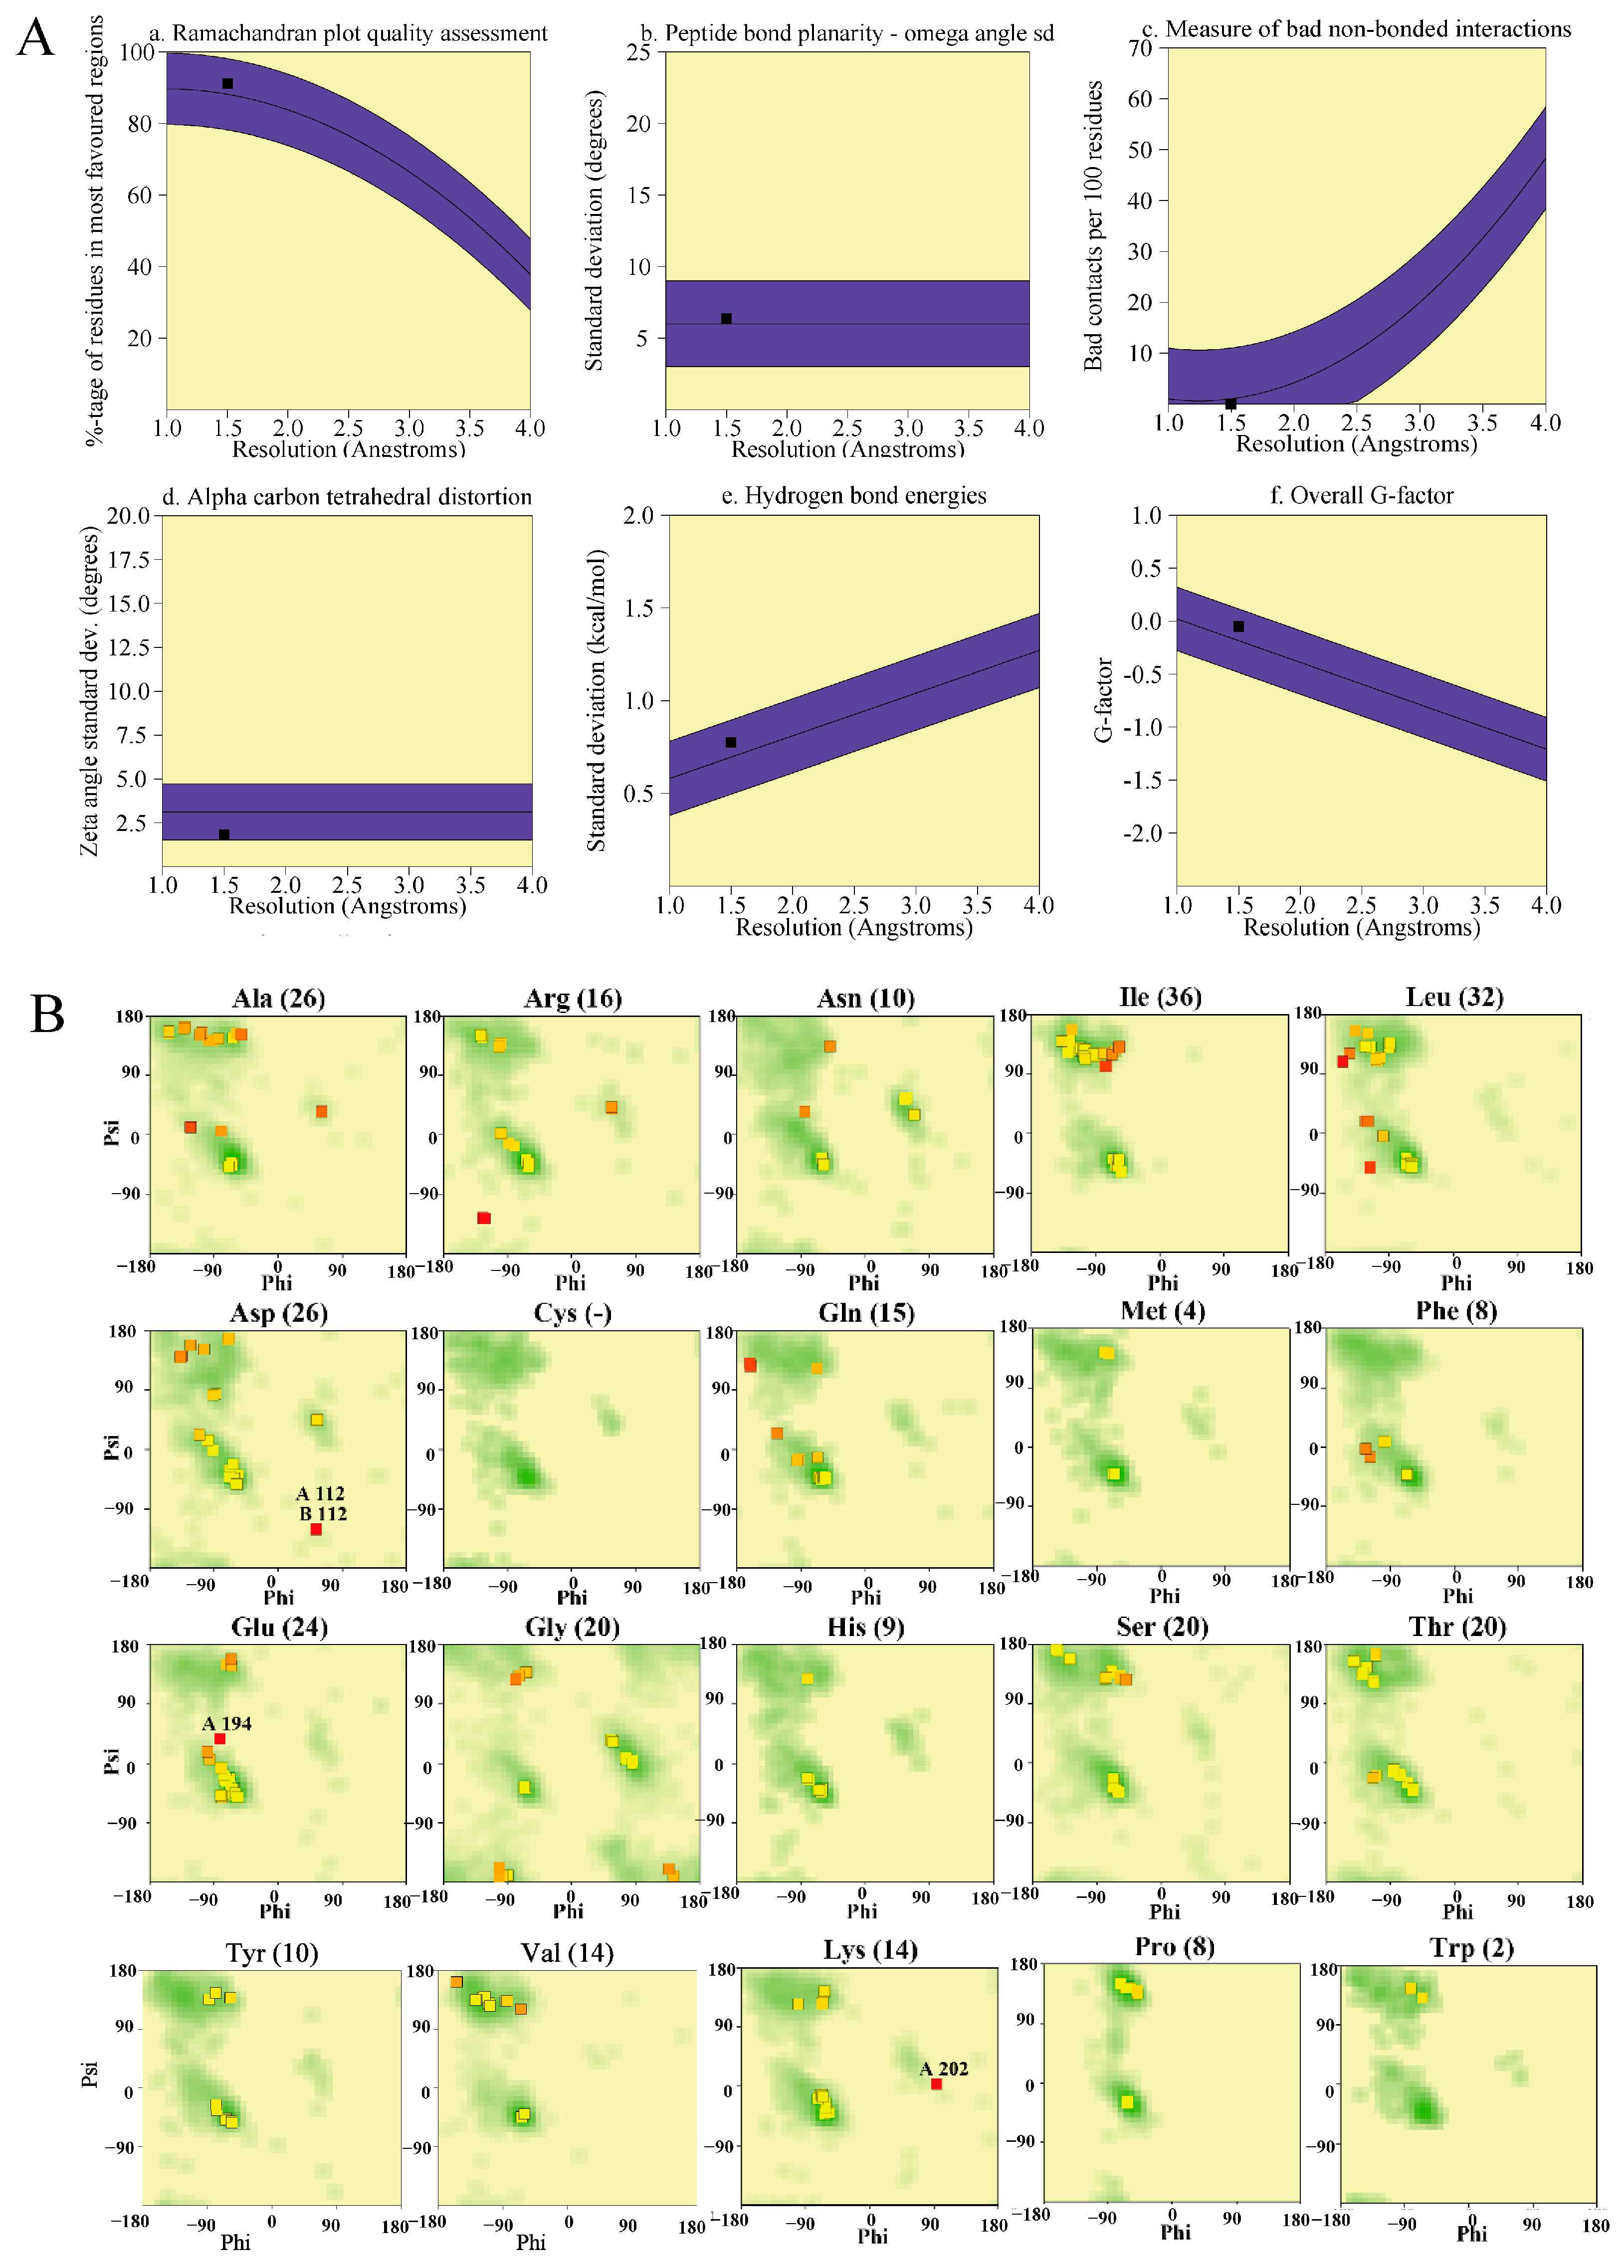
The evaluation information of the DAC sequence was shown in Figure 3A and Table 1, where the percentage of amino acid residues in A, B, and L, Ω angles, inaccurate residues/100 residues, zeta angles, hydrogen bond energies, and overall G-coefficients were within reasonable ranges. Ramachandran plot analysis of each DAC residue was shown in Figure 3B, with the number of residues shown in parentheses, marked for unfavorable conformation (score < −3.00) and shaded to indicate favorable conformation, after analysis, of 163 structures with resolutions of 2.0 A or higher. The results suggested there were three undesirable amino acids, Lys202, Asp112, and Glu194, which were within the acceptable range among all the amino acids analyzed. Therefore, the Save database evaluation report showed the three-dimensional structure model of DAC obtained by the above-mentioned AlphaFold2 was reasonable, and the error was within the allowable range [52]. It was a reliable template for subsequent molecular docking and molecular dynamics simulations.

3.4. Docking Analysis of DAC and Two ATP Molecules

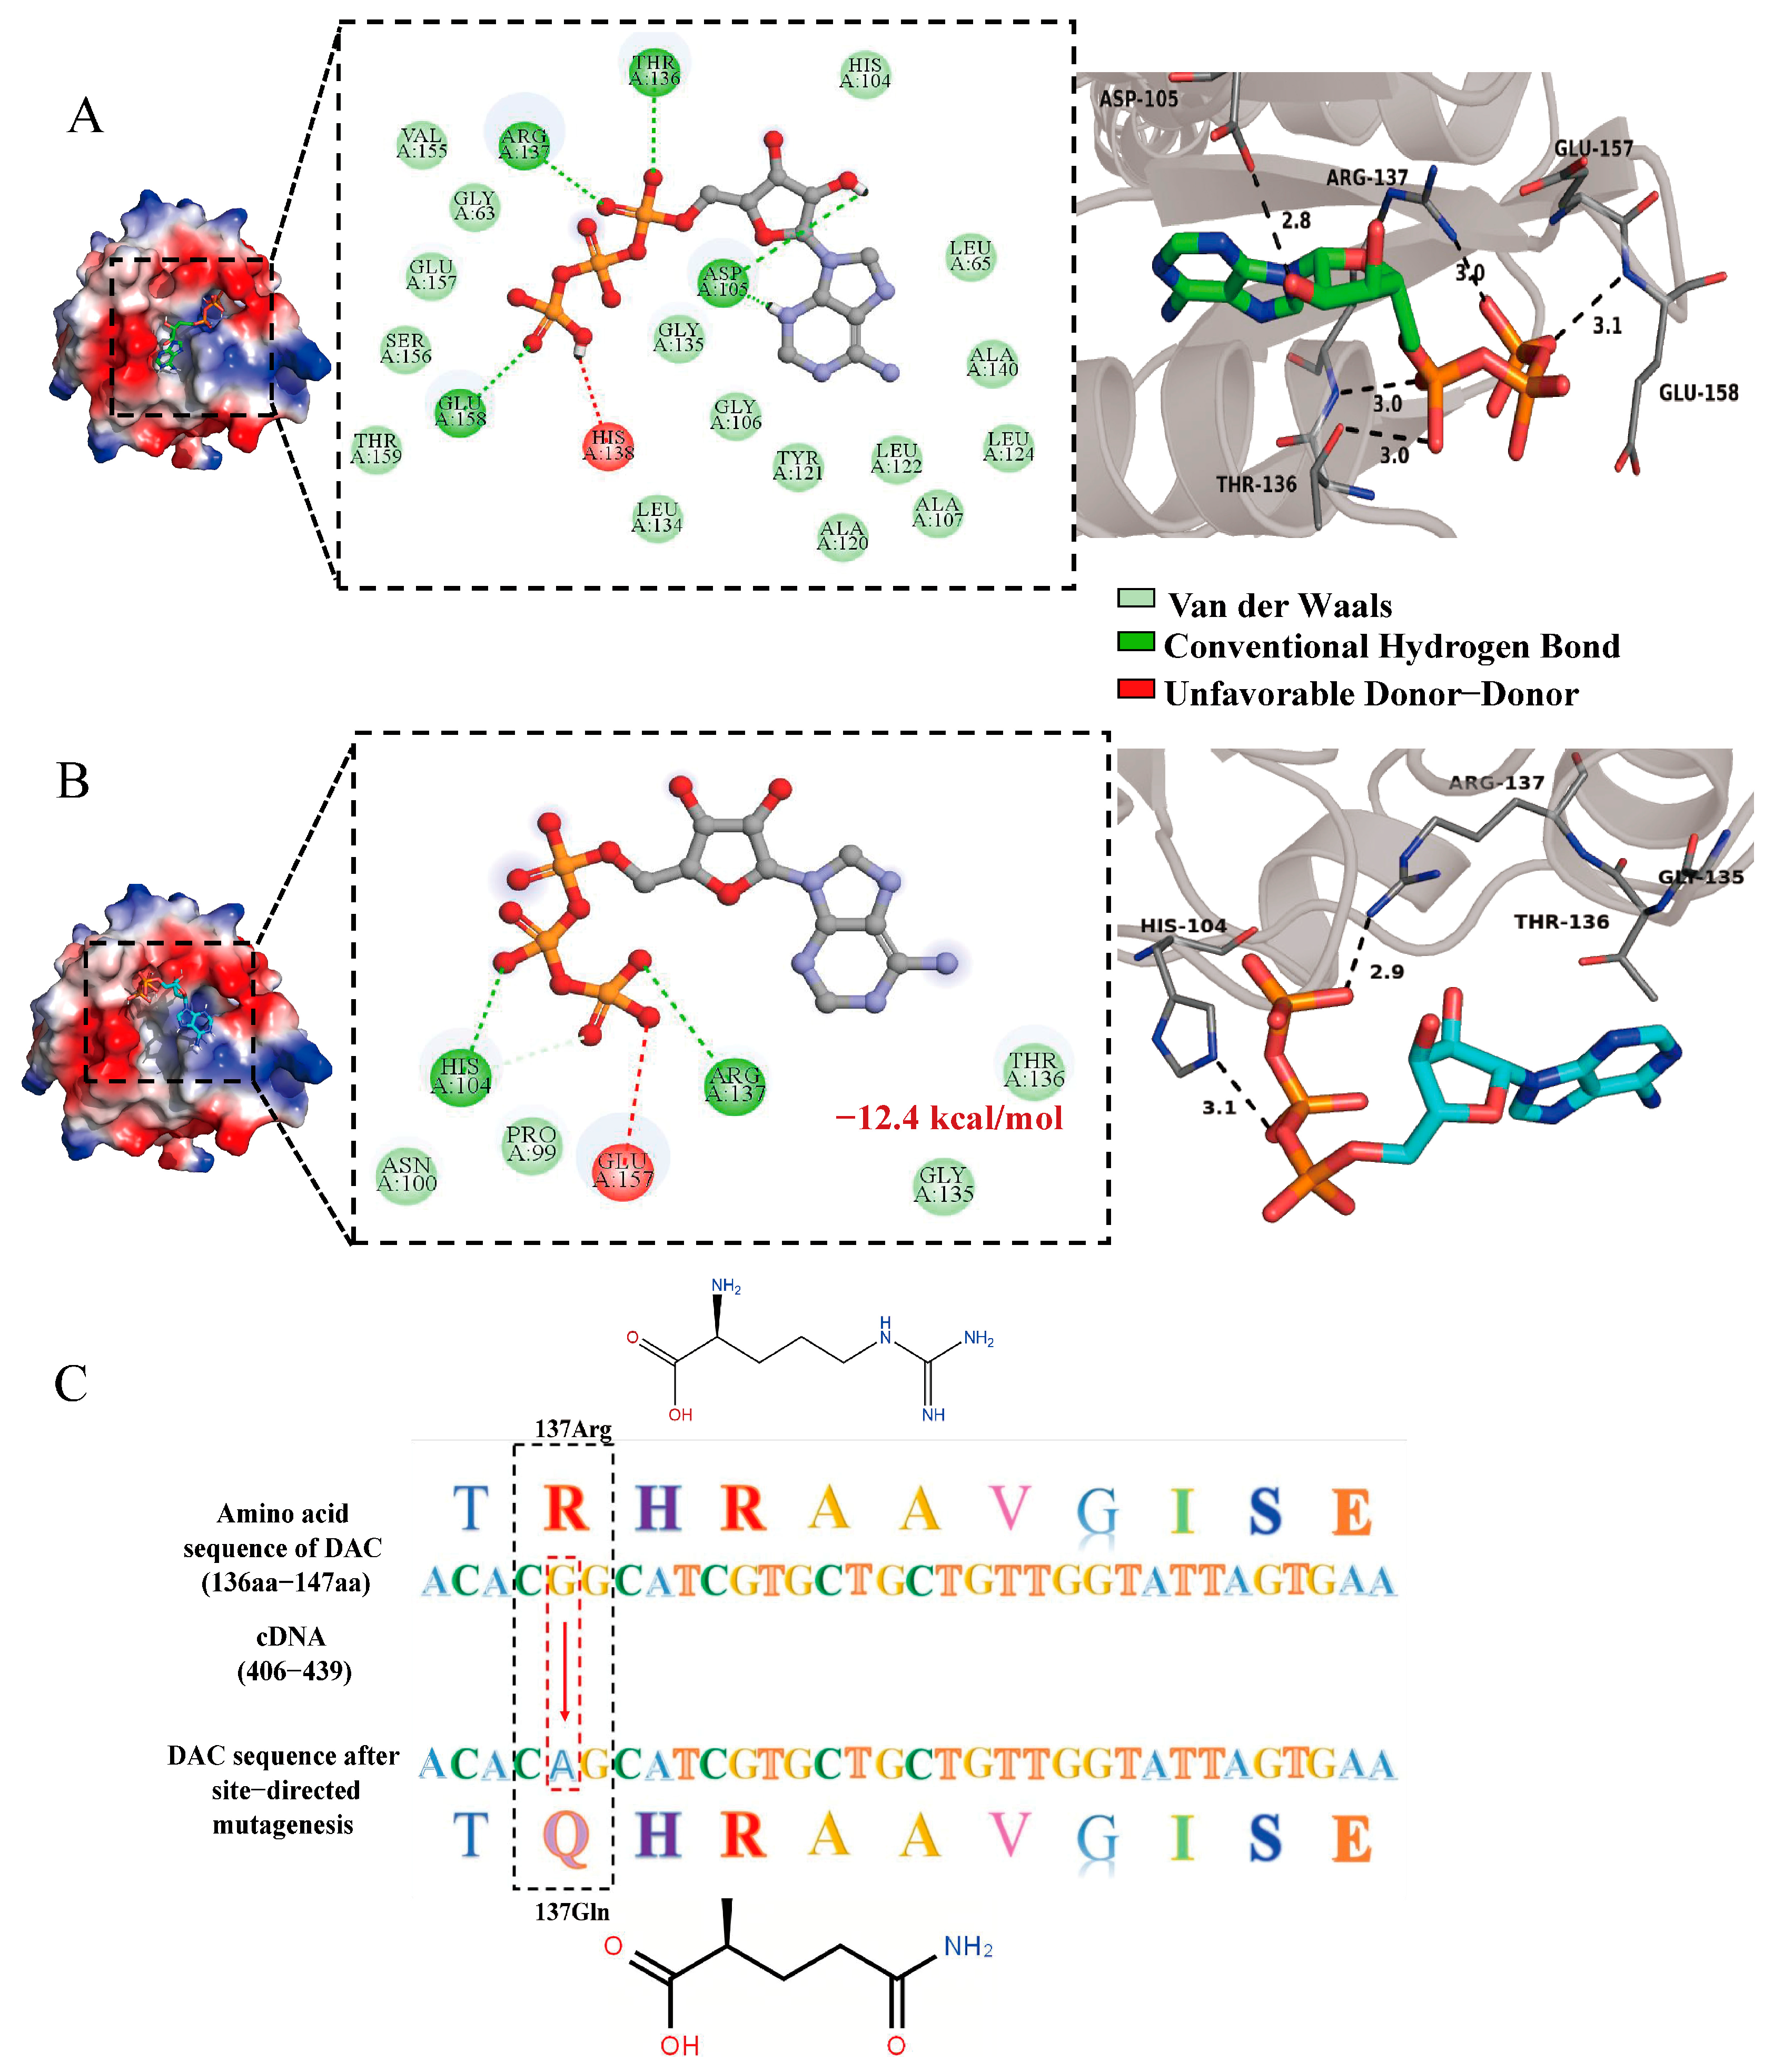
Molecular docking is a technique that can forecast the interaction between the active site of a target protein and a particular small molecule, as well as anticipate the binding configuration and affinity. Manjula et al. [53] revealed the crystal structure of the ATP-binding subunit of the ABC transporter of Geobacillus kaustophilus by molecular docking. Based on the aforementioned simulation experiments, DAC was a protein characterized by the presence of a DisA_N terminal domain and was homologous to diadenylate cyclase. Consequently, it was postulated that DAC possesses the capability to catalyze the cyclization of two ATP molecules into c-di-AMP. To verify this hypothesis, a simulation of the docking process between DAC and two ATP molecules was conducted using AutoDock Vina and PyMOL software [33]. The DisA_N terminal domain of the DAC protein was utilized to delineate the structure of the active pocket. As depicted in Figure 4A, the ATP1 molecule was seen to bind tightly to the active site of DAC, engaging in direct interactions with the binding site residues of DAC. Specifically, residues Asp105, Thr136, Arg137, and Glu158 within the DAC protein establish five hydrogen bonds with the ATP1 molecule. Notably, Asp105 was capable of forming two hydrogen bonds with ATP1. However, a non-complementary interaction was observed between His 138 and ATP1. Furthermore, Van der Waals forces were established between Val155, Gly63, Glu157, Ser156, Thr159, Gly135, Gly106, Tyr121, Ala120, Ala107, Leu122, Leu124, Ala140, Leu65, and His17 residues and the ATP1 molecule. Consequently, the docking results indicated that ATP1 completely occupied the binding pocket of DAC, engaging in direct interactions with the binding site residues. It was situated within the deep cavity of the DAC active site, forming various critical interactions with the binding pocket residues.
The docking of the DAC-ATP1 complex with the ATP2 molecule primarily explored the binding affinity of DAC-ATP1 for ATP2, and whether DAC exhibited a propensity for cyclization to c-di-AMP following the docking with two ATP molecules. The docking outcome for the DAC-ATP1 and ATP2 molecules were illustrated in Figure 4B. Here, His104 and Arg137 in the active site residues of DAC established two hydrogen bonds with ATP2 molecules, while Glu157 engaged in a non-complementary interaction force with ATP2. Additionally, Asn100, Pro99, Gly135, and Thr136 formed four Van der Waals forces with the ATP2 molecule. Despite the close binding of ATP2 to the active pocket of DAC-ATP1, its binding capacity was significantly diminished in comparison to ATP1. The total docking binding energy for DAC with two ATP molecules was −12.4 kcal/mol.

3.5. Targeted Mutagenesis of DAC and Docking with ATP

As homology modeling and substrate docking technologies continue to improve, the ability to predict more precise functions for specific residues will also advance, making it possible to utilize site-directed mutagenesis to test these predictions [54]. To examine the cyclization propensity of ATP molecules, the docking outcomes of two ATP molecules within the active pocket of DAC were presented, with the docking results of DAC and c-di-AMP serving as a reference. The findings indicated a pronounced cyclization trend between two ATP molecules, which were firmly anchored to the active pocket of DAC. Notably, Arg137 was pivotal in this process, situated at the central position of ATP cyclization, bridging the two phosphate groups of ATP, and was crucial for the synthesis of c-di-AMP from ATP. Consequently, targeted mutagenesis was conducted on Arg137 within the DAC protein sequence to assess its role in the catalytic synthesis process. Initially, to ensure the physicochemical properties of DAC remained unaffected post-mutation, Arg137 was replaced with Gln137, which shared a similar structure and properties. The outcomes of this mutation were depicted in Figure 4C. Specifically, the “CGG” codon for Arg was site-specifically mutated to “CAG” for Gln, and the altered sequence was preserved for subsequent predictive analyses. Domanski and Halpert [54] found replacing Gly in lidocaine with Ala increased the catalytic efficiency of lidocaine oxidation by four–ten times.
The mutant protein sequence served as a template for simulating the docking process with two ATP molecules, with the outcomes depicted in Figure 5. It was evident that the interaction between the mutated DAC and the two ATP molecules was unstable, as the ATP molecules do not fully complement the cavity of the active site of the mutated DAC. Consequently, the interaction with the active site residues within the cavity was notably diminished. Only four weak interaction forces were present, occurring at amino acids Gln137, Glu158, Pro99, and His104 following sequence mutations. The reduction in residue interaction correlated with a decrease in docking binding energy. The total docking binding energy between mutated DAC and two ATP molecules amounts to just −7.0 kcal/mol, suggesting the binding was not particularly robust. Furthermore, the mutated DAC capacity to synthesize c-di-AMP from cyclic ATP has also been compromised. To evaluate the synthesis capability of c-di-AMP by DAC before and after mutation, the binding between DAC and c-di-AMP molecules was observed, using DAC docking as a control. As illustrated in Figure 5, the binding between DAC and c-di-AMP was unstable post-mutation, and c-di-AMP did not fully complement the active site of DAC. The docking binding energy also decreased to −5.9 kcal/mol compared to before mutation. The molecular docking results indicated that the two ATP molecules were tightly bound to the active site of DAC, and that the 137Arg residue was crucial for the cyclization of ATP to c-di-AMP. These molecular docking outcomes corroborated, to some extent, that DAC possesses the catalytic ability characteristic of conventional diadenylate cyclase. Rosenberg et al. [55], in order to explore the importance of these residues in L. monocytogenes for ATP binding and c-di-AMP formation, selected residues Asp171, Gly172, and Thr202 in front of the RHR motif to be synthesized in vitro, respectively. Asn, Ala, and Asn were substituted in the truncated DAC-Δ80 CdaA, and the results showed the protein lost its c-di-AMP activity.

3.6. Analysis of Interaction Between DAC and Glucansucrase

Protein–ligand interactions play an important role in most biological processes, such as signal transduction, cell regulation, and immune response [56]. Analyzing the interaction of proteins in biological systems is helpful in understanding the reaction mechanism of signal transmission and energy metabolism in bacteria under special physiological conditions, as well as the functional relationship between proteins. It has been revealed the second messenger molecule c-di-AMP can directly participate in the regulation of the activity of the corresponding glucansucrase, thereby controlling the synthesis of EPS [57]. Under the tight control of this cascade, the regulation between DAC and glucansucrase is the key point of protein interaction [58]. GtfC is glucansucrase encoded by gtfC and a key enzyme in EPS synthesis [59]. The 3D structure of GtfC was first constructed using the AlphaFold2 database, and the results were shown in Figure 6A. Secondly, PDBsum and PLIP were used to simulate and predict the interaction between DAC and GtfC proteins, and the results are shown in Figure 6B,D. The interaction between GtfC and DAC residues was analyzed by PDBsum software, and the interaction between GtfC and DAC residues was analyzed from a three-dimensional perspective by PLIP software, and DAC was used as the reference chain for interaction analysis [60,61]. There were eight salt bridges, 21 hydrogen bonds and 221 non-bonded interactions between the 34 amino acid residues of the A chain (GtfC) and the 27 amino acid residues of the B chain (DAC). In Figure 6D, a salt bridge which was formed between Asp663 and Arg37 of GtfC, along with hydrogen bonds, is shown. According to the InterfaceArea, the surface area ratio of the two proteins was 1665:1882. The 3D results of protein interaction are shown in Figure 6C. The terminal of DAC was fused with the active site of GtfC. Whether DAC can change the structure of GtfC by this method and thus affect the activity of the enzyme can be further explored in the subsequent experiments. In S. mutans, c-di-AMP interacted with the receptor protein CabPA to affect the expression of transcription factor VicR, which regulates the key gene gtfB in EPS synthesis [62].

3.7. MD Simulation of DAC and ATP

3.7.1. RMSD Analysis of DAC and ATP

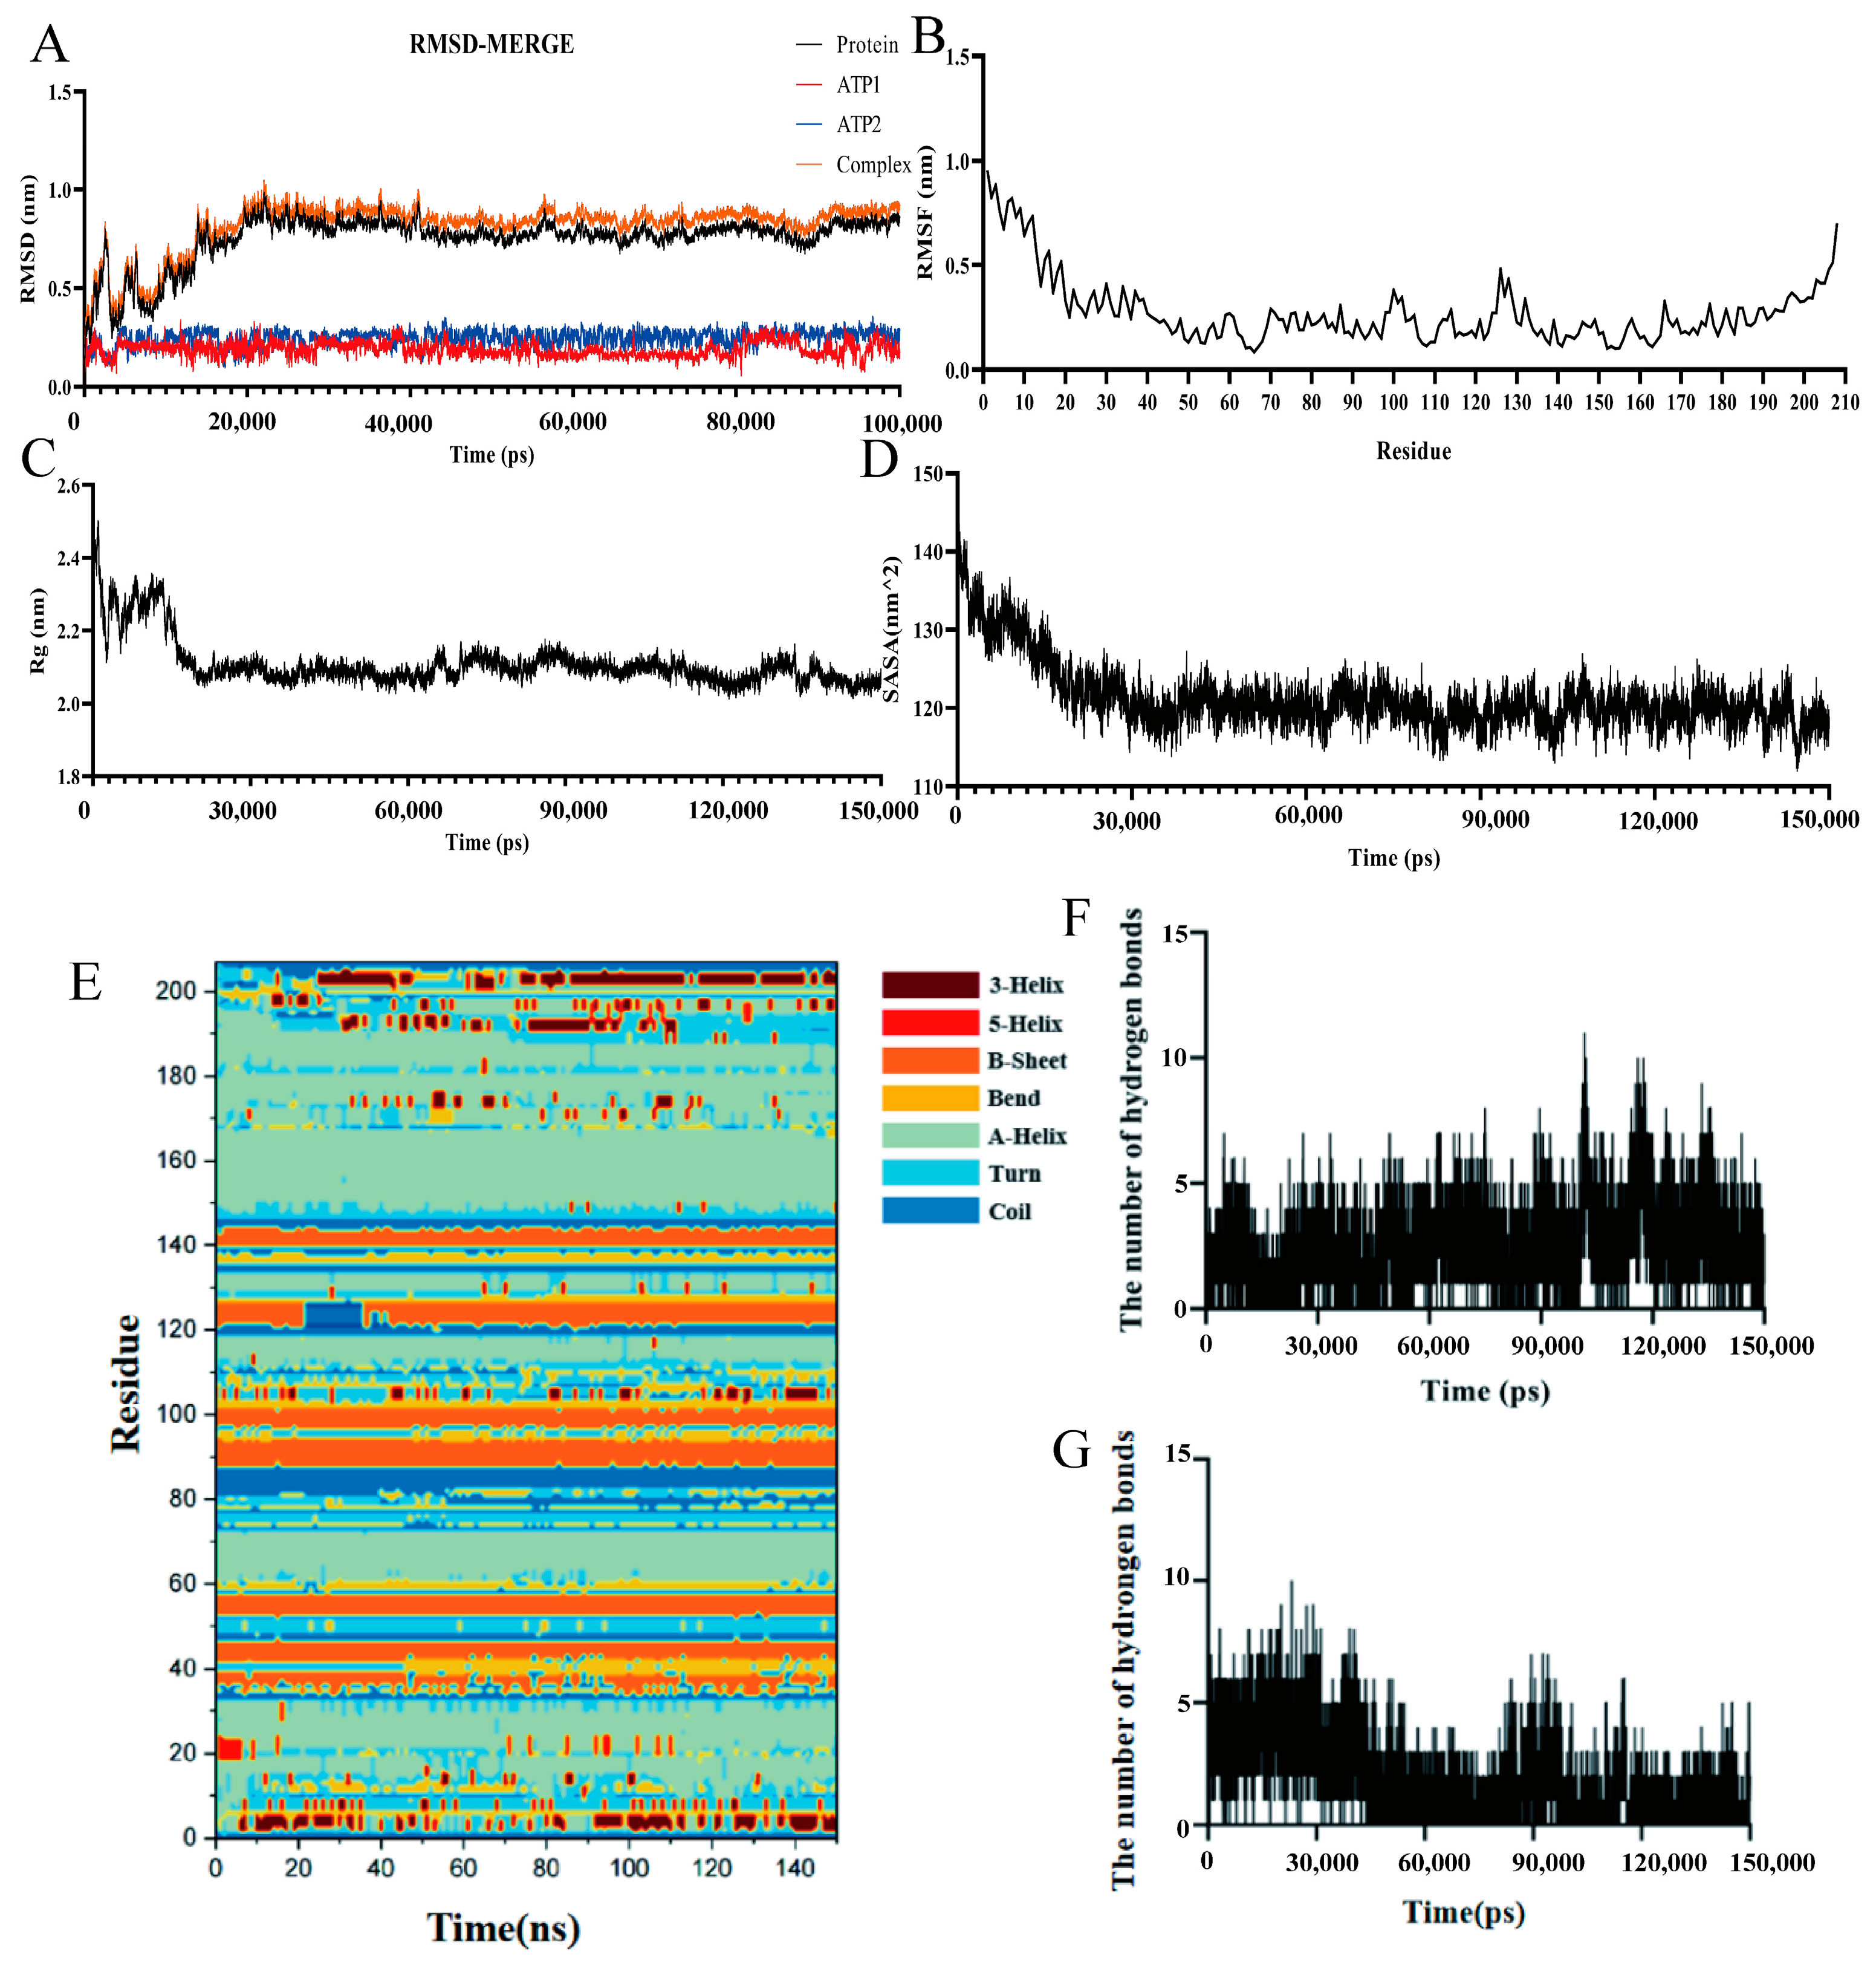
To investigate the binding interaction between DAC and ATP molecules, the Gromacs molecular dynamics simulation method was employed for predictive analysis. RMSD measures the distance between the same atoms in different structures [63]. The fluctuation pattern of protein and ligand RMSD was a crucial indicator for assessing simulation stability. Protein RMSD not only reflected the stability of the protein structure but also further indicated whether the ligand induces depolymerization in the protein [64]. Lower RMSD values signify greater protein stability, whereas higher RMSD values suggest structural conformational changes in the protein backbone over the simulation period. In general, stability can be achieved if the RMSD volatility remains below 1. In the simulations, the RMSD values of ATP1, ATP2, and DAC-ATP complexes were calculated and RMSD plots were plotted, as seen in Figure 7A. The results revealed the RMSD fluctuations for DAC and the two ATP molecules were less than 1. Furthermore, both DAC and the DAC-ATP complexes achieved stability after 30 nanoseconds, while the ATP molecules stabilized after 10 nanoseconds, suggesting the structures of proteins and small molecules were relatively stable. However, the RMSD values for the DAC-ATP complex exhibited significant fluctuations during the initial 20 nanoseconds of the simulation, followed by a gradual stabilization, indicating DAC possesses a strong binding affinity for ATP molecules. Overall, the RMSD values were maintained within a narrow range (RMSD < 1), indicating the binding of the protein to the small molecules was relatively stable.

3.7.2. RMSF Analysis of DAC

RMSF represented the average change in atomic positions over time, serving as a metric to assess protein dynamics. It characterized the flexibility and movement of protein amino acids throughout the simulation process. The RMSF of a protein was used to ascertain the deviation of each residue from its reference position, and this parameter was crucial in determining the suitability of ligand–protein interactions during the simulation [65]. RMSF was directly related to protein elasticity, with more flexible regions exhibiting higher RMSF values [66]. During this simulation, the RMSF between DAC and the small molecule ATP was computed, and the trend of these fluctuations was depicted in Figure 7B. The RMSF values were lower in the bound regions and higher in the unbound regions, suggesting that the binding of small molecules had a notable effect on protein’s stability. Additionally, the significant displacement of amino acid atoms observed between residues 0–30 and 180–210 indicated these terminal amino acid sequences were flexible regions. In contrast, the fluctuations in the central region were minimal, suggesting a more rigid structure, which may contain potential binding sites for proteins [67].

3.7.3. Rg, SASA and DSSP Simulation, and Hydrogen Bond Analysis Between DAC and ATP

The Rg serves as a measure to evaluate a protein’s overall compactness [68]. It was also instrumental in characterizing alterations in the peptide chain’s looseness of a protein throughout simulations. In MD simulations, the Rg was utilized to gauge the tightness and rigidity of the protein’s backbone, as well as to reflect the protein’s stability across varying temperatures. In this particular simulation, the Rg for both DAC and ATP were computed, and the trend of these changes was depicted in Figure 7C. Following the interaction between DAC and ATP, the Rg value was observed to decrease in comparison to the individual protein molecules, suggesting that the binding of ATP resulted in a more compact molecular structure for DAC.
The SASA served as a metric to assess the surface area of proteins, representing the surface area of biomolecules accessible to the solvent [69]. During this simulation, the SASA between DAC and ATP was computed, with the outcomes depicted in Figure 7D. DAC exhibited significant SASA values prior to the binding of DAC to ATP. However, the SASA value of DAC decreased after binding, indicating that the interaction with the small molecule resulted in a reduction in the SASA of the protein. Figure 7E illustrates the DSSP simulation of secondary structure alterations [36]. The predicted results showed significant changes in the N-terminal and C-terminal secondary structure of the protein, consistent with the characteristics of the terminal domain of DisA_N. It was hypothesized that the N-terminal of DAC served as the binding site for ATP, while the C-terminal may be involved in DNA damage repair. The region with less variation in the middle may be the link domain responsible for connecting the two domains, a feature consistent with CdaA-type DAC.
Hydrogen bonding and hydrophobic interactions are crucial for maintaining the structure of proteins [70]. During this simulation, the hydrogen bonds formed between DAC and two ATP molecules were quantified, with the outcomes depicted in Figure 7F,G. Throughout the simulation, numerous hydrogen bonds were established between the protein and small molecules, predominantly involving key amino acid residues within the protein and significant functional groups on the small molecules. Furthermore, the fluctuation in the quantity of inter-molecular hydrogen bonds over time can reveal the stability of the protein–ligand complex [71]. It was evident from the figure that DAC shared on average three hydrogen bonds with two ATP molecules throughout the simulation, which implied that DAC-ATP1 had some stability with DAC-ATP1-ATP2. When ATP bound to the active pocket of DAC, the number of hydrogen bonds fluctuated between 3 and 6. Although the number of hydrogen bonds had a certain volatility, multiple hydrogen bonds stabilized the binding of DAC and ATP throughout the simulation.

3.7.4. Free Energy Landscape Analysis of DAC and ATP Free Energy

The free energy landscape reflects the interaction and energy distribution between the molecules in the system. It helps to understand the interaction, conformation and stability characteristics between molecules, which is very helpful for molecular mechanism design and material design [72]. It is used to describe the graphical representation of stable and transition states in molecular systems. The size and distribution of free energy are usually represented by color shades and contour lines. It is considered thermodynamically that stable conformations usually correspond to lower free energy regions, while less stable conformations correspond to higher free energy regions, and peaks or low free energy regions in the free energy map usually represent energetically stable conformations [73]. The 2D and 3D free energy landscape of DAC and ATP molecules were shown in Figure 8. The 2D and 3D figures were made from RMSD, Rg and binding free energy, as shown in Figure 8A,B. In the simulation, a low energy region was obtained, as shown in Figure 8C. This indicated there was a relatively stable conformation in the system, and the low-energy region may correspond to the molecules reaching stability through different interaction modes or conformations, mainly concentrated around 12 ns, where the molecular structure was relatively similar to the initial structure and relatively compact. These suggested molecules may remain stable for a long time during simulations. However, in this stable structure, it can be seen that the phosphate groups of the two ATP molecules start to cyclize and present a symmetrically folded conformation.

3.7.5. Free Energy Analysis of Binding ATP to DAC

To judge whether the binding between proteins and small molecules was reasonable, the binding energy MMGBSA during docking was analyzed. By calculating the energy between the protein and the small molecule, the total free energy of the complex can be obtained to determine whether the binding between the protein and the small molecule was stable [74]. The results were shown in Figure 8D, where the total energy fluctuates at −680,000 kj/mol during the docking process, indicating that the docking process was relatively stable. By analyzing the base and protein sequence of DAC, it was confirmed that the putative DAC had the catalytic ability of the traditional lactic acid bacteria CdaA type of DAC, and the binding between DAC and two ATP molecules was stable.

3.8. Fermentation Process Genes and Metabolites and Correlation Analysis

Having established the strong binding of DAC to ATP by molecular docking, molecular dynamics simulations, the next goal was to decipher the effect of this binding on DAC function. The function of DAC in EPS synthesis can be preliminarily understood by measuring the EPS content, the relative expression of related genes and the changes in related enzyme activities in the fermentation broth. As shown in Figure 9A–C, with the extension of fermentation time, the EPS production of L. mesenteroides DRP105 at a 5% sucrose concentration showed a trend of first increasing and then decreasing, reaching a maximum at 36 h. After 48 h of fermentation, the EPS content tended to be stable. This was because the number of strains was growing during the later stage of fermentation, but the substrate in the medium was limited. Sucrose not only provided the necessary carbon source for the growth of the strain, but was also the inducer of EPS biosynthesis. When sucrose was present in the medium, glucansucrase could catalyze the synthesis of EPS from sucrose. However, the low concentration of sucrose makes the medium insufficient in terms of nutrients; as such, the strain cannot grow normally, and the synthesis of EPS is limited [75]. With the increase in time, the relative expression of dac and gtfC genes and their activities of DAC and GtfC increased first and then decreased, and the change trend was consistent with the change in EPS content. In addition, c-di-AMP regulated by DAC and PDE also showed a similar trend (p < 0.05). It can be concluded that DAC and GtfC activities increased with increasing EPS content, showing a significant positive correlation, and their corresponding gene expression also increased. However, the activity of pde did not change significantly, and the change trend in EPS content did not show the same, which indicated that PDE had a weak regulatory effect on EPS synthesis [23].
The correlation analysis of the differential expression of related genes in L. mesenteroides DRP105 cultured at 5% sucrose concentration is shown in Figure 9D. The results showed dac, the key gene responsible for c-di-AMP synthesis, was positively correlated with gtfC, the key gene for EPS synthesis. The PDE responsible for c-di-AMP degradation was less correlated with gtfC, in agreement with the results described above. This suggested c-di-AMP regulated the expression of key glucansucrase genes at the transcriptional level, which in turn affects the activity or content of downstream glucansucrase and promoted the biosynthesis of EPS [8]. The results of correlation analysis of metabolites of L. mesenteroides DRP105 are shown in Figure 9E (the top 20 absolute values of correlation on the basis of p < 0.05). The c-di-AMP content was significantly positively correlated with DAC, GtfC activity and EPS content, but not with PDE activity, a result consistent with the content analysis described above. It suggested that c-di-AMP may bind to specific transcriptional regulators to positively regulate the activity of glucansucrase at the transcriptional level, thereby affecting the biosynthesis of EPS, or directly bind to glucansucrase at the translational level and change its conformation to promote EPS synthesis. The results of the present study are consistent with the results of Peng et al. [57], which showed that c-di-AMP was able to regulate EPS synthesis by affecting the activity and content of glucansucrase. From the Mantel-test plots of genes and metabolites, it can be seen that dac and gtfC were significantly positively correlated with DAC, c-di-AMP and EPS, and had no significant correlation with PDE responsible for c-di-AMP degradation, which was consistent with the results of previous experiments.
Based on the structure prediction, it was determined that dac encoded DAC-containing DGA and RHR motifs, which exhibited the general function of a diadenylate cyclase and catalyzed the synthesis of c-di-AMP from two molecules of ATP. Additionally, PDE was identified as the protein responsible for catalyzing the hydrolysis of c-di-AMP, while the glucansucrase encoded by gtfC was shown to directly regulate EPS synthesis. Correlation analysis revealed no significant association between pde and the dac/gtfC genes. However, dac expression and c-di-AMP levels demonstrated positive correlations with gtfC expression and EPS production. These findings supported the conclusion that c-di-AMP synthesized by DAC likely regulated EPS biosynthesis in L. mesenteroides DRP105 (Figure 9G).

4. Conclusions

In this study, the key regulatory mechanisms of EPS biosynthesis in lactic acid bacteria were explored through bioinformatics analysis and experimental verification. The results indicated c-di-AMP, as an important second messenger, played a key role in the biosynthesis of EPS in lactic acid bacteria. The 3D structure of DAC was predicted by AlphaFold2 and its structural rationality was evaluated. DAC had features of CdaA-type cyclic diadenylate cyclase, including DisA_N domains, DGA, and RHR motifs. Molecular docking and molecular dynamics simulations revealed a direct interaction between DAC and ATP, which fully occupied the binding pocket of DAC. By targeting key amino acid residues in the mutated DAC, the importance of these residues in DAC-catalyzed c-di-AMP synthesis was confirmed. The mutated DAC proved to have a significantly reduced binding ability to ATP molecules, further validating the critical role of DAC in c-di-AMP synthesis. Studies on the interaction between DAC and EPS synthesis key enzyme GtfC revealed multiple salt bridges, hydrogen bonds and non-covalent interactions between DAC and GtfC, illustrating that DAC may regulate EPS synthesis by directly interacting with GtfC. A significant positive correlation between DAC activity, c-di-AMP content and EPS content was found by measuring the expression of related genes and enzyme activities during the fermentation of L. mesenteroides DRP105. This suggested DAC regulated c-di-AMP levels, which in turn affected GtfC activity and EPS synthesis. This study unveiled a novel perspective on comprehending the regulatory mechanism governing EPS biosynthesis in lactic acid bacteria, thereby furnishing a solid theoretical foundation for enhancing EPS production through genetic engineering techniques. Future endeavors could delve deeper into uncovering additional potential functions of c-di-AMP in lactic acid bacteria, as well as exploring the feasibility of improving EPS production via metabolic engineering strategies.

Author Contributions

Writing—Original draft preparation, W.Y.; software, methodology, data curation, T.L.; investigation, Z.W. and R.D.; writing—reviewing and editing, L.Y.; funding acquisition, R.D.; supervision, project administration, W.P. All authors have read and agreed to the published version of the manuscript.

Funding

This research was funded by the “New Era Longjiang Excellent Master’s and Doctoral Dissertations” (NO. LJYXL2022-020) (Renpeng Du). Young Talents of Basic Research in Universities of Heilongjiang Province (NO. YQJH2024199) (Renpeng Du). (NO. 2024-KYYWF-0117) (Renpeng Du) and Open Fund of Guangxi Key Laboratory of Polysaccharide Materials and Modification (NO. GXPSMM24-1) (Renpeng Du).

Institutional Review Board Statement

Not applicable.

Informed Consent Statement

Not applicable.

Data Availability Statement

Data are contained within the article.

Conflicts of Interest

The authors declare no conflicts of interest.

References

  1. Du, R.; Pei, F.; Kang, J.; Zhang, W.; Wang, S.; Ping, W.; Ling, H.; Ge, J. Analysis of the structure and properties of dextran produced by Weissella confusa. Int. J. Biol. Macromol. 2022, 204, 677–684. [Google Scholar] [CrossRef] [PubMed]
  2. Devi, P.V.; Islam, J.; Narzary, P.; Sharma, D.; Sultana, F. Bioactive compounds, nutraceutical values and its application in food product development of oyster mushroom. J. Future Foods 2024, 4, 335–342. [Google Scholar] [CrossRef]
  3. Ning, E.; Sun, C.; Wang, X.; Chen, L.; Li, F.; Zhang, L.; Wang, L.; Ma, Y.; Zhu, J.; Li, X.; et al. Artemisia argyi polysaccharide alleviates intestinal inflammation and intestinal flora dysbiosis in lipopolysaccharide-treated mice. Food Med. Homol. 2024, 1, 9420008. [Google Scholar] [CrossRef]
  4. Gao, X.; Zhao, J.; Zhang, H.; Chen, W.; Zhai, Q. Modulation of gut health using probiotics: The role of probiotic effector molecules. J. Future Foods 2022, 2, 1–12. [Google Scholar] [CrossRef]
  5. Suo, K.; Li, X.; Liu, X.; Zhu, J.; Shi, Y.; Yi, J.; Lu, J. From environment to environmental adaptation: Environmental perspectives on the study of food and medicine homology. Food Med. Homol. 2025, 3, 9420082. [Google Scholar] [CrossRef]
  6. Zhou, J.; Yin, K.; Luo, W.; Chen, A.; Liang, Z.; Ji, P.; Wang, Y.; Wang, X.; Homology, M. Anti-virulence potential of carvone against Serratia marcescens. Food Med. Homol. 2024, 1, 9420001. [Google Scholar] [CrossRef]
  7. Molina, M.; Cioci, G.; Moulis, C.; Severac, E.; Remaud-Simeon, M. Bacterial α-Glucan and branching sucrases from GH70 family: Discovery, structure-function relationship studies and engineering. Microorganisms 2021, 9, 1607. [Google Scholar] [CrossRef] [PubMed]
  8. Arskold, E.; Svensson, M.; Grage, H.; Roos, S.; Radstrom, P.; van Niel, E.W.J. Environmental influences on exopolysaccharide formation in Lactobacillus reuteri ATCC 55730. Int. J. Food Microbiol. 2007, 116, 159–167. [Google Scholar] [CrossRef]
  9. Lv, L.; Wei, Z.; Li, W.; Chen, J.; Tian, Y.; Gao, W.; Wang, P.; Sun, L.; Ren, Z.; Zhang, G.; et al. Regulation of extracellular polymers based on quorum sensing in wastewater biological treatment from mechanisms to applications: A critical review. Water Res. 2024, 250, 121057. [Google Scholar] [CrossRef]
  10. Yan, Z.; Meng, H.; Yang, X.; Zhu, Y.; Li, X.; Xu, J.; Sheng, G. Insights into the interactions between triclosan (TCS) and extracellular polymeric substance (EPS) of activated sludge. J. Environ. Manag. 2019, 232, 219–225. [Google Scholar] [CrossRef]
  11. Wang, C.; Liu, S.; Xu, X.; Zhao, C.; Yang, F.; Wang, D. Potential coupling effects of ammonia-oxidizing and anaerobic ammonium-oxidizing bacteria on completely autotrophic nitrogen removal over nitrite biofilm formation induced by the second messenger cyclic diguanylate. Appl. Microbiol. Biotechnol. 2017, 101, 3821–3828. [Google Scholar] [CrossRef] [PubMed]
  12. Liu, Y.; Blanco-Toral, C.; Larrouy-Maumus, G. The role of cyclic nucleotides in bacterial antimicrobial resistance and tolerance. Trends Microbiol. 2024, 33, 164–183. [Google Scholar] [CrossRef]
  13. Agostoni, M.; Logan-Jackson, A.R.; Heinz, E.R.; Severin, G.B.; Bruger, E.L.; Waters, C.M.; Montgomery, B.L. Homeostasis of second messenger cyclic-di-AMP is critical for cyanobacterial fitness and acclimation to abiotic stress. Front. Microbiol. 2018, 9, 1121. [Google Scholar] [CrossRef]
  14. Tang, Q.; Luo, Y.; Zheng, C.; Yin, K.; Ali, M.K.; Li, X.; He, J. Functional Analysis of a c-di-AMP-specific Phosphodiesterase MsPDE from Mycobacterium smegmatis. Int. J. Biol. Sci. 2015, 11, 813–824. [Google Scholar] [CrossRef]
  15. Commichau, F.M.; Heidemann, J.L.; Ficner, R.; Stuelke, J. Making and breaking of an essential poison: The cyclases and phosphodiesterases that produce and degrade the essential second messenger cyclic di-AMP in Bacteria. J. Bacteriol. 2019, 201, 1110–1128. [Google Scholar] [CrossRef]
  16. Galperin, M.Y. All DACs in a row: Domain architectures of bacterial and archaeal diadenylate cyclases. J. Bacteriol. 2023, 205, e00023-23. [Google Scholar] [CrossRef]
  17. Zhu, Y.; Pham, T.H.; Nhiep, T.H.; Vu, N.M.; Marcellin, E.; Chakrabortti, A.; Wang, Y.; Waanders, J.; Lo, R.; Huston, W.M.; et al. Cyclic-di-AMP synthesis by the diadenylate cyclase CdaA is modulated by the peptidoglycan biosynthesis enzyme GlmM in Lactococcus lactis. Mol. Microbiol. 2016, 99, 1015–1027. [Google Scholar] [CrossRef] [PubMed]
  18. Herzberg, C.; Meißner, J.; Warneke, R.; Stülke, J. The many roles of cyclic di-AMP to control the physiology of Bacillus subtilis. MicroLife 2023, 4, uqad043. [Google Scholar] [CrossRef]
  19. Wright, M.J.; Bai, G. Bacterial second messenger cyclic di-AMP in Streptococci. Mol. Microbiol. 2023, 120, 791–804. [Google Scholar] [CrossRef]
  20. Schwedt, I.; Wang, M.; Gibhardt, J.; Commichau, F.M. Cyclic di-AMP, a multifaceted regulator of central metabolism and osmolyte homeostasis in Listeria monocytogenes. MicroLife 2023, 4, uqad005. [Google Scholar] [CrossRef]
  21. Du, B.; Sun, J.H. Diadenylate cyclase evaluation of ssDacA (SSU98_1483) in Streptococcus suis serotype 2. Genet. Mol. Res. 2015, 14, 6917–6924. [Google Scholar] [CrossRef]
  22. Bai, Y.; Yang, J.; Zhou, X.; Ding, X.; Eisele, L.E.; Bai, G. Mycobacterium tuberculosis Rv3586 (DacA) is a diadenylate cyclase that converts ATP or ADP into c-di-AMP. PLoS ONE 2012, 7, e35206. [Google Scholar] [CrossRef]
  23. Xiong, Z.; Fan, Y.; Song, X.; Liu, X.; Xia, Y.; Ai, L. The second messenger c-di-AMP mediates bacterial exopolysaccharide biosynthesis: A review. Mol. Biol. Rep. 2020, 47, 9149–9157. [Google Scholar] [CrossRef] [PubMed]
  24. Du, R.; Zhou, Z.; Han, Y. Functional identification of the dextransucrase gene of Leuconostoc mesenteroides DRP105. Int. J. Mol. Sci. 2020, 21, 6596. [Google Scholar] [CrossRef] [PubMed]
  25. Larkin, M.A.; Blackshields, G.; Brown, N.P.; Chenna, R.; McGettigan, P.A.; McWilliam, H.; Valentin, F.; Wallace, I.M.; Wilm, A.; Lopez, R.; et al. Clustal W and clustal X version 2.0. Bioinformatics 2007, 23, 2947–2948. [Google Scholar] [CrossRef]
  26. Lanave, C.; Attimonelli, M.; De Robertis, M.; Licciulli, F.; Liuni, S.; Sbisa, E.; Saccone, C. Update of AMmtDB: A database of multi-aligned metazoa mitochondrial DNA sequences. Nucleic Acids Res. 1999, 27, 134–137. [Google Scholar] [CrossRef]
  27. Du, R.; Yu, L.; Yu, N.; Ping, W.; Song, G.; Ge, J. Characterization of exopolysaccharide produced by Levilactobacillus brevis HDE-9 and evaluation of its potential use in dairy products. Int. J. Biol. Macromol. 2022, 217, 303–311. [Google Scholar] [CrossRef]
  28. Kolb, A.W.; Adams, M.; Cabot, E.L.; Craven, M.; Brandt, C.R. Multiplex sequencing of seven ocular herpes simplex virus type-1 genomes: Phylogeny, sequence variability, and SNP distribution. Investig. Ophthalmol. Vis. Sci. 2011, 52, 9061–9073. [Google Scholar] [CrossRef]
  29. Geourjon, C.; Deleage, G. SOPMA: Significant improvements in protein secondary structure prediction by consensus prediction from multiple alignments. Comput. Appl. Biosci. 1995, 11, 681–684. [Google Scholar] [CrossRef]
  30. Mirdita, M.; Schutze, K.; Moriwaki, Y.; Heo, L.; Ovchinnikov, S.; Steinegger, M. ColabFold: Making protein folding accessible to all. Nat. Methods 2022, 19, 679–682. [Google Scholar] [CrossRef]
  31. Meng, E.C.; Goddard, T.D.; Pettersen, E.F.; Couch, G.S.; Pearson, Z.J.; Morris, J.H.; Ferrin, T.E. UCSF ChimeraX: Tools for structure building and analysis. Protein Sci. 2023, 32, e4792. [Google Scholar] [CrossRef] [PubMed]
  32. Colovos, C.; Yeates, T.O. Verification of protein structures: Patterns of nonbonded atomic interactions. Protein Sci. 1993, 2, 1511–1519. [Google Scholar] [CrossRef] [PubMed]
  33. Fu, Y.; Zhao, J.; Chen, Z. Insights into the molecular mechanisms of protein-ligand interactions by molecular docking and molecular dynamics simulation: A case of oligopeptide binding protein. Comput. Math. Methods Med. 2018, 2018, 3502514. [Google Scholar] [CrossRef]
  34. Abraham, M.J.; Murtola, T.; Schulz, R.; Páll, S.; Smith, J.C.; Hess, B.; Lindahl, E.J.S. GROMACS: High performance molecular simulations through multi-level parallelism from laptops to supercomputers. Softw. X 2015, 1, 19–25. [Google Scholar] [CrossRef]
  35. Van Der Spoel, D.; Lindahl, E.; Hess, B.; Groenhof, G.; Mark, A.E.; Berendsen, H.J.C. GROMACS: Fast, flexible, and free. J. Comput. Chem. 2005, 26, 1701–1718. [Google Scholar] [CrossRef]
  36. Gorelov, S.; Titov, A.; Tolicheva, O.; Konevega, A.; Shvetsov, A. DSSP in GROMACS: Tool for defining secondary structures of proteins in trajectories. J. Chem. Inf. Model. 2024, 64, 3593–3598. [Google Scholar] [CrossRef]
  37. Bojovschi, A.; Liu, M.S.; Sadus, R.J. Conformational dynamics of ATP/Mg:ATP in motor proteins via data mining and molecular simulation. J. Chem. Phys. 2012, 137, 075101. [Google Scholar] [CrossRef]
  38. Pillsbury, M.; Orland, H.; Zee, A. Steepest descent calculation of RNA pseudoknots. Phys. Rev. E 2005, 72, 011911. [Google Scholar] [CrossRef]
  39. Yue, F.; Zhang, J.; Xu, J.; Niu, T.; Lu, X.; Liu, M. Effects of monosaccharide composition on quantitative analysis of total sugar content by phenol-sulfuric acid method. Front. Nutr. 2022, 9, 963318. [Google Scholar] [CrossRef]
  40. Wang, L.; Shan, T.; Xie, B.; Ling, C.; Shao, S.; Jin, P.; Zheng, Y. Glycine betaine reduces chilling injury in peach fruit by enhancing phenolic and sugar metabolisms. Food Chem. 2019, 272, 530–538. [Google Scholar] [CrossRef]
  41. Meng, X.; Pijning, T.; Tietema, M.; Dobruchowska, J.M.; Yin, H.; Gerwig, G.J.; Kralj, S.; Dijkhuizen, L. Characterization of the glucansucrase GTF180 W1065 mutant enzymes producing polysaccharides and oligosaccharides with altered linkage composition. Food Chem. 2017, 217, 81–90. [Google Scholar] [CrossRef]
  42. Sakamoto, S.; Putalun, W.; Vimolmangkang, S.; Phoolcharoen, W.; Shoyama, Y.; Tanaka, H.; Morimoto, S. Enzyme-linked immunosorbent assay for the quantitative/qualitative analysis of plant secondary metabolites. J. Nat. Med. 2018, 72, 32–42. [Google Scholar] [CrossRef]
  43. Ramakers, C.; Ruijter, J.M.; Deprez, R.H.L.; Moorman, A.F.J.N.l. Assumption-free analysis of quantitative real-time polymerase chain reaction (PCR) data. Neurosci. Lett. 2003, 339, 62–66. [Google Scholar] [CrossRef]
  44. Lyu, F.; Han, F.; Ge, C.; Mao, W.; Chen, L.; Hu, H.; Chen, G.; Lang, Q.; Fang, C. OmicStudio: A composable bioinformatics cloud platform with real-time feedback that can generate high-quality graphs for publication. Imeta 2023, 2, e85. [Google Scholar] [CrossRef] [PubMed]
  45. Zarrella, T.M.; Metzger, D.W.; Bai, G. Stress suppressor screening leads to detection of regulation of cyclic di-AMP homeostasis by a trk family effector protein in Streptococcus pneumoniae. J. Bacteriol. 2018, 200, 1110–1128. [Google Scholar] [CrossRef]
  46. Oppenheimer-Shaanan, Y.; Wexselblatt, E.; Katzhendler, J.; Yavin, E.; Ben-Yehuda, S. c-di-AMP reports DNA integrity during sporulation in Bacillus subtilis. Embo Rep. 2011, 12, 594–601. [Google Scholar] [CrossRef]
  47. Kwon, Y.; Park, C.; Lee, J.; Park, D.H.; Jeong, S.; Yun, C.H.; Park, O.J.; Han, S.H. Regulation of bone cell differentiation and activation by microbe-associated molecular patterns. Int. J. Mol. Sci. 2021, 22, 5805. [Google Scholar] [CrossRef] [PubMed]
  48. Logsdon, J.M.; Faguy, D.M. Thermotoga heats up lateral gene transfer. Curr. Biol. 1999, 9, R747–R751. [Google Scholar] [CrossRef] [PubMed]
  49. Bruley, A.; Mornon, J.-P.; Duprat, E.; Callebaut, I. Digging into the 3D structure predictions of AlphaFold2 with low confidence: Disorder and beyond. Biomolecules 2022, 12, 1467. [Google Scholar] [CrossRef]
  50. Hung, L.; Samudrala, R. PROTINFO: Secondary and tertiary protein structure prediction. Nucleic Acids Res. 2003, 31, 3296–3299. [Google Scholar] [CrossRef]
  51. Gogoi, C.R.; Rahman, A.; Saikia, B.; Baruah, A. Protein dihedral angle prediction: The state of the art. Chem. Select 2023, 8, e202203427. [Google Scholar] [CrossRef]
  52. Bryant, P.; Pozzati, G.; Elofsson, A. Improved prediction of protein-protein interactions using AlphaFold2. Nat. Commun. 2022, 13, 1265. [Google Scholar] [CrossRef] [PubMed]
  53. Manjula, M.; Pampa, K.J.; Kumar, S.M.; Mukherjee, S.; Kunishima, N.; Rangappa, K.S.; Lokanath, N.K. Crystal structure of ATP-binding subunit of an ABC transporter from Geobacillus kaustophilus. Biochem. Biophys. Res. Commun. 2015, 459, 113–117. [Google Scholar] [CrossRef] [PubMed]
  54. Domanski, T.L.; Halpert, J.R. Analysis of mammalian cytochrome P450 structure and function by site-directed mutagenesis. Curr. Drug Metab. 2001, 2, 117–137. [Google Scholar] [CrossRef]
  55. Rosenberg, J.; Dickmanns, A.; Neumann, P.; Gunka, K.; Arens, J.; Kaever, V.; Stuelke, J.; Ficner, R.; Commichau, F.M. Structural and biochemical analysis of the essential diadenylate cyclase CdaA from Listeria monocytogenes. J. Biol. Chem. 2015, 290, 6596–6606. [Google Scholar] [CrossRef]
  56. Chandel, T.I.; Zaman, M.; Khan, M.V.; Ali, M.; Rabbani, G.; Ishtikhar, M.; Khan, R.H. A mechanistic insight into protein-ligand interaction, folding, misfolding, aggregation and inhibition of protein aggregates: An overview. Int. J. Biol. Macromol. 2018, 106, 1115–1129. [Google Scholar] [CrossRef]
  57. Peng, X.; Michalek, S.; Wu, H. Effects of diadenylate cyclase deficiency on synthesis of extracellular polysaccharide matrix of Streptococcus mutans revisit. Environ. Microbiol. 2016, 18, 3612–3619. [Google Scholar] [CrossRef]
  58. Agarwal, V.; McShan, A.C. The power and pitfalls of AlphaFold2 for structure prediction beyond rigid globular proteins. Nat. Chem. Biol. 2024, 20, 950–959. [Google Scholar] [CrossRef]
  59. Pijning, T.; te Poele, E.M.; de Leeuw, T.C.; Guskov, A.; Dijkhuizen, L. Crystal structure of 4,6-α-Glucanotransferase GtfC-ΔC from Thermophilic Geobacillus 12AMOR1: Starch transglycosylation in non-permuted GH70 enzymes. J. Agric. Food Chem. 2022, 70, 15283–15295. [Google Scholar] [CrossRef]
  60. Laskowski, R.A.; Jablonska, J.; Pravda, L.; Varekova, R.S.; Thornton, J.M. PDBsum: Structural summaries of PDB entries. Protein Sci. 2018, 27, 129–134. [Google Scholar] [CrossRef]
  61. Salentin, S.; Schreiber, S.; Haupt, V.J.; Adasme, M.F.; Schroeder, M. PLIP: Fully automated protein-ligand interaction profiler. Nucleic Acids Res. 2015, 43, W443–W447. [Google Scholar] [CrossRef] [PubMed]
  62. Peng, X.; Zhang, Y.; Bai, G.; Zhou, X.; Wu, H. Cyclic di-AMP mediates biofilm formation. Mol. Microbiol. 2016, 99, 945–959. [Google Scholar] [CrossRef]
  63. Holcomb, M.; Chang, Y.-T.; Goodsell, D.S.; Forli, S. Evaluation of AlphaFold2 structures as docking targets. Protein Sci. 2023, 32, e4530. [Google Scholar] [CrossRef] [PubMed]
  64. Sargsyan, K.; Grauffel, C.; Lim, C. How molecular size impacts RMSD applications in molecular dynamics simulations. J. Chem. Theory Comput. 2017, 13, 1518–1524. [Google Scholar] [CrossRef] [PubMed]
  65. Wu, X.; Xu, L.; Li, E.; Dong, G. Molecular dynamics simulation study on the structures of fascin mutants. J. Mol. Recognit. 2023, 36, e2998. [Google Scholar] [CrossRef]
  66. Fuglebakk, E.; Echave, J.; Reuter, N. Measuring and comparing structural fluctuation patterns in large protein datasets. Bioinformatics 2012, 28, 2431–2440. [Google Scholar] [CrossRef]
  67. Dong, W.; Zhu, W.; Wu, Q.; Li, W.; Li, X. Improvement the thermostability and specific activity of acidic xylanase PjxA from Penicillium janthinellum via rigid flexible sites. Int. J. Biol. Macromol. 2024, 279, 135399. [Google Scholar] [CrossRef]
  68. Lobanov, M.Y.; Bogatyreva, N.S.; Galzitskaya, O.V. Radius of gyration as an indicator of protein structure compactness. Mol. Biol. 2008, 42, 623–628. [Google Scholar] [CrossRef]
  69. Islam, R.; Parves, M.R.; Paul, A.S.; Uddin, N.; Rahman, M.S.; Al Mamun, A.; Hossain, M.N.; Ali, M.A.; Halim, M.A. A molecular modeling approach to identify effective antiviral phytochemicals against the main protease of SARS-CoV-2. J. Biomol. Struct. Dyn. 2021, 39, 3213–3224. [Google Scholar] [CrossRef]
  70. Shibata, M.; Zielinski, T.J. Computer graphics presentations and analysis of hydrogen bonds from molecular dynamics simulation. J. Mol. Graph. 1992, 10, 88–95. [Google Scholar] [CrossRef]
  71. Duong, T.; Devi, A.P.; Tran, N.; Phan, H.; Huynh, N.; Sichaem, J.; Tran, H.; Alam, M.; Nguyen, T.; Nguyen, H.; et al. Synthesis, α-glucosidase inhibition, and molecular docking studies of novel N-substituted hydrazide derivatives of atranorin as antidiabetic agents. Bioorg. Med. Chem. Lett. 2020, 30, 127359. [Google Scholar] [CrossRef] [PubMed]
  72. Pietrucci, F.J.R.i.P. Strategies for the exploration of free energy landscapes: Unity in diversity and challenges ahead. Rev. Phys. 2017, 2, 32–45. [Google Scholar] [CrossRef]
  73. Tavernelli, I.; Cotesta, S.; Di Iorio, E.E. Protein dynamics, thermal stability, and free-energy landscapes: A molecular dynamics investigation. Biophys. J. 2003, 85, 2641–2649. [Google Scholar] [CrossRef] [PubMed]
  74. Alrouji, M.; DasGupta, D.; Ashraf, G.M.; Bilgrami, A.L.; Alhumaydhi, F.A.; Al Abdulmonem, W.; Shahwan, M.; Alsayari, A.; Atiya, A.; Shamsi, A. Inhibition of microtubule affinity regulating kinase 4 by an acetylcholinesterase inhibitor, Huperzine A: Computational and experimental approaches. Int. J. Biol. Macromol. 2023, 235, 123831. [Google Scholar] [CrossRef]
  75. Yang, Y.; Ye, G.; Qi, X.; Zhou, B.; Yu, L.; Song, G.; Du, R. Exploration of exopolysaccharide from Leuconostoc mesenteroides HDE-8: Unveiling structure, bioactivity, and food industry applications. Polymers 2024, 16, 954. [Google Scholar] [CrossRef]
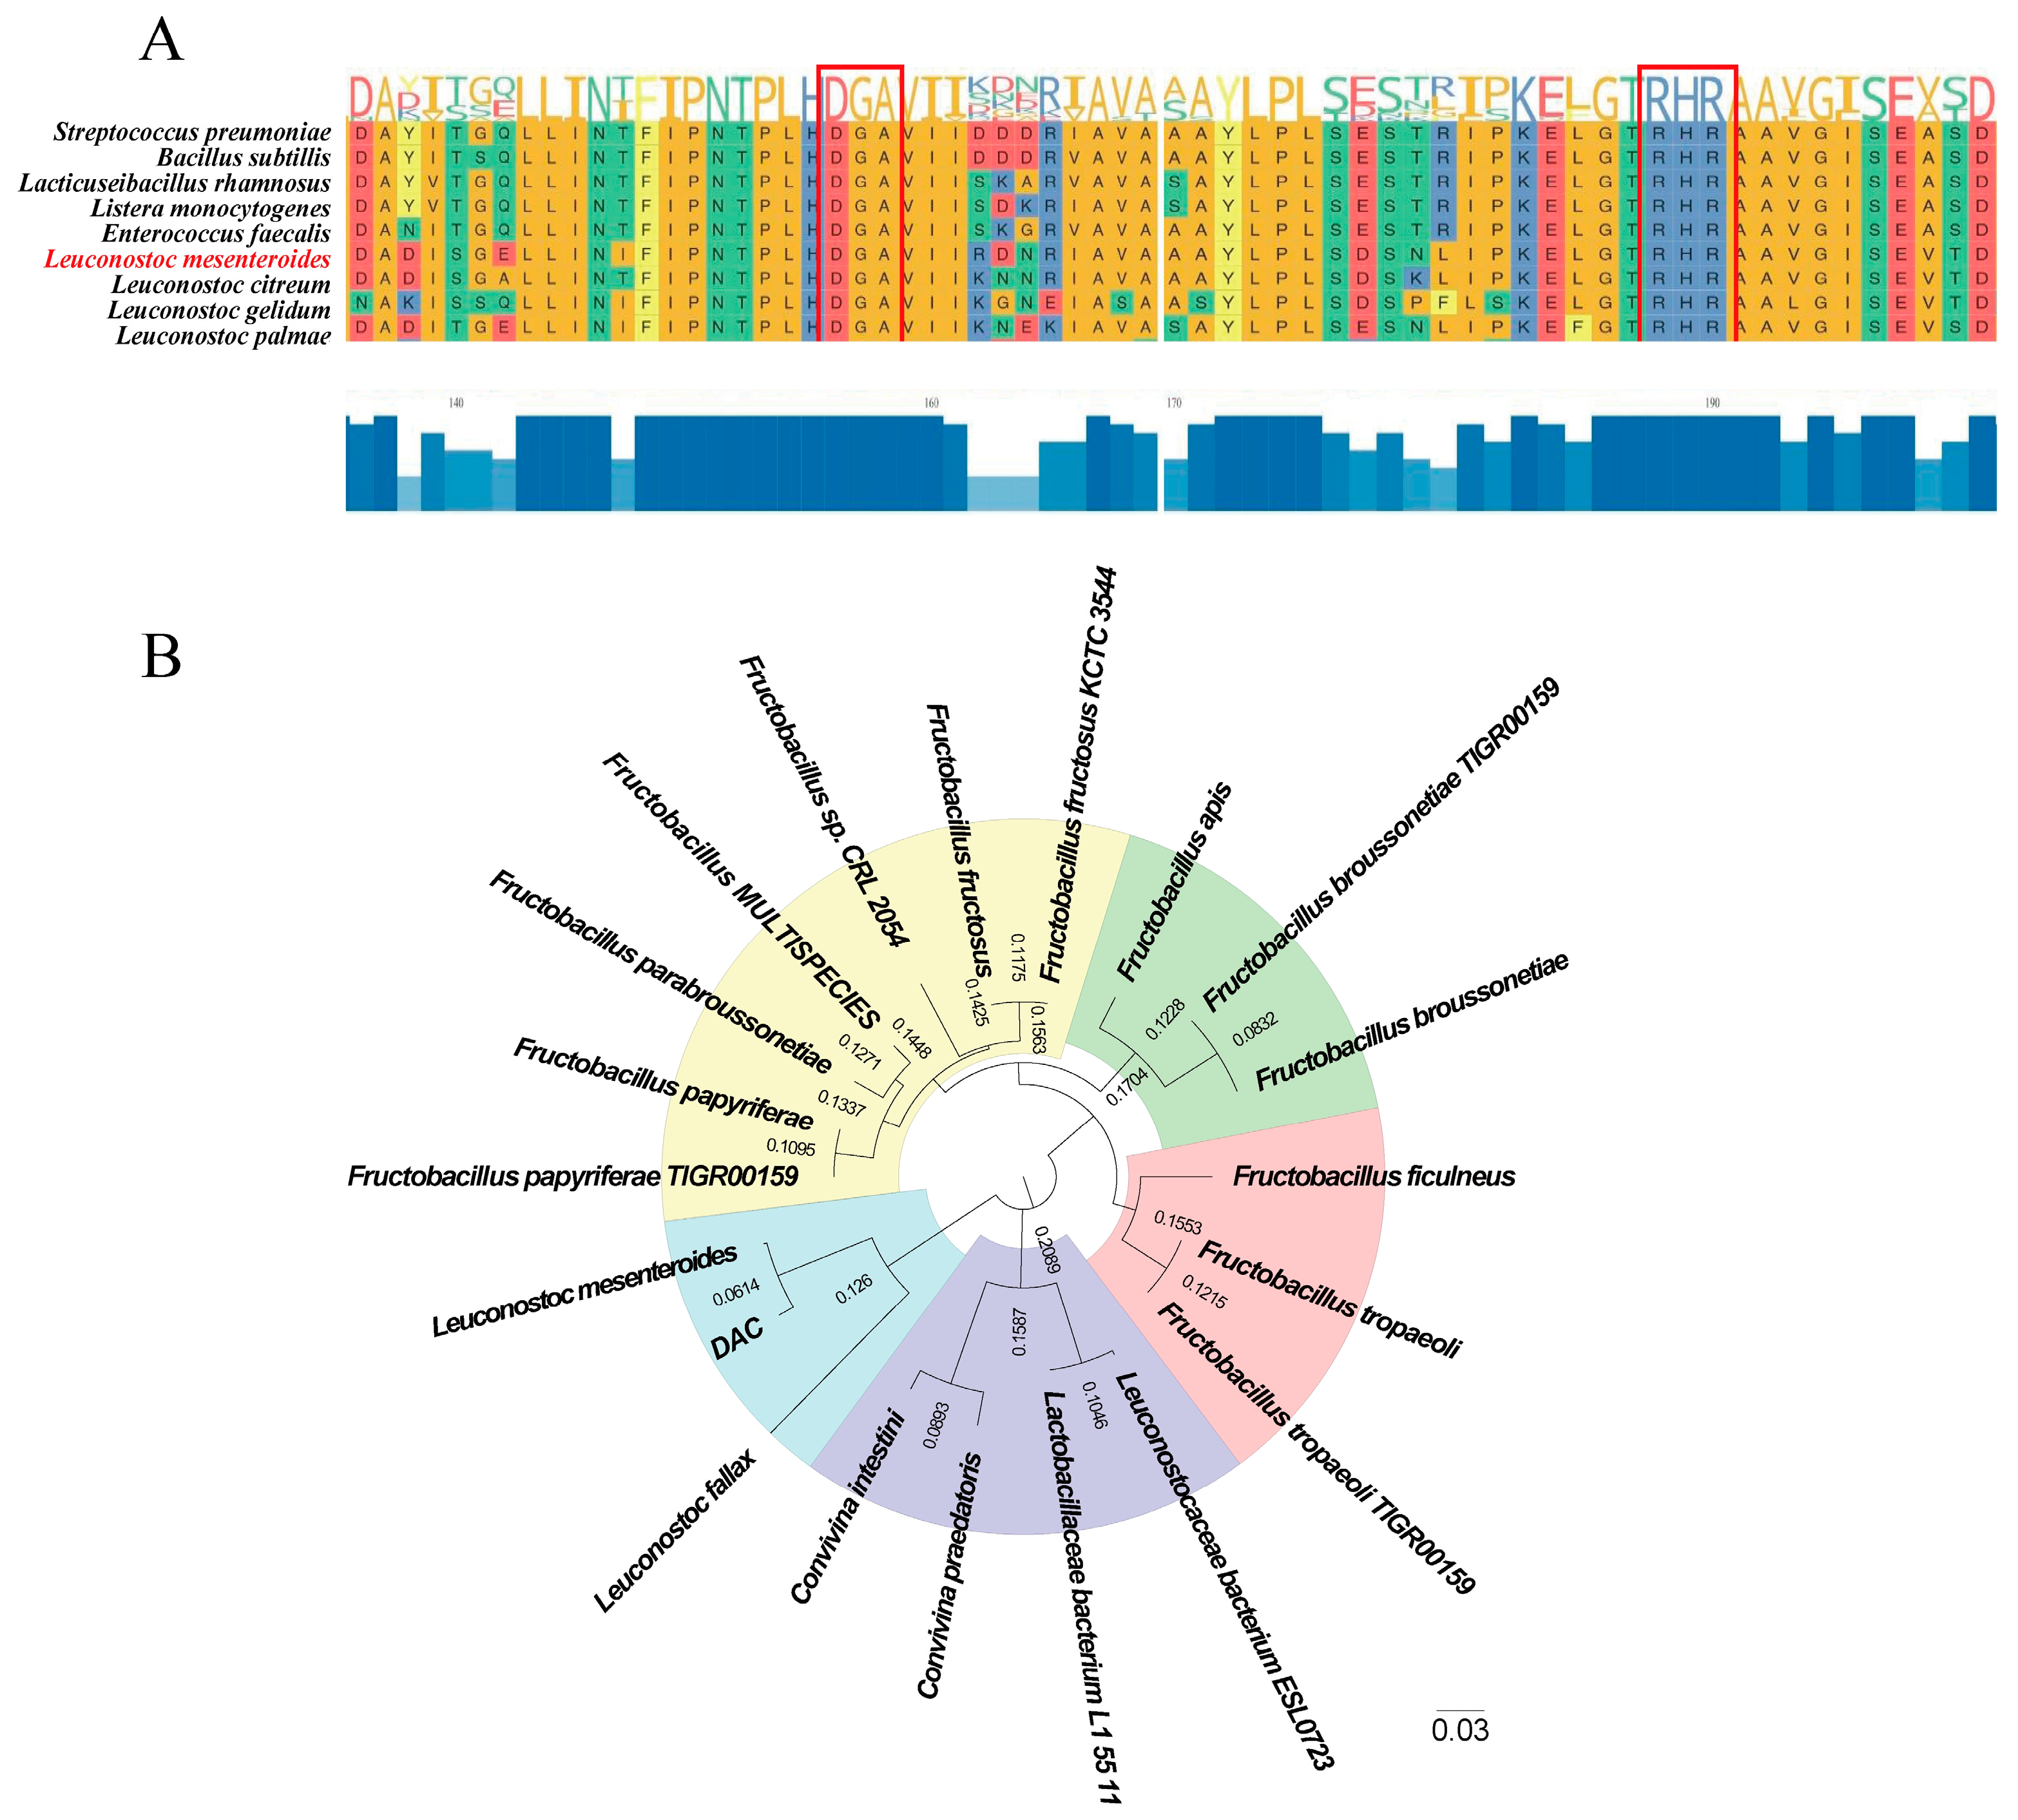
Figure 1. (A) DAC multiple sequence alignment (key parts of intercepts); (B) protein evolutionary tree of DAC (the number of 0.03 on branches indicate genetic distances (branch lengths), and the scale bar represents substitutions per site).
Fermentation 11 00196 g001
Figure 2. DAC protein structure prediction: (A) secondary structure prediction; (B) tertiary structure prediction; (C) DAC 3D structural Ramachandran plot analysis; (DF) visualization of MSA depth and diversity and the AlphaFold2 confidence measures (pLDDT and PAE).
Fermentation 11 00196 g002
Figure 3. Structural validation of DAC using Saves database. (A) Main chain geometry parameters: (a). Ramachandran plot quality assessment; (b). peptide bond planarity evaluated by ω-angle standard deviation; (c). bad non-bonded interactions; (d). α-carbon tetrahedral distortion index; (e). hydrogen bond energy distribution; (f). overall G-factor; (B) residue-specific Ramachandran analysis: phi (φ)-psi (ψ) angle distribution colored by amino acid type.
Fermentation 11 00196 g003
Figure 4. (A) Molecular interactions of DAC with ATP1; (B) molecular interactions of DAC-ATP1 with ATP2; (C) schematic representation of the DAC sequence targeted for mutation.
Fermentation 11 00196 g004
Figure 5. DAC docking differences with two ATP and c-di-AMP molecules before and after targeted mutagenesis.
Fermentation 11 00196 g005
Figure 6. (A) 3D structure of GtfC constructed from Swiss-model database; (B) the interaction between GtfC and DAC analyzed by PDBsum software; (C) 3D display of GtfC and DAC protein interactions; (D) the interaction between GtfC and DAC analyzed by PLIP software.
Fermentation 11 00196 g006
Figure 7. (A) Trends in DAC with ATP RMSD; (B) trends in RMSD of DAC over 150 ns; (C) trends in DAC with ATP Rg; (D) trends in DAC with ATP SASA; (E) DSSP simulated DAC secondary structure changes; (F) hydrogen bond analysis, considering the number of hydrogen bonds between DAC and ATP1 molecules; (G) number of hydrogen bonds between DAC-ATP1 and ATP2 molecules.
Fermentation 11 00196 g007
Figure 8. DAC and ATP Gibbs Energy Landscape: (A) 3D Gibbs Energy Landscape; (B) 2D Gibbs Energy Landscape; (C) The most stable structure of the DAC; (D) DAC and ATP MMGBSA.
Fermentation 11 00196 g008
Figure 9. (A) Dac, pde and gtfC gene expression during fermentation; (B) C-di-AMP and EPS contents during fermentation; (C) GtfC, DAC and PDE activities during fermentation; (D) correlation between dac, pde and gtfC; (E) correlations between DAC, PDE GtfC, c-di-AMP and EPS; (F) Mantel test to test the correlation between three genes (dac, pde and gtfC) and five metabolites (DAC, PDE, GtfC, c-di-AMP and EPS); (G) schematic diagram of DAC-synthesized c-di-AMP regulation of L. mesenteroides DRP105 EPS biosynthesis (the yellow arrow represents positive regulation) (when p < 0.01 was considered statistically significant and indicated by **. p < 0.001 was considered an extremely significant statistical difference and was indicated by ***).
Fermentation 11 00196 g009
Table 1. DAC main chain parameters.
Main Chain ParameterNumber of Data PointsParameter ValuesTypical Comparison ValueWideband Data Peak Frequency DeviationThe Amount of Bandwidth That Deviates from the AverageEvaluation
a. Percentage of amino acid residues in A, B, and L28691.388.210.00.3Qualified
b. Ω angle3166.46.03.00.1Qualified
b. Error residue/100 residues00.01.010.0−0.1Qualified
c. Zeta angle2981.83.11.6−0.8Qualified
d. Hydrogen bond energy1980.80.70.20.4Qualified
e. Overall G-coefficient318−0.0−0.20.30.5Qualified
Disclaimer/Publisher’s Note: The statements, opinions and data contained in all publications are solely those of the individual author(s) and contributor(s) and not of MDPI and/or the editor(s). MDPI and/or the editor(s) disclaim responsibility for any injury to people or property resulting from any ideas, methods, instructions or products referred to in the content.