Abstract
China possesses abundant wild germplasm resources and a wide range of cultivated strains of Stropharia rugosoannulata. However, issues such as genetic diversity and unclear genetic relationships have had an impact on the classification and preservation of germplasm resources, the breeding of new varieties, and the promotion of superior strains. There is an urgent need for genetic diversity analysis and assessment of germplasm resources. In this study, we conducted whole-genome resequencing of 50 cultivated and wild strains collected from various regions across the country. After applying a series of filtering parameters, we obtained 888,536 high-quality Single Nucleotide Polymorphism (SNP) markers. Using these SNP markers, we performed principal component analysis, population structure analysis, and phylogenetic clusters analysis on the 50 strains. Most cultivated strains exhibited high genetic similarity, while significant genetic diversity was observed among wild strains. Based on factors such as marker distribution throughout the entire genome and marker quality, we selected 358 core SNP markers to construct SNP fingerprints. Two-dimensional barcodes were generated for each strain to enable specific identification. Additionally, the mycelial growth rate of strains was evaluated on Potato Dextrose Agar (PDA) and substrate culture media. We also assessed their lignin degradation capability using guaiacol agar plates assay. It was observed that the mycelial growth rate on PDA and substrate culture medium exhibited a significant correlation with the diameter of the mycelial colony on guaiacol agar medium. Additionally, the correlation between the mycelial growth rate on the substrate medium and that on the guaiacol agar plate was stronger than that on PDA medium. This study provided molecular-level identification and assessment of germplasm resources. It clarified the genetic relationships among strains and the characteristics of mycelium growth-related agronomic traits of each strain. This research contributed to the enrichment and development of utilizable germplasm resources and breeding materials for S. rugosoannulata, offering a scientific basis for further research.
1. Introduction
Stropharia rugosoannulata belongs to the phylum Basidiomycota, class Agaricomycetes, order Agaricales, and family Strophariaceae. It has been recommended by the Food and Agriculture Organization (FAO) of the United Nations as one of the edible mushrooms suitable for cultivation in developing countries [1,2]. In the 1960s, Germany successfully cultivated this mushroom for the first time [3], and, subsequently, other European countries also started cultivation. Cultivation in China began in the 1990s. It has been commercially produced internationally in China, the United States, Poland, Germany, Russia, etc. [4]. The wild strains distributed throughout various regions of China, including Yunnan, Sichuan, Xizang, Jilin, etc. [1,3]. According to statistics from the China Edible Fungi Association (CEFA), the production of this mushroom in China increased by 93.05% in 2022 compared to 2021, reaching approximately 410,500 tons in 2022.
S. rugosoannulata mushrooms have thick stems and caps, a delightful aroma, and a tender, crispy texture. They contain many minerals, B vitamins, polysaccharides, and triterpenoids [5]. They are low in fat and contain ten non-essential amino acids in addition to the eight essential ones [6,7]. Polysaccharides found in these mushrooms effectively boost the immune system; lower blood lipids [8]; exhibit antiviral and antioxidant properties [9,10]; possess antibacterial and antitumor activities [11]; and support liver health [12], making them suitable for the development of functional foods and medicines [13,14]. S. rugosoannulata mushrooms are being cultivated widely in various regions of China, which contributes to an efficient and sustainable circular economy, integrating agriculture and animal husbandry, achieving economic and ecological benefits, and combining land use with soil improvement. The mycelia are able to degrade cellulose and lignin through the secretion of extracellular enzymes, effectively utilizing agricultural and forestry residues such as straw and fallen leaves [15]. It can also reduce the concentration of Escherichia coli in water [16], mitigate nematode damage to vegetable roots [17], remediate soil contaminated with wood preservatives, and degrade toxic substances [18]. When combined with biochar, these mushrooms can enhance soil microbial populations, soil respiration, and enzyme activity [19]. After degrading contaminated soil with 2,4,6-trinitrotoluene (TNT), 17.5% of the nitrogen was absorbed and synthesized into amino acids by the mycelium [20]. The residues of cultivation can improve soil quality through providing nutrition for soil microorganisms, and can be used as organic fertilizer or feed, leading to significant economic and ecological benefits.
Currently, research on the evaluation of germplasm resources has primarily used techniques such as Sequence-Related Amplified Polymorphism (SRAP), Inter-Simple Sequence Repeat (ISSR) molecular markers, isozymes, and Random Amplified Polymorphic DNA (RAPD) to analyze the genetic diversity and genetic relationships among strains [21,22]. However, these previous studies had limitations in terms of the low number of strains analyzed and the relatively poor repeatability and stability of the molecular markers, which restricted the accurate assessment of genetic diversity in germplasm resources. Single Nucleotide Polymorphism (SNP) has become the most widely used genetic marker for genotyping, and it can be obtained through whole-genome resequencing, providing molecular markers that are dispersed throughout the entire genome [23]. The complete genome sequence of S. rugosoannulata has been reported, with a size of 47.9 Mb, including 20 scaffolds, a GC content of 47.95%, and an N50 of 3.73 Mb (NCBI: GCA 028532985.1) [24]. Due to the lack of precise identification and evaluation of germplasm resources, the breeding of new varieties lags behind other edible mushroom species.
SNP markers (SNPs) were used to assess genetic diversity and population structure [25,26], as well as to identify important germplasms for various organisms. The high heritability of these SNPs made them excellent indicators of genetic diversity and phylogenetic evolution in fungal species [27]. SNPs have been applied in the identification of cultivated mushroom varieties and the study of functional genes, establishing links with phenotypic traits [28,29]. In summary, the use of DNA molecular markers, particularly SNPs, for the identification of germplasm resources is crucial for overcoming the limitations of traditional morphological identification methods. DNA fingerprinting is a powerful method for identifying genetic diversity and distinguishing between different plant varieties based on molecular markers or specific sequences [30,31,32], which has been widely applied in the diversity assessment and purity identification of various crops [33]. SNPs are the preferred markers for establishing DNA fingerprint databases due to their abundance, widespread distribution, high stability, and repeatability, which have been used to analyze the effect of the environment on the population structure of exotic mycorrhizal species [34]. However, there are currently no fingerprint databases based on SNPs available for S. rugosoannulata.
Mycelial growth rate is an important agronomic trait of mushroom strains, including the growth rate on Potato Dextrose Agar (PDA) and substrate culture media. PDA culture media are nutrient rich, while substrate culture media contain abundant lignin and cellulose. During mycelial growth, the secretion of lignocellulose-degrading enzymes by the mushroom contributes to its nutrient uptake and growth [35,36]. Previous research has found that the lignin degradation capability of a mushroom strain is closely related to mycelial biomass and the yield of fruiting bodies. Enzyme activities, particularly laccase activity, can reflect mycelial vitality to some extent and correlate with mycelial growth and fruiting body development [37,38,39]. Genomic functional annotation and analysis of cell wall-degrading enzymes indicated a rich lignocellulase system of S. rugosoannulata [15,40]. Various agricultural and forestry residues can be used as substrates for cultivating, which contain abundant lignocellulose. The analysis of enzymes involved in substrate degradation could facilitate the optimization of cultivation substrates and the improvement of the quality of cultivation when utilizing the copious lignocellulosic residues from agriculture and forestry as substrates. Guaiacol has been often used as a model compound for lignin catalysis studies [41]. The ability of strains to produce lignin-degrading enzymes can be screened for by using guaiacol agar plates [42,43,44], with the diameter of mycelial zones and oxidation zones as evaluation indicators [45,46].
The germplasm resources of S. rugosoannulata are abundant in China, and there are numerous cultivated strains. However, the existence of various names for the same or closely related varieties has led to confusion in classification, as well as to unclear genetic specificity and relationships among strains. These issues have made it difficult to classify and preserve germplasm resources, select suitable parents for breeding, and promote superior varieties. Therefore, there is an urgent need for genetic diversity analysis and evaluation of germplasm resources. In this study, genome-wide high-quality SNPs were discovered based on whole-genome resequencing data from 50 strains of S. rugosoannulata collected from various regions of China. Population genetic analyses were conducted. Uniformly distributed core SNP sites were selected for generating SNP fingerprints and two-dimensional barcodes (2D-barcodes). This comprehensive approach allowed for the exploration of genetic variation information and a deeper understanding of the genetic diversity and population structure of the 50 strains germplasm resources. Additionally, evaluation of agronomic traits was conducted, focusing on mycelial growth rate and lignin degradation capability. The identification and assessment of strains were conducted at both the molecular and agronomic trait levels, clarifying the genetic relationships among strains and the characteristics of agronomic traits of each strain. Excellent germplasm resources were identified, providing a scientific basis for enriching and developing utilizable germplasm resources and breeding materials for S. rugosoannulata.
2. Materials and Methods
2.1. Experimental Materials
The test strains were collected and stored in the China Center for Mushroom Spawn Standards and Control (CCMSSC). Detailed information regarding strain numbers, names, and their sources can be found in Table 1.

Table 1.
The test strains.
2.2. DNA Extraction and Re-Sequencing
Genomic DNA of the tested strains were extracted from mycelia collected on PDA plates by using the CTAB method. The NanoDrop 2000 spectrophotometer (Termo Fisher Scientifc, Waltham, MA, USA) was used to detect DNA concentration and purity [47]. Sequencing libraries with 350 bp inserts were constructed, and the libraries were sequenced on the Illumina/BGI sequencing platform by Biomarker Technologies Co., Ltd. (Beijing, China), generating paired-end sequences of 150 bp.
2.3. SNP Identification and Marker Selection
The detection of SNPs was primarily carried out using the GATK (v3.8) software toolkit. Redundant reads were filtered using samtools (v1.9) based on the alignment of Clean Reads to the reference genome (NCBI: GCA 028532985.1) to ensure the accuracy of the detection results. SNP variations were then detected using the Haplotype Caller algorithm of GATK (v3.8).
Quality control of the variation results was conducted through strict filtering to ensure the reliability of the variation results. The main filtering parameters included: (1) Filtering out SNPs within 5 bp of InDels and InDels within 10 bp of each other using the subprogram vcfutils.pl (var Filter -w 5 -W 10) from bcftools; (2) cluster Size 2 cluster Window Size 5, indicating that the number of variations within a 5 bp window should not exceed 2; (3) QUAL < 30, representing the Phred-format quality value, indicating the likelihood of the presence of a variant at that position (positions with quality values below 30 were filtered out); (4) QD < 2.0, the ratio of variation quality (Quality) to coverage depth (Depth), where coverage depth is the sum of the coverage depths of all samples containing variant bases at that position (positions with QD below 2.0 were filtered out); (5) MQ < 40, the root mean square of the quality values of all reads aligned to that position (positions with MQ below 40 were filtered out); and (6) FS > 60.0, a value derived from Fisher’s test p-value, which describes whether there is significant positive or negative strand specificity for reads containing only variants or reads containing only reference sequence bases during sequencing or alignment. In other words, strand-specific alignment results should not occur, so FS should be close to zero. Positions with FS greater than 60 were filtered out. In the final filtering parameter, (7) other variation filtering parameters were processed with default values as specified by GATK (v3.8) [48]. The raw data in fastq format (Raw data) were first processed using fastq. In this step, sequences containing adapters, ploy-N sequences, and low-quality sequences were removed from the raw data to obtain clean data. Simultaneously, Q20, Q30, GC content, and sequence duplication levels were calculated. All downstream analyses were performed based on high-quality clean data. The effective data were aligned to the reference genome sequence using the bwa-mem2 (v2.2) software.
2.4. Population Genetic Analysis
Using the SNP data, principal component analysis (PCA) was performed to obtain clustering information about the samples by the EIGENSOFT (v6.0.2) software. The admixture (v1.3.0) software was used to analyze the population structure of the materials. The IQ-TREE (v2.0) software was utilized to infer the genetic relationships between the materials based on genetic data using the maximum likelihood method with 1000 bootstrap repetitions. A distance matrix was constructed, and a phylogenetic tree was generated based on this distance matrix.
2.5. Selection of Core SNP Markers and Construction of SNP Fingerprints
Using 50 strains of S. rugosoannulata as materials, well-genotyped markers were selected as candidate markers for core SNP markers. The criteria for selecting core SNP markers included: markers that are evenly distributed across the genome, with none missing (i.e., 100% completeness); markers with a Minor Allele Frequency (MAF) of less than 20% were discarded; markers with a Polymorphic Information Content (PIC) of less than 0.35 were discarded; markers with a Hardy-Weinberg test p-value greater than 0.01 were retained; and no other mutations were present within 100 bp before and after the selected markers [49]. Fingerprints and 2D-barcodes were generated for the 50 strains based on the selected core SNP markers by using the Qrencode program [49].
2.6. Agronomic Trait Evaluation
2.6.1. Mycelial Growth Rate Evaluation
Activated strains were evenly inoculated from the colony edge by taking mycelial plugs of 5 mm in diameter and placing them in the center of DifcoTM standard PDA (Becton, Dickinson and Company, Sparks, MD, USA) plates. Each strain had three replicates, and they were incubated at 25 °C. The colony diameters were measured with a Vernier caliper on the 5th and 9th days after inoculation.
Prepared substrate culture media were placed in 32 × 200 mm test tubes, with each tube containing 50–55 g (wet weight) of substrate (99% wood chips and 1% limestone with a water content of 60–65%). The tubes were sealed and autoclaved at high pressure (121 °C, 90 min). Mycelial plugs of 1 cm in diameter were inoculated at the top surface of the substrate in tubes, and the tubes were placed upright in a 25 °C incubator. Each strain had three replicates, and the mycelial growth rate was measured on days 5, 10, and 15 during incubation.
2.6.2. Evaluation of Lignin Degradation Capability
Mycelial plugs (5 mm in diameter) of the tested strains were inoculated in the center of guaiacol agar plates (0.2 mL guaiacol was added to 500 mL melted DifcoTM standard PDA medium. The media were sterilized for 30 min at 121 °C and poured into petri dishes). Each strain had three replicates, and they were incubated at 25 °C. The diameters of the mycelial zones and the oxidation zones were measured on the 5th and 10th days.
2.7. Statistical Analysis
The experimental data were analyzed using Excel for calculating mean values and standard deviations. ANOVA analysis and Pearson correlation analysis for the mycelial growth rate were conducted using Genstat edition 21 and SPSS (v26.0) software to assess significance of variation and correlation between traits.
3. Results
3.1. Genetic Diversity Analysis of S. rugosoannulata
3.1.1. Quality Statistics of Sequencing Data
The clean reads for each strain ranged from 12,269,086 to 26,885,936, with an average of approximately 16,335,587. The Q30 values ranged from 91.81% to 95.25%, with an average of 93.98%. The GC% content ranged from 43.77% to 47.45%, with an average of 46.34% (Supplementary Table S1). The total data volume of the 50 strains was 122.20 gigabase pairs (Gbp) of clean data, and the average alignment rate to the reference genome was 95.90%. The average coverage depth was 47×, and the genome coverage was 97.75% (covering at least one base), meeting the requirements for sequence analysis.
3.1.2. Discovery and Filtering of SNPs
After sequencing, the GATK (v3.8) analysis toolkit was used to filter and identify SNPs between the samples and the reference genome (NCBI: GCA 028532985.1). A total of 888,536 SNPs were detected for further analysis. Whole-genome SNP mutations could be categorized into six types. There were 703,337 transition type SNPs and 185,199 transversion type SNPs, resulting in a transition-to-transversion ratio of 3.79. Among the 50 samples, the highest number of 338,401 SNPs was found between samples A4680 and A4896, and the lowest number of 5393 SNPs was between samples A4486 and A4490 (Supplementary Table S2). Further analysis of the distribution of SNPs in the genome revealed that the variant sites were located in different regions of the genome. Using SnpEff [50], it was determined that 21.31% were in intergenic regions, 7.01% were in introns, 27.59% were in coding sequence (CDS) regions, 19.4% were in the upstream region (within 5K) of genes, and 18.87% were in the downstream region (within 5K) of genes. Additionally, 1.85% were in the 5’ untranslated region (UTR) and 2.4% were in the 3’ UTR. Moreover, 1.31% were in splice site regions (Figure 1). SNP functional annotation within CDS regions mainly consisted of synonymous coding mutations (41.56%) and non-synonymous coding mutations (54.41%) (Figure 1). Among these, 1259 SNPs led to synonymous stop codon mutations, while 5628 SNPs (stop-gained) resulted in premature stop codons, and 2865 SNPs (stop-lost) caused the loss of stop codons.
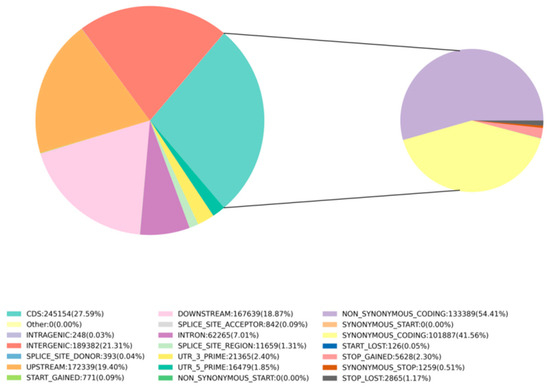
Figure 1.
SNP proportions at different genomic locations: INTERGENIC represents intergenic regions, INTRON represents intronic regions, CDS represents coding sequence regions, UPSTREAM/DOWNSTREAM represent SNP sites located within 5 kb upstream/downstream of genes, UTR_5_PRIME/UTR_3_PRIME represent SNP sites in the 5’ UTR and 3’ UTR of genes, SPLICE_SITE_ACCEPTOR/SPLICE_SITE_DONOR represent splice site mutations (within the first 2 bp of an exon), SPLICE_SITE_REGION represents splice site region mutations (1−3 bp variation in exons or 3−8 bp variation in introns), START_GAINED represents gained start codons (in non-coding regions). SNP mutation types within CDS regions annotation: START_LOST represents lost start codons, SYNONYMOUS_START/NON_SYNONYMOUS_START represent synonymous/non-synonymous start codon mutations, SYNONYMOUS_CODING represents synonymous coding mutations, NON_SYNONYMOUS_CODING represents non-synonymous coding mutations, STOP_GAINED/STOP_LOST represent gained/lost stop codons.
3.1.3. Population Genetic Analysis Based on SNP Markers
To validate the results of the phylogenetic analyses, all of the 888,536 high-quality SNPs from the 50 tested strains were analyzed using EIGENSOFT (v6.0.2) software. The PCA analyses helped to provide insight into the spatial representation of the samples in terms of clustering and phylogenetic relationships. Two-dimensional plots of the values of each sample on the first principal component (PC1) and the second principal component (PC2) showed the spatial genetic relationships between the materials, with PC1 and PC2 explaining 51.27% and 8.61% of the variance, respectively. The results of PCA showed significant genetic diversity between the cultivated strains (Cultivars) and the wild strains (Wild strains) (Figure 2B). Genetic diversity was also observed among strains within Cultivars and wild strains. Generally, the distributions of the two dimensions generated by PCA analyses of all the 50 strains showed the classification of all the cultivars into two clusters (Figure 2A).
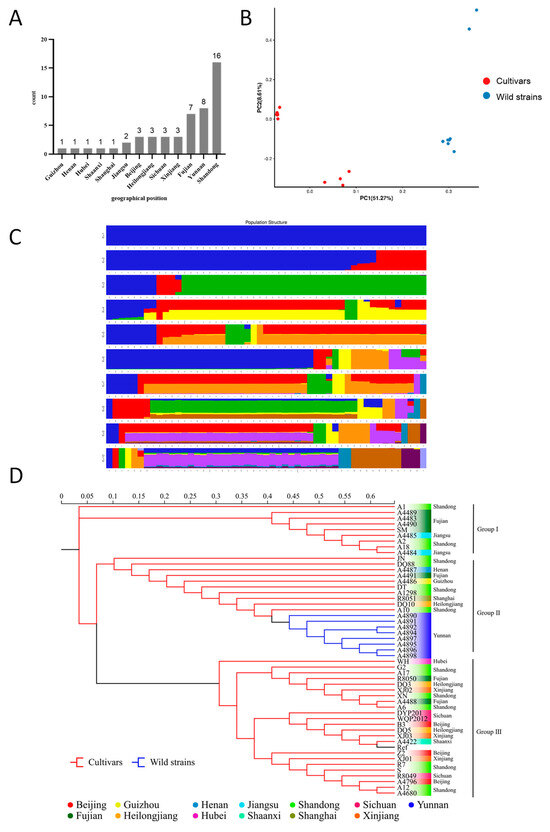
Figure 2.
Population genetic analysis of 50 strains based on polymorphic SNPs. (A) Geographical origin of S. rugosoannulata germplasm resources. (B) Principal component analysis. (C) Population structure at different K values. (D) Phylogenetic tree. Ref stands for the reference strain.
The population structure of the studied materials was further analyzed using the 888,536 high-quality SNPs. Using admixture 1.3, the cross-validation errors were examined under the models with K = 1−10. Finally, the 50 tested strains and the reference strain could be classified into two large clusters at K = 2 (Figure 2C). The first cluster (blue) contained all the cultivars including the reference strain, and the second cluster (red) incorporated the eight wild strains collected in Yunan. To further investigate the population structure, two clusters were identified for the 42 cultivars at K = 3. The five strains A10, A1298, R8051, DQ10, and XJ01 were identified in a new cluster. The analyses were in general agreement with the above mentioned PCA results.
In this study, IQ-TREE (v2.0) software was used to construct a phylogenetic tree for each strain based on all high-quality SNPs using the maximum likelihood method with 1000 bootstrap replicates [51]. Cluster analysis was performed, and the tested strains were divided into three main groups (Figure 2D), and it was generally consistent with the results of the PCA and population structure analysis, indicating the reliability of the results in elucidating the relationship between and within clusters. Cultivars that originated from Fujian, Shandong, and Jiangsu were clustered in Group I, indicating high genetic similarity among them. As we know, most of the cultivars were domesticated from wild strain rather than hybrids (personal communication). A number of cultivars and the wild germplasm from Yunnan were apparently clustered together in Group II, which may indicate the same geographical origin of these strains. Group III clustered the cultivated strains including the two commonly used varieties R8049 and R8050, which were selected almost 20 years ago. Although strains in this group did not have the same origin, they are genetically related. Generally, lower genetic similarity was detected among strains in Group II than in Group I and III.
3.1.4. Selection of Core Markers and Construction of SNP Fingerprints
Following the core SNP marker selection criteria, a total of 358 SNPs were identified as candidate core markers. These SNPs exhibited high quality, strong representativeness, high power of strain discrimination, even distribution across the genome, and strong specificity. Genetic diversity analysis was conducted based on the candidate core markers [49], with a range of Minor Allele Frequency (MAF) and Polymorphism Information Content (PIC) values from 0.340 to 0.500 and 0.350 to 0.375, respectively. The average values were 0.435 for MAF and 0.370 for PIC. Notably, SNPs with PIC values ranging from 0.370 to 0.375 exhibited strong polymorphism. The observed heterozygosity of the 358 variable SNP sites ranged from 0 to 0.80, with an average of 0.653. The genetic diversity of the germplasm resources was also assessed, revealing a range from as low as 0.45 to as high as 0.52, with an average of 0.494 (Figure 3A). SNP Fingerprints based on core SNP markers were generated for the 50 S. rugosoannulata strains (Figure 3B). These were then transformed into 2D-barcodes for each strain, encompassing both the strain’s name and base-pair genotype data (Supplementary File S1). Accessing this information is now conveniently possible through mobile phones.
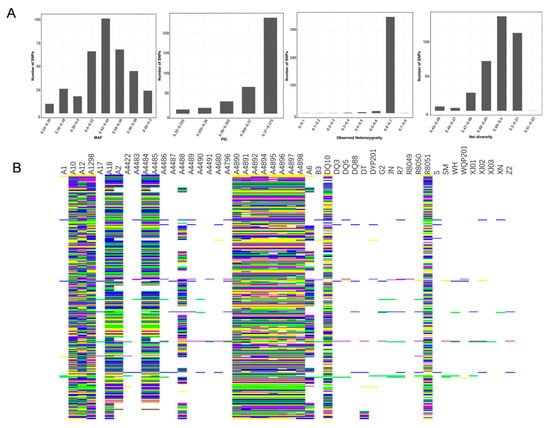
Figure 3.
(A) MAF, PIC, observed heterozygosity, and genetic diversity index of 358 SNPs. (B) SNP Fingerprints of the 50 strains. Each row in the fingerprints corresponds to specific SNPs, while columns represent various strains. The color scheme employed was as follows: yellow denoted the genotype of C/C, green indicated A/A, blue represented T/T, and purple signified G/G. Missing data were depicted in gray, whereas common heterozygous sites among strains were visualized in white.
3.2. Agronomic Trait Evaluation
3.2.1. Mycelial Growth Rate Evaluation
The mycelial growth rates of strains on PDA plates and in substrate culture tubes showed significant genetic variability (p < 0.01) (Supplementary Table S3). Statistical analysis indicated that the differences in traits are primarily determined by different genotypes rather than environmental conditions. On the PDA plates, there was significant variation in mycelial growth rates among the 50 tested strains, ranging from 0.60 to 3.40 mm/d (Supplementary Table S3; Figure 4A). Strain A4890 exhibited the fastest mycelial growth, while strain A4898 exhibited the slowest. Strain A10 did not grow in substrate culture tubes. The largest mycelial growth rate in substrate culture tubes was observed in strain A4422, at 4.41 mm/d (Supplementary Table S3; Figure 4B). The coefficient of variation was 7.00% for the mycelium growth rate on PDA plates and 24.32% for that in substrate tubes. The higher coefficient of variation might indicate the higher divergence of growth rate in substrate among strains. According to the statistical analysis, there was a significant correlation (r = 0.56, sample size = 50, p < 0.01) between mycelial growth rates on PDA plates and in substrate culture tubes (Figure 4D). Nevertheless, it is interesting that specific strains (e.g., A4890, A1298, WH) displayed robust mycelial growth rates on PDA plates, yet they exhibited weaker growth in substrate culture tubes.
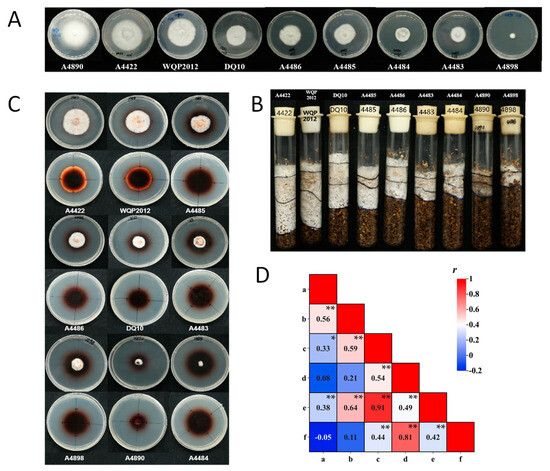
Figure 4.
(A) Mycelium growth of representative strains on PDA plates (10 d). (B) Mycelium growth of representative strains in substrate culture tubes (20 d). (C) Mycelium growth of representative strains on guaiacol agar plates (10 d). (D) Correlation between agronomic traits of mycelium: a and b indicated the mycelial growth rate on PDA plates and in the substrate culture tubes; c and d indicated the diameters of the mycelial zones and the oxidation zones on guaiacol agar plates (5 d); e and f indicated the diameters of the mycelial zones and the oxidation zones on guaiacol agar plates (10 d). Asterisks denote statistically significant correlations (* indicates significance at p < 0.05; ** indicates significance at p < 0.01).
In addition to significant differences in mycelial growth rate, the strains displayed different colony characteristics and mycelial morphologies on both PDA plates and in substrate culture tubes. For example, mycelium growth of 43 strains (e.g., A4422) in substrate culture media was dense, pure white and vigorous growth, while 6 strains (e.g., A4890) had sparse mycelium and slow growth (Figure 4A,B).
3.2.2. Evaluation of Lignin Degradation Capability
Using guaiacol as a supplement to the PDA plates, the lignin degradation capacity of the tested strains (except for the A10) was assessed on the plates. The results showed that 49 strains produced oxidation zones within 24 h after inoculation. As the incubation time increased, both the oxidation zone and mycelial zone diameters increased to varying degrees, and the color of the oxidation zone deepened. Based on measurements taken on the 5th and 10th days, the strains can be generally classified into three categories (Supplementary Table S3; Figure 4C). The first category exhibited rapid growth within 10 days, with mycelial and oxidation zone diameters exceeding 15 mm and 30 mm, respectively, on the 5th day. Examples included 18 strains like A4422 and WQP2012. The second category displayed moderate growth rates, with mycelial and oxidation zone diameters exceeding 10 mm and 30 mm, respectively, on the 5th day. This category included 21 strains like A4483 and A4486. The third category showed slow growth throughout the experiment, which included nine strains like A4484 and A4890.
The correlation analysis demonstrated a significant correlation between the size of the mycelium zones and the oxidation zones on the 5th and the 10th day. Similarly, a significant correlation was observed between the diameters of mycelial zones on the 5th and the 10th days (r = 0.91, sample size = 49, p < 0.01), with the same result as for the oxidation zones (r = 0.81, sample size = 49, p < 0.01). The mycelium growth rate on the PDA plates and the substrate culture tubes exhibited different significant levels of correlation with the size of the mycelium zones on the guaiacol agar plates. The size of the mycelium zone on the guaiacol agar plate showed stronger correlation with the mycelium growth rate on the substrate than on PDA (r = 0.59 on day 5, r = 0.64 on day 10, sample size = 49, p < 0.01) (Figure 4D). It was observed that the abovementioned A4890 had robust mycelial growth rates on PDA results but showed weak growth rate on both substrate and guaiacol plates (Figure 4). The size of the oxidation zones on the guaiacol plate did not show a significant correlation with the mycelium growth rate on PDA and substrate.
By considering the size of the oxidation zones and the mycelial zones on the 5th and 10th days, it can be determined that the first category of strains exhibited excellent lignin and cellulose degradation capabilities, which had faster mycelial growth (Supplementary Table S3; Figure 4). Overall, the size of mycelial zones on guaiacol agar plates could serve as a reliable indicator for predicting mycelium growth in substrate culture media.
4. Discussion
4.1. Genetic Relationships among S. rugosoannulata Varieties
The germplasm resources of S. rugosoannulata in China are complex and heterogeneous. Studying the genetic diversity of germplasm is crucial for identifying resources, discovering new genes, and breeding new varieties. Cultivated strains are mostly from the domesticated wild strains, as breeding practices are still rare for the essential mushroom species. Isolating tissue culture and giving a different name resulted in limited genetic differences between parent strains for breeding practices, leading to issues such as repeated strains and ambiguous genetic relationships among different varieties. Collecting strains of S. rugosoannulata from different regions in China and understanding their genetic relationships and population structures at the genomic level is essential. Additionally, genetic diversity analysis among strains is necessary to facilitate future breeding and utilization of germplasm.
SNP-based genetic diversity assessment can provide more accurate and specific explanations for phenotypic differences compared to traditional molecular markers [52,53,54]. To our knowledge, the use of SNPs for analyzing genetic relationships [55] and constructing SNP fingerprints for the germplasm of S. rugosoannulata has not been reported previously [29,56,57]. The results of the genetic population analysis showed that there was significant genetic variation among strains. The genetic differentiation of germplasm often exhibits a notable correlation with geographic origins [58,59,60]. Previous studies on wheat germplasm resources, while not differentiating local varieties based on their specific origins, intriguingly classified local varieties from the same area into corresponding groups and clusters, aligning closely with the outcomes of this research [61]. In our study, wild strains collected from Yunnan consistently formed distinct clusters, indicating a clear association with their geographical source. Surprisingly, the cultivars, in contrast, did not display a discernible correlation between genetic groups and their presumed origins. While the exact geographic origins of these cultivars remain unknown, the clustering patterns derived from our analysis may offer valuable insights into unraveling their original sources. Except for the A1 strain from Shandong, our findings revealed the presence of three primary groups among the strains. Notably, Group II exhibited larger genetic distances among its strains compared to the other two groups. This suggests that cultivars within Group II likely underwent domestication from wild strains, with a strong genetic and geographic connection to the wild strains found in Yunnan. Cultivars belonging to Group III exhibited close genetic relationships with two frequently utilized cultivars, namely R8049 and R8050. This observation suggests a potential genetic proximity and shared ancestry, implying that the cultivars in Group III may represent genetically enriched variants derived from the two commonly used cultivars.
4.2. Constructing an S. rugosoannulata DNA Fingerprints and Identification of Germplasm Resources
The creation of a fingerprint based on SNPs is crucial for verifying the specificity and authenticity of strains and for understanding their genetic relationships. Traditionally, new varieties were identified based on morphological characteristics, involving a time-consuming identification process that required extensive surveys of various morphological traits [49,62,63] with disadvantages such as long identification cycles, high costs, and the confounding effects of environmental factors. Additionally, phenotypic traits of mushrooms often lack stability, and most strains exhibit similarities in morphology and biological appearance. Currently, the identification of related varieties of S. rugosoannulata is hampered by limitations such as the low number of detected markers and low levels of polymorphism, making it difficult to effectively distinguish between different strains. In this study, 358 core SNPs were selected to construct fingerprints for 50 strains germplasm resources. This approach ensured that each variety had a unique fingerprint code. As breeding technologies continue to develop and the number of cultivars increases, the fingerprint identification system may need further enhancement, especially by adding SNPs closely associated with important agronomic traits to enable more accurate and efficient detection of variety authenticity and specificity. The results obtained from SNP-based fingerprinting will enrich the availability of genomic information. It can be used for further research on genetic diversity, quality control, and modern molecular breeding. These data will provide valuable references and theoretical support for germplasm identification and SNP fingerprint recognition methods. The SNP fingerprint revealed a visual map illustrating polymorphism among strains. Furthermore, 2D-barcodes were generated for each strain, providing information such as the strain’s name and the base pair genotype at the 358 sites, accessible through mobile phone scanning. In the SNP fingerprint, only specific homozygous locus genotypes can be observed in various colors, while the 2D-barcodes can display all genotypes for each germplasm, including both homozygous and heterozygous sites, revealing the specific base pair differences in strains at different SNPs. This method can be used to identify existing strains, screen for duplicated germplasm, and lay the foundation for the standardization and regulation, as well as for its future applications in molecular genetics and breeding programs.
4.3. Evaluation of Agronomic Traits
Mycelial growth rate is not only an indicator of physiological traits but also influences the yield of mushroom cultivation [64]. Strains with fast mycelial growth rates can colonize the substrate more quickly, significantly reducing the incubation time and thus reducing the cultivation cost [65]. In this study, mycelial growth of different strains was evaluated on PDA and substrate culture media. While cultivated strains had higher genetic similarity, they still exhibited different growth rates. This variability may be related to factors such as the number of subcultures and the degree of degeneration. During the process of mycelial activation and transfer, some mycelia may experience reduced vitality, resulting in slower growth rates on PDA. This difference becomes more apparent in the wood-based cultivation substrate. Using guaiacol as substrate, convenient enzyme indicator assays were conducted to analyze the diameter of characteristic colored oxidation zones and mycelial zones produced by fungal strains, which can be used for preliminary evaluation of strains with strong lignocellulosic degradation ability and rapid growth rate [45]. All strains tested in this study exhibited strong lignin-degrading abilities, as evidenced by the development of reddish-brown oxidation zones within 12 h of inoculation [44]. Different strains demonstrated varying growth rates in the wood-based substrate, and their abilities to produce lignocellulosic degrading enzymes would also correspondingly change. The first category of strains cultivated on guaiacol agar plates grew fast in the substrate culture tubes, and the mycelia were dense and white, which indicated that they had a powerful ability to degrade lignocellulose. In contrast, the third category of strains had significantly larger oxidation zones compared to mycelial zones, and they had weaker capabilities of lignocellulose degradation, which lead to poor growth in wood chip substrates. This information can be used to select strains with desirable lignocellulose-degrading capabilities. Correlation analysis of the sizes of mycelial zone and oxidation zone measurements obtained on the 5th and 10th days of cultivation indicated a strong correlation, demonstrating the accuracy and repeatability of the experimental approach. In conclusion, the preliminary prediction of mycelial growth in the substrate media was established based on the mycelial growth observed on guaiacol agar plates. This approach can serve as a favorable index for strain screening in the production process. While we only evaluated the agronomic traits of the S. rugosoannulata germplasm during the mycelium stage in this study, further research is essential to explore that during the development process of fruiting bodies.
5. Conclusions
This study lays the foundation for the identification of the germplasm of S. rugosoannulata in China. A total of 888,536 high-quality SNPs were obtained via genome re-sequencing analyses. Based on these SNPs, systematic phylogenetic analysis, principal component analysis, and population structure analysis were performed on the 50 S. rugosoannulata germplasms. A fingerprint was constructed according to the selected 358 core SNP markers. The results suggested not only that the cultivars are genetically closely related, but also that the wild strains are geographically diverse, highlighting the complex and diverse genetic background in the country. The development of SNPs and the construction of 2D-barcodes based on selected core markers have provided a unique fingerprint for each strain. Additionally, mycelial growth rates and lignin-degrading capabilities were assessed for the 50 strains. By combining the mycelial zone and oxidation zone diameters on guaiacol agar plates, lignin-degrading capabilities were compared and classified for each strain. Lignin-degrading capabilities were found to be significantly correlated with mycelial growth rates in substrate culture tubes, which can be the index of strain screening in the production process. The observed differences and specificities among different strains further validate the diversity in lignin-degrading enzyme systems among different fungal strains. This diversity can be utilized in the breeding of high-efficiency lignin-degrading strains. Given the promising economic and ecological benefits of S. rugosoannulata and the expanding cultivation scale, this subject has gained increasing interest among researchers. The findings of this study are pivotal in facilitating the comprehensive utilization by aiding in the identification of valuable parental strains for future breeding projects and expediting the selection process for superior cultivated varieties.
Supplementary Materials
The following supporting information can be downloaded at: https://www.mdpi.com/article/10.3390/horticulturae10030213/s1, Table S1: Sample sequencing data evaluation statistics; Table S2: The number of SNPs between strains; Table S3: Growth of 50 strains in three media; File S1: Two-dimensional Quick Response codes of 50 strains of S. rugosoannulata.
Author Contributions
Conceptualization, W.G., Q.C. and Y.Z. (Yan Zhang); methodology, M.G., Q.C., Y.Z. (Yongchang Zhao), X.W. and L.W.; data curation, writing-original draft preparation, M.G. and W.G.; supervision, W.G. and M.Z. All authors have read and agreed to the published version of the manuscript.
Funding
This research was funded by the National Key R&D Program of China (2023YFE0104900); the Beijing Agriculture Innovation Consortium (BAIC03); and the Fundamental Research Funds for China Agriculture Research System (CARS20).
Data Availability Statement
Data are contained within the article and Supplementary Materials.
Conflicts of Interest
The authors declare no conflicts of interest.
References
- Bian, Y.-B. Edible Mushroom Cultivation, 3rd ed.; Higher Education Press: Beijing, China, 2017; pp. 10–35. [Google Scholar]
- Ben-Hur de Oliveira, J.; Costalonga Pereira, P.R.; Silva dos Santos, V.; Ferreira, J.M.; Vencioneck Dutra, J.C. Chapter 38—Stropharia. In Beneficial Microbes in Agro-Ecology; Amaresan, N., Senthil Kumar, M., Annapurna, K., Kumar, K., Sankaranarayanan, A., Eds.; Academic Press: Cambridge, MA, USA, 2020; pp. 749–755. [Google Scholar]
- Mao, X.L. Distribution and resource evaluation of macrofungi in China. Acta Bot. Boreali-Occident. Sin. 1988, 10, 79–84. [Google Scholar]
- Domondon, D.; Poppe, J. Fruit Optimization with wastes used for outdoor cultivation of king Stropharia. In Science and Cultivation of Edible Fungi, Proceedings of the 15th International Congress on the Science and Cultivation of Edible Fungi, Maastricht, The Netherlands, 15–19 May 2000; A.A. Balkema: Rotterdam, The Netherlands, 2000; pp. 909–918. [Google Scholar]
- Liu, Y.T.; Sun, J.; Luo, Z.Y.; Rao, S.Q.; Su, Y.J.; Xu, R.R.; Yang, Y.J. Chemical composition of five wild edible mush rooms collected from southwest China and their antihyperglycemic and antioxidant activity. Food Chem. Toxicol. 2012, 50, 1238–1244. [Google Scholar] [CrossRef] [PubMed]
- Yan, Q.X.; Huang, M.X.; Sun, P.; Cheng, S.; Zhang, Q.; Dai, H. Steroids, fatty acids and ceramide from the mush room Stropharia rugosoannulata farlow apud murrill. Biochem. Syst. Ecol. 2020, 88, 103963. [Google Scholar] [CrossRef]
- Kodama, N.; Kakuno, T.; Nanba, H. Stimulation of the natural immune system in normal mice by polysaccharide from maitake mushroom. Mycoscience 2003, 44, 257–261. [Google Scholar] [CrossRef]
- Wu, J.; Fushimi, K.; Tokuyama, S.; Ohno, M.; Miwa, T.; Koyama, T.; Yazawa, K.; Nagai, K.; Matsumoto, T.; Hirai, H.; et al. Functional-food constituents in the fruiting bodies of Stropharia rugosoannulata. Biosci. Biotechnol. Biochem. 2011, 75, 1631–1634. [Google Scholar] [CrossRef]
- Wei, L.; Wang, W.; Hou, Y.; Xie, X.; Li, X.; Chen, F.; Wang, Z.; Zhou, Y.; Li, F.; Jing, B. Chemical composition, antibacterial test, and antioxidant activity of essential oils from fresh and dried Stropharia rugosoannulata. J. Chem. 2023, 2023, 6965755. [Google Scholar] [CrossRef]
- Liu, Y.; Hu, C.F.; Feng, X.; Cheng, L.; Ibrahim, S.A.; Wang, C.-T.; Huang, W. Isolation, Characterization and anti oxidant of polysaccharides from Stropharia rugosoannulata. Int. J. Biol. Macromol. 2020, 155, 883–889. [Google Scholar] [CrossRef] [PubMed]
- Chang, J.B.; Park, W.H.; Choi, E.C.; Kim, B.K. Studies on constituents of the higher fungi of Korea (LIV) antitumor components of Favolus Alveolarius. Arch. Pharm. Res. 1988, 11, 203–212. [Google Scholar] [CrossRef]
- Li, X.; Cui, W.; Cui, Y.; Song, X.; Jia, L.; Zhang, J. Stropharia rugoso-annulata acetylated polysaccharides alleviate NAFLD via Nrf2/JNK1/AMPK Signaling pathways. Int. J. Biol. Macromol. 2022, 215, 560–570. [Google Scholar] [CrossRef]
- Stadler, M.; Hellwig, V.; Mayer-Bartschmid, A.; Denzer, D.; Wiese, B.; Burkhardt, N. Novel analgesic triglycerides from cultures of agaricus macrosporus and other basidiomycetes as selective inhibitors of neurolysin. J. Antibiot. 2005, 58, 775–786. [Google Scholar] [CrossRef]
- Zhang, W.; Tian, G.; Geng, X.; Zhao, Y.; Ng, T.B.; Zhao, L.; Wang, H. Isolation and characterization of a novel lectin from the edible mushroom Stropharia rugosoannulata. Molecules 2014, 19, 19880–19891. [Google Scholar] [CrossRef] [PubMed]
- Yang, Y.; Meng, G.; Ni, S.; Zhang, H.; Dong, C. Genomic analysis of Stropharia rugosoannulata reveals its nutritional strategy and application potential in bioremediation. J. Fungi 2022, 8, 162. [Google Scholar] [CrossRef] [PubMed]
- Han, M. The Mycoremediation of Escherichia coli by pleurotus ostreatus, Stropharia rugosoannulata, and trametes versicolor in contaminated water. J. South Carol. Acad. Sci. 2021, 19, 63. [Google Scholar]
- Hussain, M.; Zouhar, M.; Ryšánek, P. Effect of some nematophagous fungi on reproduction of a nematode pest, Heterodera Schachtii, and Growth of sugar beet. Pak. J. Zool. 2017, 49, 197–205. [Google Scholar] [CrossRef]
- Valentín, L.; Oesch-Kuisma, H.; Steffen, K.T.; Kähkönen, M.A.; Hatakka, A.; Tuomela, M. Mycoremediation of wood and soil from an old sawmill area contaminated for decades. J. Hazard. Mater. 2013, 260, 668–675. [Google Scholar] [CrossRef]
- Xiao, K.; Li, Y.; Sun, Y.; Liu, R.; Li, J.; Zhao, Y.; Xu, H. Remediation performance and mechanism of heavy metals by a bottom up activation and extraction system using multiple biochemical materials. ACS Appl. Mater. Interfaces 2017, 9, 30448–30457. [Google Scholar] [CrossRef]
- Weiss, M.; Geyer, R.; Russow, R.; Richnow, H.H.; Kästner, M. Fate and metabolism of [15N]2,4,6-trinitrotoluene in soil. Environ. Toxicol. Chem. 2004, 23, 1852–1860. [Google Scholar] [CrossRef]
- Hao, H.B.; Zhao, J.; Yang, H.; Zhang, J.X.; Wei, Y.H.; Kuai, B.K.; Zhang, J.J.; Chen, H. Comprehensive evaluation of main agronomic characters and nutritional components of different Stropharia rugosoannulata strains. Acta Edulis Fungi 2022, 29, 41–49. [Google Scholar]
- Zhou, Z.G.; He, H.Q.; Jiang, S.J. Genetic diversity of macrofungi germplasm resources. J. Anhui Sci. Technol. 2022, 36, 38–43. [Google Scholar]
- Rostoks, N.; Ramsay, L.; MacKenzie, K.; Cardle, L.; Bhat, P.R.; Roose, M.L.; Svensson, J.T.; Stein, N.; Varshney, R.K.; Marshall, D.F.; et al. Recent history of artificial outcrossing facilitates whole-genome association mapping in elite inbred crop varieties. Proc. Natl. Acad. Sci. USA 2006, 103, 18656–18661. [Google Scholar] [CrossRef]
- Li, S.; Zhao, S.; Hu, C.; Mao, C.; Guo, L.; Yu, H.; Yu, H. Whole genome sequence of an edible mushroom Stropharia rugosoannulata. J. Fungi 2022, 8, 99. [Google Scholar] [CrossRef]
- Wang, Y.; Wu, X.; Li, Y.; Feng, Z.; Mu, Z.; Wang, J.; Wu, X.; Wang, B.; Lu, Z.; Li, G. Identification and validation of a core single-nucleotide polymorphism marker set for genetic diversity assessment, fingerprinting identification, and core collection development in bottle gourd. Front. Plant Sci. 2021, 12, 747940. [Google Scholar] [CrossRef]
- Moon, S.; Ryu, H. Development of HRM markers for discrimination of Pyogo (Lentinula edodes) cultivars sanjo 701 and chamaram. Korean J. Mycol. 2022, 50, 225–233. [Google Scholar]
- Carter, D.; Tran-Dinh, N.; Marra, R.; Vera, R. The development of genetic markers from fungal genome initiatives. Appl. Mycol. Biotechnol. 2004, 4, 1–27. [Google Scholar]
- Kim, K.-H.; Ka, K.-H.; Kang, J.H.; Kim, S.; Lee, J.W.; Jeon, B.-K.; Yun, J.-K.; Park, S.R.; Lee, H.J. Identification of single nucleotide polymorphism markers in the laccase gene of shiitake mushrooms (Lentinula Edodes). Mycobiology 2015, 43, 75–80. [Google Scholar] [CrossRef] [PubMed]
- Gao, W.; Qu, J.; Zhang, J.; Sonnenberg, A.; Chen, Q.; Zhang, Y.; Huang, C. A genetic linkage map of Pleurotus Tuoliensis integrated with physical mapping of the de novo sequenced genome and the mating type loci. BMC Genom. 2018, 19, 18. [Google Scholar] [CrossRef]
- Tian, H.L.; Wang, F.G.; Zhao, J.R.; Yi, H.M.; Wang, L.; Wang, R.; Yang, Y.; Song, W. Development of maizeSNP3072, a high-throughput compatible SNP array, for DNA fingerprinting identification of chinese maize varieties. Mol. Breed. New Strateg. Plant Improv. 2015, 35, 136. [Google Scholar] [CrossRef]
- Wiersma, P.A.; Erogul, D.; Ali, S. DNA fingerprinting of closely related cultivars of sweet cherry. J. Am. Soc. Hortic. Sci. 2018, 143, 282–288. [Google Scholar] [CrossRef]
- Iqbal, M.; Jamil, S.; Shahzad, R.; Bilal, K.; Qaisar, R.; Nisar, A.; Kanwal, S.; Bhatti, M. DNA Fingerprinting of crops and its applications in the field of plant breeding. J. Agric. Res. 2021, 59, 13–28. [Google Scholar]
- Zhang, H.; Lin, P.; Liu, Y.; Huang, C.; Huang, G.; Jiang, H.; Xu, L.; Zhang, M.; Deng, Z.; Zhao, X. Development of SLAF-sequence and multiplex SNaPshot panels for population genetic diversity analysis and construction of DNA fingerprints for sugarcane. Genes 2022, 13, 1477. [Google Scholar] [CrossRef]
- Amend, A.; Garbelotto, M.; Fang, Z.; Keeley, S. Isolation by landscape in populations of a prized edible mushroom tricholoma matsutake. Conserv. Genet. 2010, 11, 795–802. [Google Scholar] [CrossRef]
- Suryadi, H.; Judono, J.J.; Putri, M.R.; Eclessia, A.D.; Ulhaq, J.M.; Agustina, D.N.; Sumiati, T. Biodelignification of lignocellulose using ligninolytic enzymes from white-rot fungi. Heliyon 2022, 8, e08865. [Google Scholar] [CrossRef]
- Biko, O.D.V.; Viljoen-Bloom, M.; van Zyl, W.H. Microbial lignin peroxidases: Applications, production challenges and future perspectives. Enzyme Microb. Technol. 2020, 141, 109669. [Google Scholar] [CrossRef]
- Liu, N.; Jia, H. Fungal laccase: Diverse biological functions and complex natural substrates. J. Agric. Biotechnol. 2020, 28, 333–341. [Google Scholar]
- Ren, P.F.; Ren, H.X.; Qu, L.; Yao, Q.; Li, J.; Gong, Z.Y. Changes of extracellular enzyme activities in Lentinus edodes and their correlation with agronomic traits. Shandong Agric. Sci. 2010, 12, 11–14. [Google Scholar]
- Zhang, W.B.; Li, W.D.; Wang, Z.J.; Wang, S.Q. Study on liquid culture characteristics and extracellular enzyme activity of Hypsizygus marmoreus. Edible Med. Mushrooms 2016, 24, 43–47. [Google Scholar]
- Guo, M.; Ma, X.; Zhou, Y.; Bian, Y.; Liu, G.; Cai, Y.; Huang, T.; Dong, H.; Cai, D.; Wan, X.; et al. Genome sequencing highlights the plant cell wall degrading capacity of edible mushroom Stropharia rugosoannulata. J. Microbiol. 2023, 61, 83–93. [Google Scholar] [CrossRef]
- Pollegioni, L.; Tonin, F.; Rosini, E. Lignin-degrading enzymes. FEBS J. 2015, 282, 1190–1213. [Google Scholar] [CrossRef] [PubMed]
- Forootanfar, H.; Faramarzi, M.A. Insights into laccase producing organisms, fermentation states, purification strategies, and biotechnological applications. Biotechnol. Prog. 2015, 31, 1443–1463. [Google Scholar] [CrossRef]
- Chen, H.Y.; Xue, D.S.; Feng, X.Y.; Yao, S.J. Screening and Production of Ligninolytic Enzyme by a Marine-Derived Fungal Pestalotiopsis Sp. J63. Appl. Biochem. Biotechnol. 2011, 165, 1754–1769. [Google Scholar] [CrossRef] [PubMed]
- Gupta, A.; Jana, A.K. Effects of Wheat Straw Solid Contents in Fermentation Media on Utilization of Soluble/In soluble Nutrient, Fungal Growth and Laccase Production. 3 Biotech 2018, 8, 35. [Google Scholar] [CrossRef]
- Eriksson, K.E.; Blanchette, R.A.; Ander, P. Microbial and Enzymatic Degradation of Wood and Wood Components; Springer: Berlin/Heidelberg, Gemany, 2012; pp. 89–180. [Google Scholar]
- Ander, P.; Eriksson, K. Selective degradation of wood components by white-rot Fungi. Physiol. Plant. 2006, 41, 239–248. [Google Scholar] [CrossRef]
- Huang, X.; Duan, N.; Xu, H.; Xie, T.N.; Xue, Y.-R.; Liu, C.-H. CTAB-PEG DNA Extraction from fungi with high contents of polysaccharides. Mol. Biol. 2018, 52, 718–726. [Google Scholar] [CrossRef]
- McKenna, A.; Hanna, M.; Banks, E.; Sivachenko, A.; Cibulskis, K.; Kernytsky, A.; Garimella, K.; Altshuler, D.; Gabriel, S.; Daly, M.; et al. The genome analysis toolkit: A mapReduce framework for analyzing next-generation DNA sequencing data. Genome Res. 2010, 20, 1297–1303. [Google Scholar] [CrossRef]
- Wang, Y.; Lv, H.; Xiang, X.; Yang, A.; Feng, Q.; Dai, P.; Li, Y.; Jiang, X.; Liu, G.; Zhang, X. Construction of a SNP fingerprinting database and population genetic analysis of cigar tobacco germplasm resources in China. Front. Plant Sci. 2021, 12, 618133. [Google Scholar] [CrossRef]
- Cingolani, P.; Platts, A.; Wang, L.L.; Coon, M.; Nguyen, T.; Wang, L.; Land, S.J.; Lu, X.; Ruden, D.M. A program for annotating and predicting the effects of single nucleotide polymorphisms, SnpEff: SNPs in the genome of drosophila melanogaster strain W1118; Iso-2; Iso-3. Fly 2012, 6, 80–92. [Google Scholar] [CrossRef]
- Minh, B.Q.; Schmidt, H.A.; Chernomor, O.; Schrempf, D.; Woodhams, M.D.; von Haeseler, A.; Lanfear, R. IQ-TREE 2: New models and efficient methods for phylogenetic inference in the genomic era. Mol. Biol. Evol. 2020, 37, 1530–1534. [Google Scholar] [CrossRef]
- Cheng, A.; Chai, H.H.; Ho, W.K.; Bamba, A.S.A.; Feldman, A.; Kendabie, P.; Halim, R.A.; Tanzi, A.; Mayes, S.; Massawe, F. Molecular Marker Technology for Genetic Improvement of Underutilised Crops; Springer International Publishing: Cham, Switzerland, 2017; pp. 47–70. [Google Scholar]
- Schlötterer, C. The evolution of molecular markers—Just a matter of fashion? Nat. Rev. Genet. 2004, 5, 63–69. [Google Scholar] [CrossRef] [PubMed]
- Trick, M.; Long, Y.; Meng, J.; Bancroft, I. Single nucleotide polymorphism (SNP) discovery in the polyploid bras sica napus using solexa transcriptome sequencing. Plant Biotechnol. J. 2009, 7, 334–346. [Google Scholar] [CrossRef] [PubMed]
- Tang, W.; Wu, T.; Ye, J.; Sun, J.; Jiang, Y.; Yu, J.; Tang, J.; Chen, G.; Wang, C.; Wan, J. Erratum to: SNP-based analysis of genetic diversity reveals important alleles associated with seed size in rice. BMC Plant Biol. 2016, 16, 128. [Google Scholar] [CrossRef] [PubMed]
- An, H.; Lee, H.-Y.; Shim, D.; Choi, S.H.; Cho, H.; Hyun, T.K.; Jo, I.-H.; Chung, J.-W. Development of CAPS markers for evaluation of genetic diversity and population structure in the germplasm of button mushroom (Agaricus bisporus). J. Fungi 2021, 7, 375. [Google Scholar] [CrossRef] [PubMed]
- Gao, W.; Weijn, A.; Baars, J.J.P.; Mes, J.J.; Visser, R.G.F.; Sonnenberg, A.S.M. Quantitative trait locus mapping for bruising sensitivity and cap color of Agaricus bisporus (Button mushrooms). Fungal Genet. Biol. 2015, 77, 69–81. [Google Scholar] [CrossRef]
- Wang, H.-F.; Zong, X.-X.; Guan, J.-P.; Yang, T.; Sun, X.-L.; Ma, Y.; Redden, R. Genetic diversity and relationship of global faba bean (Vicia Faba L.) germplasm revealed by ISSR markers. Theor. Appl. Genet. 2012, 124, 789–797. [Google Scholar] [CrossRef] [PubMed]
- Weeds, P.L.; Chakraborty, S.; Fernandes, C.D.; Charchar, M.J.d.; Ramesh, C.R.; Kexian, Y.; Kelemu, S. Genetic diversity in Colletotrichum gloeosporioides from Stylosanthes spp. at centers of origin and utilization. Phytopathology 2003, 93, 176–185. [Google Scholar] [CrossRef] [PubMed][Green Version]
- Chen, L.; Cao, Y.; Li, G.; Tian, Y.; Zeng, T.; Gu, T.; Xu, W.; Konoval, O.; Lu, L. Population structure and selection signatures of domestication in geese. Biology 2023, 12, 532. [Google Scholar] [CrossRef]
- Rabieyan, E.; Darvishzadeh, R.; Mohammadi, R.; Gul, A.; Rasheed, A.; Akhar, F.K.; Abdi, H.; Alipour, H. Genetic diversity, linkage disequilibrium, and population structure of tetraploid wheat landraces originating from Europe and Asia. BMC Genom. 2023, 24, 682. [Google Scholar] [CrossRef]
- Wang, B.; Tan, H.-W.; Fang, W.; Meinhardt, L.W.; Mischke, S.; Matsumoto, T.; Zhang, D. Developing single nu cleotide polymorphism (SNP) markers from transcriptome sequences for identification of Longan (Dimocarpus longan) Germplasm. Hortic. Res. 2015, 2, 14065. [Google Scholar] [CrossRef]
- Korir, N.K.; Han, J.; Shangguan, L.; Wang, C.; Kayesh, E.; Zhang, Y.; Fang, J. Plant variety and cultivar identifica tion: Advances and prospects. Crit. Rev. Biotechnol. 2013, 33, 111–125. [Google Scholar] [CrossRef]
- Bilaĭ, V.I.; Strizhevskaia, A.I. Mycelial growth and the rate of xylan, xylose and glucose consumption by strains of different species of fungi. Mikrobiol. Zh. 1977, 39, 307–310. [Google Scholar]
- Clark, T.A.; Anderson, J.B. Dikaryons of the basidiomycete fungus schizophyllum commune: Evolution in long-term culture. Genetics 2004, 167, 1663–1675. [Google Scholar] [CrossRef][Green Version]


Disclaimer/Publisher’s Note: The statements, opinions and data contained in all publications are solely those of the individual author(s) and contributor(s) and not of MDPI and/or the editor(s). MDPI and/or the editor(s) disclaim responsibility for any injury to people or property resulting from any ideas, methods, instructions or products referred to in the content. |
© 2024 by the authors. Licensee MDPI, Basel, Switzerland. This article is an open access article distributed under the terms and conditions of the Creative Commons Attribution (CC BY) license (https://creativecommons.org/licenses/by/4.0/).