Abstract
This study analyzed the leaf spectral properties and photosynthesis rates of greenhouse-grown bell pepper leaves according to the growth period and leaf position to investigate the changes in carbon assimilation function according to leaf aging. Photosynthesis, growth, transpiration, stomatal conductance, light transmittance, and light reflectance were measured. As the plants’ growth progressed, the number of leaves, fresh weight, and dry weight increased, but the specific leaf area decreased, likely due to the increased distribution of assimilates to reproductive organs. The average photosynthesis rate, according to the measured dates, exhibited a high value despite a large standard error, which was likely influenced by measurement errors caused by external environmental factors. The reflectance and transmittance increased from the upper to the middle and bottom leaves, and the absorption ratio decreased in the same order. The green light spectrum (500–580 nm) had a lower absorption ratio than other spectra because the green coloration of the leaves increased the light reflectance of this spectrum. As the PPFD increased where the leaf was positioned higher, the photosynthesis rate, transpiration amount, and stomatal conductance also increased. The higher the leaf position, the higher the photosynthesis rate, the amount of transpiration, and the stomatal conductance. As the CO2 concentration increased, the photosynthesis rate increased, but the transpiration and stomatal conductance changed little, indicating that the gas exchange within leaves was hardly affected by CO2, but the light levels promoted photosynthesis. From the results of this study, the optical properties of the leaves indicate that they are consistent with Lambert–Beer’s law, which implies that the length of the optical path is linearly proportional to the number of molecules in the absorption layer. We obtained the light saturation point and CO2 saturation point of bell peppers grown in a greenhouse and were able to determine the physiological changes in the leaves with increasing leaf age. Therefore, based on this information, it appears that a leaf removal model based on the productivity of bell pepper leaves could be developed.
1. Introduction
Bell pepper (Capsicum annuum L.) is a major protected horticulture crop. It is a culinary vegetable that can be produced year-round and is very familiar to Korean consumers who are dieting. It currently has a positive image among them due to its high levels of vitamin C, antioxidants, and moisture content [1].
The morphology and assimilation rate of plant leaves are modulated by the effects of light [2,3]. Of the light irradiated onto the leaves, some passes through and some is reflected, but the remainder is absorbed by the leaves [4]. The light absorbance of a leaf is affected by many characteristics, such as its cellular structure, color, and epidermal properties [5,6,7]. Additionally, in erect plants, the amount of light absorbed decreases due to self-shading and light attenuation depending on the leaf’s position. Leaf absorbance is an important aspect of the physiological analysis of plants, as the chlorophyll content is measured by the amount of visible green light reflected by the leaves using either a portable chlorophyll meter or a device that directly measures the reflectance due to the wavelength [8].
Photosynthesis, which mostly occurs in plant leaves, is the process of producing glucose and oxygen required for plant growth and maintenance [9]. The CO2 concentration is the decisive factor affecting the rate of supply of raw materials for photosynthesis and is often used when analyzing the photosynthesis rate using physiological models (FvCB) [10]. As the photosynthetic rate changes depending on the state of the leaves and the environment, the saturation points of photosynthesis for the light intensity and CO2 can be obtained by regression analysis [11]. Exponential equations can be used to calculate the photosynthetic rate, transpiration, and stomatal conductance. In particular, the stomatal conductance can affect the CO2 supply and photosynthetic rate, respectively [12].
Leaf senescence is the stage following initial growth and maturation, in which the photosynthetic function and contribution within the plant decline, glucose production decreases, and respiration increases, resulting in greater substrate consumption [13]. Within a plant, the senescence of the lower leaves results in a decrease in photosynthetic function, but it also signals the plant to redistribute nutrients, such as nitrogen, phosphate, and potassium, to areas with high nutrient demands, such as new leaf emergence, flowering, and cell division, at the growing point when needed [14,15]. The remobilization rate of nitrogen ranges from 40% to 90% depending on the plant species, and the remobilization rates of other nutrients also vary by plant type. This indicates that plants strive to use nutrients efficiently even under adverse conditions [16]. Bell peppers can be divided into those with juvenile leaves and those with senescent leaves, depending on their development stage. In senescence, the photosynthetic rate decreases and respiration increases, resulting in an overall decline in photosynthetic efficiency. For bell peppers in a commercial greenhouse, senescent leaves are regularly removed to increase the photosynthetic rate of the plant as a whole [17,18]. In Korea, after the fruits have finished enlarging, the leaves are removed in order to improve the photosynthetic efficiency and enhance the coloration of the fruit skin.
Since bell peppers are an indeterminate plant, their assimilation ability differs depending on the leaf development stage. This involves various factors, such as lower chlorophyll levels due to senescence, changes in the CO2 assimilation capacity of the mesophyll, changes in leaf thickness, and decreased light absorbance. However, there is a lack of data analyzing the effects of decreased light absorbance in bell pepper leaves at different locations on photosynthesis, transpiration, and stomatal conductance. It is necessary to draw and compare two saturation curves to identify the appropriate equation for a given crop and to determine the saturation point from this equation. In this study, we measured the photosynthesis rates in bell pepper leaves at different locations. To investigate the effects of senescence on bell pepper leaves, we also measured photosynthesis at different time points, as well as the optical properties, photosynthesis, transpiration, and stomatal conductance of leaves at different locations, and constructed a regression model.
2. Materials and Methods
2.1. Selection of Locations for Measurement and Growth Surveys
This experiment was conducted on bell peppers grown in a glass greenhouse in Naju-si, Jeollanam-do, Korea. The Machai variety (C. annuum L. cv. Machai, Syngenta, Basel, Switzerland) was used in the experiment, and it was sown in rockwool slabs and grown for about 50 days before being transplanted into coco-peat slab. The temperature in the greenhouse was controlled between 18 °C and 30 °C, and the relative humidity was maintained between 50% and 90%. Nutrient solution was supplied using a drip irrigation system based on external solar radiation. To analyze changes in photosynthesis at different times, measurements were taken from the uppermost leaves on three occasions between July and December 2021, and the total number of leaves, fresh leaf weight, dry leaf weight, leaf area, and specific leaf area (SLA) of the crop were investigated. To investigate the assimilation rate for leaves at different positions, we divided the leaves into upper, middle, and lower leaves and took measurements from each. The upper leaves were those from the node below the flower; the lower leaves were the lowermost leaves of the plant; the middle leaves were those between the upper and lower leaves. Measurements were taken in August 2021 at 20, 48, and 79 days after leaf emergence. To investigate the optical properties and photosynthesis of leaves, measurements were taken from the leaf body, avoiding the midrib.
2.2. Optical Properties of Leaves
The reflectance (%; the amount of incident light reflected from the specimen) and the transmittance (%; the amount of incident light passing through the specimen) were measured at different wavelengths using a leaf spectrometer (CI-710, CID Bio-Science, Camas, WA, USA), and the absorptance (%, Equation (1)) was calculated as the amount of light emitted by the device minus the reflectance and the transmittance. The optical properties were analyzed for leaves at each location.
2.3. Leaf Photosynthesis
Photosynthesis was measured in single bell pepper leaves using a portable photosynthesis system (Li-6800, Li-Cor Inc., Lincoln, NE, USA), and this measurement was conducted one hour after sunrise on 26th July, 14th August, and 14th December. The environment in the measurement chamber was as follows: airflow 600 μmol·s−1, leaf temperature 25 °C, relative humidity 55%, CO2 400 μmol·mol−1, photosynthetically active radiation (PAR) 1500 μmol·m−2·s−1. The PAR and CO2 were adjusted depending on the type of measurement. When measuring the photosynthetic light response curve, the light quantity was reduced from 2000 to 0 μmol·m−2·s−1. To measure the photosynthetic CO2 response curve, the CO2 concentration began at the atmospheric concentration of 400 μmol·mol−1 and was gradually decreased until the CO2 compensation point, after which measurements were taken again from 400 μmol·mol−1 to the CO2 saturation point of 1500 μmol·mol−1. The photosynthetic rate, transpiration, and stomatal conductance were measured five times for each leaf and compared depending on the leaf position.
Photosynthetic curves (Equation (2)) were plotted using the net CO2 assimilation rate (A, µmol·m−2·s−1), the initial slope of the line when increasing from 50 µmol·mol−1 to 100 µmol·mol−1 (ϕ), the CO2 concentration (I, µmol·mol−1), the maximum gross CO2 assimilation rate (Amax, µmol·m−2·s−1), and the respiration rate (R, µmol·m−2·s−1) [19,20]. When plotting the photosynthetic light response curve, Equation (2) was also used, and, here, ϕ was the initial light use efficiency when the PPFD increased from 0 µmol·m−2·s−1 to 100 µmol·m−2·s−1 and I was the photosynthetic photon flux. Photosynthesis was measured for each leaf position, and the photosynthetic rate, transpiration, and stomatal conductance of bell pepper were compared depending on the time of leaf emergence [12]. In this curve, at <100 μmol·m−2·s−1, the Kok effect is negligible, so the saturation point is given by the intersection of the regression line and Amax, representing the maximum photosynthetic rate [21,22,23]:
Based on the photosynthetic curves, the following equation was used to calculate the light and CO2 saturation points. The modified non-rectangular equation (Equation (3)) used the initial slope of the line when increasing from 50 µmol·mol−1 to 100 µmol·mol−1 (), the CO2 concentration (, µmol·m−2·s−1), the maximum gross CO2 assimilation rate (, µmol·m−2·s−1), the curvature of the photosynthetic curve (), and the respiration rate (, µmol·m−2·s−1) [11]. In this curve, the point where the properties of the photosynthesis curve change is identified as the saturation point. In addition, when plotting the photosynthetic light response curve through Equation (3), I was the photosynthetic photon flux and ϕ was the initial light use efficiency when the PPFD increased from 0 µmol·m−2·s−1 to 100 µmol·m−2·s−1.
2.4. Data Collection and Statistical Analysis
Statistical analyses (including t-tests) of plant growth were performed using the R software (V. 4.2.3, R Foundation, Auckland, New Zealand). Photosynthesis and optical property measurements were subjected to regression analysis and graphs were plotted using Sigmaplot 14.5 (SYSTAT, San Jose, CA, USA).
3. Results
3.1. Analysis of Bell Pepper Leaf Photosynthesis by Time Point
Comparing the growth survey results of the two sets of experimental crops, the number of leaves and fresh weight approximately doubled and the dry weight of the leaves tripled from 14 August to 14 December 2021 (Table 1). Due to the removal of senescent leaves to regulate respiration, the leaf area did not increase as significantly as compared to other factors, and the specific leaf area (SLA), which was used to measure the leaf efficiency, decreased from 397 to 202 cm2·g−1.

Table 1.
Comparison of bell pepper growth by time point.
The photosynthetic rate of the bell pepper leaves differed considerably between the time points (Figure 1, Table 2). The maximum photosynthetic rates by date were 33.9 μmol·m−2·s−1 on 26 July 2021, 27.5 μmol·m−2·s−1 on 14 August 2021, and 29.3 μmol·m−2·s−1 on 14 December 2021.
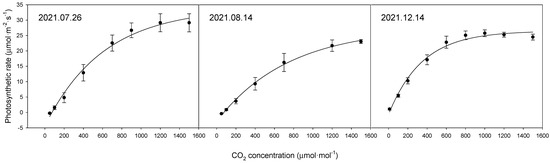
Figure 1.
Comparison of photosynthetic rates of upper leaves of bell pepper plants at different time points according to CO2 concentration.
Table 2.
Changes in bell pepper photosynthesis rates and Amax by measurement period.
3.2. Analysis of Optical Properties at Different Leaf Positions
Light absorption by leaves is an important factor in photosynthesis. Leaves undergo emergence, cell division, and expansion and have the greatest photosynthetic ability when they are fully developed. However, the photosynthetic ability decreases with senescence and reduced light absorption. Both the reflectance and transmittance increased at approximately 550 nm (Figure 2), meaning that light in this band was reflected the most, which can be explained by the green color of the leaves. The top leaves show the highest photosynthetic activity due to the lowest reflectance (5.29 ± 0.04%) and transmittance (5.61 ± 0.07%). The middle leaves exhibit intermediate levels with reflectance (7.79 ± 0.05%) and transmittance (6.22 ± 0.15%). The bottom leaves, due to aging, have the highest reflectance (9.26 ± 0.08%) and transmittance (8.37 ± 0.26%), resulting in lower photosynthetic efficiency. Table 3 shows the reflectance, transmittance, and absorptance of each wavelength band. The upper leaves had high absorptance levels of approximately 90% at 400–500 nm and 600–700 nm and 86% at 500–600 nm. The absorptance decreased from the upper (89.10 ± 0.02%) to the middle (86.00 ± 0.05%) to the lower leaves (82.37 ± 0.09%); the leaf age and light absorptance were inversely proportional.
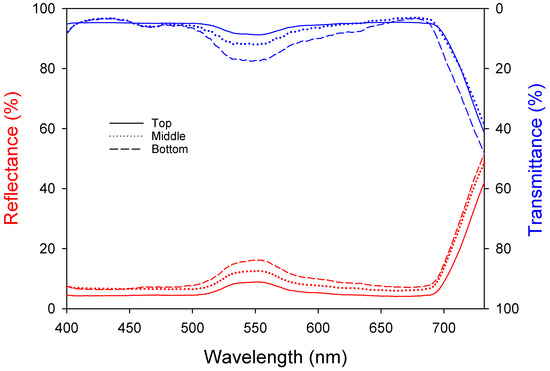
Figure 2.
Changes in bell pepper leaf reflectance and transmittance according to leaf position.
Table 3.
Leaf reflectance, transmittance, and absorptance of different wavelengths according to leaf position.
3.3. Analysis of Photosynthesis by Leaf Position
We analyzed the photosynthesis, transpiration, and stomatal conductance in bell pepper leaves at different positions. In low-light conditions, the photosynthetic rate showed a flatter slope at lower leaf positions. In strong-light conditions, the photosynthetic rate was 19.1, 9.7, and 5.4 μmol·m−2·s−1 for the upper, middle, and lower leaves, respectively (Figure 3, Table 4). The transpiration rate and stomatal conductance also followed a similar trend, with the upper leaves showing the highest rates, followed by the middle leaves, and the lowest rates observed in the bottom leaves. At lower leaf positions, the chlorophyll content decreased, and the leaves became thicker due to senescence. This led to lower carbon fixation and light absorbance, slowing the photosynthetic rate. Transpiration and stomatal conductance increased with increasing light. There were no differences in transpiration or stomatal conductance between the different leaf positions in low light, but, under stronger light conditions, the upper leaves showed a significant difference. Higher transpiration and stomatal conductance indicated more efficient gas exchange. The lack of response from the middle and lower leaves to changes in the light quantity appeared to be because these leaves were shaded by the upper leaves or other crops, meaning that they did not adapt to the strong light. Furthermore, as the chlorophyll content and light absorbance were low due to leaf senescence, the strong light quantity of 2000 μmol·m−2·s−1 acted as a stressor.
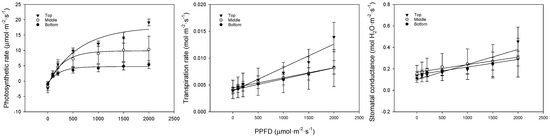
Figure 3.
Comparison of bell pepper leaf photosynthetic rate, transpiration rate, and stomatal conductance according to leaf position and PPFD.
Table 4.
Model of bell pepper leaf photosynthetic rate, transpiration rate, and stomatal conductance according to leaf position and PPFD.
The photosynthesis curves, regression equations, and coefficients of determination for CO2 at each leaf position are shown in Figure 4 and Table 5. When CO2 was restricted, the photosynthetic rate showed a flatter slope with lower leaf positions, indicating that the differences grew larger with increasing concentrations. The photosynthetic rate was 23.0, 19.1, and 9.3 μmol CO2·m−2·s−1 for the upper, middle, and lower leaves, respectively. The transpiration and stomatal conductance showed similar trends, with the upper leaves exhibiting higher rates compared to the middle and lower leaves, likely due to better adaptation to higher light conditions. The middle and lower leaves showed a weaker response to increasing CO2, suggesting that these leaves were more shaded and less efficient in gas exchange.
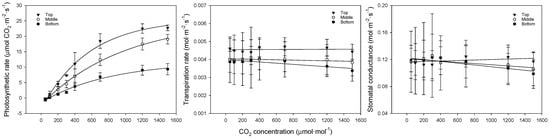
Figure 4.
Comparison of bell pepper leaf photosynthetic rate, transpiration rate, and stomatal conductance according to leaf position and CO2 concentration.
Table 5.
Model of bell pepper leaf photosynthetic rate, transpiration rate, and stomatal conductance according to leaf position and CO2 concentration.
Using the photosynthesis curves above, we compared the bell pepper saturation point (Figure 5), and, using these two equations, we obtained the light and CO2 saturation points (Table 6). The dots in this figure represent measured values corresponding to changes in PPFD and CO2 concentration. The light saturation point was 438 μmol·m−2·s−1 according to the asymptotic exponential equation but 690 μmol·m−2·s−1 according to the modified non-rectangular hyperbola equation.
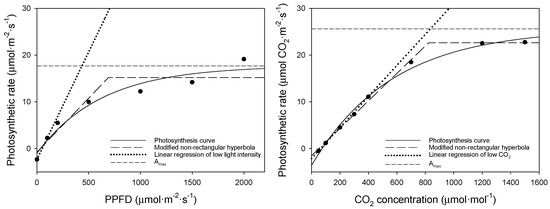
Figure 5.
Comparison of saturation curves for the upper leaves of bell pepper (left: A–Qin curve; right: A–Ci curve).
Table 6.
Analysis of the saturation points of the uppermost bell pepper leaves.
4. Discussion
Bell peppers, being indeterminate upright plants, have their yields closely linked to the management of photosynthesizing leaves. The survey conducted in August corresponded to the early growth stage, with vegetative growth in progress and low fruit stress. In the December survey, alongside fruit-bearing plants, there were plants from which fruit had been harvested. Consequently, assimilates were primarily directed towards the fruit, leading to a slowdown in leaf growth [24,25]. To qualify these findings, we investigated the leaf photosynthesis and light absorption ratio based on the position [24,25].
When comparing the photosynthetic rates by date, differences were observed in the maximum photosynthetic rates depending on the measurement date. The maximum photosynthetic rates (Amax) were 33.9 μmol·m−2·s−1 on 26 July, 27.5 μmol·m−2·s−1 on 14 August, and 29.3 μmol·m−2·s−1 on 14 December. However, considering the nature of photosynthetic measurements, which are strongly influenced by external environmental factors, such variations are expected. Nonetheless, the observed photosynthetic rates seem adequate when compared to previous studies [26,27].
The light absorptance of different wavelengths by bell pepper leaves showed that the upper leaves had higher absorptance levels (approximately 90%) compared to the middle and bottom leaves, similar to previous research [28]. Specifically, the absorptance for the upper leaves was 90.74% (400–500 nm) and 90.34% (600–700 nm), while the bottom leaves had absorptance levels of 88.09% (400–500 nm) and 85.11% (600–700 nm). The decrease in the specific leaf area (SLA) with increasing leaf age is a major symptom of senescence [29], resulting in thicker leaves and increased reflectance and transmittance, aligning with Lambert–Beer’s law [30]. In pepper plants, green light increases the leaf area, while red light is associated with photosynthetic efficiency and phytochrome activity. Therefore, a reduction in light absorption by the leaves due to red light may negatively affect crop growth [31,32].
Photosynthesis peaks after emergence, when the leaf is fully open, before gradually declining over time [33]. As the internal structure and nutritional state of the leaves change with age, it is essential to measure the leaves at the same position relative to the growth stage to investigate changes in photosynthesis. Our results align with a previous study suggesting that, for plants like bell peppers and tomatoes, which cycle between vegetative and reproductive growth, measurements to evaluate growth should be taken from fully open leaves [34].
Given that bell pepper is a photophilic crop requiring substantial light and daily light integrals (DLI), the equation proposed by Park [11] is suitable for the analysis of the light saturation point. The CO2 saturation point was 833 and 828 μmol·mol−1 for the asymptotic exponential and the modified non-rectangular hyperbola equation, respectively. The CO2 saturation point of approximately 800 μmol·mol−1 did not significantly differ depending on the equation used. It is easier to apply the modified non-rectangular hyperbola equation using the inflection point than to find the carbon dioxide saturation point by determining the asymptote for bell pepper.
5. Conclusions
The photosynthetic assimilates produced in the leaves are sent to the organs and used as materials for growth. However, some remain, which accumulate within the leaf over time, making it thicker. In this study, to investigate the effects of changes in the physical properties of leaves on photosynthesis, we investigated how light absorbance, a major factor in photosynthesis, changed with leaf aging; we also analyzed the relationship with photosynthesis. The absorptance was higher closer to the growing point, which is consistent with Lambert–Beer’s law, indicating the length of the light path is linearly proportional to the number of molecules in the absorbing layer. When photosynthesis was measured in the upper leaves, there were differences between time points, but, given that photosynthesis measurements are strongly affected by the external environment, compared to previous studies, the bell peppers in this study showed a good rate of photosynthesis. When measuring photosynthesis by leaf position, the lower leaves showed lower photosynthesis rates. Meanwhile, transpiration and stomatal conductance showed different patterns depending on the measured variables, such as the light quantity and CO2. Our results demonstrate that an increased leaf age causes morphological changes, such as an increased thickness, and changes in the photosynthetic rate. This suggests that a defoliation model could be developed based on the productivity of bell pepper leaves. For the bell pepper plants cultivated in a greenhouse in this study, using the effective modified non-rectangular hyperbola equation, the light saturation point was 690 μmol·m−2·s−1 and the CO2 saturation point was 800 μmol·mol−1. Our findings indicate that as the leaves age, they undergo morphological changes such as an increased thickness and decreased photosynthetic efficiency. Parameters such as the light absorptance and photosynthesis rates measured in this study can help to determine the optimal timing for leaf removal. This approach provides a more scientific basis for leaf removal compared to the empirical methods currently in use. Further research and practical trials could help to refine these recommendations and support growers in implementing these strategies effectively.
Author Contributions
Conceptualization, H.G. and K.S.P.; methodology, H.G. and K.S.P.; software, H.G.; validation, H.G., K.S.P. and Y.R.; formal analysis, H.G., Y.R., J.L. and K.S.P.; investigation, H.G.; resources, K.S.P.; data curation, H.G.; writing—original draft preparation, H.G. and K.S.P.; writing—review and editing, H.G., J.L. and K.S.P.; visualization, H.G. and K.S.P.; supervision, Y.R. and K.S.P.; project administration, K.S.P.; funding acquisition, K.S.P. All authors have read and agreed to the published version of the manuscript.
Funding
This research was funded by KoSFarm, Institute of Planning and Evaluation for Technology in Food, Agriculture and Forestry in Korea (grant number: 421004-04, 421003-04).
Data Availability Statement
The data presented in this study are available in the article.
Acknowledgments
We would like to express our thanks to the anonymous reviewers for their useful comments.
Conflicts of Interest
The authors declare no conflicts of interest.
References
- Jang, H.S.; Lee, J.S.; Bang, J.W.; Lee, J.H. Preference and loyalty evaluation using sentiment analysis for promotion and consumption expansion of paprika. J. Bio-Environ. Control. 2022, 31, 343–355. [Google Scholar] [CrossRef]
- Bar, M.; Ori, N. Leaf development and morphogenesis. Development 2014, 141, 4219–4230. [Google Scholar] [CrossRef] [PubMed]
- Wit, M.D.; Galvão, V.C.; Fankhauser, C. Light-mediated hormonal regulation of plant growth and development. Annu. Rev. Plant Biol. 2016, 67, 513–537. [Google Scholar] [CrossRef] [PubMed]
- Volterrani, M.; Minelli, A.; Gaetani, M.; Grossi, N.; Magni, S.; Caturegli, L. Reflectance, absorbance and transmittance spectra of bermudagrass and manilagrass turfgrass canopies. PLoS ONE 2017, 12, e0188080. [Google Scholar] [CrossRef] [PubMed]
- Gates, D.M.; Keegan, H.J.; Schleter, J.C.; Weidner, V.R. Spectral properties of plants. Appl. Opt. 1965, 4, 11. [Google Scholar] [CrossRef]
- Gausman, H.W. Reflectance of leaf components. Remote Sens. Environ. 1977, 6, 1. [Google Scholar] [CrossRef]
- Agati, G.; Foschi, L.; Grossi, N.; Guglielminetti, L.; Cerovic, Z.G.; Volterrani, M. Fluorescence-based versus reflectance proximal sensing of nitrogen content in Paspalum vaginatum and Zoysia matrella turfgrasses. Eur. J. Agron. 2013, 45, 39–51. [Google Scholar] [CrossRef]
- Murdock, L.; Call, D.; James, J. Comparison and Use of Chlorophyll Meters on Wheat (Reflectance vs. Transmittance/Absorbance). Cooperative Extension Service, AGR-181; University of Kentucky—College of Agriculture: Frankfort, KY, USA, 2004. [Google Scholar]
- Oswald, W.J.; Golueke, C.G. Biological transformation of solar energy. In Advances in Applied Microbiology, 1st ed.; Elsevier: New York, NY, USA; London, UK, 1960; Volume 2, pp. 223–262. [Google Scholar] [CrossRef]
- Farquhar, G.D.; von Caemmerer, S.V.; Berry, J.A. A biochemical model of photosynthetic CO2 assimilation in leaves of C3 species. Planta 1980, 149, 78–90. [Google Scholar] [CrossRef]
- Park, K.S.; Kim, S.K.; Cho, Y.-Y.; Cha, M.K.; Jung, D.H.; Son, J.E. A coupled model of photosynthesis and stomatal conductance for the ice plant (Mesembryanthemum crystallinum L.), a facultative CAM plant. Hortic. Environ. Biotechnol. 2016, 57, 259–265. [Google Scholar] [CrossRef]
- Kim, S.H.; Lieth, J.H. A coupled model of photosynthesis, stomatal conductance and transpiration for a rose leaf (Rosa hybrida L.). Ann. Bot. 2003, 91, 771–781. [Google Scholar] [CrossRef][Green Version]
- Caswell, H.; Salguero-Gómez, R. Age, stage and senescence in plants. J. Ecol. 2013, 101, 585–595. [Google Scholar] [CrossRef] [PubMed]
- Quirino, B.F.; Noh, Y.-S.; Himelblau, E.; Amasino, R.M. Molecular aspects of leaf senescence. Trends Plant Sci. 2000, 5, 278–282. [Google Scholar] [CrossRef]
- Diaz, C.; Lemaître, T.; Christ, A.; Azzopardi, M.; Kato, Y.; Sato, F.; Morot-Gaudry, J.-F.; Le Dily, F.; Masclaux-Daubresse, C. Nitrogen recycling and remobilization are differentially controlled by leaf senescence and development stage in Arabidopsis under low nitrogen nutrition. Plant Physiol. 2008, 147, 1437–1449. [Google Scholar] [CrossRef] [PubMed]
- Maillard, A.; Diquelou, S.; Billard, V.; Laîné, P.; Garnica, M.; Prudent, M.; Garcia-Mina, J.-M.; Yvin, J.-C.; Ourry, A. Leaf mineral nutrient remobilization during leaf senescence and modulation by nutrient deficiency. Front. Plant Sci. 2015, 6, 317. [Google Scholar] [CrossRef]
- Imai, K.; Murata, Y. Changes in apparent photosynthesis, CO2 compensation point and dark respiration of leaves of some Poaceae and Cyperaceae species with senescence. Plant Cell Physiol. 1979, 20, 1653–1658. [Google Scholar] [CrossRef]
- Kim, S.E.; Kim, Y.S. Optimum management of tomato side stems pruning in summer cultivation. Protect Hortic. Plant Fact. 2014, 23, 167–173. [Google Scholar] [CrossRef]
- Kume, A.; Ino, Y. Comparison of ecophysiological responses to heavy snow in two varieties of Aucuba japonica with different areas of distribution. Ecol. Res. 1993, 8, 111–121. [Google Scholar] [CrossRef]
- Kim, P.G.; Lee, E.J. Ecophysiology of photosynthesis 1: Effects of light intensity and intercellular CO2 pressure on photosynthesis. Kor. J. Agric. For. Meteorol. 2001, 3, 126–133. [Google Scholar]
- Kok, B. A critical consideration of the quantum yield of Chlorella photosynthesis. Enzymologia 1948, 13, 1. [Google Scholar]
- Sharp, R.E.; Matthews, M.A.; Boyer, J.S. Kok effect and the quantum yield of photosynthesis: Light partially inhibits dark respiration. Plant Physiol. 1984, 75, 95–101. [Google Scholar] [CrossRef]
- Tcherkez, G.; Gauthier, P.; Buckley, T.N.; Busch, F.A.; Barbour, M.M.; Bruhn, D.; Heskel, M.A.; Gong, X.Y.; Crous, K.; Griffin, K.L.; et al. Tracking the origins of the Kok effect, 70 years after its discovery. New Phytol. 2017, 214, 506–510. [Google Scholar] [CrossRef] [PubMed]
- Nam, H.H.; Woo, J.H.; Lee, H.S.; Kim, K.U. Seasonal changes of dry matter productivity and photosynthesis in Gerbera hybrida. Int. J. Hortic. Sci. Technol. 2009, 27, 205–210. [Google Scholar]
- Jeong, W.J.; Lee, J.H.; Kim, H.C.; Bae, J.H. Dry matter production, distribution and yield of sweet pepper grown under glasshouse and plastic greenhouse in Korea. J. Bio-Environ. Control. 2009, 18, 258–265. [Google Scholar]
- Kim, E.J.; Park, K.S.; Goo, H.W.; Park, G.E.; Myung, D.J.; Jeon, Y.H.; Na, H. Effect of cooling in a semi-closed greenhouse at high temperature on the growth and photosynthesis characteristics in paprika. J. Bio-Environ. Control. 2021, 30, 335–341. [Google Scholar] [CrossRef]
- Nomura, K.; Saito, M.; Tada, I.; Iwao, T.; Yamazaki, T.; Kira, N.; Nishimura, Y.; Mori, M.; Baeza, E.; Kitano, M. Estimation of photosynthesis loss due to greenhouse superstructures and shade nets: A case study with paprika and tomato canopies. HortScience 2022, 57, 464–471. [Google Scholar] [CrossRef]
- Xiao, X. Light absorption by leaf chlorophyll and maximum light use efficiency. IEEE Trans. Geosci. Remote Sens. 2006, 44, 1933–1935. [Google Scholar] [CrossRef]
- Kramer, P.J. Carbon dioxide concentration, photosynthesis, and dry matter production. Bioscience 1981, 31, 29–33. [Google Scholar] [CrossRef]
- Buijs, K.; Maurice, M.J. Some considerations on apparent deviations from lambert-beer’s law. Anal. Chim. Acta 1969, 47, 469–474. [Google Scholar] [CrossRef]
- Klein, S.; Fiebig, A.; Noga, G.; Hunsche, M. Influence of light quality on leaf physiology of sweet pepper plants grown under drought. Theor. Exp. Plant Physiol. 2018, 30, 287–296. [Google Scholar] [CrossRef]
- Claypool, N.; Lieth, J. Modeling morphological adaptations of bell pepper (Capsicum annuum) to light spectra. Sci. Hortic. 2021, 285, 110135. [Google Scholar] [CrossRef]
- Buchanan-Wollaston, V. The molecular biology of leaf senescence. J. Exp. Bot. 1997, 48, 181–199. [Google Scholar] [CrossRef]
- Kim, S.E.; Lee, M.Y.; Kim, Y.S. Characterization of photosynthetic rates by tomato leaf position. Int. J. Hortic. Sci. Technol. 2013, 31, 146–152. [Google Scholar] [CrossRef][Green Version]


Disclaimer/Publisher’s Note: The statements, opinions and data contained in all publications are solely those of the individual author(s) and contributor(s) and not of MDPI and/or the editor(s). MDPI and/or the editor(s) disclaim responsibility for any injury to people or property resulting from any ideas, methods, instructions or products referred to in the content. |
© 2024 by the authors. Licensee MDPI, Basel, Switzerland. This article is an open access article distributed under the terms and conditions of the Creative Commons Attribution (CC BY) license (https://creativecommons.org/licenses/by/4.0/).