Article

Non-Structural Carbohydrate Content and C:N:P Stoichiometry in Houpoea officinalis Flowers in Response to Development Stages

1
Department of Forestry, Faculty of Forestry, Sichuan Agricultural University, Chengdu 611130, China
2
School of Life Science and Engineering, Southwest Jiaotong University, Chengdu 611756, China
3
National Forestry and Grassland Administration Key Laboratory of Forest Resources Conservation and Ecological Safety on the Upper Reaches of the Yangtze River, Sichuan Agricultural University, Chengdu 611130, China
4
Sichuan Academy of Forestry, Chengdu 610081, China
*
Authors to whom correspondence should be addressed.
Horticulturae 2024, 10(8), 784; https://doi.org/10.3390/horticulturae10080784
Submission received: 6 June 2024 / Revised: 13 July 2024 / Accepted: 21 July 2024 / Published: 25 July 2024
(This article belongs to the Special Issue The Role of Plant Growth Regulators in Ornamental Plants)

Abstract

:
Mineral elements and non-structural carbohydrates (NSCs) are important nutrients and energy sources for flower development in plants. However, no studies were reported on the dynamic changes of nutrient stoichiometry and NSC contents in Houpoea officinalis (H. officinalis) flower. In this study, the changes in carbon (C), nitrogen (N), phosphorus (P), and NSC contents as well as C:N:P stoichiometry in the pistil, stamen, and petal of H. officinalis flowers at four developmental stages were comparatively analyzed. The results showed that C, N, P, and NSC contents, as well as C:N:P stoichiometric ratios in the three parts of the flower exhibited large variations at four development stages. Development stages and organs had significant effects on the measured parameters in the three organs of H. officinalis flowers, but their interactions had no significant effects. During the flower development, C, N, and P contents in different floral parts ranged from 418.7 to 496.3 mg/g, 26.6 to 45.3 mg/g, and 0.396 to 0.656 mg/g. P content decreased continuously with development, C:N in stamen were significantly higher than those in other flower parts at the same developmental stage. Glucose, starch, fructose, and sucrose contents showed significant differences in three parts of H. officinalis flowers at four development stages. These differences may reflect differences in elemental storage capacity and biomass allocation patterns of H. officinalis flowers. In general, our data will help to improve our understanding of the relationship between NSCs and C:N:P stoichiometry in response to development stages and organs in H. officinalis flowers.

1. Introduction

Flowers are one of the most important organs of a plant as they are essential for reproduction and evolutionary development [1,2]. Flower development is a lasting process, influenced by a variety of factors, including petal movement, petal cell growth, and changes in organic acid and phenolic compound content [3]. During flower development, not only significant changes in biomass, size, and flower colour but also changes in mineral elements, nutrient composition, and secondary metabolism were observed in Michelia maudiae ‘Rubicunda’, Zingiber mioga Roscoe, and Rosa damascena plants [1,4,5,6]. However, nutrients and secondary metabolites are ultimately derived from mineral elements absorbed by plants from the outside world. Therefore, it is necessary to explore the changes of mineral elements during flower development to understand the nutritional requirements of flower development.
Carbon (C), nitrogen (N), and phosphorus (P) are the three main elements closely related to plant growth and development [7]. C provides provided carbon skeletons for the biosynthesis of lipids, proteins and nucleic acids and is transported to storage organs in the form of sucrose for the biosynthesis of starch and other macromolecules [8]. N is an essential component of protein, chlorophyll, nucleotides, and hormones and plays a critical role in photosynthesis and plant production [9]. P is often regarded as the limiting element for synthesising nucleic acids and membrane lipids, which play an important role in genetic information transmission, energy storage, and the cell construction of plants [10]. Nutrient allocation can largely reflect the ability of plants to capture resources, which are related to a variety of ecological functions such as plant growth, reproduction, and defence [11,12]. The ratios of C, N, and P were thought to be flexible within and across species depending on their growing environment, such as temperature, rainfall, and soil nutrients, in macro-scale studies [13,14]. A wide range of C:N:P ratios in plant tissues favour different types of species and greater diversity of the ecosystem [15,16]. Variations in C, N, and P ratios may also be affected by developmental stages [17]. Yu et al. revealed that the element concentration and their stoichiometry inMichelia maudiae ‘Rubicunda’ flowers at different developmental stages reflected the development stage more than the organs [4]. These reports will help to understand the relationship between C:N:P stoichiometry and the development process in plants.
Non-structural carbohydrates (NSCs), including fructose, glucose, sucrose and starch, are produced mainly by photosynthesis in plants, which provides energy for the metabolic processes, and are transformed into each other [18]. NSCs not only serve as energy sources for metabolism, structural growth, defence, and reproduction but also play a role in regulating cell osmotic potential and triggering sugar signalling pathways [19,20,21]. Studies on a variety of flowering plants have shown that NSCs are essential to floral development from floral initiation to the maturation of floral organs [4,22]. In many flowers, including roses and T. caerulea, the contents of glucose and fructose in the petals increase during flower opening [23,24]. In rose petals, decreased osmotic potential is mainly attributed to increased soluble carbohydrate contents [23]. Starch is the most important storage carbohydrate in woody perennial plants and may derive either from these reserves from current photosynthesis to provide the energy for flowering [25]. Moreover, starch and soluble carbohydrate quantification in pistils at pollination has shown a strong link between total carbohydrate content and “successful” fruit [26]. Thus, it has been proposed that the changes in NSC content were known to influence the flower bud development and subsequent flower opening.
Houpoea officinalis (H. officinalis), referred to as “Houpo” in China, has been a traditional medicinal and ornamental plant in China, Japan, and South Korea for more than 2000 years. Its stem bark, root bark, and flower buds have attracted immense attention due to its rich magnolol and honokiol content [27]. Its flowers have high nutritional value and health benefits due to the presence of sugars and magnolol. However, most studies on H. officinalis mainly focus on its stem and root bark, and flower development has received little attention [28,29]. Recently, an increasing number of researchers have paid attention to the changes in mineral elements and chemical composition during flower development [4,6,30]. Previous studies found that the contents and their ratios of mineral elements in flowers were significantly different [17]. On the other hand, since the occurrence and development of flowers were closely related to the absorption and utilization of various nutrients, the quality of flowers is affected by the contents and their ratios of mineral elements [31]. Till this day, there is little information about the composition, content changes for NSC content, and C:N:Pstoichiometry related to the three organs and development stages of H. officinalis flower. In this study, the objectives were to investigate the changes in biomass, C, N and P contents of three parts during the development of H. officinalis flowers, which will provide a new understanding of the accumulation and distribution of nutrient elements of H. officinalis flowers at four development periods.

2. Materials and Methods

2.1. Study Site

This research was conducted in Feihong Community, Longchi Township, Dujiangyan, Chengdu, China, at coordinates 103°38′ E and 31°6′ N, with an altitude of approximately 710 m. The area has a typical subtropical monsoon climate, with an average temperature of 15.5 °C, an annual precipitation of 1188 mm, an average relative humidity of 90%, and a frost-free period of 280 days. The weather data were obtained from the China Meteorological Administration.

2.2. Flower Collection and Measurements

According to observations, it takes approximately 40–70 days for the buds of H. officinalis awakening and sprouting from their dormant state in winter to bloom, and the flower development process can be divided into four stages: the young bud stage (Stage I), bud expansion stage (Stage II), first bloom stage (Stage III), and full bloom stage (Stage IV), as shown in Figure 1. Ten uniformly planted 10-year-old H. officinalis trees with equivalent growth were sampled according to these four stages of flower development from early March to mid-May in 2023. Three flowers of each stage were collected from each tree (30 flowers each stage). Ten of them were randomly selected to determine morphological indexes, fresh weight, dry weight, and relative water content (RWC). The pistil, stamen, and petal were separated, weighed, dried, ground, and sieved for further use at each developmental stage.

2.3. Determination of C, N, and P Concentrations

C, N, and P concentrations were determined using the potassium dichromate oxidation method, the semi-trace Kjeldahl nitrogen determination method, and the Mo-Sb colourimetric method, respectively. The K2Cr2O7 and 2,4-dinitrophenol were purchased from Sinopharm Chemical Reagent Co., Ltd. (Shanghai, China). All other reagents were purchased from Chengdu Kelong Chemical Co., Ltd. (Chengdu, China). For the C concentration, a 50 mg sample was digested with 10 mL 1.6 MK2Cr2O7 and 10 mL concentrated H2SO4 at 210 °C for 10 min and then titrated with 0 8 M FeSO4. O-phenanthroline was used as an indicator, and the titration endpoint was when the solution changed from orange-yellow to dark green and then rapidly to brown-red. For the N concentration, 100 mg of the sample (N tablets required) was digested with 10 mL of concentrated H2SO4 and analysed using a Kjeldahl nitrogen analyser (Shanghai LNB Instrument Co., Ltd., Shanghai, China) and left overnight. The digestion program is 280 °C for 15 min, 350 °C for 15 min, and 450 °C for 20 min until the solution becomes transparent. For the P concentration, 100 mg sample was digested with 10 mL of concentrated H2SO4 and 0.7 mL of HClO4, and the digestion solution was adjusted to 100 mL with Milli-Q deionized water. Using 2,4-dinitrophenol as an indicator, molybdenum antimony anti-colour reagent was added to react for 30 min, and the absorbance was measured at 700nm.The concentrations of C, N and P were shown as mg/g dry weight (dw). The ratios of C:N, C:P and N:P were calculated from the concentration ratio. To calculate the accumulation and distribution ratio of elements based on the biomass and element concentration of each part of H. officinalis, the calculation formula is element accumulation = organ element concentration × organ biomass, and the element’s allocation ratio in different organs = (element accumulation in pistil/stamen/petal)/total element accumulation.

2.4. Determination of NSC Concentrations

The NSC content was determined using the anthrone colourimetric method referring to the Gu et al. method [32]. An amount of 10 mL of 80% ethanol was added to 0.2 g of dry sample and centrifuged (5000 r/min, 10 min) after 30 min in a boiling water bath to collect the supernatant. The above process was repeated three times to ensure adequate extraction of sugars. These supernatants were used to determine glucose, sucrose, and fructose content. For glucose determination, 5 mL of anthrone solution was added into 0.1 mL of extract and reacted for 15 min at 90°C, and then, the absorbance was measured at 620 nm after cooling. Fructose concentration was determined by adding 0.1 mL of sugar extract and 5 mL of anthrone solution, reacted for 90 min at 25 °C, and then, measuring absorbance at 620 nm. For sucrose concentration, 0.1 mL of 7.6 M KOH solution was added to 0.1 mL sugar extract and boiled for 10 min. After cooling, 5 mL of anthrone solution was added to react for 15 min at 90°C, and then, the absorbance was measured at 620 nm after cooling. For starch extraction, the above-mentioned residue was suspended with 10 mL of 30% perchloric acid for 10 min in a water bath (80 °C) and the extracted mixtures were left overnight. After cooling, the supernatant was centrifuged at 4000 rpm for 10 min at 4 °C and was harvested and diluted with deionized water to 50 mL for starch measurement. For starch determination, the test method was similar to that of the glucose determination. The glucose, sucrose, fructose, and starch concentrations were calculated by the established standard curve. Results were shown as mg/g dry weight (mg/g dw).

2.5. Statistical Analysis

All measurements were expressed as mean ± standard error (S.E.) with at least three replications. To examine the significance of the difference among various development stages and organs (α = 0.05), one-way ANOVA and LSD (least significant difference) methods were employed using SPSS 25.0 (SPSS Inc., Chicago, IL, USA). Graphs were plotted and PCA was analysed using Origin 2021 (Origin Lab, Northampton, MA, USA).

3. Results

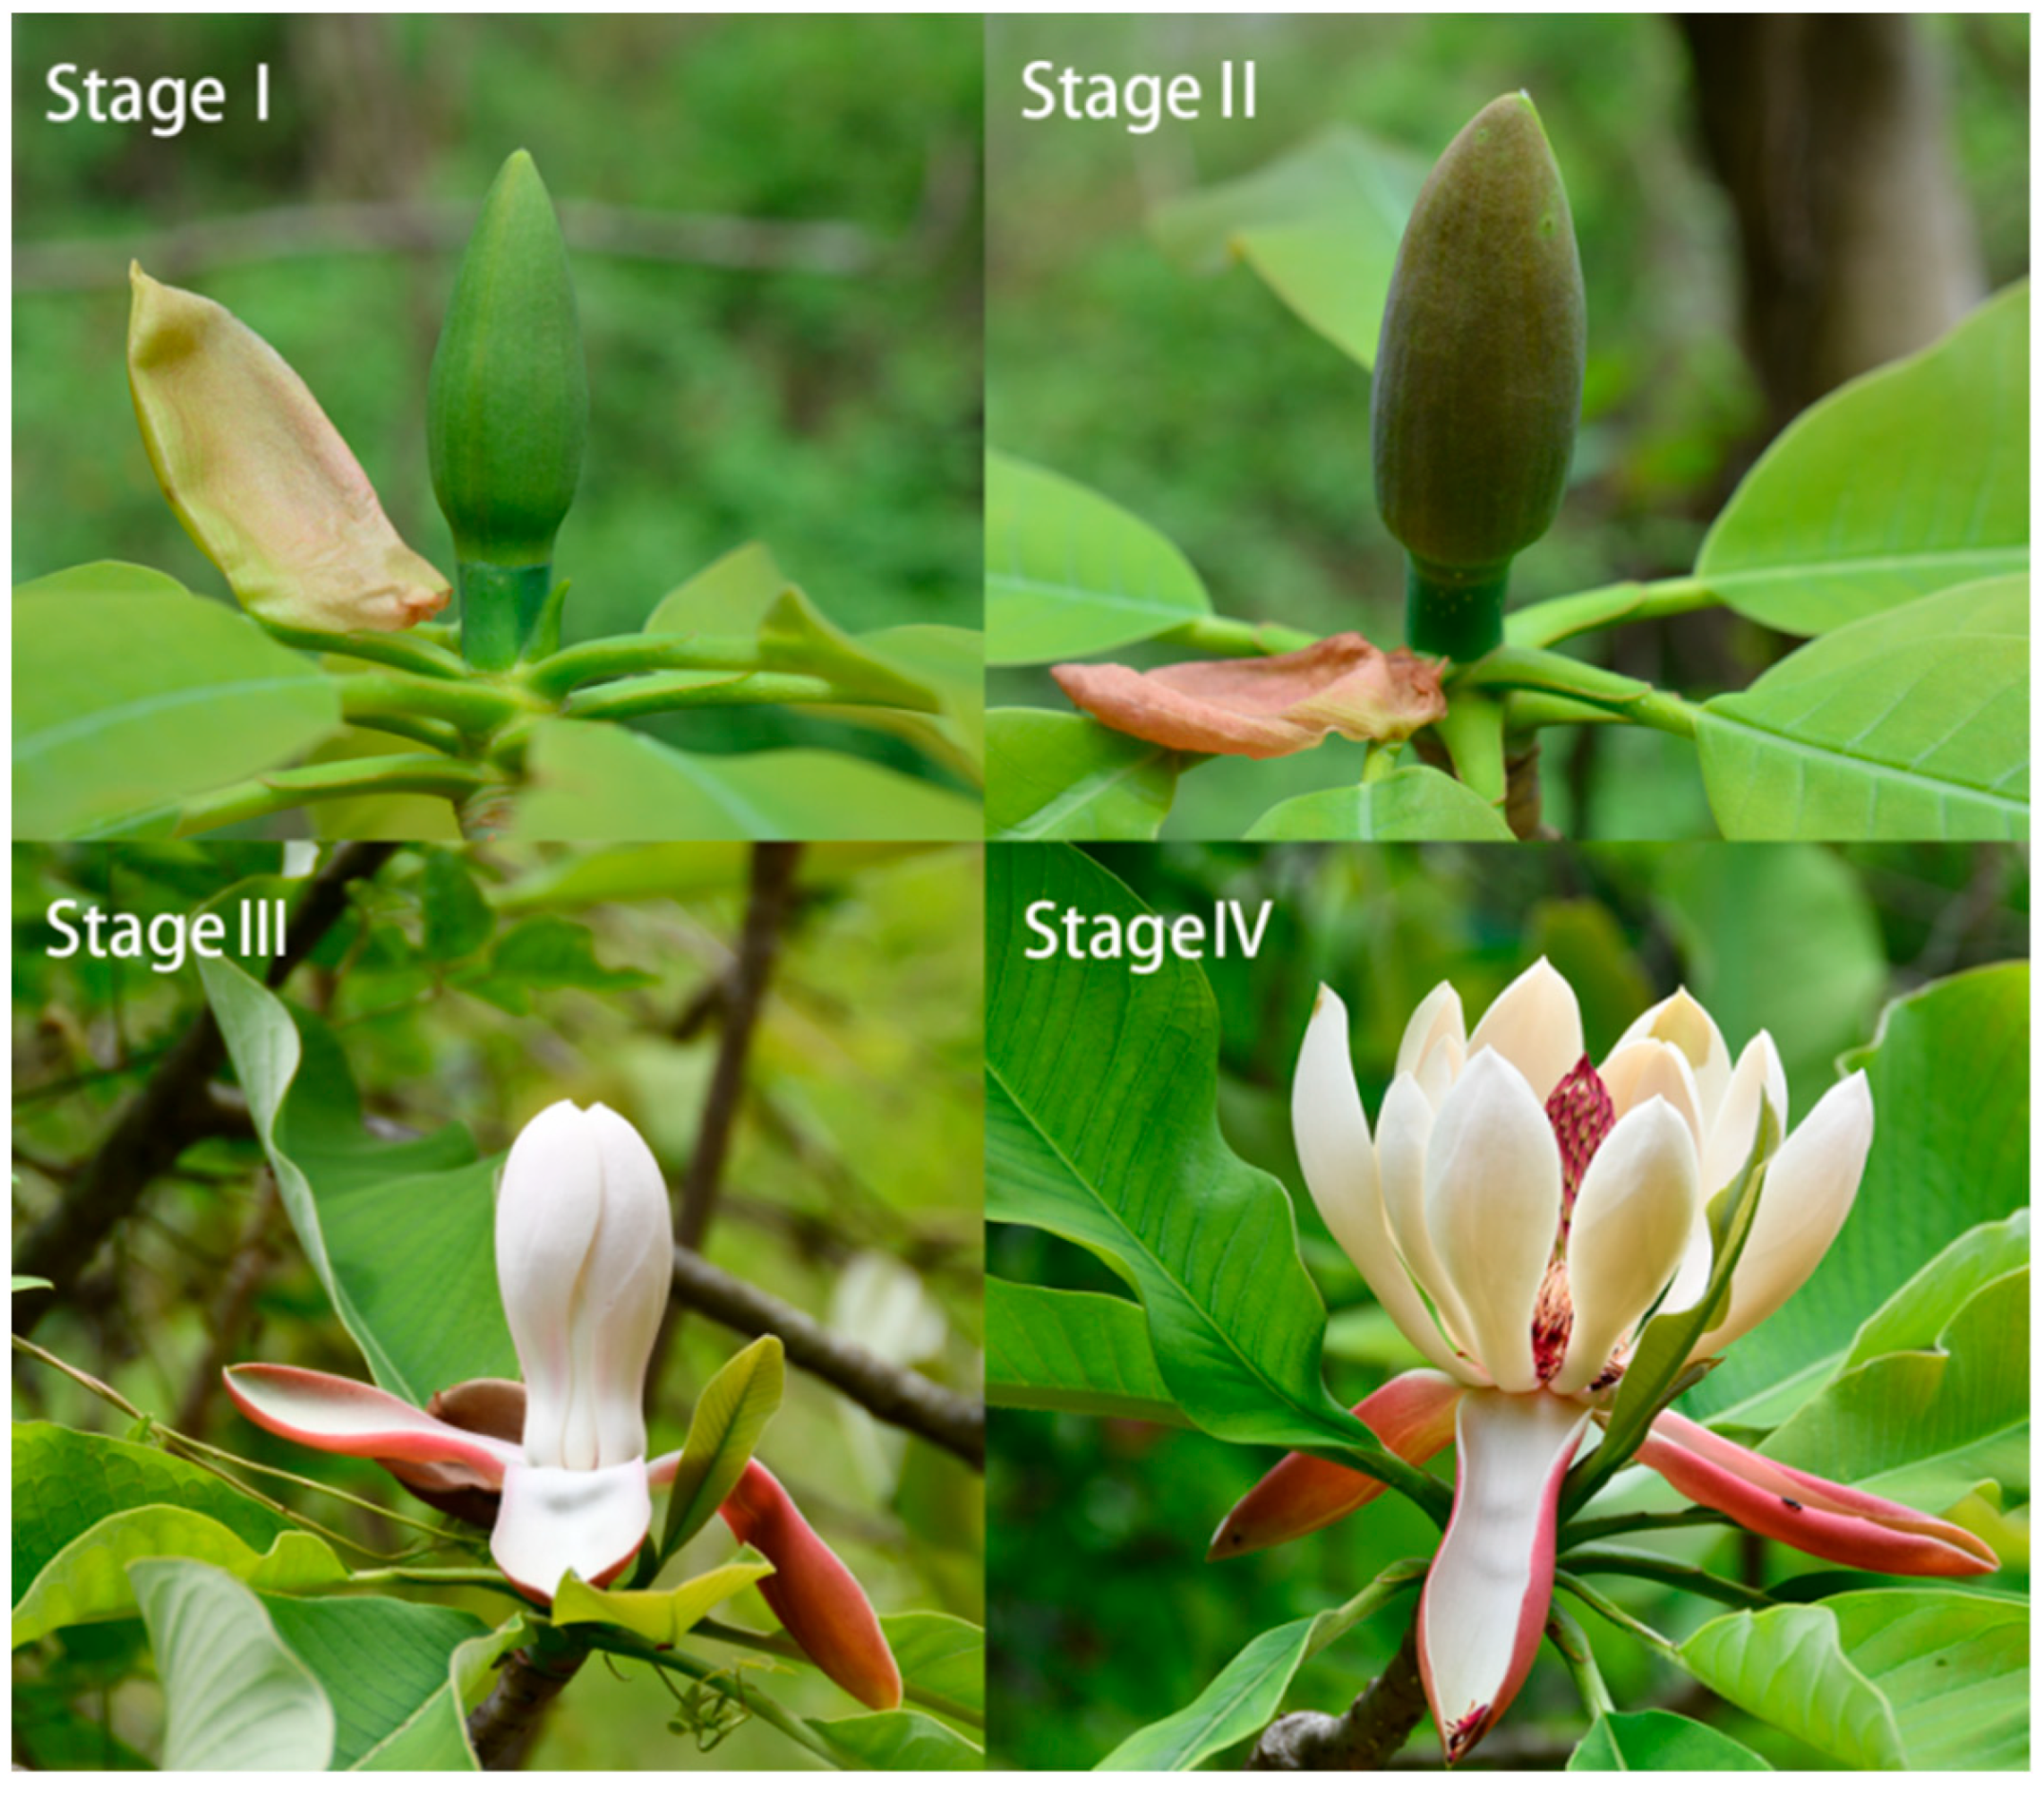
3.1. Variations of Morphological Indicators and Biomass Allocation

As shown in Table 1 and Table 2, the changes in morphological indexes and biomass allocation of various organs at four different development stages were observed. During the development of H. officinalis flowers, the size of the pistil and petals gradually increased, while the stamen reached a peak at stage III and slightly decreased at stage IV (Table 1). Out of three parts, the petal size increased the most, with length and width growing from 6.28 to 11.3 cm and 3.13 to 5.62, respectively. As shown in Table 2, the fresh weight of pistil, stamen, and petal increased gradually from Stage I to Stage IV. The values varied from 1.90 to 13.3 g, 1.74 to 6.52 g, and 7.35 to 28.1 g, respectively. The dry weight showed a similar trend compared to those of the fresh weight. As the total fresh weight increased, a higher proportion of biomass was allocated to the petal compared to those of the stamen and pistil. The RWC of the pistil, stamen, and petal gradually decreased during development at Stage III reaching 76.9%, 73.0%, and 82.0%, respectively, but slightly increased after blooming.

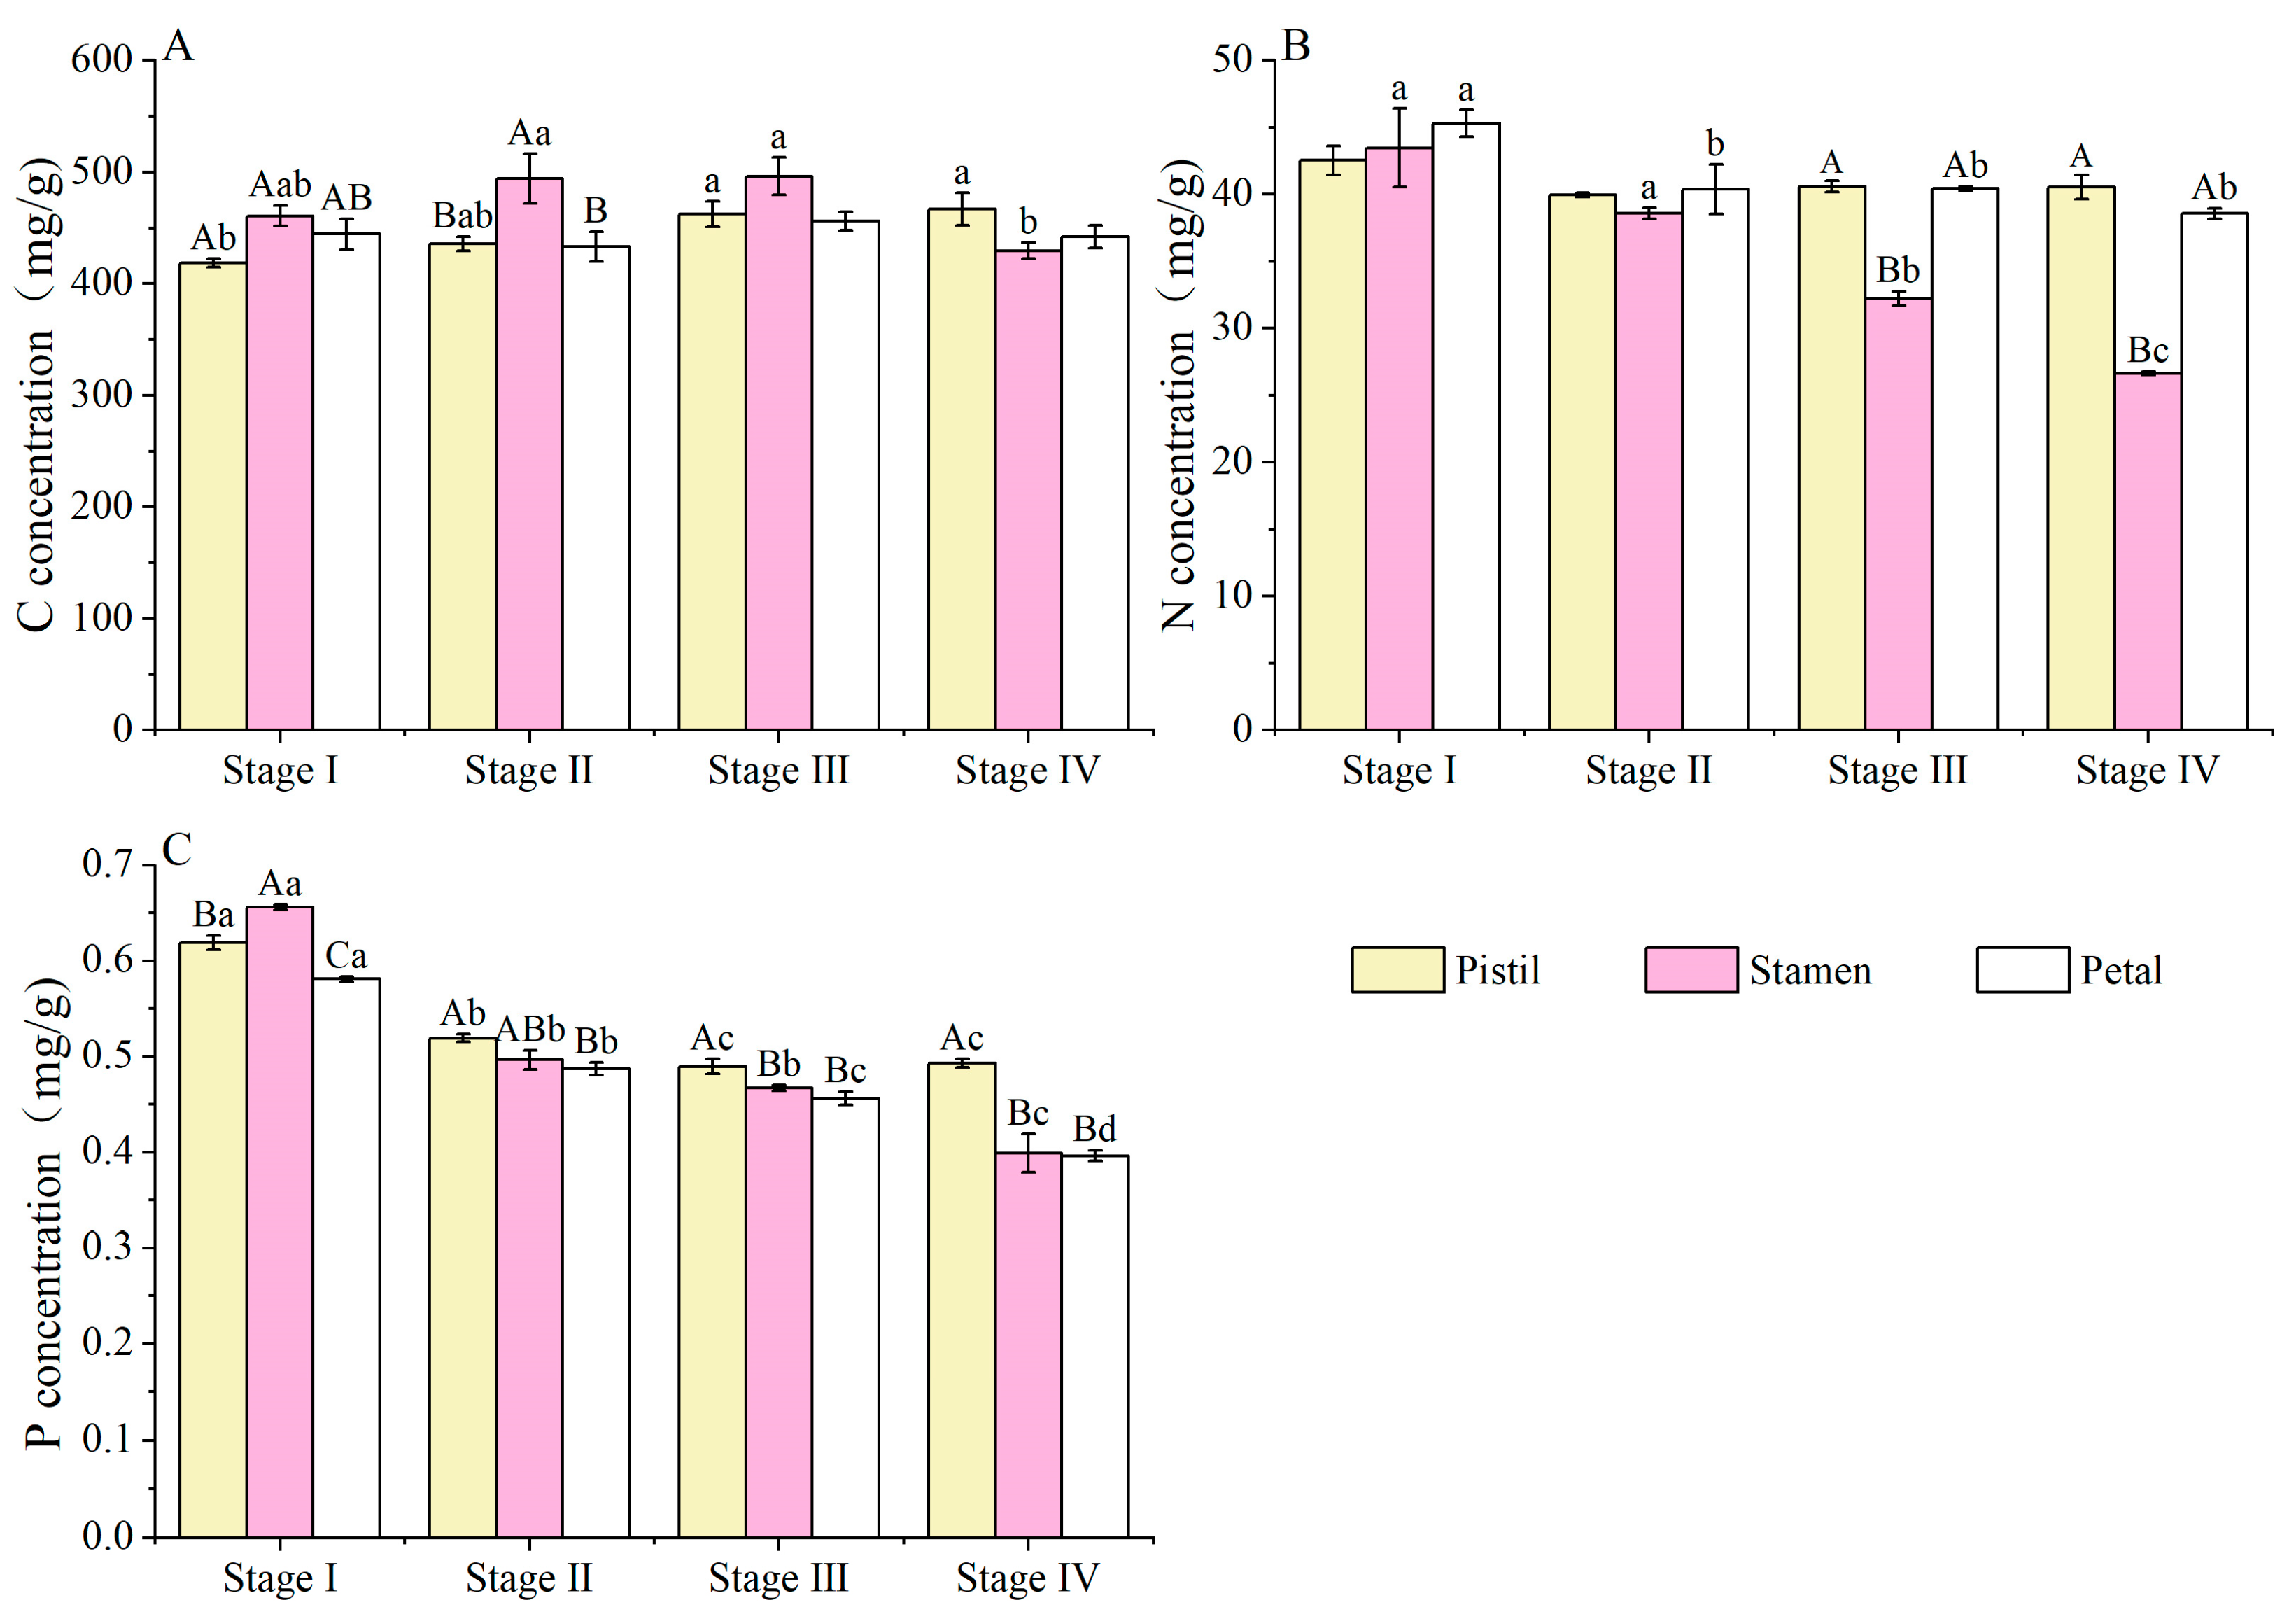
3.2. C, N and P Concentrations

The concentrations of C, N, and P in the three parts of H. officinalis flowers during development were shown in Figure 2. In the pistil and stamens, the C concentration varied from 418.7 to 467.1mg/g, 429.6 to 496.3 mg/g, and peaked at Stage IV (467.1 mg/g dw) and Stage III (496.3 mg/g dw), respectively. The C concentration in the petals varied from 433.1 to 455.8 mg/g and peaked at Stage III with 455.8 mg/g dw (Figure 2A). As shown in Figure 2B, the N concentration of stamens, petals, and pistil varied from 26.6 to 43.5 mg/g, 38.6 to 45.3 mg/g, and 40.0 to 42.5mg/g during flower development, respectively. In both stamens and petals, the maximum values were observed at Stage I, while the minimum values appeared at Stage IV. In the pistil, the N concentration fluctuates within a small range and did not differ remarkably between the four developmental stages. In Figure 2C, it can be observed that the P concentration of pistil, stamens, and petals gradually decreased from Stage I to Stage IV (only the P concentration in pistils slightly increases at Stage IV), and the values at Stage IV only represented 79.7%, 60.9%, and 68.2% compared with those of Stage I, respectively. The P contents of pistil, stamens, and petals ranged from 0.490 to 0.619 mg/g, 0.399 to 0.656 mg/g, and 0.396 to 0.581 mg/g dw, respectively. These results revealed that C, N, and P concentrations were significantly related to development stages and organs in H. officinalis flower.

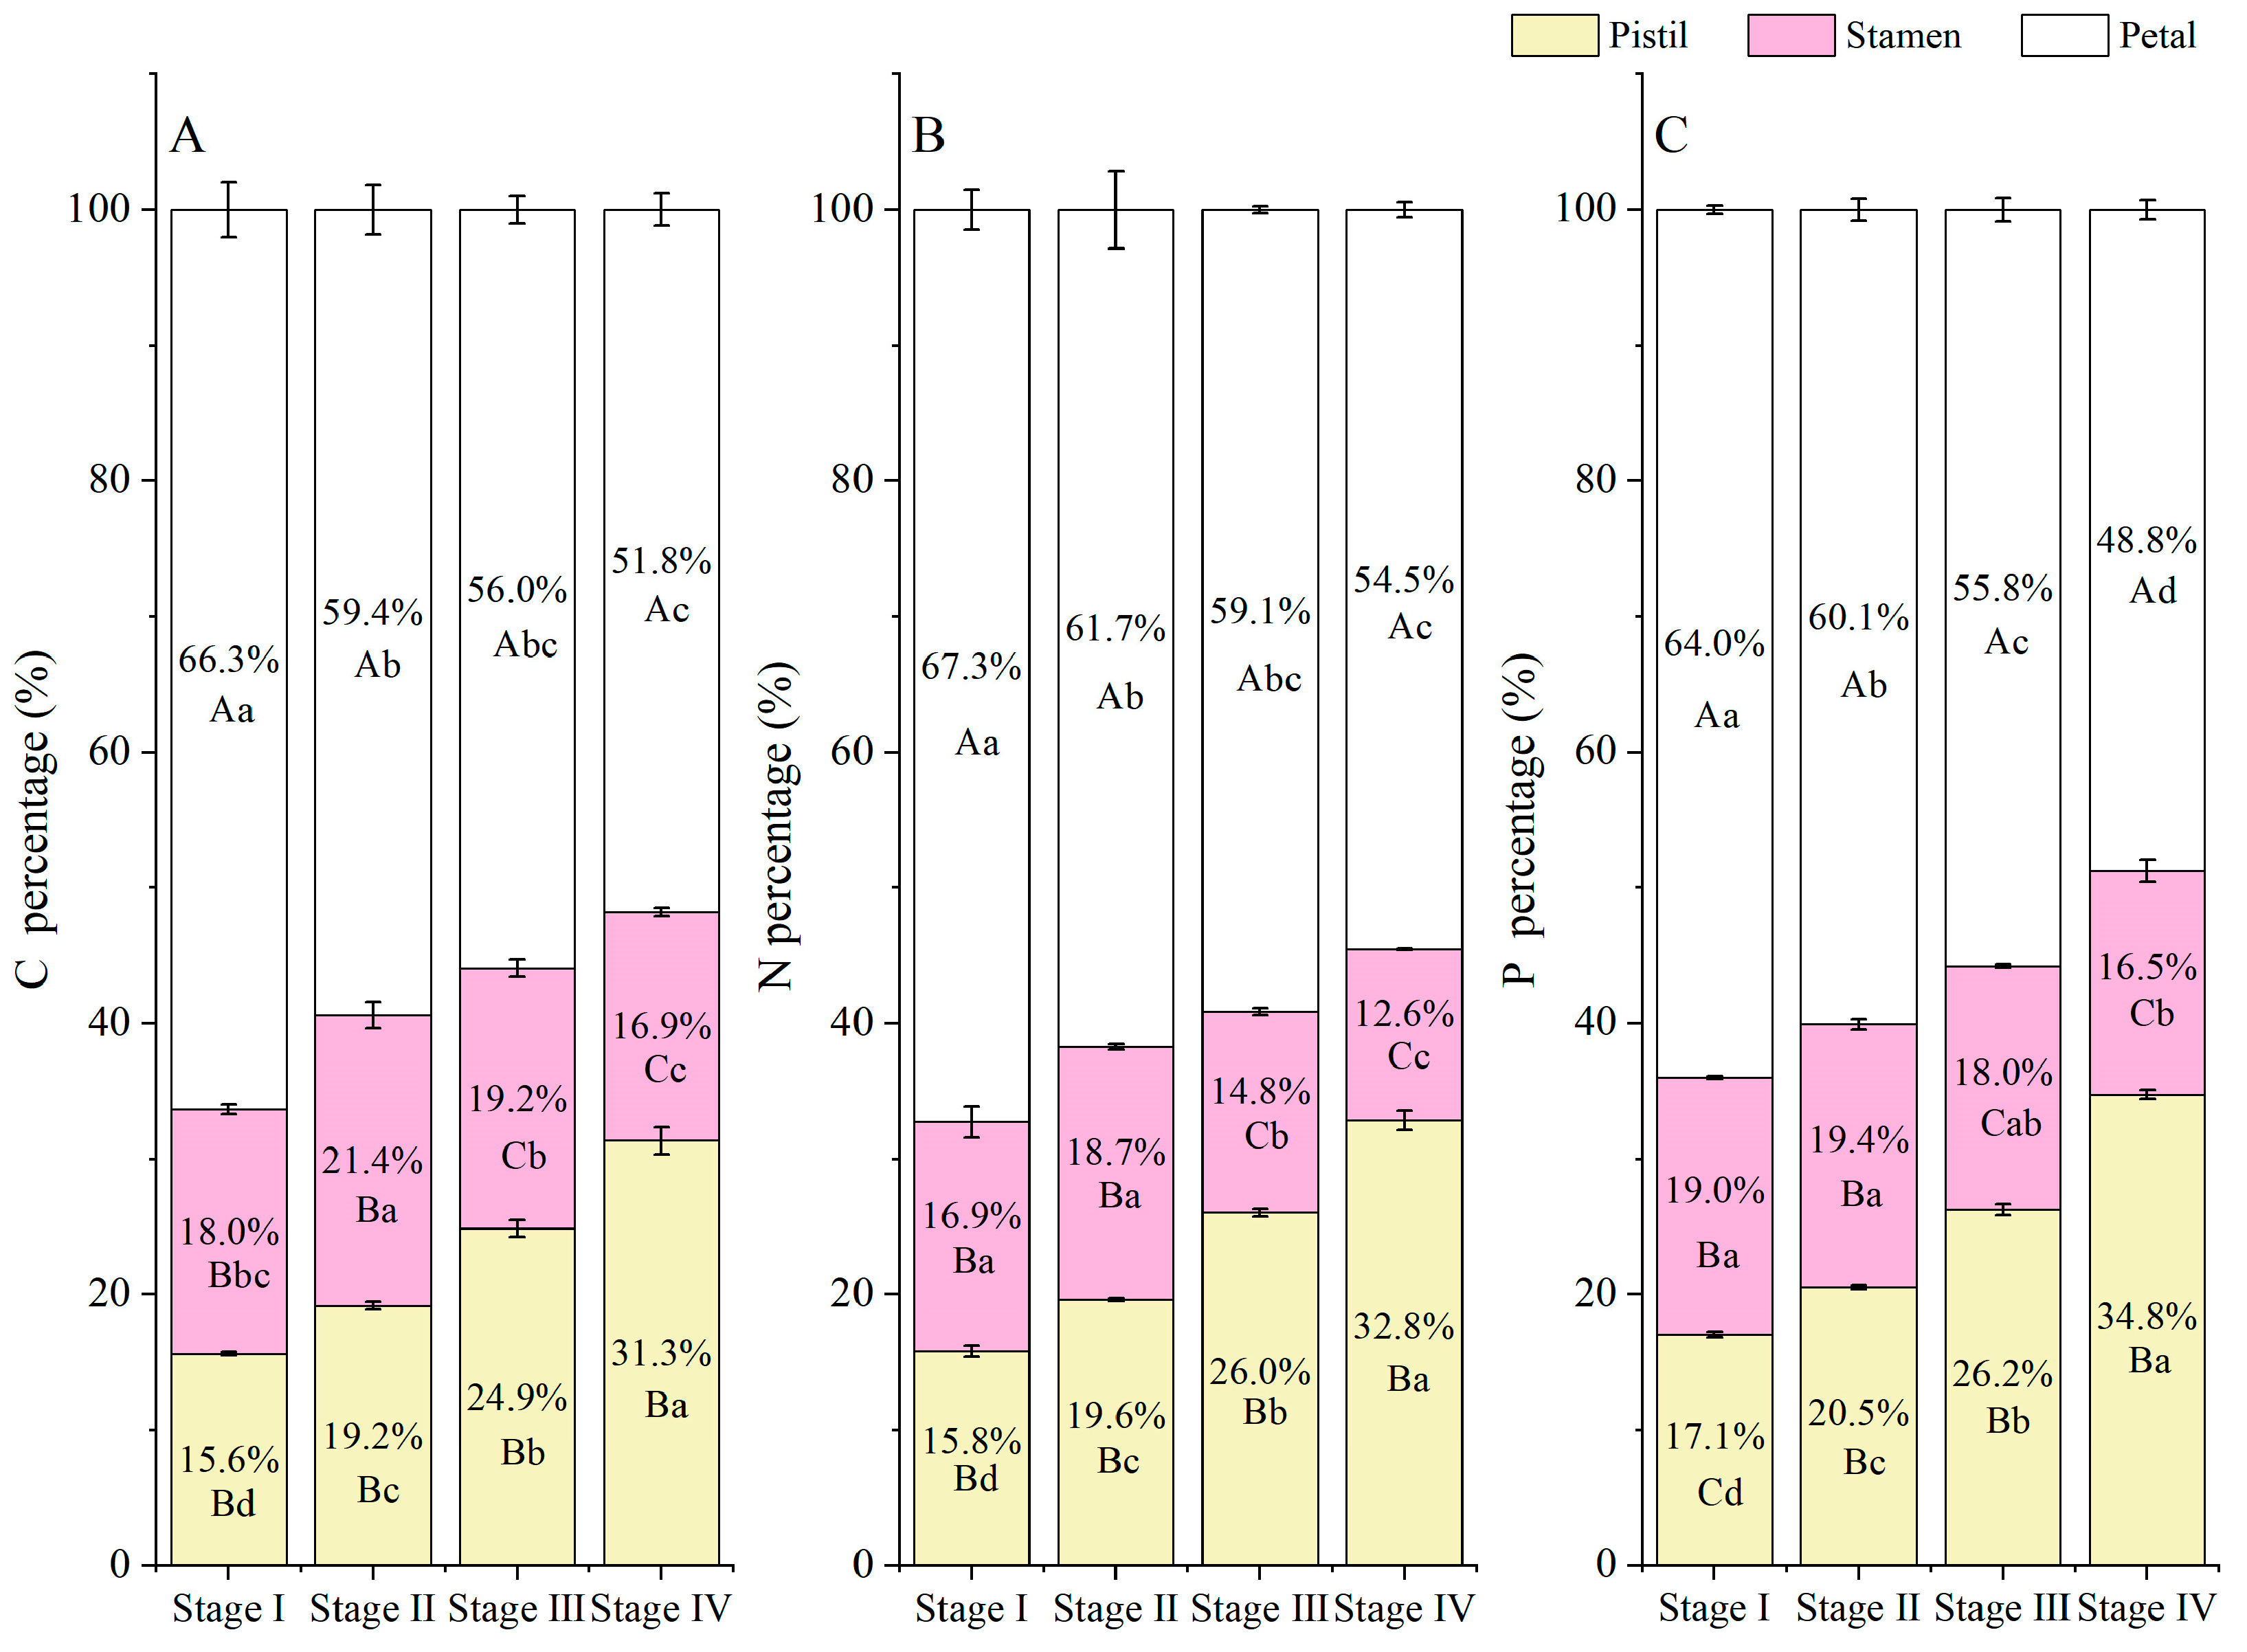
3.3. Element (C, N, and P) Accumulation and Allocation Proportion

With the development of H. officinalis flowers, the accumulation of C, N, and P in three parts of H. officinalis flowers was constantly increasing, and there were significant differences at four developmental stages (Figure 3). At Stages I and II, the accumulation of C, N and P in the petals was significantly higher than that of the pistils and stamens, while there were no significant differences between the pistils and stamens. At Stages III and IV, the accumulation of the three elements was highest in the petals and lowest in the stamens, with significant differences among the three parts. Totally, the accumulation of C, N and P in the whole flower of H. officinalis varies greatly among different periods, ranging from 672.5 to 3840.3 mg, 67.6 to 318.2 mg, and 0.911 to 3.65 mg, respectively.
The variations of C, N, and P allocation proportions were shown in Figure 4. The allocation proportions of C, N, and P in the pistil, stamens, and petals of H. officinalis flowers varied with flower development. C allocation proportions displayed a sharp decrease from Stage I (66.3%) to Stage IV (51.8%) in the petals, but a remarkable increase in the pistil from Stage I (15.6%) to Stage IV (31.3%). The values in the stamens initially increased up to Stage II with 21.4% and then decreased with the developmental stages (16.9% at Stage IV) (Figure 4A). In Figure 4B, it can be observed that the changes in N allocation proportions in the three parts were similar to those of C and N during flower development. As shown in Figure 4C, the P allocation proportions in the stamens and petals gradually decreased from Stage I to Stage IV (from 19.0% to 16.5%, and 64.0% to 48.8%, respectively). However, the values in the pistil showed a remarkable increase during flower development, ranging from 17.1% to 34.8%.

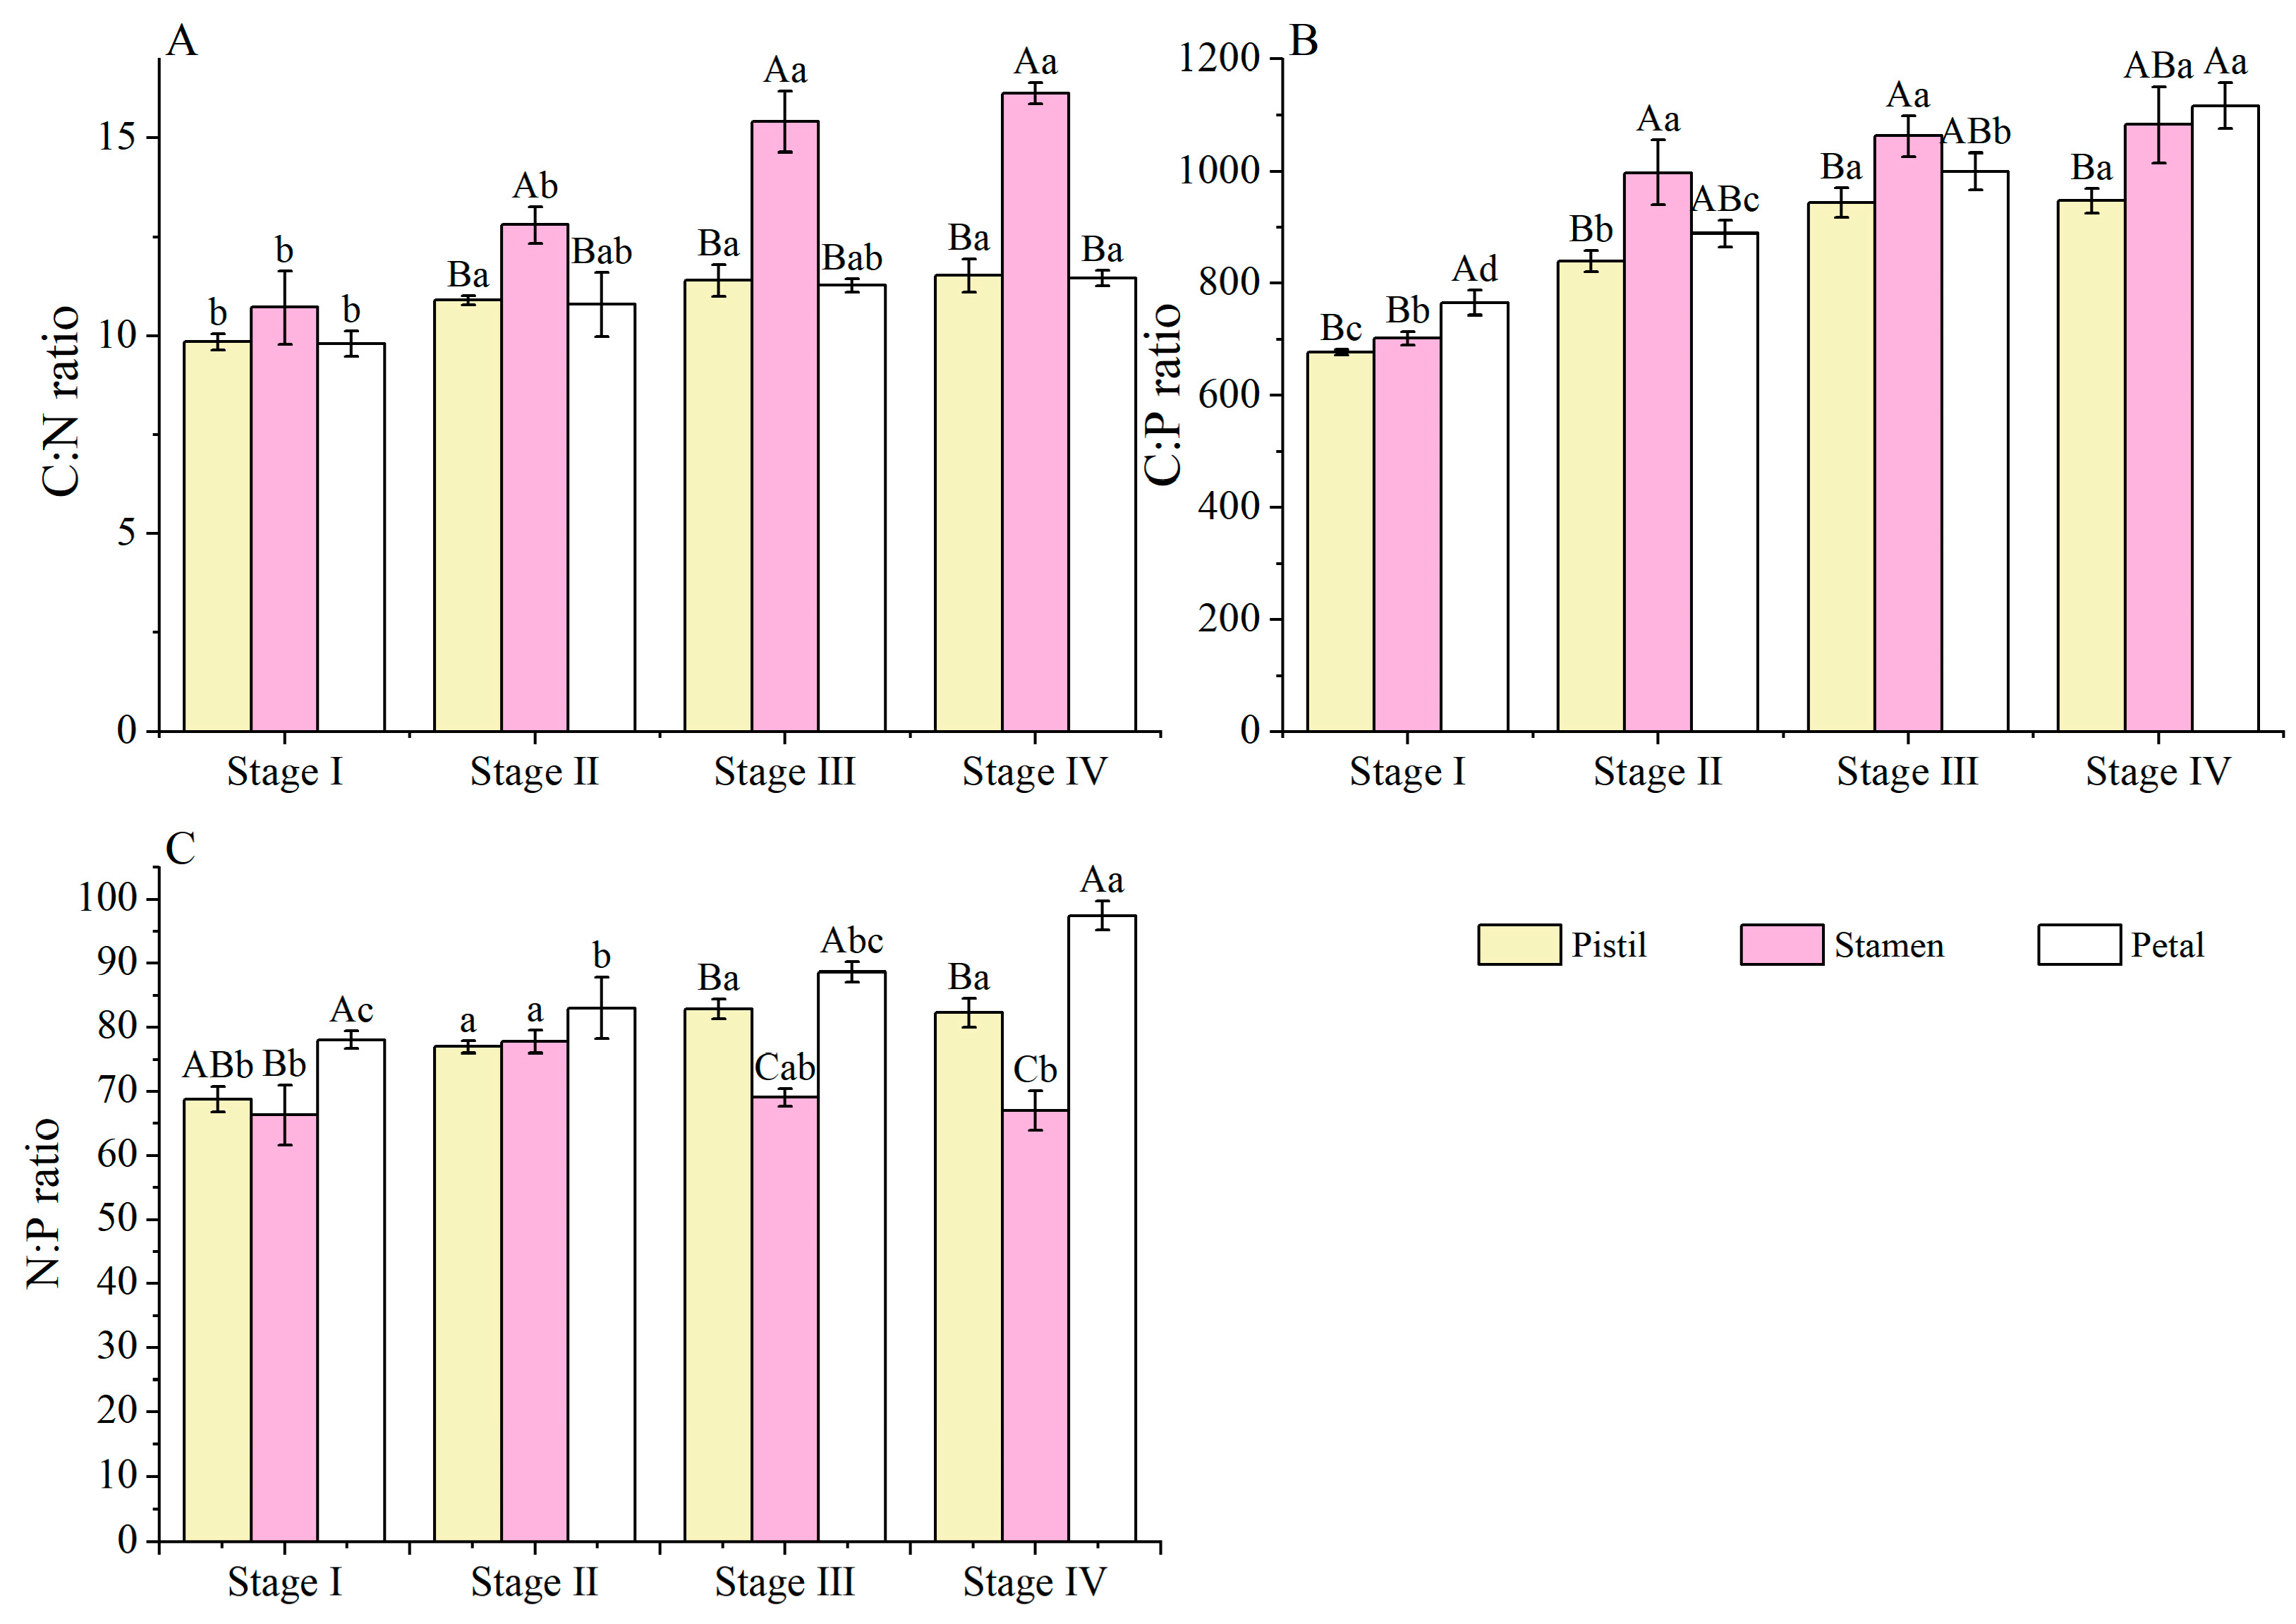
3.4. C, N, and P Stoichiometric Ratio

As shown in Figure 5, developmental stages and organs had significant effects (p > 0.05) on the C:P and N:P ratios, except for C:N at Stage I. It was evident that the ratio of C:N and C:P in the three parts increased continuously with the developmental process (Figure 5A,B). The values of C:N were not significantly different, with the values of 9.85–11.5, 10.7–16.1, and 9.82–11.5 in the pistils, stamens, and petals, respectively. However, the variations of C:P values were relatively larger, with C:P values of 676.7–947.2, 702.1–1082.9, and 765.2–1117.0 in the pistils, stamens and petals, respectively. In addition, the highest value of C:N appears in the stamens, while the lowest value appears in the petals. For C:P, the highest value varies between stamens and petals, but the lowest value appears in the pistil. For N:P, the highest values in the pistil, stamen, and petal were observed at Stage III (82.9), Stage II (77.8), and Stage IV (97.4), respectively. Moreover, the lowest values of the pistil, stamen, and petal were found at Stage I, representing 68.8, 66.3, and 78.0, respectively (Figure 5C). These results revealed that the changes of C, N, and P stoichiometry were significantly related to development stages and organs in H. officinalis flowers.

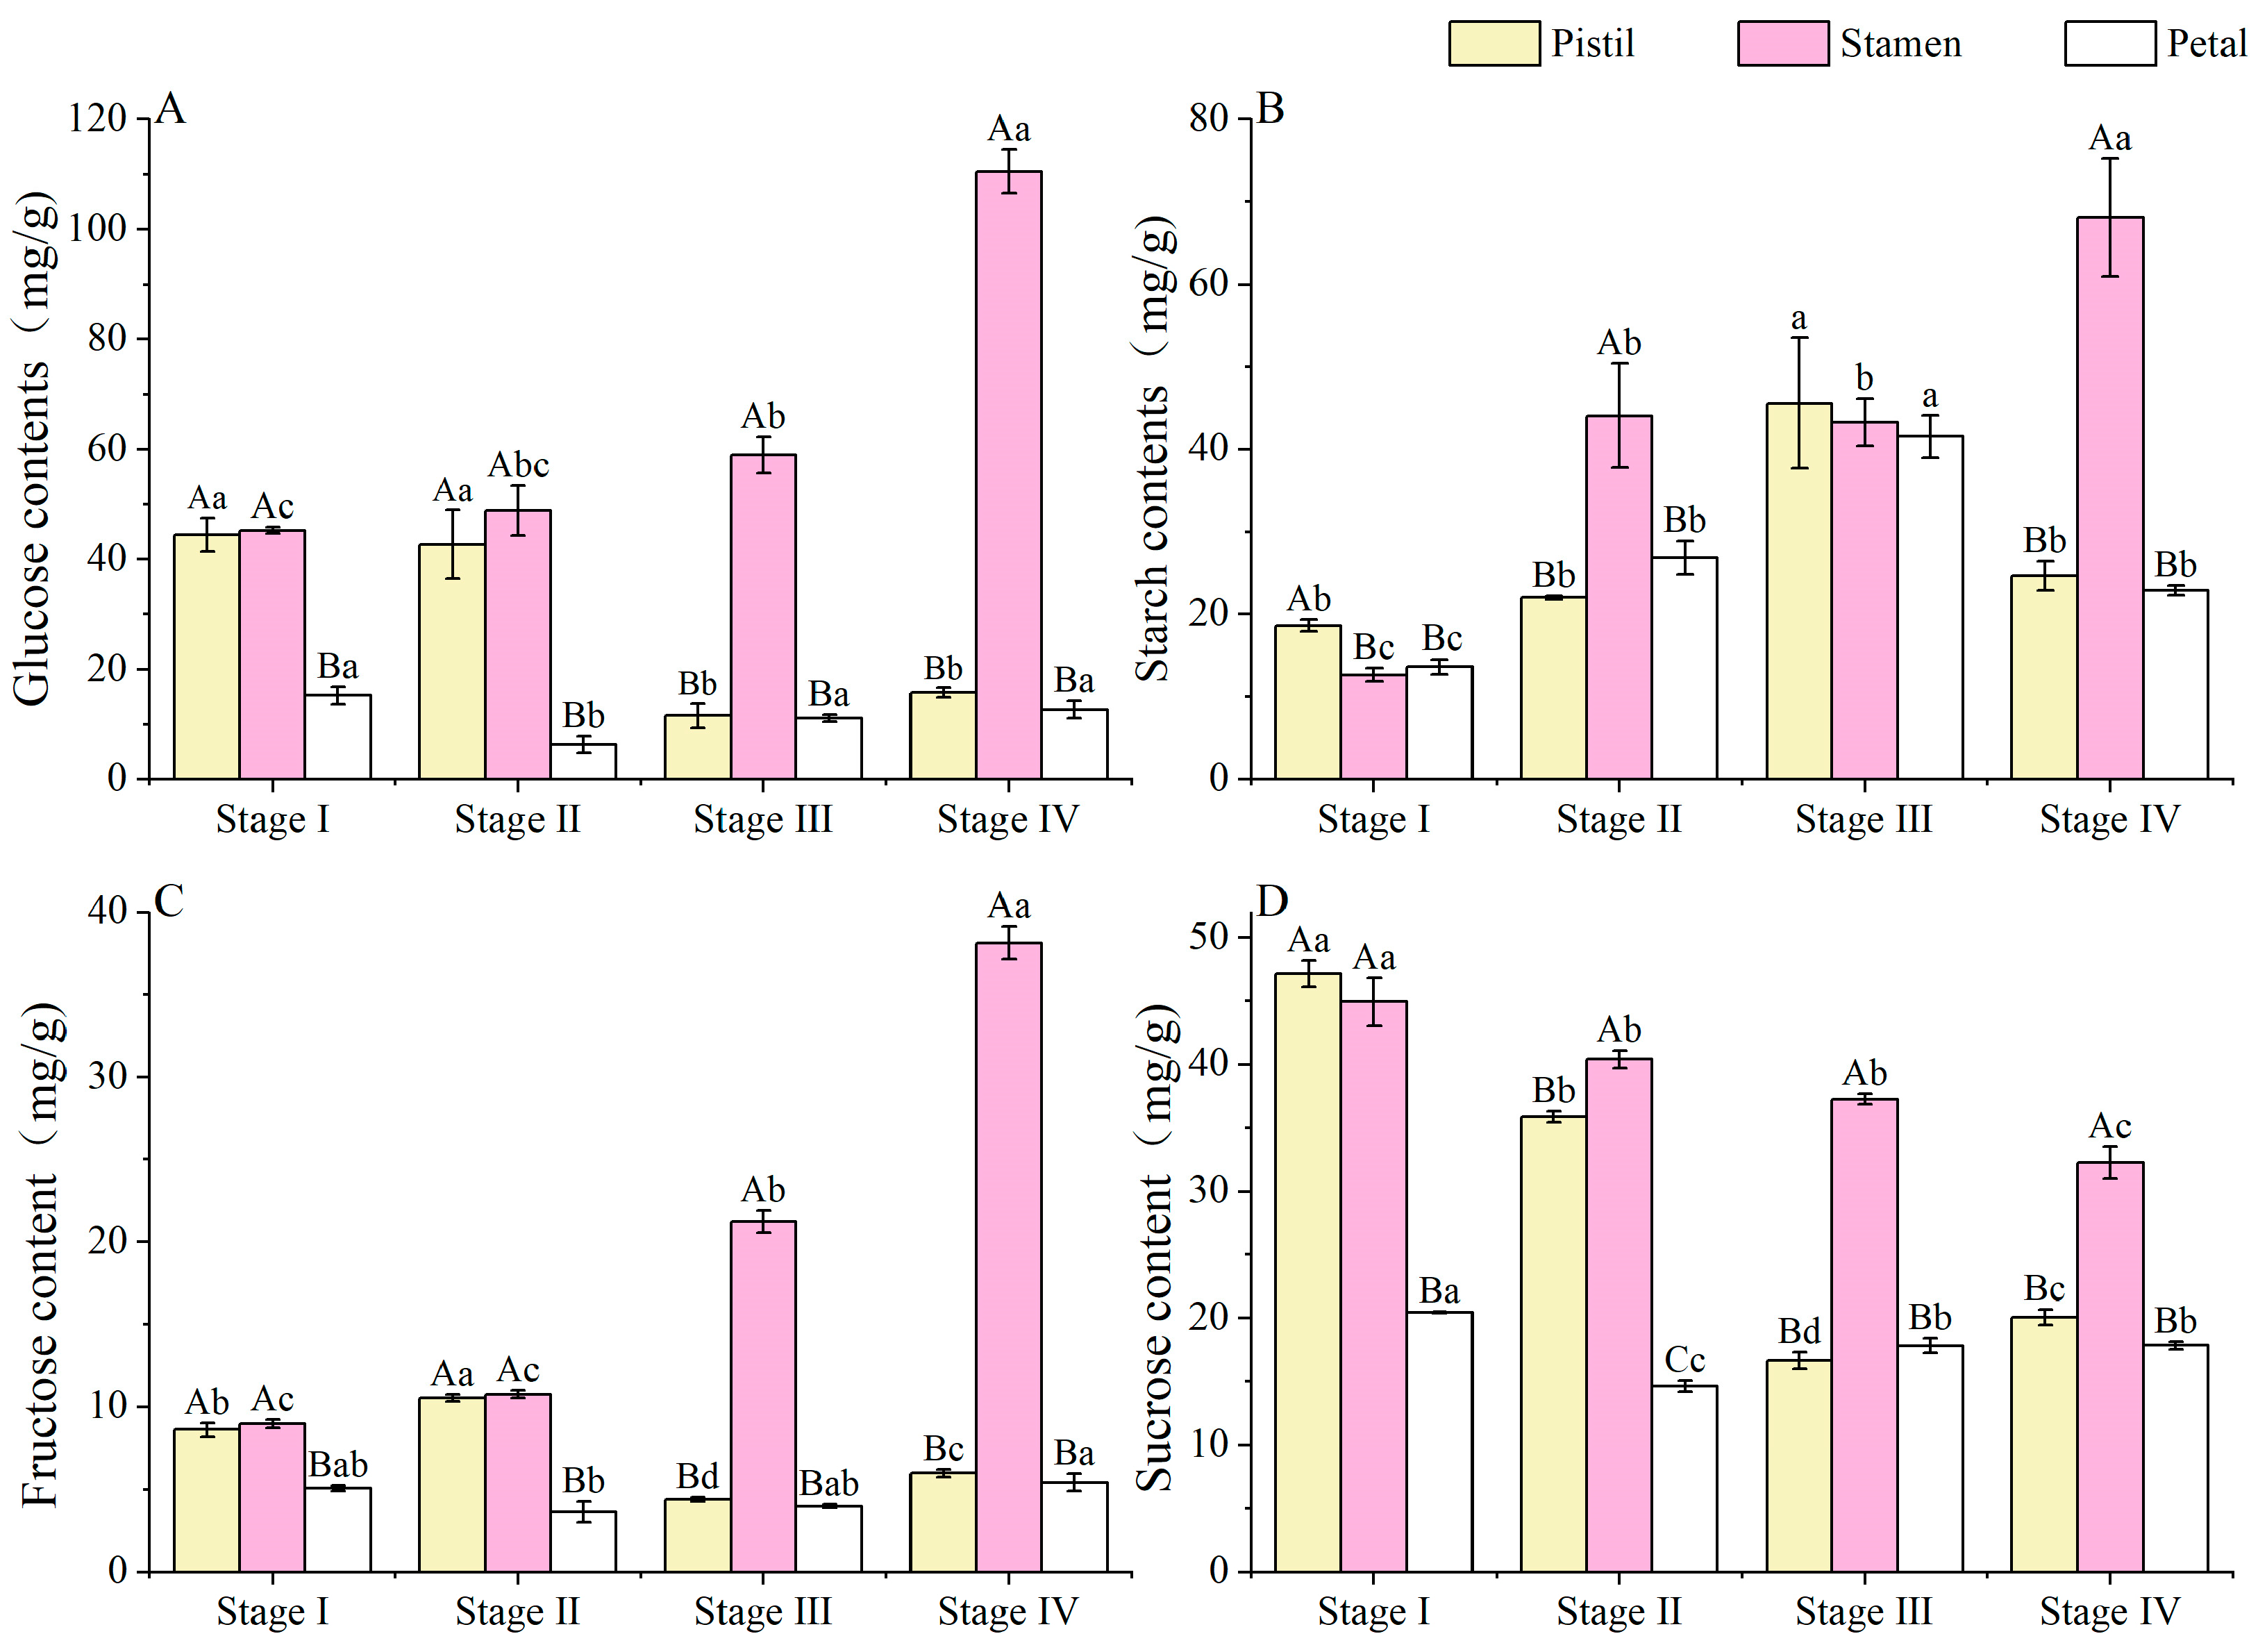
3.5. Non-Structural Sugar (NSCs) Contents

As shown in Figure 6A, the concentrations of glucose in the stamen gradually increased up to Stage IV, and the values represented 110.6 mg/g. The maximum values of glucose concentration in the pistil (44.5 mg/g dw) and petal (15.3 mg/g dw) appeared at Stage I, respectively. As shown in Figure 6B, the starch concentration of stamens, petals, and pistil varied from 12.7 to 68.1 mg/g, 13.6 to 41.6 mg/g, and 18.6 to 45.6 mg/g during flower development, respectively. As shown in Figure 6C, the trend of fructose concentration in stamens was similar to that of glucose concentrations, reaching the peak at Stage IV with 38.1 mg/g dw. The contents of fructose in pistil and petal ranged from 4.39 to 10.5 mg/g and 3.63 to 5.43 mg/g, respectively. The maximum values of fructose concentration in the pistil and petal were recorded at Stage II (10.5 mg/g dw) and Stage IV (5.43 mg/g dw), respectively. The sucrose concentration of pistils, stamens and petals ranged from 16.7 to 47.1 mg/g, 32.2 to 44.9 mg/g, and 14.7 to 20.5 mg/g, respectively, and showed the highest values at Stage I (Figure 6D). There were certain similarities and differences in the variation of trends of the NSC contents in the three parts of H. officinalis flowers at four developmental stages, indicating that some sugars were coordinated during development and there was mutual transformation or movement between them among the three parts. These results revealed that the changes of glucose, starch, fructose and sucrose contents were significantly related to development stages and organs in H. officinalis flowers.

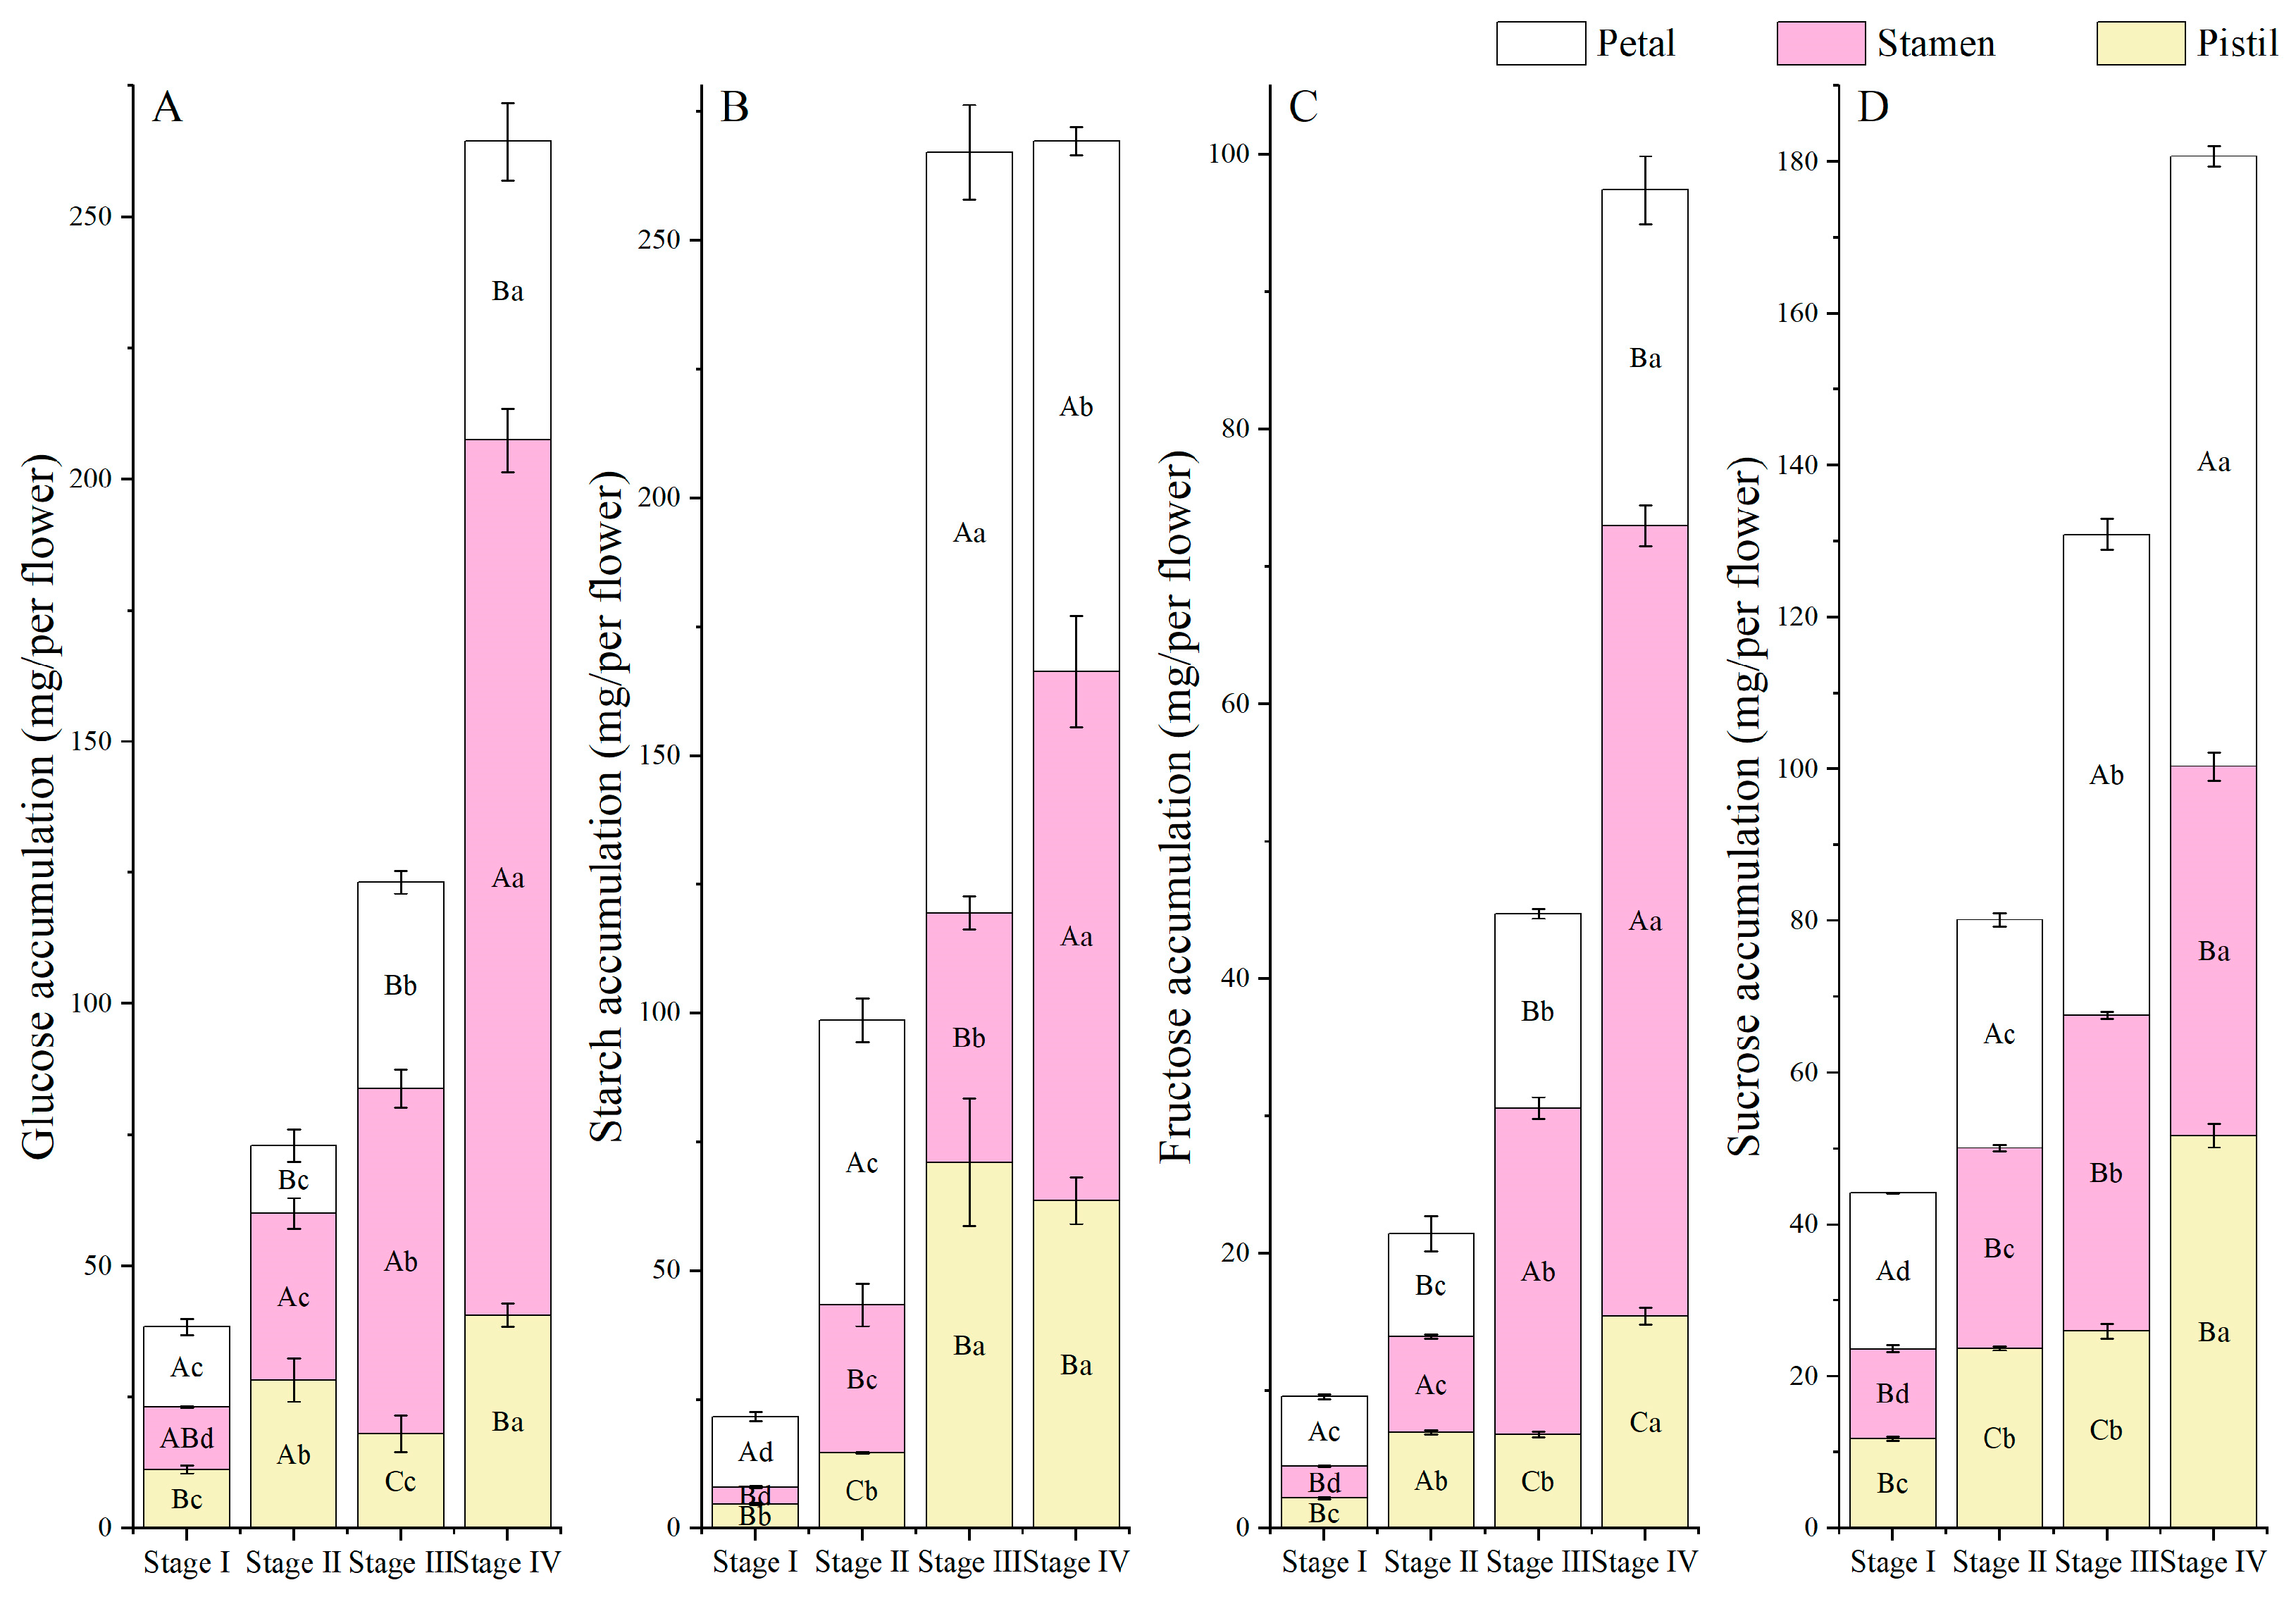
3.6. NSC Accumulation and Allocation Proportion

Figure 7 shows the changes in non-structural sugar accumulation during the flower development. The accumulation of three soluble non-structural sugars (glucose, fructose and sucrose) in pistil, stamen, and petal at Stage IV was significantly higher than those at the other stages, while the starch accumulation in pistil and petal reached the maximum at Stage III. The total accumulation of glucose, fructose, sucrose and starch in the whole flower increased with flower development, representing 38.4–264.4 mg/g dw, 21.7–269.3 mg/g dw, 9.61–97.4 mg/g dw and 44.2–180.7 mg/g dw, respectively. The total accumulation of glucose, fructose, and sucrose increased significantly through the four developmental stages, while the starch accumulation approached the maximum at Stage III. In addition, the proportion of NSCs distributed among different parts also varied with the developing flower (Figure 8). As shown in Figure 8A, the glucose distribution ratios of pistil and petal were from 15.3% to 38.7% and 17.1% to 39.9%, respectively, and its maximum value appears at Stage II and Stage I, respectively. The glucose distribution in stamens increased with flower development, ranging from 31.0% to 63.1%. For sucrose distribution, its values in the pistil and stamen ranged from 14.7% to 26.6% and 15.4% to 38.2%, respectively, with maximum values observed at Stage III and Stage IV, respectively (Figure 8B). During flower development, the starch distribution ratio in petals was higher than that in pistil and stamen and gradually decreased from 63.1% at Stage I to 38.2% at Stage IV. As shown in Figure 8C, the distribution ratio of total fructose in the petals changed similarly to starch, with the maximum and minimum values appearing at Stage I (52.9%) and Stage IV (25.1%), respectively. Fructose distribution in the pistil and stamen varied from 24.6% to 59.1% and 15.3% to 32.5%, with the highest values at Stage IV (59.1%) and Stage II (32.5%), respectively (Figure 8C). As shown in Figure 8D, the sucrose distribution ratios in the pistil, stamen, and petal, which were 19.8–29.6%, 26.8–32.9% and 37.6–48.4% respectively, have little change trend, and its maximum value appeared at Stage I, Stage II and Stage III, respectively.

3.7. Principal Component Analysis (PCA)

PCA is a commonly used tool in chemometrics and other fields to compress raw data, reduce dimensions, and extract hidden information from raw multivariate data [33]. According to the present study, the C, N and P contents and their stoichiometric ratios of pistil, stamens, and petals of H. officinalis flowers significantly varied among the four developmental stages, as shown in Figure 9. The first two principal components’ cumulative percent variation (CPV) was 79.8%, which meets the general requirement of CPV > 70–85% for informative PCA (Figure 9A,B). As shown in Figure 9A and Table 3, the first principal component (PC1), which explains 49.6% of the overall variance, is associated with N, fructose, starch, glucose content and the ratio of C:N, while the second principal component (PC2) is related to sucrose, P content and the ratio of N:P and C:P. There were some intersections of the confidence ellipses of the pistil, stamen, and petal, especially the pistil (Stage I) and stamens (Stage I), and the pistil and petal (Stage III and Stage IV), indicating that these parts have high similarity. Stage I in the three parts was far away from the other stages, which indicates that the pistil and stamen of H. officinalis at Stage I were different from those of the later stages. These results indicate that the contents of C, N, and P and their stoichiometric ratios, as well as the contents of non-structural sugars, were highly correlated with developmental stages and organs.

4. Discussion

Understanding various processes to maintain flower development is crucial for improving the visual quality and lifespan of flowers. In this study, the morphological indexes and biomass of H. officinalis flowers were significantly different with different plant tissues and growth stages, and most of these values increased continuously with flower development (Table 1 and Table 2). The length, width and biomass of petals increase throughout flower development, which is consistent with the flower of Damascus rose and Phalaenopsis orchid during the growth process [1,34]. The length, width, biomass and distribution of pistils increase continuously with flower development, and the size of the stamen is distinct from those of the pistil and petal, with a pattern of increase followed by decrease. This may be because the primary role of the stamen is to release pollen, so it will eventually wilt before the corolla and pistil undergo senescence, regardless of whether pollination is successful or not [35,36]. RWC is an important factor affecting the growth and quality of flowers. For most flowers, the RWC of petals or flowers rises first and then decreases with the development of flowers. That is, RWC is the highest in the blooming stage and the lowest in the subsequent ageing and wilting of flowers [37,38]. The present results showed that the RWC of H. officinalis flowers reached its minimum value at Stage III (Table 2), which was consistent with the results of previous studies [1,17,24]. A higher RWC can lead to a greater water potential gradient, further causing cell expansion, which is the primary driving force behind flower opening [39]. These changes showed that development stages were the main factor adjusting the morphological indexes and biomass in H. officinalis flowers, which also provides a comprehensive understanding of the correlation between morphological indexes and development stages in H. officinalis flowers.
During the flowers development, the biosynthesis and accumulation of nutrients is closely related to the accumulation of mineral elements in the different organs of the flowers. In general, the proportion of C in plants remains relatively constant at 45–47.9% of their dry matter, which means that the C content does not vary significantly during their development and among different organs [4,40,41]. The present results were consistent with this established understanding (Figure 2). N and P limit physiological activities such as plant growth and reproduction, and their proportion is related to the relative growth rate of plants [42]. Faster-growing organisms tend to have higher tissue P contents and lower N:P ratios than slower-growing organisms [43]. In the present study, P concentration was highest in stamens at Stage I, whereas it was highest in pistils during Stage IV. Moreover, the N:P ratio was lower in stamens than in pistils and petals at the later stages of flower development (Figure 2 and Figure 5). The results showed that the stamen grew more vigorously at the early stage of flower development and the growth transferred to the pistil in the later stage, which was consistent with the phenological characteristics of flowering. Previous studies have shown that N deficiency affects inflorescence formation in grapes [44]. Appropriate supplementation of N and P can improve the quality of Cucurbita pepo and apple flowers, and ultimately increase yield [45,46]. In addition, higher contents of N can prolong flower life, thereby increasing the probability of insect-borne cross-pollination [47]. However, there were still uncertain issues about the impacts of development stages and/or organs on the variable C, N, P content and their ratios in H. officinalis flowers, which need to be deeply investigated.
Flower formation depends on many processes including NSC metabolism and energy availability [20,48]. NSCs could be converted to sucrose and stored as starch to derive complex carbohydrates for growth during the flower development and differentiation process [49,50]. To flowering plants, there are great variations in the content and type of NSCs from floral bud development to blooming and senescence. Moreover, these changes also were accompanied by changes in colour, morphological indexes, and metabolism physiological and biochemical indexes [51]. A series of studies suggested that glucose, fructose, and sucrose content and their levels differed among different flowering plants, like Borago officinalis and Centaurea cyanus [48]. It has also been shown that glucose and fructose contents in roses reached their highest contents before flower bud opening, while sucrose contents continued to rise after flowering [23]. In the present experiment, the starch content in the petals of H. officinalis flower increased at first and then decreased, while the content of glucose and fructose in the petals showed an opposite trend (Figure 6). The accumulation and proportion patterns of NSC varies significantly during the development process of H. officinalis flowers, and the allocation patterns of the three organs also showed significant differences (Figure 7 and Figure 8). These changes may be due to the differences in nutritional requirements in the three parts of H. officinalis flowers, which were consistent with the results of Sood et al. [51]. However, our results were also different from Fernandes et al., who reported that fructose content raised during the flower development of Borago officinalis, but the contents of sucrose and glucose did not have significant variability. In cornflower, the contents of glucose and fructose raised with the flower development, but sucrose content did not show significant variability [48]. The present results showed that flower development in H. officinalis is found to be dependent on the accumulation and proportion patterns of NSC, which provided novel insights into the floral bud development and flower opening processes in H. officinalis. Though the accumulation and proportion patterns of NSC in response to development stages have already been proved, the complex metabolic pathways of NSCs during the transition from flower buds to flowers still need to be further studied.

5. Conclusions

In conclusion, the present study supported that developmental stages and flower organs as well as their interactions significantly influenced the parameters C, N, P, NSC content, accumulation and distribution as well as C, N, and P stoichiometric ratios in the different parts of H. officinalis flowers. PCA results also revealed that the C content and its stoichiometric ratio were highly correlated with the developmental stages and flower organs, indicating a close relationship among developmental stages, parts, and nutrient elements. This study helps to provide not only new ideas for understanding the accumulation and distribution of nutrient elements during the flower development process, but also a richer theoretical basis for the fast estimation of nutrient content in H. officinalis flowers. In fact, flower development of H. officinalis contained a series of complex regulatory networks, and further investigation will focus on the changes of physiological and biochemical parameters for better understanding of its development process.

Author Contributions

Conceptualization, visualization and supervision, S.G. and G.Z.; methodology, software, validation and formal analysis, Y.Y., Y.Q., Y.C. and T.Y.; investigation, Y.Y., Y.Q., Y.C. and T.Y.; writing—original draft preparation, Y.Y., S.G. and G.Z.; writing—review and editing, Y.Y., Y.Q., Y.C., T.Y., M.Z., W.Q., S.G. and G.Z. All authors have read and agreed to the published version of the manuscript.

Funding

This work was financially supported by the National Key Research and Development Program of China (No. 2023YFD1600400) and the Cultivation of Scientific Research Interest Project for Undergraduates of Sichuan Agricultural University (No. 2024981).

Data Availability Statement

The raw data supporting the conclusions of this article will be made available by the authors on request.

Acknowledgments

We are grateful to all of the group members and workers for their assistance in the field experiment.

Conflicts of Interest

The authors declare no conflicts of interest.

References

  1. Önder, S.; Tonguç, M.; Erbaş, S.; Önder, D.; Mutlucan, M. Investigation of Phenological, Primary and Secondary Metabolites Changes during Flower Developmental of Rosa Damascena. Plant Physiol. Biochem. 2022, 192, 20–34. [Google Scholar] [CrossRef] [PubMed]
  2. Campbell, D.R.; Bischoff, M.; Lord, J.M.; Robertson, A.W. Flower Color Influences Insect Visitation in Alpine New Zealand. Ecology 2010, 91, 2638–2649. [Google Scholar] [CrossRef] [PubMed]
  3. van Doorn, W.G.; Kamdee, C. Flower Opening and Closure: An Update. J. Exp. Bot. 2014, 65, 5749–5757. [Google Scholar] [CrossRef] [PubMed]
  4. Yu, T.; Yang, Y.; Wang, H.; Qian, W.; Hu, Y.; Gao, S.; Liao, H. The Variations of C/N/P Stoichiometry, Endogenous Hormones, and Non-Structural Carbohydrate Contents in Michelia maudiae ‘Rubicunda’ Flower at Five Development Stages. Horticulturae 2023, 9, 1198. [Google Scholar] [CrossRef]
  5. Wei, S.; Liu, H.; Li, J.; Ren, T.; Xie, J. Metabolite Variations of Sugars, Organic Acids, Fatty Acids and Amino Acids in Flower Buds of Zingiber Mioga Roscoe at Different Developmental Stages. J. Food Compos. Anal. 2023, 116, 105050. [Google Scholar] [CrossRef]
  6. Önder, S.; Tonguç, M.; Önder, D.; Erbaş, S.; Mutlucan, M. Flower Color and Carbohydrate Metabolism Changes during the Floral Development of Rosa Damascena. S. Afr. J. Bot. 2023, 156, 234–243. [Google Scholar] [CrossRef]
  7. Ågren, G.I. Stoichiometry and Nutrition of Plant Growth in Natural Communities. Annu. Rev. Ecol. Evol. Syst. 2008, 39, 153–170. [Google Scholar] [CrossRef]
  8. Li, L.; Sheen, J. Dynamic and Diverse Sugar Signaling. Curr. Opin. Plant Biol. 2016, 33, 116–125. [Google Scholar] [CrossRef] [PubMed]
  9. Luo, L.; Zhang, Y.; Xu, G. How does nitrogen shape plant architecture? J. Exp. Bot. 2020, 71, 4415–4427. [Google Scholar] [CrossRef]
  10. Prathap, V.; Kumar, A.; Maheshwari, C.; Tyagi, A. Phosphorus homeostasis: Acquisition, sensing, and long-distance signaling in plants. Mol. Biol. Rep. 2022, 49, 8071–8086. [Google Scholar] [CrossRef]
  11. Poorter, H.; Remkes, C.; Lambers, H. Carbon and Nitrogen Economy of 24 Wild Species Differing in Relative Growth Rate. Plant Physiol. 1990, 94, 621–627. [Google Scholar] [CrossRef] [PubMed]
  12. Zhao, N.; Yu, G.; Wang, Q.; Wang, R.; Zhang, J.; Liu, C.; He, N. Conservative Allocation Strategy of Multiple Nutrients among Major Plant Organs: From Species to Community. J. Ecol. 2020, 108, 267–278. [Google Scholar] [CrossRef]
  13. Zhang, S.; Zhang, J.; Slik, J.W.F.; Cao, K. Leaf Element Concentrations of Terrestrial Plants across China Are Influenced by Taxonomy and the Environment. Glob. Ecol. Biogeogr. 2012, 21, 809–818. [Google Scholar] [CrossRef]
  14. Reich, P.B.; Oleksyn, J. Global Patterns of Plant Leaf N and P in Relation to Temperature and Latitude. Proc. Natl. Acad. Sci. USA 2004, 101, 11001–11006. [Google Scholar] [CrossRef] [PubMed]
  15. Sardans, J.; Rivas-Ubach, A.; Peñuelas, J. The C:N:P Stoichiometry of Organisms and Ecosystems in a Changing World: A Review and Perspectives. Perspect. Plant Ecol. Evol. Syst. 2012, 14, 33–47. [Google Scholar] [CrossRef]
  16. Zhang, Y.; Li, C.; Wang, M. Linkages of C: N: P Stoichiometry between Soil and Leaf and Their Response to Climatic Factors along Altitudinal Gradients. J. Soils Sediments 2019, 19, 1820–1829. [Google Scholar] [CrossRef]
  17. Ren, H.-Y.; Qian, W.-Z.; Yi, L.; Ye, Y.-L.; Gu, T.; Gao, S.; Cao, G.-X. Nutrient Composition and Antioxidant Activity of Cercis Chinensis Flower in Response to Different Development Stages. Horticulturae 2023, 9, 961. [Google Scholar] [CrossRef]
  18. Hartmann, H.; Trumbore, S. Understanding the Roles of Nonstructural Carbohydrates in Forest Trees—From What We can Measure to What We Want to Know. New Phytol. 2016, 211, 386–403. [Google Scholar] [CrossRef]
  19. Song, X.; Peng, C.; Zhou, G.; Gu, H.; Li, Q.; Zhang, C. Dynamic Allocation and Transfer of Non-Structural Carbohydrates, a Possible Mechanism for the Explosive Growth of Moso Bamboo (Phyllostachys heterocycla). Sci. Rep. 2016, 6, 25908. [Google Scholar] [CrossRef] [PubMed]
  20. Rolland, F.; Baena-Gonzalez, E.; Sheen, J. Sugar Sensing and Signaling in Plants: Conserved and Novel Mechanisms. Ann. Rev. Plant Biol. 2006, 57, 675–709. [Google Scholar] [CrossRef]
  21. Wang, Y.; Funnell, K.A.; Eason, J.R.; Morgan, E.R.; Woolley, D.J. Osmotic Regulation via Carbohydrate Metabolism Drives Petal Expansion and Floret Opening in Gentian ‘Showtime Spotlight. ’ Sci. Hortic. 2016, 211, 19–25. [Google Scholar] [CrossRef]
  22. Cho, L.-H.; Pasriga, R.; Yoon, J.; Jeon, J.-S.; An, G. Roles of Sugars in Controlling Flowering Time. J. Plant Biol. 2018, 61, 121–130. [Google Scholar] [CrossRef]
  23. Yamada, K.; Norikoshi, R.; Suzuki, K.; Imanishi, H.; Ichimura, K. Determination of Subcellular Concentrations of Soluble Carbohydrates in Rose Petals during Opening by Nonaqueous Fractionation Method Combined with Infiltration–Centrifugation Method. Planta 2009, 230, 1115–1127. [Google Scholar] [CrossRef]
  24. Norikoshi, R.; Imanishi, H.; Ichimura, K. Changes in Cell Number, Osmotic Potential and Concentrations of Carbohydrates and Inorganic Ions in Tweedia caerulea during Flower Opening. J. Jpn. Soc. Hortic. Sci. 2013, 82, 51–56. [Google Scholar] [CrossRef]
  25. Lebon, G.; Wojnarowiez, G.; Holzapfel, B.; Fontaine, F.; Vaillant-Gaveau, N.; Clement, C. Sugars and Flowering in the Grapevine (Vitis vinifera L.). J. Exp. Bot. 2008, 59, 2565–2578. [Google Scholar] [CrossRef]
  26. Boldingh, H.L.; Alcaraz, M.L.; Thorp, T.G.; Minchin, P.E.H.; Gould, N.; Hormaza, J.I. Carbohydrate and Boron Content of Styles of ‘Hass’ Avocado (Persea americana Mill.) Flowers at Anthesis can Affect Final Fruit Set. Sci. Hortic. 2016, 198, 125–131. [Google Scholar] [CrossRef]
  27. Luo, H.; Wu, H.; Yu, X.; Zhang, X.; Lu, Y.; Fan, J.; Tang, L.; Wang, Z. A Review of the Phytochemistry and Pharmacological Activities of Magnoliae officinalis Cortex. J. Ethnopharmacol. 2019, 236, 412–442. [Google Scholar] [CrossRef]
  28. Poivre, M.; Duez, P. Biological Activity and Toxicity of the Chinese Herb Magnolia officinalis Rehder & E. Wilson (Houpo) and Its Constituents. J. Zhejiang Univ. Sci. B 2017, 18, 194–214. [Google Scholar] [CrossRef]
  29. Niu, L.; Hou, Y.; Jiang, M.; Bai, G. The Rich Pharmacological Activities of Magnolia officinalis and Secondary Effects Based on Significant Intestinal Contributions. J. Ethnopharmacol. 2021, 281, 114524. [Google Scholar] [CrossRef]
  30. Verlinden, S. Changes in Mineral Nutrient Concentrations in Petunia Corollas during Development and Senescence. HortScience 2003, 38, 71–74. [Google Scholar] [CrossRef]
  31. Wang, T.-W.; Tan, J.; Li, L.-Y.; Yang, Y.; Zhang, X.-M.; Wang, J.-R. Combined Analysis of Inorganic Elements and Flavonoid Metabolites Reveals the Relationship between Flower Quality and Maturity of Sophora japonica L. Front. Plant Sci. 2023, 14, 1255637. [Google Scholar] [CrossRef] [PubMed]
  32. Gu, T.; Ren, H.; Wang, M.; Qian, W.; Hu, Y.; Yang, Y.; Yu, T.; Zhao, K.; Gao, S. Changes in Growth Parameters, C:N:P Stoichiometry and Non-Structural Carbohydrate Contents of Zanthoxylum armatum Seedling in Response to Five Soil Types. Horticulturae 2024, 10, 261. [Google Scholar] [CrossRef]
  33. Bro, R.; Smilde, A.K. Principal Component Analysis. Anal. Methods 2014, 6, 2812–2831. [Google Scholar] [CrossRef]
  34. Ho, T.-T.; Kwon, A.-R.; Yoon, Y.-J.; Paek, K.-Y.; Park, S.-Y. Endoreduplication Level Affects Flower Size and Development by Increasing Cell Size in Phalaenopsis and Doritaenopsis. Acta Physiol. Plant. 2016, 38, 190. [Google Scholar] [CrossRef]
  35. Steinacher, G.; Wagner, J. Flower Longevity and Duration of Pistil Receptivity in High Mountain Plants. Flora 2010, 205, 376–387. [Google Scholar] [CrossRef]
  36. Deng, Y.; Jia, X.; Liang, L.; Gu, C.; Sun, X. Morphological Anatomy, Sporogenesis and Gametogenesis in Flowering Process of Jasmine (Jasminum sambac Aiton). Sci. Hortic. 2016, 198, 257–266. [Google Scholar] [CrossRef]
  37. Mittal, I.; Jhanji, S.; Dhatt, K.K. Efficacy of Sodium Nitroprusside, a Nitric Oxide Donor, on Vase Life and Postharvest Attributes of Gladiolus Spikes. Acta Physiol. Plant. 2021, 43, 108. [Google Scholar] [CrossRef]
  38. Jhanji, S.; Kaur, G.; Kaur, R.; Dhatt, U.K. Physiological and Biochemical Changes during Flower Development and Senescence in Chrysanthemum and Gladiolus. Acta Physiol. Plant. 2023, 45, 14. [Google Scholar] [CrossRef]
  39. Van Doorn, W.G.; van Meeteren, U. Flower Opening and Closure: A Review. J. Exp. Bot. 2003, 54, 1801–1812. [Google Scholar] [CrossRef]
  40. Ma, S.; He, F.; Tian, D.; Zou, D.; Yan, Z.; Yang, Y.; Zhou, T.; Huang, K.; Shen, H.; Fang, J. Variations and Determinants of Carbon Content in Plants: A Global Synthesis. Biogeosciences 2018, 15, 693–702. [Google Scholar] [CrossRef]
  41. Gong, Z.; Sheng, M.; Zheng, X.; Zhang, Y.; Wang, L. Ecological Stoichiometry of C, N, P and Si of Karst Masson Pine Forests: Insights for the Forest Management in Southern China. Sci. Total Environ. 2024, 912, 169490. [Google Scholar] [CrossRef] [PubMed]
  42. Güsewell, S. N:P Ratios in Terrestrial Plants: Variation and Functional Significance. New Phytol. 2004, 164, 243–266. [Google Scholar] [CrossRef] [PubMed]
  43. Yan, Z.; Kim, N.; Han, W.; Guo, Y.; Han, T.; Du, E.; Fang, J. Effects of Nitrogen and Phosphorus Supply on Growth Rate, Leaf Stoichiometry, and Nutrient Resorption of Arabidopsis thaliana. Plant Soil 2015, 388, 147–155. [Google Scholar] [CrossRef]
  44. Guilpart, N.; Metay, A.; Gary, C. Grapevine Bud Fertility and Number of Berries per Bunch Are Determined by Water and Nitrogen Stress around Flowering in the Previous Year. Eur. J. Agron. 2014, 54, 9–20. [Google Scholar] [CrossRef]
  45. Lau, T.-C.; Stephenson, A.G. Effects of Soil Phosphorus on Pollen Production, Pollen Size, Pollen Phosphorus Content, and the Ability to Sire Seeds in Cucurbita pepo (Cucurbitaceae). Sex. Plant Reprod. 1994, 7, 215–220. [Google Scholar] [CrossRef]
  46. Atasay, A.; Akgül, H.; Uçgun, K.; Şan, B. Nitrogen Fertilization Affected the Pollen Production and Quality in Apple Cultivars “Jerseymac” and “Golden Delicious”. Acta Agric. Scand. Sect. B—Soil Plant Sci. 2013, 63, 460–465. [Google Scholar] [CrossRef]
  47. Ye, T.; Li, Y.; Zhang, J.; Hou, W.; Zhou, W.; Lu, J.; Xing, Y.; Li, X. Nitrogen, Phosphorus, and Potassium Fertilization Affects the Flowering Time of Rice (Oryza sativa L.). Glob. Ecol. Conserv. 2019, 20, e00753. [Google Scholar] [CrossRef]
  48. Fernandes, L.; Pereira, J.A.; Saraiva, J.A.; Ramalhosa, E.; Casal, S. Phytochemical Characterization of Borago officinalis L. and Centaurea cyanus L. during Flower Development. Food Res. Int. 2019, 123, 771–778. [Google Scholar] [CrossRef] [PubMed]
  49. Eshghi, S.; Tafazoli, E.; Dokhani, S.; Rahemi, M.; Emam, Y. Changes in Carbohydrate Contents in Shoot Tips, Leaves and Roots of Strawberry (Fragaria×ananassa Duch.) during Flower-Bud Differentiation. Sci. Hortic. 2007, 113, 255–260. [Google Scholar] [CrossRef]
  50. Hedhly, A.; Vogler, H.; Schmid, M.W.; Pazmino, D.; Gagliardini, V.; Santelia, D.; Grossniklaus, U. Starch Turnover and Metabolism during Flower and Early Embryo Development. Plant Physiol. 2016, 172, 2388–2402. [Google Scholar] [CrossRef]
  51. Sood, S.; Vyas, D.; Nagar, P.K. Physiological and Biochemical Studies during Flower Development in Two Rose Species. Sci. Hortic. 2006, 108, 390–396. [Google Scholar] [CrossRef]
Figure 1. Morphology of H. officinalis flowers at four developmental stages. Stage I, young bud stage. Stage II, bud expansion stage. Stage III, first bloom stage. Stage IV, full bloom stage.
Horticulturae 10 00784 g001
Figure 2. C, N, and P concentrations of three parts in H. officinalis flowers at four developmental stages. (A) C concentration, (B) N concentration, (C) P concentration. Data represented as mean ± S.E., n = 3. Lowercase letters represented significant differences at different stages, and capital letters represented significant differences in the three parts, with a significance level of 0.05.
Horticulturae 10 00784 g002
Figure 3. C, N, and P accumulations of whole H. officinalis flower at four developmental stages. (A) C accumulation, (B) N accumulation, (C) P accumulation. Data represented by mean ± S.E., n = 3. Lowercase letters represented significant differences at different stages, and capital letters represented significant differences in the three parts, with a significance level of 0.05.
Horticulturae 10 00784 g003
Figure 4. The elements allocation ratio of C, N, and P in H. officinalis flowers at four developmental stages. (A) C allocation ratio, (B) N allocation ratio, (C) P allocation ratio. Data represented by mean ± S.E., n = 3. Lowercase letters represented significant differences at different stages, and capital letters represented significant differences in the three parts, with a significance level of 0.05.
Horticulturae 10 00784 g004
Figure 5. Chemical stoichiometric ratio at four developmental stages of H. officinalis flowers. (A) C:N ratio, (B) C:P ratio, (C) N:P ratio. Data represented by mean ± S.E., n = 3. Lowercase letters represented significant differences at different stages, and capital letters represented significant differences in the three parts, with a significance level of 0.05.
Horticulturae 10 00784 g005
Figure 6. Glucose, starch, fructose and sucrose contents of three parts in H. officinalis flowers at four developmental stages. (A) Glucose content, (B) Starch content, (C) Fructose content, (D) Sucrose content. Data represented by mean ± S.E., n = 3. Lowercase letters represented significant differences at different stages, and capital letters represented significant differences in the three parts, with a significance level of 0.05.
Horticulturae 10 00784 g006
Figure 7. Glucose (A), starch (B), fructose (C) and sucrose (D) accumulations of H. officinalis flowers at four developmental stages. Data represented by mean ± S.E., n = 3. Lowercase letters represented significant differences at different stages, and capital letters represented significant differences in the three parts, with a significance level of 0.05.
Horticulturae 10 00784 g007
Figure 8. The allocation ratio of glucose (A), starch (B), fructose (C) and sucrose (D) in H. officinalis flowers at four developmental stages. Data represented by mean ± S.E., n = 3. Lowercase letters represented significant differences at different stages, and capital letters represented significant differences in the three parts, with a significance level of 0.05.
Horticulturae 10 00784 g008
Figure 9. Principal component analysis (PCA) of NSC content and stoichiometric characteristics in H. officinalis flowers at four developmental stages. (A) Distribution plots of PC1 and PC2. The numbers from 1 to 4 represented the stage of flower development. The blue arrows represented the loadings of each indicator in the PC1 and PC2 directions. The circles of different colour represented the 95% confidence ellipse of the corresponding colour parts. (B) Histogram from PC1to PC10. (C) Contribution proportion from tested parameters to PC1, PC2 and PC3.
Horticulturae 10 00784 g009
Table 1. Morphological indexes of three parts of H. officinalis flowers at four development stages.
StagePistilStamenPetal
Length (cm)Width (cm)Length (cm)Width (cm)Length (cm)Width (cm)
I5.00 ± 0.15 b1.34 ± 0.08 a1.88 ± 0.04 c0.22 ± 0.01 c6.28 ± 0.14 d3.13 ± 0.13 c
II5.51 ± 0.16 b1.96 ± 0.06 a2.17 ± 0.06 b0.26 ± 0.02 bc7.40 ± 0.07 c3.49 ± 0.12 c
III7.08 ± 0.21 a2.09 ± 0.05 a2.74 ± 0.10 a0.35 ± 0.01 a8.70 ± 0.15 b4.80 ± 0.09 b
IV7.31 ± 0.24 a2.15 ± 0.07 a2.56 ± 0.12 a0.30 ± 0.03 ab11.3 ± 0.32 a5.62 ± 0.14 a
Note: Letters represented significant differences at different development stages with a significance level of 0.05.
Table 2. Growth indexes of three parts of H. officinalis flowers at four development stages.
StagePistilStamenPetal
Fresh Weight/gDry Weight/gRWC (%)Fresh Weight/gDry Weight/gRWC (%)Fresh Weight/gDry Weight/gRWC (%)
I1.90 ± 0.09 c0.25 ± 0.01 c86.8 a1.74 ± 0.15 c0.26 ± 0.02 d84.8 a7.35 ± 0.50 d1.01 ± 0.08 d86.3 a
II4.15 ± 0.58 c0.65 ± 0.08 c84.1 b3.60 ± 0.51 b0.65 ± 0.09 c81.9 b16.3 ± 1.39 c2.07 ± 0.26 c87.4 a
III6.75 ± 0.87 b1.55 ± 0.19 b76.9 d4.15 ± 0.06 b1.12 ± 0.02 b73.0 d19.7 ± 1.20 b3.55 ± 0.21 b82.0 c
IV13.3 ± 1.31 a2.58 ± 0.27 a80.6 c6.52 ±0.64 a1.51 ± 0.15 a76.9 c28.1 ± 0.84 a4.50 ± 0.18 a84.0 b
Note: Letters represented significant differences at different development stages with a significance level of 0.05.
Table 3. The first three principal component load and contribution rates of percentage of variance (%) in H. officinalis flowers.
VariablesPC1PC2PC3
Glucose concentration0.349090.3236−0.15173
Starch concentration0.36917−0.10128−0.13488
Fructose concentration0.400930.19085−0.17745
Sucrose concentration0.082650.49450.21313
C concentration0.11207−0.105320.87582
N concentration−0.431730.014850.08933
P concentration−0.278320.424720.18284
C:N ratio0.43122−0.017010.206
C:P ratio0.30272−0.399010.15451
N:P ratio−0.14236−0.50285−0.08417
Percentage of variance (%)44.4%35.9%13.2%
Disclaimer/Publisher’s Note: The statements, opinions and data contained in all publications are solely those of the individual author(s) and contributor(s) and not of MDPI and/or the editor(s). MDPI and/or the editor(s) disclaim responsibility for any injury to people or property resulting from any ideas, methods, instructions or products referred to in the content.

