Abstract
Garlic, an asexually propagated crop, exhibits significant variation in its commercial traits and bioactive compounds. Despite its horticultural significance, the genetic pool available for breeding strategies is limited. This study aimed to assess the existing diversity within a popular garlic landrace from the region of “Nea Vissa”, Evros, Greece, focusing on phenotypic, biochemical, and molecular variation. In particular, bulb morphology, nutritional content, and organosulfur profiles were evaluated, along with genetic characterization using simple sequence repeat (SSR) markers to analyze intra-specific genetic variation. Our results revealed three distinct genetic clusters with moderate to low intra-varietal diversity. Morphological and biochemical characterization showed significant intra-specific diversity in both bulb morphology and nutritional content. Solid-phase microextraction (SPME) coupled with gas chromatography–mass spectrometry (GC–MS) analysis identified key volatile compounds, including allyl methyl disulfide and trisulfide, 1,2-dithiacyclopentene, cis-1-propenyl propyl disulfide, and cis-1-propenyl methyl disulfide in high abundances, suggesting that these were the predominant compounds characterizing the population. Our findings could be implemented to further enhance key phytonutrients in the local garlic population through breeding programs, targeting clones with high nutritional value and improved flavor and supporting germplasm conservation and utilization.
1. Introduction
Garlic (Allium sativum L.), a member of the Alliaceae family, is an ancient and widely cultivated bulbous crop known for its culinary and medicinal properties. Originating from Central Asia, garlic spread over centuries to Southeast Asia, Egypt, and the Mediterranean region, becoming the most widely consumed bulb of the Allium genus after onion [1,2]. Typically, garlic is a diploid sterile species (2n = 2x = 16), though tetraploid and triploid cultivars have also been identified [3,4]. Based on morphological, biochemical, and molecular markers, garlic genotypes have been clustered into four main eco-physiological groups, Longicuspis, Subtropical, Ophioscorodon, and Mediterranean Sativum, with the first group considered the wild progenitor of cultivated garlic [5].
Compared to other members of the Allium genus, garlic has greater nutritional and antimicrobial value, being especially rich in volatile compounds, which are responsible for its distinctive flavor. These include organosulfur compounds, as well as key bioactive compounds such as phenolics, minerals (mainly selenium and phosphorus), and saponins [6,7,8]. Among these, organosulfur-containing compounds, such as allicin and its diallyl disulfide, are primarily responsible for garlic’s distinctive flavor and bioactive properties. These volatile compounds play a key role in garlic’s antimicrobial, antioxidant, and anti-inflammatory effects, enhancing both its health benefits and flavor profile [9].
Garlic is predominantly propagated vegetatively through cloves or bulbils, which allows farmers to re-use planting material from the previous growing season. The inability of garlic to produce seeds serves as a genetic bottleneck in developing new varieties through modern breeding strategies. Consequently, garlic varieties typically arise from the clonal selection of natural variants, since wide phenotypic plasticity and diversity exist among clonal lineages with regard to bulb shape, size, and color, leaf length, growth habits, the number of cloves per bulb, and abiotic stress tolerance [1,10,11,12,13,14]. Nonetheless, this clonal selection is often accompanied by pathogen accumulation (e.g., insects, mites, fungi, and viruses) from the progeny, which can significantly limit crop yield [15]. In addition to its morphological diversity, garlic exhibits significant variation in its organoleptic properties and health-related compounds, not only among different eco-physiological groups but also within the same group [16]. Beyond genetic factors, growing conditions, soil properties, and cultivation practices can also influence the chemical composition of garlic bulbs [17,18]. Within this framework, landraces and local populations have recently regained attention as a valuable source of flavor and antioxidants [9]. Long-standing cultivation history in a specific region leads to the accumulation of natural variants, enhancing the morphological diversity of these ecotypes.
Typically, the characterization of garlic has been based on the assessment of phenotypic traits, such as the morphological descriptors developed by the UPOV (International Union for the Protection of New Varieties of Plants), CPVO (Community Plant Variety Office), or IPGRI (International Plant Genetic Resources Institute). Despite the effectiveness of these descriptors in studying the existing diversity of garlic collections [11], these morphological traits vary depending on the environmental conditions, making such a classification system potentially biased. In the past few decades, different sets of molecular markers such as isozymes, random amplified polymorphic DNA (RAPD), amplified fragment length polymorphisms (AFLPs), and simple sequence repeats (SSRs), also known as microsatellites, have been employed to assess genetic diversity along with morphological descriptors [19,20]. These molecular markers, along with preliminary morphological characterization, serve as effective tools for analyzing genetic diversity. In particular, SSR markers have become a powerful tool in identifying genetic variability and differentiating between cultivars and ecotypes, enabling the detection of unique genetic signatures that correlate with specific traits [16,21].
Overall, it has been presumed that the superior quality of local garlic varieties is closely linked to their unique growing conditions and traditional cultivation methods. Despite their significance for local communities, the total cultivated area in Greece has declined over the past decade, whereas the local varieties that once dominated certain regions are increasingly being overlooked in favor of newer cultivars, increasing the risk of genetic erosion and vulnerability [9,22]. With a long history of garlic cultivation, the region of “Nea Vissa” in Evros (northern Greece) is considered a key garlic-producing area, with the local variety becoming popular for its exceptional flavor and antimicrobial properties. Garlic has been cultivated in this region for generations, with traditional farming methods well-suited for the local soil and moderate climate. The local farmers, members of the “Nea Vissa” garlic cooperative, adhere to standardized, certified integrated management systems, ensuring uniformity in the garlic delivered to the market. Besides these protocols, there are still natural variations in morphological and nutritional properties that need to be captured to further improve the local garlic variety. Based on these considerations, the current study aims to explore the phenotypic, nutritional, and genotypic intra-varietal diversity of the “Nea Vissa” (NV) garlic population. To this end, bulb morphology, nutritional content, and organosulfur compounds were evaluated in individuals obtained from ten sampling sites in northern Greece, where the local garlic variety is cultivated. Furthermore, to analyze intra-specific genetic variation, the genetic characterization was estimated using a set of nine simple sequence repeat (SSR) markers. Understanding the existing variation will allow the identification and selection of superior material for breeding purposes. By integrating molecular, phytochemical, and phenotypic data, this research can develop a robust traceability system that can distinguish NV garlic from other garlic varieties, enabling the certification of propagating material and ultimately improving the quality and consistency of the crop.
2. Materials and Methods
2.1. Plant Material
The garlic population under investigation included eight individual clones of the local NV garlic variety sampled from ten different sampling sites in the “Nea Vissa” region, Evros (northern Greece) (Supplementary Table S1). Garlic cultivation was performed by members of the “Nea Vissa” garlic cooperative, following the same standardized, certified integrated management systems. The bulbs were harvested in June 2023 and, after one month of curing, they were used for morphological and biochemical characterization, as well as for the determination of polar sulfur compounds. The sampling sites, located within a small and geographically uniform region (Supplementary Figure S1), were characterized by relatively consistent environmental conditions, minimizing potential environmental effects on the traits studied. For SSR genotyping, fresh leaves from each of the 80 individuals of the population (eight individual samples per sampling area; Supplementary Table S1) were snap-frozen and stored at −20 °C. For the biochemical analyses of antioxidants and sulfur compounds, three garlic bulbs from each of the ten sampling sites were selected based on their visual homogeneity in size, color, and shape. From each bulb, the majority of the cloves were pooled, excluding those that were outliers in size or exhibited any signs of abnormal growth. This strategy was designed to minimize variability introduced by positional biases among the cloves. The chosen cloves were peeled and pulverized using liquid nitrogen before being stored at −80 °C until further analysis.
2.2. Qualitative and Quantitative Characterization
The qualitative traits of the NV garlic population were assessed using 17 CPVO descriptors related to bulbs and cloves. Specifically, the bulb shape in longitudinal sections (SL) and cross-sections (SC), the position of the root disc (RD), the shape of the base (SB), the compactness of cloves (CC), the color of dry external scales (CE), anthocyanin stripes on external scales (ASE), the skin adherence of external scales (SA), the thickness of external scales (TS), the number of cloves (NC), the distribution of cloves (DC), the presence of external cloves (EC), clove size (S), clove color (CS), the intensity of color scales (IC), anthocyanin stripes on scales (ASS), and flesh color (FC) were recorded in the NV garlic population obtained from the 10 different fields. In total, observations were made on ten randomly selected individual bulbs from each of the ten fields, excluding the border lines of each plot, resulting in 100 individuals per trait. Representative images of individuals of the NV local variety are shown in Figure 1. Furthermore, five quantitative traits—total bulb weight (BFW), the fresh (FW) and dry weight (DW) of cloves per bulb, the average number of cloves per bulb (CN), and total soluble solids (TSS, oBrix)—were measured. The dry weight (%) was assessed by drying peeled cloves in an oven at 72 °C until constant weight, while TSS was recorded using a digital refractometer (A. Krüss Optronic GmbH, Hamburg, Germany) after separating, peeling, and squeezing the cloves with a domestic garlic press.

Figure 1.
Bulbs from the 10 different NV sampling sites (NV1–NV10) of the local garlic population in Evros, Northern Greece.
2.3. Total Phenolic Content and Radical Scavenging Activity
Total soluble phenolic content (TPC) was determined in methanolic extracts using the Folin–Ciocalteu method, as previously described [23]. Briefly, a total of 200 mg of tissue powder was extracted with 5 mL of 80% methanol, followed by a 20 min ultrasonic bath and 30 min of stirring. The mixture was then left overnight at 4 °C to ensure complete extraction. For the Folin–Ciocalteu assay, 200 μL of the extract was mixed with 800 μL of Folin–Ciocalteu reagent, vortexed, and left to react for 2 min. Then, 2 mL of 7.5% (w/v) sodium carbonate (Na2CO3) solution and 7 mL of distilled water were added to reach a final volume of 10 mL. The mixture was vortexed and incubated in the dark for 30 min. Absorbance was then measured at 725 nm. Results were expressed as mg of gallic acid equivalents (GAE) g−1 DW. The antioxidant potential was determined spectrophotometrically on the same methanolic extracts as for TPC, using 2,2′-azino-bis (3-ethylbenzothiazoline-6-sulphonic acid) (ABTS) and 2,2-diphenyl-1-picrylhydrazyl (DPPH). For the ABTS assay, scavenging activity was determined using 7 mM ABTS reacting with 2.45 mM K2S2O8 by measuring the absorbance at 734 nm [24]. For the DPPH assay, radical scavenging activity was determined by preparing a 0.1 mM solution of DPPH in absolute ethanol and reading the absorbance at 517 nm [25]. All biological samples were measured in three technical replications, and the antioxidant capacity was expressed in μM Trolox g−1 DW.
2.4. Sample Preparation, Extraction, and SPME-GC–MS Analysis
A total of 0.25 g of fresh pulverized tissue was mixed with 1 mL H2O containing 2-octanol (2.13 μg mL−1) in headspace injection vials. Three individual biological replicates were used per population (NV1-NV10). The analysis was performed using an Agilent Intuvo 9000 system for fast GC coupled with an Agilent 7010B triple quadrupole mass spectrometer (Agilent Technologies, Santa Clara, CA, USA) equipped with an electronic ionization source operating at 70 eV and an autosampler PAL RSI 85 coupled with the SPME Fiber Tool. The SPME fiber was 2 cm DVB/CAR/PDMS 50/30 μm. The extraction conditions in the autosampler were performed as follows: 5 min of fiber conditioning at 270 °C, 10 min of sample incubation at 40 °C in the agitator (250 rpm), 35 min of fiber exposed to the headspace of the vial (adsorption), and 4 min of desorption into the injector at 250 °C. A DB-Wax Ultra Inert column (30 m × 0.25 mm id × 0.25 μm film thickness, Agilent Technology, Santa Clara, CA, USA) was used for the separation of components. The oven temperature program was as follows: initially at 50 °C (hold 4 min), up to 130 °C with ramp 3 °C/min (hold 1 min), then up to 250 °C with ramp 10 °C/min (hold 1 min), and finally up to 250 °C with 50 °C/min. The column was conditioned at 250 °C for 4 min (total chromatographic runtime of 44 min). The carrier gas was helium at a flow rate of 1.2 mL/min. The mass spectra were obtained using the mass detector in SCAN mode (MS1: 40–300 m/z). The transfer line and source temperatures were set at 250 °C and 230 °C, respectively. Data acquisition was performed using MassHunter Workstation software Version 10.0 (Agilent Technologies, Santa Clara, CA, USA), and identification of the compounds was conducted by matching their spectra with those of the available MS libraries (NIST 98). Semi-quantification of the identified sulfur-containing compounds was performed using the internal standard and the results were expressed as μg of 2-octanol g−1 FW.
2.5. SSR Genotyping
Fresh leaves from each of the 80 individuals of the population (eight individual samples per sampling area, as indicated in Supplementary Table S1) were collected in April 2023 (approximately 8 weeks before harvest), snap-frozen, and stored at −20 °C for DNA extraction. Samples were ground into a fine powder under liquid nitrogen, and the genomic DNA was extracted using the Nucleospin Plant II (Macherey-Nagel, Wangara, WA, USA) kit following the manufacturer’s instructions. DNA yield was determined using Nanodrop 2000 (NanoDrop Technologies, Wilmington, DE, USA), whereas DNA purity and quality were assessed using agarose gel electrophoresis.
A set of nine microsatellite markers were selected for genotyping [26]. Two multiplex PCR assays were designed, each containing a panel of SSR markers. The fluorophores used to label the SSR markers were FAM, ROX, TAMRA, and HEX, facilitating the simultaneous detection of multiple loci within a single reaction. The details of the SSR markers, including their names, dye labels, amplicon size ranges (min–max), and sequences of forward (F) and reverse (R) primers, are listed in Supplementary Table S2 for Multiplex 1 and Multiplex 2.
PCR reactions were carried out in a total volume of 25 μL, consisting of 5 μL of the PCR master mix, 1 μL of template DNA, 1 μL of the forward primer mix, and 1 μL of the reverse primer mix. The thermal cycling conditions for PCR amplification were optimized for each multiplex and are summarized below. For Multiplex 1: initial denaturation at 95 °C for 5 min, denaturation at 95 °C for 30 s, annealing at specific temperatures for 30 s, and extension at 72 °C for 30 s, repeated for 35 cycles, with a final extension at 72 °C for 10 min. For Multiplex 2: initial denaturation at 94 °C for 5 min, denaturation at 94 °C for 30 s, annealing at specific temperatures for 45 s, and extension at 72 °C for 1 min, repeated for 30 cycles, with a final extension at 72 °C for 7 min.
PCR products were separated and detected using capillary electrophoresis. Fragment analysis was conducted in a SeqStudio Genetic Analyzer (ThermoFisher Scientific, Waltham, MS, USA) alongside a LIZ600 internal size standard (Applied Biosystems, Foster City, CA, USA). The sizes of the amplified fragments were determined using GeneMapper v4 software (Thermo Fisher Scientific, Waltham, MA, USA). These data were used to calculate the error rate per reaction and per allele [27].
2.6. Genetic Diversity and Population Structure Analysis
To establish the genetic relatedness of the NV population, the allelic data obtained from fragment analysis were subjected to appropriate statistical analyses to assess the genetic diversity, population structure, and other relevant parameters. In particular, the number of alleles (Na), the number of effective alleles (Ne), the number of private alleles (Np), the Shannon information index (I), and the expected heterozygosity (He) were calculated using GenAlEx [28]. Nei’s genetic diversity and the polymorphism information content (PIC) were calculated using PowerMarker 3.25 [29]. The probability of identity (PI) was calculated using the formula PI = 1 − ∑ pi4 + ∑∑(2pipj), where pi and pj are the frequency of the ith and jth alleles, respectively, in IDENTITY 1.0 (Centre for Applied Genetics, University of Agricultural Sciences, Vienna, Austria). Principal component analysis (PCA) was performed on the SSR matrix and visualized using ggplot2 in RStudio version 4.4.0.
Population structure analysis was conducted following the Bayesian approach implemented in STRUCTURE v2.3.2 [30]. The optimal number of clusters was determined using the elbow method, silhouette method, and gap statistic, with k-means clustering applied subsequently using the web-based software StructureSelector v1.0 [31]. The PCA plot included clusters and ellipses to visualize the data structure. The genetic distance matrix was calculated using the ape package, and the most distant sample was identified. A phylogenetic tree was constructed using the unweighted pair group method with arithmetic means (UPGMA), implemented in the phangorn package, with the tree rooted using an outgroup and colored based on cluster assignments.
2.7. Statistical Analysis
To characterize the phenotypic frequencies, the Shannon–Weaver diversity index (H′) was calculated for both qualitative and quantitative traits, as previously described [32,33]. For quantitative traits, measurements were transformed into ordinal values [34,35]. The H′ index was classified as low (0.10 < H′ < 0.40), intermediate (0.40 < H′ < 0.60), or high (H′ > 0.60). All traits were examined for normal distribution using the Kolmogorov–Smirnov test, except for four traits (shape in longitudinal section, position of root disc, shape of base, and color of flesh), which showed identical values across the population. Lower levels of D indicated that the distributions were similar, while higher values indicated that the distributions were likely to be different. Qualitative traits were not normally distributed (Supplementary Table S3), whereas quantitative traits were all normally distributed (Supplementary Table S4). The coefficient of variation (CV) was also calculated for quantitative traits based on the formula CV (%) = (standard deviation/mean values) × 100.
Parametric Pearson correlation coefficients were used to investigate potential correlations between qualitative and biochemical traits, as well as organosulfur compounds [34], using the corrplot package in Rstudio. Multivariate principal component analysis (PCA) was performed to evaluate the contribution of each trait to the total phenotypic diversity.
For the antioxidant capacity and organosulfur composition of garlic bulbs from each sampling site, the results were expressed as mean values with standard deviations. Boxplots with notches were generated in BoxPlotR [36]. Different letters represent significant differences based on Tukey’s honest significance difference (HSD) test with p < 0.05, as determined and visualized using the ggplot2 package in RStudio. Heatmaps were generated in TBtools (a toolkit for biologists integrating various biological data handling tools, v2) [37], using z-score normalization. The clustering pattern of the NV population was determined using Ward’s method and Euclidean distance.
3. Results
3.1. Morphological Diversity Within the NV Garlic Population
The results of the morphological characterization of the NV population (100 individuals) from the ten sampling sites based on CPVO descriptors are provided in Supplementary Table S3. Regardless of the individual’s sampling field, the NV population was characterized by a transverse broad elliptic shape in the longitudinal section (SL), a flat position of the root disc (RD), a flat base of the bulb base (SB), and a yellowish color of cloves (FC). Furthermore, the majority of the individuals in the NV population also displayed an elliptic shape in their cross-sections (SC; 79%), a yellowish-white ground color in their dry external scales (CE; 90%), a radial distribution of cloves (DC; 95%), the absence of external cloves (EC; 96%), and a weak intensity of color of scale (IC; 92%). By contrast, a greater degree of variation within the NV population was evident for the compactness of cloves (CC; 59% compact, 21% medium to compact, and 20% compact to very compact), the presence and absence of anthocyanin stripes on dry external scales (ASE; 52% and 48%, respectively), and skin adherence of dry external scales (SA; 54% medium to strong, 29% medium, and 17% strong), as well as their thickness (TS; 60% medium, 35% medium to thick, and 5% thick). With regard to the cloves per bulb, a discernible variation was recorded concerning their number per bulb (NC; 46% medium to many, 35% medium, and 19% many), their size (S; 39% large, 32% medium to large, 19% medium, and 10% large to very large), their scale color (CS; 69% cream and 31% purple), and the presence of anthocyanin stripes (ASS; 63% absent and 37% present). The Shannon–Weaver diversity index for the NV population varied from 0 (SL, RD, SB, and FC) to 0.999 (ASE) (Figure 2A,C). Most of the traits exhibited a relatively low H′ (≤0.40). Among the bulb morphological traits, the highest H’ was observed for ASE (0.999) and SC (0.741), whereas among the clove traits, ASS exhibited the highest H’ (0.999). These findings clearly suggested that within the NV local variety, the highest morphological variation was primarily due to the anthocyanin stripes on dry external scales and on clove scales.

Figure 2.
Genetic diversity and variation analysis of the NV garlic population. (A) Bar chart of the diversity index (H′) for qualitative morphological descriptors; (B) Bar chart of the diversity index (H′) for quantitative morphological traits; (C) The proportion of classes for selected morphological descriptors exerting the highest diversity among the population; (D) Violin plots of the population variation regarding quantitative morphological traits. BFW, FW, and DW are expressed in gr, while TSS is in oBrix. SL: bulb shape in longitudinal section; SC: bulb shape in cross-section; RD: position of root disc; SB: shape of base; CC: compactness of cloves; CE: color of dry external scales; ASE: anthocyanin stripes on external scales; SA: skin adherence of external scales; TS: thickness of external scales; NC: number of cloves; DC: distribution of cloves; EC: presence of external cloves; S: clove size; CS: clove color; IC: intensity of color scales; ASS: anthocyanin stripes on scale; FC: flesh color; BFW: total bulb weight; FW: fresh weight of cloves in a bulb; DW: dry weight of cloves in a bulb; CN: average number of cloves per bulb; TSS: total soluble solids (oBrix).
Accordingly, the quantitative morphological traits that were also measured to characterize the NV population displayed low-to-moderate diversity (Figure 2B,D; Supplementary Table S4). In particular, traits such as FW and BFW had moderate CV% values (29.27% and 23.37%, respectively), whereas traits such as CN, TSS content, and DW had low CV% values (10.60%, 5.45%, and 3.94%, respectively). For all these quantitative traits, the estimated H’, after transforming continuous traits into three discrete ranks (ordinal traits), was relatively high (≥0.60).
PCA was carried out to partition the qualitative and quantitative traits associated with the NV garlic population. A trait biplot analysis was performed and displayed for the first two principal components for qualitative and quantitative traits (Figure 3). The distribution of the 17 qualitative variables based on PC1 and PC2 revealed part of the underlying phenotypic variance (37.2%) within the NV population (Figure 3A). Kaiser’s criterion (eigenvalue > 1) was satisfied by six components, with a total of 74.04% of the variance being explained (Supplementary Table S5). Specifically, the first component (PC1), which accounted for 18.7% of the total variance, was strongly associated with ASE, ASS, and CS, clearly indicating that the presence of anthocyanin stripes in either external cloves or clove scales, as well as the scale color, had the highest discriminatory ability (Supplementary Figure S2). Traits such as NC, S, TS, and SA, being related to the number and size of cloves, or the thickness and the skin adherence of dry external scales, were the most important traits contributing to the second component (PC2), explaining 18.5% of the total variance.
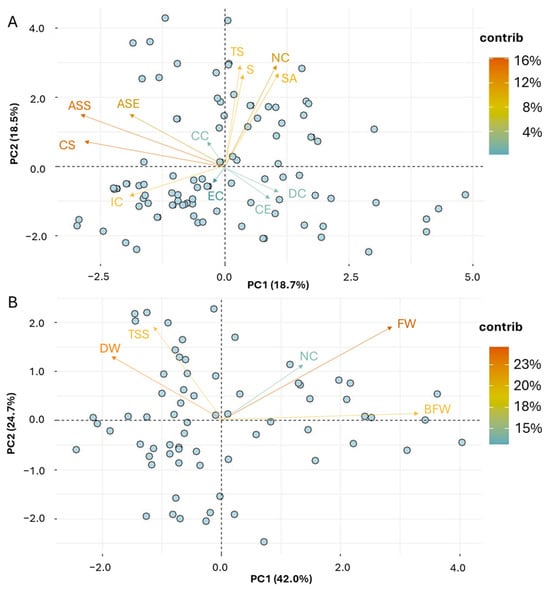
Figure 3.
PCA biplot graph representing the NV garlic population in two main principal components for the morphological traits ((A) qualitative; (B) quantitative). The vector’s direction and length indicate the traits’ contribution to the first two components in the PCA. The transparency of the trait vectors represents the contribution to the variance in the dataset, ranging from 4% (lightest) to 16% (darkest) for the qualitative data, and from 15% to 23% for the quantitative data.
Accordingly, the distribution of the five quantitative variables in PC1 and PC2 explained a large portion of morphological variation (66.62%) within the NV population (Figure 3B). The first PC, which accounted for 42% of the total variance, was strongly correlated with BFW, FW, and DW, suggesting that fresh and dry weights of bulbs and cloves had the highest discriminatory capacity among the morphological (quantitative) traits. The other traits, TSS and NC, were related to PC2 and PC3, respectively (Supplementary Figure S2).
3.2. Evaluation of Antioxidant Content and Correlations with Morphological Traits
Significant variation (p < 0.05) was found in the bulb content of total phenolic contents and antioxidant capacity among the garlic populations (NV1 to NV10) (Figure 4). In particular, TPC varied nearly 3-fold within the population, ranging from 0.41 to 1.21 mg GAE g−1 DW, with a mean of 0.79 mg GAE g−1 DW. Among the populations, the highest TPC content was observed in NV7 and NV5, while the lowest was seen in NV1, NV2, NV6, and NV9. The total antioxidant capacity of garlic bulbs was determined using both ABTS and DPPH assays. The total antioxidant capacity, as measured by an ABTS assay, varied from 0.17 to 0.54 mg Trolox g−1 DW, displaying a 3-fold variation within the NV populations. The highest values were recorded in NV7 and NV5, while the lowest values were seen in NV1 and NV3. Results obtained from the DPPH method were slightly different, reflecting the differences in the reaction media between the two assays. The highest values were recorded in NV4, and the lowest values in NV1 and NV5, exhibiting a 9-fold variation and a mean value of 7.9 mg Trolox g−1 DW. The populations with the highest TPC also exerted the highest values of ABTS antioxidant capacity, suggesting that hydrophilic antioxidants, such as phenols, were likely better estimated by the ABTS assay, at least in garlic bulbs.
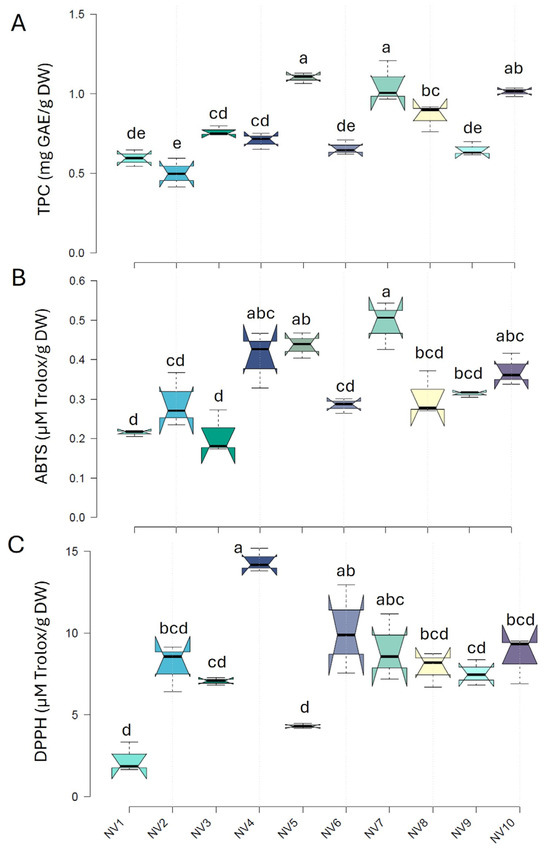
Figure 4.
Total phenolic content (TPC) (A) and ABTS (B) and DPPH (C) antioxidant capacities of the cloves of the NV garlic population originating from the ten sampling areas (NV1–NV10). Data represent mean values of three biological replicates and two technical replications ± SD. Different letters indicate significant differences based on Tukey’s HSD test (p < 0.05).
3.3. Organosulfur Compounds in the Bulb of the NV Garlic Population
The organosulfur compounds found in garlic bulbs, including several thiols, thiosulfinates, monosulfides, disulfides, polysulfides, and cyclic sulfides, constitute the major active components of fresh garlic with important nutraceutical, antifungal, and antimicrobial properties. The SPME GC–MS analysis identified 43 different organosulfur compounds and alkanes in the NV population (Supplementary Table S6). On average, 31 organosulfur compounds were identified following our analytical protocol, with the highest number detected in the bulbs of NV3 and NV8 (31 compounds), and the lowest number in the bulbs of NV4 (23 compounds). Among the organosulfur compounds detected in high abundance were the acyclic monosulfides diallyl sulfide, (E)-allyl(prop-1-en-1-yl)sulfane, and (Z)-allyl(prop-1-en-1-yl)sulfane; the acyclic disulfides allyl methyl disulfide, cis-1-propenyl methyl disulfide, cis-1-propenyl propyl disulfide, and 1-allyl-2-isopropyldisulfane; and the trisulfides allyl methyl trisulfide and diallyl trisulfide (Figure 5A). Among the highly abundant cyclic sulfides identified in the NV population were methyl thiirane, 2,4-dimethyl thiophene, 2-vinyl-4H-1,3-dithiine, and 3-vinyl-1,2-dithiacyclohex-4-ene (Supplementary Table S6). Lastly, the acyclic thiol allyl mercaptan (also known as allyl-thiol) and the cyclic thiol benzenethiol were detected in variable amounts depending on the sampling site.

Figure 5.
(A) The content of selected organosulfur compounds, expressed as μg 100 g−1 FW, quantified in the bulbs of the NV population originating from ten sampling sites (NV1–NV10). Data represent the mean values of three biological replicates ± SD. Different letters indicate significant differences based on Tukey’s HSD test (p < 0.05); (B) Heatmap performed on quantitative traits, TPC, and antioxidant activities (ABTS and DPPH) measured in the bulbs of the NV population from the ten sampling sites (NV1–NV10). Each cell represents the z-score normalized value of each trait. The clustering pattern of the NV population was performed using Ward’s method and Euclidean distance.
Among these organosulfur compounds, allyl methyl disulfide and trisulfide, 1,2-dithiacyclopentene, cis-1-propenyl propyl disulfide, cis-1-propenyl methyl disulfide, diallyl sulfide, methyl thiirane, 1-allyl-2-isopropyldisulfane, 5-methyl-1,2,3,4-tetrathiane, and cis-dipropenyl disulfide were detected and quantified (relative quantification to n-octanol) in relatively high amounts in all NV individuals from the ten sampling sites (Supplementary Table S6), suggesting that these are the predominant compounds characterizing the NV landrace. Allyl methyl disulfide was one of the most abundant volatile compounds (Figure 5A), accounting for up to 33% of total organosulfur compounds detected following our analytical protocol, except in NV8 (0.7%) and NV10 (1.3%). In the case of NV8, the most abundant compound was 1,2-dithiacyclopentene (21.7%), while in NV10, allyl methyl trisulfide was the most abundant (23.4%). Accordingly, allyl-methyl trisulfide was also highly abundant, regardless of the sampling site. Bulbs from NV5 had the highest amounts of both organosulfur compounds. Regarding cis-1-propenyl-propyl disulfide and methyl disulfide, the highest abundances were recorded in NV6 or NV7 and NV10, respectively. The other key organosulfur compounds contributing to garlic’s aroma, diallyl sulfide and diallyl trisulfide, were highly accumulated in the bulbs of NV4, NV6, and NV9 in the first case, and in NV4 and NV9 in the second case.
Heatmap clustering of the bulbs of the NV landrace grouped the NV sampling sites according to quantitative traits, antioxidants, and the top 20 organosulfur compounds (z-score normalized data) into two main subgroups containing the majority of individuals (Figure 5B). The first cluster (NV6, NV7, NV8, and NV10) was characterized by low bulb and clove FW and high DW and TPC content, as well as a moderate amount of organosulfur compounds. In the second cluster (NV1, NV2, NV3, and NV9), bulb and clove FW, as well as NC, were high, while antioxidants (TPC and activities) and organosulfur compounds showed lower accumulation levels compared to the first cluster. Interestingly, NV4 and NV5 showed weak correlations with the other NV sampling sites. Bulbs of NV5 were characterized by high TSS, TPC, and ABTS scavenging activity, along with the highest organosulfur abundance. Accordingly, the bulbs of NV4 exhibited the highest DPPH scavenging capacity, along with the highest abundance of two key organosulfur compounds, i.e., diallyl trisulfide and 2-vinyl-4H-1,3-dithiine, which contribute to either garlic’s aroma and antifungal potential or its anti-hypertensive effect, respectively.
Pearson’s correlation coefficient analysis between quantitative traits, antioxidants, and organosulfur compounds was performed for all NV garlic populations (Supplementary Figure S3). Among the quantitative phenotypic traits, bulb FW was positively correlated with clove FW (r = 0.682) and negatively with DW (r = −0.890). Among the antioxidant-related traits, TPC was positively correlated with ABTS (r = 0.709) and negatively with bulb FW (r = −0.644), indicating that smaller bulbs have a higher phenolic content in their cloves compared to larger ones. With regard to organosulfur compounds, a positive correlation was evident between DW and allyl methyl trisulfide (r = 0.604), cis-1-propenyl methyl disulfide (r = 0.651), cis-dipropenyl disulfide (r = 0.617), and methyl thiirane (r = 0.633). The content of the last two compounds was also positively correlated with TSS content (r = 0.650 and r = 0.690, respectively), while bulb FW was negatively correlated with allyl methyl trisulfide (r = −0.620), cis-dipropenyl disulfide (r = −0.607), and methyl thiirane (r = −0.604). Some strong positive correlations were also identified between TPC and allyl methyl trisulfide (r = 0.688), as well as DPPH capacity and diallyl trisulfide (r = 0.607), whereas negative correlations were detected between diallyl sulfide and TPC (r = −0.910) or ABTS (r = −0.611). Other significant correlations were identified between allyl methyl trisulfide and cis-1-propenyl methyl disulfide (r = 0.746), diallyl trisulfide and 1,2-dithiacyclopentene (r = 0.711), methyl thiirane and cis-dipropenyl disulfide (r = 0.731), diallyl sulfide and cis-1-propenyl methyl disulfide (r = −0.719), and cis-1-propenyl propyl disulfide and 1,2-dithiacyclopentene (r = −0.665).
3.4. Intra-Variety Diversity of the NV Garlic Population Using Microsatellite Markers
The study of genetic diversity within the NV garlic population from ten different sampling sites in the Evros region (NV1–NV10) revealed moderate-to-low intra-variety differentiation through microsatellite (SSR) analysis. A total of 16 alleles, with sizes ranging from 160 to 305 bp, were identified for the nine SSR loci across the 80 individuals of the population (Supplementary Table S1). Polymorphism was detected in four of them (AsESSR-14, AsESSR-83, AsESSR-91, and ACM086) (Supplementary Table S7). The highest number of alleles (Na) was observed for AsESSR-83, followed by ACM086. The average number of effective alleles (Ne) was 1.47, ranging from 1.00 (for the SSRs with one allele) to 3.15 (AsESSR-83), whereas the Shannon information index (I) varied from 0.000 to 1.263, with an average of 0.321 across loci, indicating a low level of genetic diversity within the NV population. The polymorphic information content (PIC) values ranged from 0.000 to 0.949, with an overall moderate mean of 0.233. The highest diversity was observed at the AsESSR-83 locus, which showed a high PIC value (0.949) and the highest heterozygosity (He) value (0.682), suggesting that this locus has high discriminatory power in assessing intra-variety diversity in the local NV variety. Other loci that had moderate discriminatory powers were AsESSR-14 and AsESSR-91, with PIC and I values equal to 0.500 and 0.693, respectively, for both loci. Similar to He values, the unbiased expected heterozygosity (uHe) for the AsESSR-83 locus was high (0.687), supporting its robustness in estimating genetic diversity. The observed heterozygosity (Ho) for AsESSR-83 was also high, although slightly lower than its He value, suggesting a degree of inbreeding but without detracting from its overall utility. For the AsESSR-14 and AsESSR-91 loci, He values were lower than Ho values, indicating a possible excess of heterozygotes. However, their lower He, uHe, and PIC values compared to AsESSR-83 suggested that these markers are less informative for studying the comprehensive diversity of the NV population. The rest of the loci had very low or zero He and Ho values, indicating their limited utility for studying intra-varietal diversity within the NV population.
3.5. Cluster Analysis, Genetic Relationships, and Structures of the NV Garlic Population
Cluster analysis and genetic structure assessment using PCA and multiple clustering methods provided insights into the relationships among the 80 NV individuals from the ten sampling sites. PCA revealed four distinct clusters, with the first two principal components (PC1 and PC2) accounting for 68.58% of genetic variance (Figure 6A), distributed as 48.07% and 20.51% for PC1 and PC2, respectively. All individuals from NV1, NV2, NV3, NV4, NV6, and NV9 were grouped into two closely related main clusters. By contrast, six individuals out of the total eighty (NV5.8, NV7.2, NV8.8, NV10.1, NV10.2, and NV10.3) from the remaining NV populations formed distinct and separate clusters. Cluster validation methods, including the silhouette, elbow, gap statistic, and scree plot methods, consistently identified four clusters as the optimal grouping (Figure 6B–E). The UPGMA phylogenetic tree also aligned with the PCA results, grouping NV populations into four principal clusters and illustrating hierarchical relationships, with each cluster reflecting different levels of genetic variability (Figure 6F).
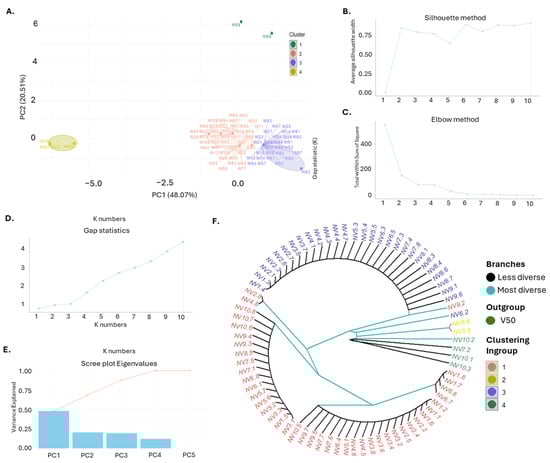
Figure 6.
Genetic Diversity and Population Structure Analysis. (A) Principal Component Analysis (PCA) of the NV garlic population originating from the ten sampling sites (NV1–NV10), as described in Supplementary Table S1. Each point represents an individual sample, color-coded by cluster (Cluster 1: salmon, Cluster 2: yellow, Cluster 3: blue, Cluster 4: green). Ellipses indicate the boundaries of each cluster; (B) Optimal number of clusters determined by the Silhouette method, (C) Optimal number of clusters determined by the Elbow method, (D) Optimal number of clusters determined by Gap Statistics; (E) Scree plot of eigenvalues showing the percentage of variance explained by each principal component; (F) UPGMA rooted dendrogram illustrating the genetic relationships among the garlic genotypes. The dendrogram is rooted using the outgroup NV7.2. Branches are color-coded to indicate diversity (less diverse branches in light blue and more diverse branches in black), with clustering consistent with PCA results.
Using STRUCTURE analysis, the ΔK method, and the mean log probability [38], three distinct genetic subpopulations (K = 3) were identified in the NV population (Figure 7). This three-cluster structure suggested stable genetic organization within the NV population, highlighting the existence of three genetically consistent subgroups. Overall, the genetic study presented herein revealed rather low-to-moderate intra-specific diversity and high relatedness within the NV local variety.
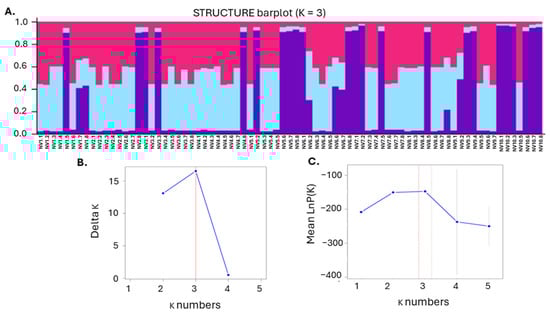
Figure 7.
Genetic structure and optimal cluster determination. (A) STRUCTURE bar plot for K = 3, showing the assignment of individuals to four genetic clusters. Each bar represents an individual sample, with different colors indicating the proportion of ancestry from each of the four clusters; (B) Delta K values for each cluster number (K), indicating that the optimal number of clusters based on the highest peak is at K = 3; (C) Mean log probability of the data for varying numbers of clusters (K), with error bars representing one standard deviation, highlighting that K = 3 provides the best fit according to the peak of the curve.
4. Discussion
Local varieties and landraces of crop species selected by growers in their areas of adaptation to meet specific local needs have preserved valuable traits and genes that may be critical for crop improvement [1,34,39]. Nonetheless, over time, these local varieties have developed various levels of heterogeneity, likely due to genetic recombination and mutations. Even though the majority of garlic varieties are asexually propagated, significant phenotypic variations do exist within a local population, presumably influenced by environmental conditions and cultivation practices [1,40], which can often reduce crop yield and commercial value. A considerable number of studies have evaluated genetic diversity among different garlic landraces and local varieties [9,11,22,26,41]. However, systematic studies focusing on the existing variation within a population remain limited. In this context, unraveling the intra-varietal diversity present in phenotypic, biochemical, and molecular traits within a garlic population is thus both intriguing and essential to direct breeding strategies and preserve on-farm diversity, varietal uniqueness, and sustainability.
While the emblematic NV garlic variety, originating from the Evros region in northern Greece, is considered a single local variety with high phenotypic consistency, notable intra-varietal diversity in certain morphological traits was evident. In particular, several qualitative traits showed high uniformity among the NV population, suggesting a strong genetic basis, likely preserved through traditional cultivation practices and with limited influence from environmental factors. Consequently, these characteristics remain consistent across the different growing fields. These findings reinforce the general observation that landraces typically exhibit varying levels of variability, with certain traits remaining uniform within a landrace and serving as reliable markers for identification [42]. Conversely, traits related to the presence of anthocyanin stripes, clove compactness, and skin adherence exhibited greater variability, suggesting that while these traits are genetically controlled, they are also influenced by local environmental heterogeneity, cultivation practices, and post-harvest handling [11,18,43]. Additionally, variation in clove-specific traits, such as clove number per bulb, size, scale color, and anthocyanin stripe intensity, emphasizes the interplay between genetic variability and environmental influences within the NV population. Anthocyanins, as secondary metabolites, are well-documented for their role in plant stress responses and can be influenced by various environmental factors, including light intensity, temperature fluctuations, and nutrient availability [44]. Practices [44] across the ten sampling fields may contribute to the observed variability in anthocyanin-related traits. It is also suggested that anthocyanin accumulation in plant species is a key characteristic contributing to the overall variation among landraces [45]. Beyond environmental factors, the high H’ values for ASE and ASS may also reflect the genetic complexity of anthocyanin pigmentation, suggesting their potential as phenotypic markers for assessing genetic diversity and identifying subpopulations within the NV garlic landrace. These findings are in line with previous studies emphasizing the significance of morphological and agronomic characteristics in differentiating garlic germplasms [11,46,47].
Similarly, the majority of quantitative morphological traits in the NV garlic population displayed low-to-moderate diversity. Among these traits, total fresh weight per bulb is particularly noteworthy, as it is a critical determinant of garlic productivity [18,48]. Within the NV population, this trait was stable, suggesting consistent performance in terms of productivity. The slight differences in bulb and clove size, as well as the number of cloves per bulb, could be related to varying fertilization regimes and soil properties, as previously reported [22]. Among the quantitative traits, those related to fresh and dry weight were found to significantly contribute to the morphological variation observed within the NV garlic population, exhibiting the highest discriminatory capacity and highlighting their potential utility in breeding and genetic studies.
Garlic is considered relatively rich in phenolic compounds, especially colored varieties, containing significant amounts of β-resorcylic acid, pyrogallol, gallic acid, rutin, protocatechuic acid, and quercetin [49,50]. However, there is great variation in the TPC, observed not only among the various genotypes and ecotypes but also between the applied cultivation practices and growing conditions [51]. The observed variation in TPC and antioxidant capacity within the NV garlic population highlights the substantial biochemical diversity of this landrace. The nearly three-fold variations in TPC and ABTS antioxidant capacity are in accordance with findings from previous studies, indicating significant variability across garlic populations [52]. The phenolic and antioxidant contents of garlic bulbs are highly regulated by various genetic, agronomic, and environmental factors, as well as their interactions [53]. This diversity is crucial for identifying individual clones with superior bioactive compounds and antioxidant properties, such as NV5 and NV7, which demonstrated the highest TPC and antioxidant capacities. The positive correlation between TPC and ABTS antioxidant activity underscores the significant role of phenolic compounds in contributing to antioxidant activity, consistent with earlier studies [54,55,56]. In contrast, the weaker correlation with DPPH reflects differences in the reaction mechanisms of the assays, as previously noted in comparative analyses of hydrophilic and lipophilic antioxidants [57]. The clustering of the population based on morphological and biochemical traits revealed distinct clusters, such as the one containing NV5, NV7, and NV10, which exhibited high TPC and antioxidant activity, emphasizing their potential for breeding programs targeting nutritional enhancement. Conversely, populations with high FW and BFW exhibited lower antioxidant potential, indicating a potential trade-off between yield-related traits and biochemical properties, which are likely affected by both growing conditions and cultivation practices [22].
Correlations among quantitative traits provide further insight into these relationships. A strong positive correlation between bulb fresh weight (BFW) and clove fresh weight (FW), coupled with a negative correlation between BFW and both dry weight (DW) and total phenolic content (TPC), further supports the idea that larger bulbs generally exhibit a higher moisture content, which can dilute phenolic concentrations [58]. Additionally, moderate correlations between TPC and DW further reinforce the importance of dry matter as a key determinant of antioxidant potential. Interestingly, garlic bulbs with a higher number of cloves and greater fresh weight tend to exhibit lower antioxidant potentials. This pattern may be explained by the allocation of resources toward primary growth processes in high-yielding bulbs, which can reduce the synthesis of secondary metabolites such as phenolics and flavonoids that contribute to antioxidant activity. However, it is worth noting that some high-yielding garlic types demonstrate enhanced nutritional properties, suggesting that yield and antioxidant potential are not strictly inversely related [59].
The health benefits of garlic are primarily attributed to its diverse and complex array of volatile organosulfur compounds, including well-known bioactive molecules such as diallyl thiosulfonate (allicin), diallyl sulfide, diallyl disulfide, diallyl trisulfide, S-allyl-cysteine, and S-allyl-cysteine sulfoxide (alliin) [42,60,61,62]. In this study, a total of 43 organosulfur compounds were identified, underscoring the complexity of garlic’s aromatic and bioactive profiles. Key volatiles such as diallyl disulfide and trisulfide, as well as allyl methyl disulfide, were particularly abundant, especially in the NV4, NV6, and NV9 populations, highlighting important health benefits that have been well-documented in previous studies [51,63]. On the other hand, allyl methyl disulfide, one of the main compounds in garlic known for its significant contribution to its aroma and bioactive properties [64,65], was among the most abundant organosulfur compounds detected in the majority of NV bulbs, regardless of the sampling site. Interestingly, allyl methyl trisulfide, a major lipid-soluble organosulfur compound with known health benefits [66], was dominant in the NV10 samples and maintained a high abundance across all sampling sites. Meanwhile, samples from NV5 exhibited the highest levels of both allyl methyl disulfide and trisulfide, highlighting their potential as a valuable source for both aromatic and functional applications. Furthermore, cis-1-propenyl-propyl disulfide, an aroma compound derived from alliin [67], was most abundant in NV6 and NV7, reinforcing the existing diversity of organosulfur profiles within the NV population. Compounds such as diallyl disulfide and trisulfide, which contribute to garlic’s distinctive aroma and flavor [68], were notably accumulated in NV4, NV6, and NV9, with trisulfide being particularly abundant in NV4 and NV9. Notably, diallyl disulfide has been previously reported as a potential anticarcinogenic agent, exhibiting strong anti-tumor activity against many types of tumor cells [69]. The distinct distribution and variation of these organosulfur compounds across the NV garlic population emphasize their potential for selective breeding to enhance specific bioactive, flavor, and aromatic traits.
The clustering of the garlic populations based on quantitative traits, antioxidant content, and organosulfur compound accumulation revealed distinct groupings that reflect both agronomic and bioactive properties. The first cluster (NV6, NV7, NV9, NV8, and NV10) was characterized by lower bulb and clove FW but higher DW, TPC, and organosulfur compounds, indicating a trade-off between bulb size and bioactive content. This inverse relationship aligns with previous findings in Allium cepa, where smaller bulbs were found to accumulate higher phenolic concentrations, suggesting a link between bulb development and phenolic allocation within the plant [70]. Such patterns suggest that smaller bulbs across Allium species may prioritize the synthesis and storage of bioactive compounds, possibly as a defense mechanism against environmental stressors or due to reduced dilution effects caused by higher moisture contents in larger bulbs. Notably, the contrasting second cluster of larger bulbs (NV1, NV2, NV3, and NV9) exhibited higher bulb and clove FW but lower antioxidant and organosulfur compound content, suggesting a prioritization of growth over bioactive compound accumulation. Interestingly, NV4 and NV5 exhibited weak correlations with other populations, indicating distinct biochemical profiles. NV4, in particular, demonstrated the highest DPPH scavenging capacity and the greatest abundance of key bioactive organosulfur compounds, i.e., diallyl trisulfide and 2-vinyl-4H-1,3-dithiine, with properties contributing to either garlic aroma or flavor. NV5 garlic bulbs, characterized by high TSS, TPC, and ABTS scavenging activity, show significant potential for both functional food and medicinal applications due to their enhanced antioxidant properties. High TSS values also serve as an indicator of storability, as bulbs with elevated TSS typically exhibit better post-harvest shelf life and reduced susceptibility to microbial spoilage [71]. The elevated organosulfur content, including diallyl trisulfide, suggests that NV5 may offer additional health benefits, such as anti-hypertensive effects and antimicrobial activity.
Correlation analysis further confirmed several important relationships between antioxidant properties, organosulfur compounds, and bulb characteristics. A negative correlation between bulb FW and TPC suggests that smaller bulbs may contain more concentrated bioactive compounds [72]. Similarly, positive correlations between DW and sulfur-containing volatiles, such as allyl methyl trisulfide and methyl thiirane, indicated that greater dry matter enhances organosulfur accumulation. Conversely, the negative correlations between bulb FW and specific organosulfur compounds, such as allyl methyl trisulfide and cis-dipropenyl disulfide, reinforce the trade-off between bulb size and organosulfur accumulation. Notably, TPC and DPPH scavenging activity positively correlated with key bioactive compounds such as allyl methyl trisulfide and diallyl trisulfide, further emphasizing the co-occurrence of antioxidant and bioactive sulfur compounds in garlic [9]. Interestingly, diallyl sulfide exhibited a strong negative correlation with TPC and ABTS activity, suggesting a biosynthetic trade-off with phenolics. Additionally, the strong interrelationships among specific organosulfur compounds, such as allyl methyl trisulfide and cis-1-propenyl methyl disulfide, reflect coordinated biosynthetic pathways that regulate sulfur compound diversity [61]. These findings underscore garlic’s potential as a natural source of bioactive sulfur compounds, offering opportunities for functional food development [50]. Variations in antioxidant and organosulfur profiles across NV garlic populations provide valuable insights for breeding programs aimed at enhancing garlic’s nutritional and medicinal properties, thus enhancing its market value and health benefits.
While morphological traits provide valuable insights into phenotypic variation, they are often influenced by environmental factors, which may mask underlying genetic diversity. In this frame, genetic markers offer a more precise and stable means of evaluating genetic variation, as they are not influenced by environmental conditions. SSRs are widely regarded as ideal DNA markers due to their stability, reproducibility, and ability to detect polymorphisms even in clonally propagated crops with low genetic diversity [19,20]. Consequently, they have been extensively employed in studies of local garlic collections to evaluate genetic variability and population structure [1,19,20,40,73,74,75,76].
The genetic diversity analysis of the NV garlic landrace revealed low-to-moderate intra-varietal differentiation, with a relatively low level of genetic diversity across the population. The identification of 16 alleles from nine SSR loci, with polymorphisms detected at four loci, indicates that while some genetic variation exists, overall diversity is limited. The low-to-moderate genetic diversity found within the NV garlic landrace is consistent with results from previous studies on vegetatively propagated crops, particularly garlic. As garlic is propagated clonally, it tends to retain limited genetic variation due to the absence of meiotic recombination [52,77]. This phenomenon can lead to genetic bottlenecks, where the diversity within a population is reduced, often affecting the crop’s resilience to environmental stressors and pathogens. Studies on garlic landraces in the Mediterranean region similarly reported constrained diversity within local varieties, likely due to their clonal reproduction and traditional farming practices [3,78].
In our study, the AsESSR-83 locus emerged as the most informative marker, exhibiting high PIC (0.949) and heterozygosity values (He = 0.682). This was followed by AsESSR-91 and AsESSR-14, which also demonstrated strong discriminatory power, making them valuable tools for assessing intra-varietal diversity within the NV population. AsESSR-91 and AsESSR-83 were similarly identified as the most informative SSR markers, highlighting their relevance in genetic studies [26]. Notably, AsESSR-83 is associated with key traits such as flowering behavior, eco-physiological groups, and color types, further emphasizing its utility in diversity assessment. As further evidence, SSR markers with high PIC values were effective in detecting subtle genetic differences among garlic accessions in Turkey [79]. Cluster analysis and genetic structure assessments provided further insights into the population dynamics of the NV landrace. PCA revealed four distinct clusters, with the first two principal components accounting for 68.58% of the genetic variance, indicating that these clusters capture most of the underlying genetic structure. Notably, all individuals from five sampling areas (NV1, NV2, NV3, NV4, and NV6) grouped closely, suggesting a high genetic relatedness among these populations. By contrast, a few individuals from the remaining NV populations formed distinct clusters, highlighting pockets of genetic differentiation within the landrace.
STRUCTURE analysis further identified three major genetic subpopulations (K = 3) within the NV population, supporting the existence of relatively stable genetic subgroups. This number is lower than the number of subpopulations revealed in other garlic germplasm collections with diverse genetic material [1,26]. The UPGMA phylogenetic tree corroborated these results, grouping the NV population hierarchically into four clusters, each reflecting different levels of genetic variability. Similar findings were reported, where distinct genetic clusters were identified in garlic landraces across varied agroecological zones, suggesting that environmental selection pressures contribute to genetic differentiation even within clonally propagated crops [80].
The detailed characterization of the NV garlic population reveals high variability in morphological traits, such as clove size and anthocyanin stripes, as well as significant biochemical diversity, including total phenolic content (TPC), antioxidant capacity, and various organosulfur compounds (e.g., allyl methyl disulfide, trisulfide, cis-1-propenyl propyl disulfide, cis-1-propenyl methyl disulfide, diallyl sulfide, and trisulfide). This suggests substantial intra-varietal diversity within the population, which can guide selective breeding programs aimed at enhancing specific desirable traits of the local variety or serve as alternative sources of high-value metabolites in novel pharmacological formulations [41]. Future research could build on these findings by explicitly studying how different growing conditions, such as soil type and climate, affect the phenotypic and biochemical profiles of these garlic varieties. Such research could aid in developing robust varieties that thrive under diverse environmental conditions.
On the other hand, this study highlighted low-to-moderate intra-variety differentiation based on microsatellite markers, indicating potential genetic markers that could be targeted in breeding to enhance traits such as levels of anthocyanins or organosulfur compounds. Although no association study between phenotypic and molecular data was performed, presumably due to the lack of phenotypic characterization of additional genotypes with diverse traits, the results suggest the possibility of selecting garlic clones with high functional value within the population, similar to previous reports [26]. Future studies should aim to identify molecular markers ideal for selecting garlic varieties that exhibit desirable agronomic and nutraceutical traits, improved yield, or disease resistance. By integrating environmental and genetic data into predictive models, it may be possible to forecast yield, quality, and resistance traits, providing invaluable insights for breeding efforts to anticipate the effects of climate change on garlic cultivation.
5. Conclusions
The findings highlight the potential of the popular NV local variety from northern Greece for agronomic and nutritional improvement. Despite the relatively low-to-moderate overall genetic diversity within the NV population, the observed phytochemical variability, particularly in organosulfur compounds, phenolic content, and antioxidant capacity, underscores its value for functional food development. The identification of distinct genetic clusters and highly informative SSR markers provides a foundation for targeted breeding and conservation strategies. AsESSR-83 was the most robust and informative marker for assessing genetic diversity within the NV population, making it a valuable tool for guiding breeding and conservation strategies. These findings contribute to the broader understanding of garlic diversity and offer valuable insights for enhancing crop resilience, productivity, and marketability, ensuring sustainability in modern agriculture. The potential of NV garlic to be recognized as a product of superior quality could later support its certification as a Protected Designation of Origin (PDO), enhancing its competitiveness in both local and international markets.
Supplementary Materials
The following supporting information can be downloaded at: https://www.mdpi.com/article/10.3390/horticulturae11030304/s1, Table S1: Geographical coordinates of the sampling sites of the NV garlic population; Table S2: Basic information of the eight SSRs used in the study; Table S3: Morphological descriptors (CPVO) and statistical analysis parameters of NV garlic populations; Table S4: Quantitative traits and statistical analysis parameters of NV garlic populations; Table S5: PCA Eigenvalues and Variance for Morphological Traits in NV garlic populations; Table S6: Organosulfur Compound Content in NV Garlic Bulbs; Table S7: Diversity statistics of the nine studied SSR markers in NV garlic populations; Figure S1. Geographical distribution of the 10 sampling locations for the NV local garlic population. Figure S2: PCA Analysis and Trait Contributions in NV Garlic Populations; Figure S3: Pearson correlation matrix of quantitative, antioxidant-, and sulfur-related compounds measured in the ten NV garlic populations.
Author Contributions
Conceptualization, I.M. and I.G.; Methodology, A.P., F.R., S.C., U.V., E.D., A.X. and E.S.; Investigation, I.M. and I.G.; Data Curation, A.P., F.R., S.C., U.V., E.S., I.M. and A.B.; Writing—Original Draft Preparation, A.P. and I.M.; Writing—Review and Editing, A.P., E.S., A.X., I.G. and I.M.; Supervision, E.S., I.G. and I.M.; Project Administration, I.M.; Funding Acquisition, I.M. All authors have read and agreed to the published version of the manuscript.
Funding
This research was funded by the Rural Development Programme (RDP) 2014–2020, Measure 16.1-2, Action II EAD REGION OF EASTERN MACEDONIA AND THRACE, entitled: “Identification, evaluation and improvement of special quality attributes of Greek garlic germplasm (Allium sativum L.) originated from the area of Nea Vissa Evrou” (acronym: G(a)R(l)eek, grant number: Μ16ΣΥΝ2-00091). The analytical instrument was funded by the ERDF 2014–2020 Program of the Autonomous Province of Trento (Italy) with EU co-financing (Fruitomics).
Data Availability Statement
The original contributions presented in this study are included in the article and Supplementary Material. Further inquiries can be directed to the corresponding authors.
Conflicts of Interest
The authors declare no conflicts of interest.
References
- Papaioannou, C.; Fassou, G.; Petropoulos, S.A.; Lamari, F.N.; Bebeli, P.J.; Papasotiropoulos, V. Evaluation of the genetic diversity of Greek garlic (Allium sativum L.) accessions using DNA markers and association with phenotypic and chemical variation. Agriculture 2023, 13, 1408. [Google Scholar] [CrossRef]
- Shaaf, S.; Sharma, R.; Kilian, B.; Walther, A.; Özkan, H.; Karami, E.; Mohammadi, B. Genetic Structure and Eco-Geographical Adaptation of Garlic Landraces (Allium sativum L.) in Iran. Genet. Resour. Crop Evol. 2014, 61, 1565–1580. [Google Scholar] [CrossRef]
- Ipek, M.; Ipek, A.; Simon, P.W. Genetic characterization of Allium tuncelianum: An endemic edible Allium species with garlic odor. Sci. Hortic. 2008, 115, 409–415. [Google Scholar] [CrossRef]
- Bozzini, A. Discovery of an Italian fertile tetraploid line of garlic. Econ. Bot. 1991, 45, 436–438. [Google Scholar]
- Fritsch, R.; Friesen, N. Evolution, domestication and taxonomy. In Allium Crop Science: Recent Advances; CABI Publishing: Wallingford, UK, 2002; pp. 5–30. [Google Scholar]
- Verma, T.; Aggarwal, A.; Dey, P.; Chauhan, A.K.; Rashid, S.; Chen, K.T.; Sharma, R. Medicinal and therapeutic properties of garlic, garlic essential oil, and garlic-based snack food: An updated review. Front. Nutr. 2023, 10, 1120377. [Google Scholar] [CrossRef]
- Ansary, J.; Forbes-Hernández, T.Y.; Gil, E.; Cianciosi, D.; Zhang, J.; Elexpuru-Zabaleta, M.; Simal-Gandara, J.; Giampieri, F.; Battino, M. Potential health benefit of garlic based on human intervention studies: A brief overview. Antioxidants 2020, 9, 619. [Google Scholar] [CrossRef]
- Takagi, H. Garlic Allium sativum L. In Onions and Allied Crops; CRC Press: Boca Raton, FL, USA, 2020; pp. 109–146. [Google Scholar]
- Avgeri, I.; Zeliou, K.; Petropoulos, S.A.; Bebeli, P.J.; Papasotiropoulos, V.; Lamari, F.N. Variability in bulb organosulfur compounds, sugars, phenolics, and pyruvate among greek garlic genotypes: Association with antioxidant properties. Antioxidants 2020, 9, 967. [Google Scholar] [CrossRef]
- Egea, L.A.; Mérida-García, R.; Kilian, A.; Hernandez, P.; Dorado, G. Assessment of Genetic Diversity and Structure of Large Garlic (Allium sativum) Germplasm Bank, by Diversity Arrays Technology “Genotyping-by-Sequencing” Platform (DArTseq). Front. Genet. 2017, 8, 98. [Google Scholar] [CrossRef]
- Polyzos, N.; Papasotiropoulos, V.; Lamari, F.N.; Petropoulos, S.A.; Bebeli, P.J. Phenotypic characterization and quality traits of Greek garlic (Allium sativum L.) germplasm cultivated at two different locations. Genet. Resour. Crop Evol. 2019, 66, 1671–1689. [Google Scholar] [CrossRef]
- Hirata, S.; Abdelrahman, M.; Yamauchi, N.; Shigyo, M. Diversity evaluation based on morphological, physiological and isozyme variation in genetic resources of garlic (Allium sativum L.) collected worldwide. GGS 2016, 91, 161–173. [Google Scholar] [CrossRef]
- Wang, H.; Li, X.; Shen, D.; Oiu, Y.; Song, J. Diversity evaluation of morphological traits and allicin content in garlic (Allium sativum L.) from China. Euphytica 2014, 198, 243–254. [Google Scholar] [CrossRef]
- Panthee, D.R.; Kc, R.B.; Regmi, H.N.; Subedi, P.P.; Bhattarai, S.; Dhakal, J. Diversity analysis of garlic (Allium sativum L.) germplasms available in Nepal based on morphological characters. Genet. Resour. Crop Evol. 2006, 53, 205–212. [Google Scholar] [CrossRef]
- Parreño, R.; Rodríguez-Alcocer, E.; Martínez-Guardiola, C.; Carrasco, L.; Castillo, P.; Arbona, V.; Jover-Gil, S.; Candela, H. Turning garlic into a modern crop: State of the art and perspectives. Plants 2023, 12, 1212. [Google Scholar] [CrossRef] [PubMed]
- Pasupula, K.; Verma, P.; Zimik, M.; Kaur, C.; Vasudev, S.; Khar, A. Morphological, biochemical and molecular characterization of short-day tropical Indian garlic (Allium sativum L.). Heliyon 2024, 10, e37553. [Google Scholar] [CrossRef] [PubMed]
- Fanaei, H.; Narouirad, M.; Farzanjo, M.; Ghasemi, M. Evaluation of yield and some agronomical traits in garlic genotypes (Allium sativum L.). ARRB 2014, 4, 3386–3391. [Google Scholar] [CrossRef]
- Jabbes, N.; Arnault, I.; Auger, J.; Dridi, B.A.M.; Hannachi, C. Agro-morphological markers and organo-sulphur compounds to assess diversity in Tunisian garlic landraces. Sci. Hortic. 2012, 148, 47–54. [Google Scholar] [CrossRef]
- Ma, K.H.; Kwag, J.G.; Zhao, W.; Dixit, A.; Lee, G.A.; Kim, H.H.; Chung, I.M.; Kim, N.S.; Lee, J.S.; Ji, J.J.; et al. Isolation and characteristics of eight novel polymorphic microsatellite loci from the genome of garlic (Allium sativum L.). Sci. Hortic. 2009, 122, 355–361. [Google Scholar] [CrossRef]
- Chen, S.; Chen, W.; Shen, X.; Yang, Y.; Qi, F.; Liu, Y.; Meng, H. Analysis of the genetic diversity of garlic (Allium sativum L.) by simple sequence repeat and inter simple sequence repeat analysis and agro-morphological traits. Biochem. Syst. Ecol. 2014, 55, 260–267. [Google Scholar] [CrossRef]
- Zhao, W.-G.; Chung, J.-W.; Cho, Y.-I.; Rha, W.-H.; Lee, G.-A.; Ma, K.-H.; Han, S.-H.; Bang, K.-H.; Park, C.-B.; Kim, S.-M.; et al. Molecular genetic diversity and population structure in Lycium accessions using SSR markers. Comptes Rendus Biol. 2010, 333, 793–800. [Google Scholar] [CrossRef]
- Petropoulos, S.; Fernandes, Â.; Barros, L.; Ciric, A.; Sokovic, M.; Ferreira, I.C. Antimicrobial and antioxidant properties of various Greek garlic genotypes. Food Chem. 2018, 245, 7–12. [Google Scholar] [CrossRef]
- Sarrou, E.; Martens, S.; Chatzopoulou, P. Metabolite profiling and antioxidative activity of Sage (Salvia fruticosa Mill.) under the influence of genotype and harvesting period. Ind. Crops Prod. 2016, 94, 240–250. [Google Scholar] [CrossRef]
- Re, R.; Pellegrini, N.; Proteggente, A.; Pannala, A.; Yang, M.; Rice-Evans, C. Antioxidant activity applying an improved ABTS radical cation decolorization assay. Free Radic. Biol. Med. 1999, 26, 1231–1237. [Google Scholar] [CrossRef] [PubMed]
- Su, M.S.; Silva, J.L. Antioxidant activity, anthocyanins, and phenolics of rabbiteye blueberry (Vaccinium ashei) by-products as affected by fermentation. Food Chem. 2006, 97, 447–451. [Google Scholar] [CrossRef]
- Barboza, K.; Salinas, M.C.; Acuña, C.V.; Bannoud, F.; Beretta, V.; García-Lampasona, S.; Burba, J.L.; Galmarini, C.R.; Cavagnaro, P.F. Assessment of genetic diversity and population structure in a garlic (Allium sativum L.) germplasm collection varying in bulb content of pyruvate, phenolics, and solids. Sci. Hortic. 2020, 261, 108900. [Google Scholar] [CrossRef]
- Hoffman, J.I.; Amos, W. Microsatellite genotyping errors: Detection approaches, common sources and consequences for paternal exclusion. Mol. Ecol. 2005, 14, 599–612. [Google Scholar] [CrossRef]
- Peakall, R.; Smouse, P.E. GenAlEx 6.5: Genetic Analysis in Excel. Population Genetic Software for Teaching and Research—An Update. Bioinformatics 2012, 28, 2537–2539. [Google Scholar] [CrossRef]
- Liu, K.; Muse, S.V. PowerMarker: An integrated analysis environment for genetic marker analysis. Bioinformatics 2005, 21, 2128–2129. [Google Scholar] [CrossRef]
- Pritchard, J.K.; Stephens, M.; Donnelly, P. Inference of population structure using multilocus genotype data. Genetics 2000, 155, 945–959. [Google Scholar] [CrossRef]
- Li, Y.L.; Liu, J.X. Structure selector: A web-based software to select and visualize the optimal number of clusters using multiple methods. Mol. Ecol. Resour. 2018, 18, 176–177. [Google Scholar] [CrossRef]
- Terzopoulos, P.J.; Walters, S.A.; Bebeli, P.J. Evaluation of Greek tomato landrace populations for heterogeneity of horticultural traits. Eur. J. Hortic. Sci. 2009, 74, 24–29. [Google Scholar]
- Mengistu, D.K.; Kiros, A.Y.; Pè, M.E. Phenotypic diversity in Ethiopian durum wheat (Triticum turgidum var. durum) landraces. Crop J. 2015, 3, 190–199. [Google Scholar] [CrossRef]
- Mellidou, I.; Krommydas, K.; Nianiou-Obeidat, I.; Ouzounidou, G.; Kalivas, A.; Ganopoulos, I. Exploring morpho-physiological profiles of a collection of tomato (Solanum lycopersicum) germplasm using multivariate statistics. Plant Genet. Res. 2020, 18, 88–97. [Google Scholar] [CrossRef]
- Terzopoulos, P.J.; Bebeli, P.J. Phenotypic diversity in Greek tomato (Solanum lycopersicum L.) landraces. Sci. Hortic. 2010, 126, 138–144. [Google Scholar] [CrossRef]
- Spitzer, M.; Wildenhain, J.; Rappsilber, J.; Tyers, M. BoxPlotR: A web tool for generation of box plots. Nat. Methods 2014, 11, 121–122. [Google Scholar] [CrossRef]
- Chen, C.; Chen, H.; Zhang, Y.; Thomas, H.R.; Frank, M.H.; He, Y.; Xia, R. TBtools: An integrative toolkit developed for interactive analyses of big biological data. Mol. Plant 2020, 13, 1194–1202. [Google Scholar] [CrossRef]
- Evanno, G.; Regnaut, S.; Goudet, J. Detecting the number of clusters of individuals using the software STRUCTURE: A simulation study. Mol. Ecol. 2005, 14, 2611–2620. [Google Scholar] [CrossRef]
- Gautam, R.K.; Singh, P.K.; Venkatesan, K.; Rakesh, B.; Sakthivel, K.; Swain, S.; Srikumar, M.; Zamir Ahmed, S.K.; Devakumar, K.; Rao, S.S.; et al. Harnessing intra-varietal variation for agro-morphological and nutritional traits in a popular rice landrace for sustainable food security in tropical islands. Front. Nutr. 2023, 10, 1088208. [Google Scholar] [CrossRef]
- Li, X.; Qiao, L.; Chen, B.; Zheng, Y.; Zhi, C.; Zhang, S.; Pan, Y.; Cheng, Z. SSR Markers development and their application in genetic diversity evaluation of garlic (Allium sativum) Germplasm. Plant Divers. 2022, 44, 481–491. [Google Scholar] [CrossRef]
- Diretto, G.; Rubio-Moraga, A.; Argandoña, J.; Castillo, P.; Gómez-Gómez, L.; Ahrazem, O. Tissue-specific accumulation of sulfur compounds and saponins in different parts of garlic cloves from purple and white ecotypes. Molecules 2017, 22, 1359. [Google Scholar] [CrossRef]
- Lazaridi, E.; Ntatsi, G.; Savvas, D.; Bebeli, P.J. Diversity in cowpea (Vigna unguiculata (L.) Walp.) local populations from Greece. Genet. Resour. Crop Evol. 2017, 64, 1529–1551. [Google Scholar] [CrossRef]
- Diriba-Shiferaw, G.; Nigussie-Dechassa, R.; Kebede, W.; Getachew, T.; Sharma, J.J. Growth and nutrients content and uptake of Garlic (Allium sativum L.) as influenced by different types of fertilizers and soils. Sci. Technol. Arts Res. 2013, 2, 35. [Google Scholar] [CrossRef]
- Cavagnaro, P.F.; Burba, J.L. Genetic and environmental factors influencing garlic anthocyanin pigmentation: A review. Av. Hortic. 2022, 41, 103–123. [Google Scholar]
- Pereira, L.C.; Itavo, L.C.V.; Leal, E.S.; Miraglia, H.H.; Ferreira, M.B.; Carvalho, C.M.E. Evaluation of sheep fed on multinutritional blocks with garlic extract. Acta Vet. Bras. 2017, 11, 20–28. [Google Scholar]
- Raja, H.; Ram, C.N.; Bhargav, K.K.; Pandey, M.; Jain, A. Genetic variability assessment in garlic (Allium sativum L.) genotypes. J. Pharmacogn. Phytochem. 2017, 6, 1781–1786. [Google Scholar]
- Singh, L.; Kaul, V.; Gohil, R.N. Analysis of morphological variability in the Indian germplasm of Allium sativum L. Plant Syst. Evol. 2014, 300, 245–254. [Google Scholar] [CrossRef]
- Baghalian, K.; Shariatpanahi, M.E.; Naghavi, M.R. Genetic diversity of Iranian garlic (Allium sativum L.) ecotypes using AFLP markers. Sci. Hortic. 2010, 124, 101–106. [Google Scholar]
- Shang, A.; Cao, S.-Y.; Xu, X.-Y.; Gan, R.-Y.; Tang, G.-Y.; Corke, H.; Mavumengwana, V.; Li, H.-B. Bioactive compounds and biological functions of garlic (Allium sativum L.). Foods 2019, 8, 246. [Google Scholar] [CrossRef]
- Kopeć, A.; Skoczylas, J.; Jedrszczyk, E.; Francik, R.; Bystrowska, B.; Zawistowsk, J. Chemical composition and concentration of bioactive compounds in garlic cultivated from air bulbils. Agriculture 2020, 10, 40. [Google Scholar] [CrossRef]
- Volk, G.M.; Stern, D. Phenotypic characteristics of ten garlic cultivars grown at different North American locations. HortScience 2009, 44, 1238–1247. [Google Scholar] [CrossRef]
- Martins, N.; Petropoulos, S.; Ferreira, I.C. Chemical composition and bioactive compounds of garlic (Allium sativum L.) as affected by pre-and post-harvest conditions: A review. Food Chem. 2016, 211, 41–50. [Google Scholar] [CrossRef]
- Najman, K.; Sadowska, A.; Hallmann, E. Evaluation of bioactive and physicochemical properties of white and black garlic (Allium sativum L.) from conventional and organic cultivation. Appl. Sci. 2021, 11, 874. [Google Scholar] [CrossRef]
- Beretta, H.V.; Bannoud, F.; Insani, M.; Berli, F.; Hirschegger, P.; Galmarini, C.R. Relationships between bioactive compound content and the antiplatelet and antioxidant activities of six Allium vegetable species. FTB 2017, 55, 266. [Google Scholar]
- Locatelli, D.A.; Nazareno, M.A.; Fusari, C.M.; Camargo, A.B. Cooked garlic and antioxidant activity: Correlation with organosulfur compound composition. Food Chem. 2017, 220, 219–224. [Google Scholar] [CrossRef] [PubMed]
- Insani, E.M.; Cavagnaro, P.F.; Salomón, V.M.; Langman, L.; Sance, M.; Pazos, A.A.; Galmarini, C.R. Variation for health-enhancing compounds and traits in onion (Allium cepa L.) germplasm. Food Nutr. Sci. 2016, 7, 577–591. [Google Scholar]
- Floegel, A.; Kim, D.O.; Chung, S.J.; Koo, S.I.; Chun, O.K. Comparison of ABTS/DPPH assays to measure antioxidant capacity in popular antioxidant-rich US foods. J. Food Compos. Anal. 2011, 24, 1043–1048. [Google Scholar] [CrossRef]
- Skoczylas, J.; Jędrszczyk, E.; Dziadek, K.; Dacewicz, E.; Kopeć, A. Basic chemical composition, antioxidant activity and selected polyphenolic compounds profile in garlic leaves and bulbs collected at various stages of development. Molecules 2023, 28, 6653. [Google Scholar] [CrossRef]
- Dinu, M.; Soare, R.; Băbeanu, C.; Botu, M. Evaluation of productivity components and antioxidant activity of different types of garlic depending on the morphological organs. Horticulturae 2023, 9, 1039. [Google Scholar] [CrossRef]
- Mansingh, D.P.; Dalpati, N.; Sali, V.K.; Vasanthi, A.H.R. Alliin the precursor of allicin in garlic extract mitigates proliferation of gastric adenocarcinoma cells by modulating apoptosis. Pharmacogn. Mag. 2018, 14, S84–S91. [Google Scholar]
- Kodera, Y.; Ushijima, M.; Amano, H.; Suzuki, J.; Matsutomo, T. Chemical and biological properties of S-1-propenyl-l-cysteine in aged garlic extract. Molecules 2017, 22, 570. [Google Scholar] [CrossRef]
- Yoo, M.; Lee, S.; Kim, S.; Hwang, J.B.; Choe, J.; Shin, D. Composition of organosulfur compounds from cool- and warm-type garlic (Allium sativum L.) in Korea. Food Sci. Biotechnol. 2014, 23, 337–344. [Google Scholar] [CrossRef]
- Rana, S.; Pal, R.; Vaiphei, K.; Sharma, S.K.; Ola, R. Garlic in health and disease. Nutr. Res. Rev. 2011, 24, 60–71. [Google Scholar] [CrossRef] [PubMed]
- Vega-Hissi, E.G.; Andrada, M.F.; Díaz, M.G.; Garro Martinez, J.C. Computational study of the hydrogen peroxide scavenging mechanism of allyl methyl disulfide, an antioxidant compound from garlic. Mol. Divers. 2019, 23, 985–995. [Google Scholar] [CrossRef] [PubMed]
- Zhang, Y.; Wang, Y.; Zhang, F.; Wang, K.; Liu, G.; Yang, M.; Luan, Y.; Zhao, Z.; Zhang, J.; Cao, X.; et al. Allyl methyl disulfide inhibits IL-8 and IP-10 secretion in intestinal epithelial cells via the NF-кB signaling pathway. Int. Immunopharmacol. 2015, 27, 156–163. [Google Scholar] [CrossRef] [PubMed]
- Wang, S.; Liu, J.; Dong, J.; Fan, Z.; Wang, F.; Wu, P.; Li, X.; Kou, R.; Chen, F. Allyl methyl trisulfide protected against LPS-induced acute lung injury in mice via inhibition of the NF-κB and MAPK pathways. Front. Pharmacol. 2022, 13, 919898. [Google Scholar] [CrossRef]
- Keusgen, M.; Schulz, H.; Glodek, J.; Krest, I.; Krüger, H.; Herchert, N.; Keller, J. Characterization of some Allium hybrids by aroma precursors, aroma profiles, and alliinase activity. J. Agric. Food Chem. 2002, 50, 2884–2890. [Google Scholar] [CrossRef]
- Casella, S.; Leonardi, M.; Melai, B.; Fratini, F.; Pistelli, L. The role of diallyl sulfides and dipropyl sulfides in the in vitro antimicrobial activity of the essential oil of garlic, Allium sativum L., and leek, Allium porrum L. Phytother. Res. 2013, 27, 380–383. [Google Scholar] [CrossRef]
- Mitra, S.; Das, R.; Bin Emran, T.; Labib, R.K.; Tabassum, N.E.; Islam, F.; Sharma, R.; Ahmad, I.; Nainu, F.; Chidambaram, K.; et al. Diallyl Disulfide: A bioactive garlic compound with anticancer potential. Front. Pharmacol. 2022, 13, 943967. [Google Scholar] [CrossRef]
- Major, N.; Išić, N.; Kovačević, T.K.; Anđelini, M.; Ban, D.; Prelac, M.; Palčić, I.; Goreta Ban, S. Size Does Matter: The influence of bulb size on the phytochemical and nutritional profile of the sweet onion landrace “Premanturska Kapula” (Allium cepa L.). Antioxidants 2023, 12, 1596. [Google Scholar] [CrossRef]
- Akan, S. Evaluation and comparison of some parameters in four garlic varieties. JIST 2019, 9, 1866–1875. [Google Scholar] [CrossRef]
- Chen, S.; Shen, X.; Cheng, S.; Li, P.; Du, J.; Chang, Y.; Meng, H. Evaluation of garlic cultivars for polyphenolic content and antioxidant properties. PLoS ONE 2013, 8, e79730. [Google Scholar] [CrossRef]
- Karakan, F.Y. Relationship between Volatile sulfur compounds, mineral content, morphological and molecular characterization of local garlic genotypes. Bangladesh J. Bot. 2022, 51, 147–155. [Google Scholar] [CrossRef]
- Poljuha, D.; Franić, M.; Kralj, I.; Weber, T.; Šatović, Z.; Ban, D.; Toth, N.; Dumičić, G.; Kereša, S.; da Cunha, C.P.; et al. Genetic diversity and structure analysis of Croatian garlic collection assessed by SSR markers. Folia Hortic. 2021, 33, 157–171. [Google Scholar] [CrossRef]
- Cunha, C.P.; Hoogerheide, E.S.S.; Zucchi, M.I.; Monteiro, M.; Pinheiro, J.B. New Microsatellite markers for garlic, Allium sativum (Alliaceae). Am. J. Bot. 2012, 99, e17–e19. [Google Scholar] [CrossRef]
- Kumar, M.; Rakesh Sharma, V.; Kumar, V.; Sirohi, U.; Chaudhary, V.; Sharma, S.; Saripalli, G.; Naresh, R.K.; Yadav, H.K.; Sharma, S. Genetic diversity and population structure analysis of indian garlic (Allium sativum L.) Collection Using SSR Markers. Physiol. Mol. Biol. Plants 2019, 25, 377–386. [Google Scholar] [CrossRef] [PubMed]
- Ma, K.H.; Dixit, A.; Lee, G.A. Assessment of genetic diversity in garlic (Allium sativum L.) using SSR markers. Sci. Hortic. 2010, 124, 419–425. [Google Scholar]
- Pooler, M.R.; Simon, P.W. Characterization and classification of isozyme and morphological variation in a diverse collection of garlic clones. Euphytica 1993, 68, 121–130. [Google Scholar] [CrossRef]
- Ipek, M.; Ipek, A.; Almquist, S.G.; Simon, P.W. Demonstration of linkage and development of the first low-density genetic map of garlic, based on AFLP markers. Theor. Appl. Genet. 2005, 110, 228–236. [Google Scholar] [CrossRef]
- Khar, A.; Banerjee, K.; Lawande, K.E. Genetic diversity of short-day Indian garlic (Allium sativum L.) assessed by molecular markers. JCSB 2011, 14, 97–104. [Google Scholar]
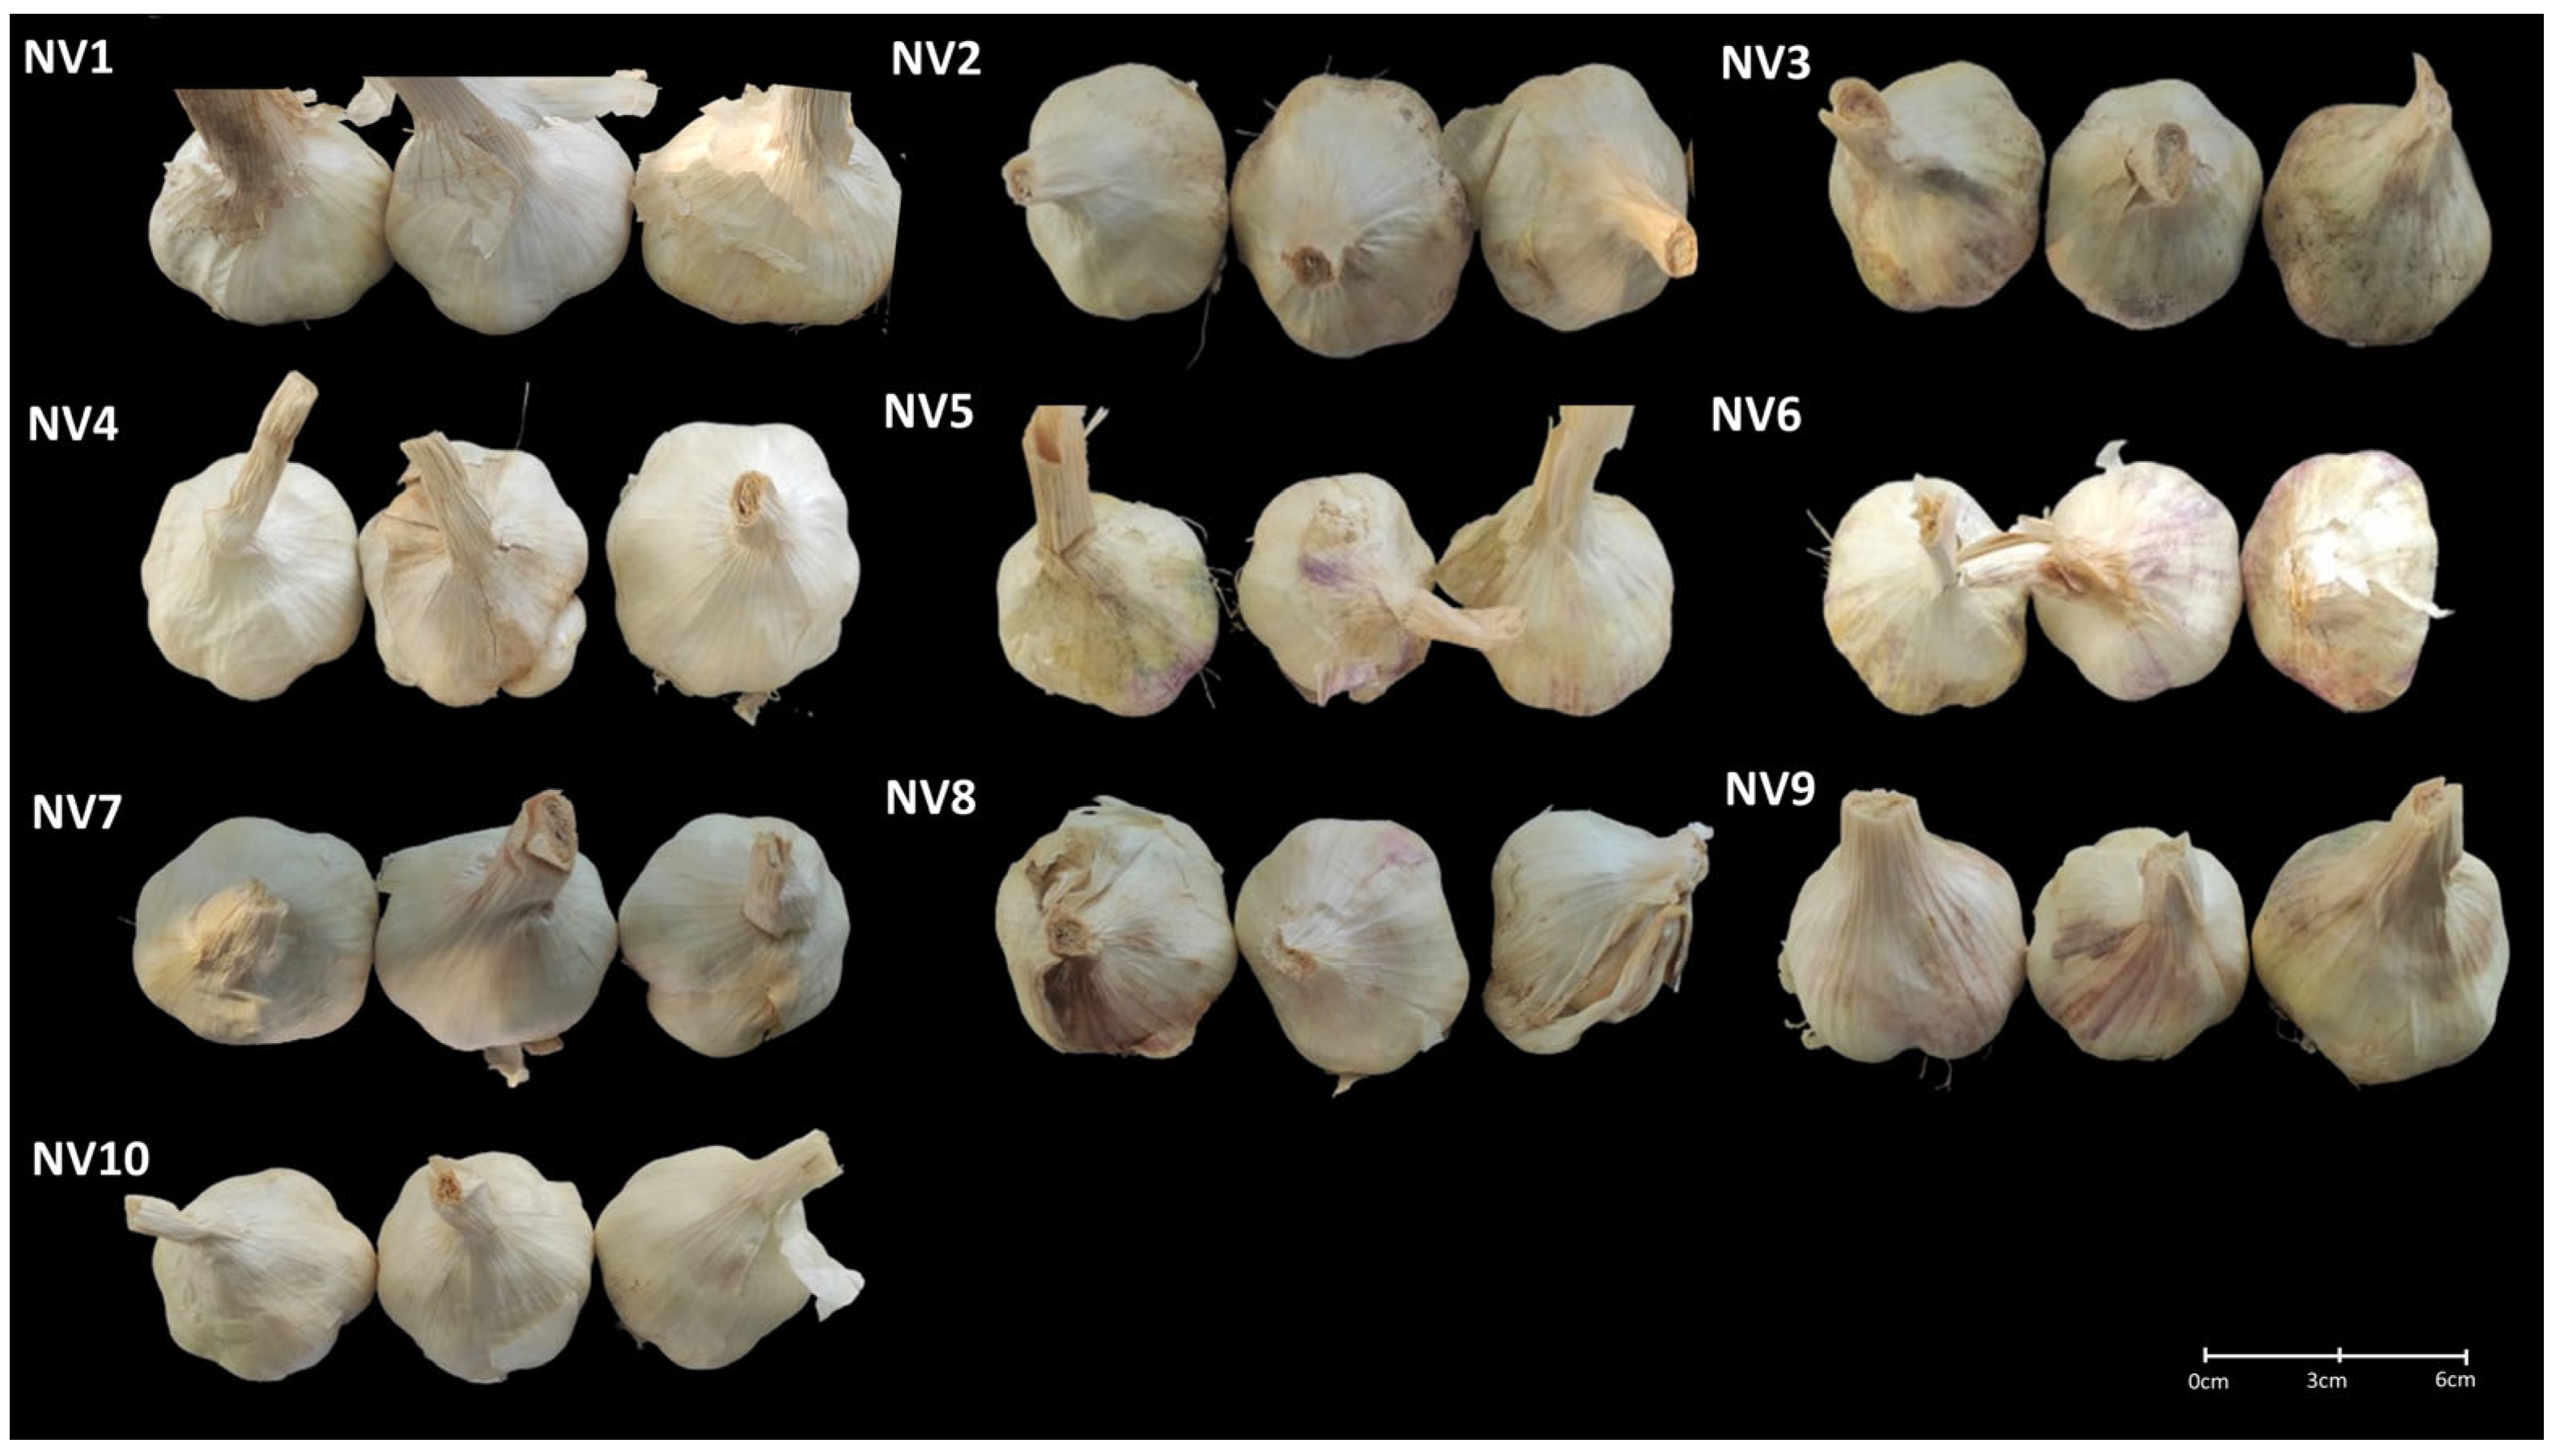
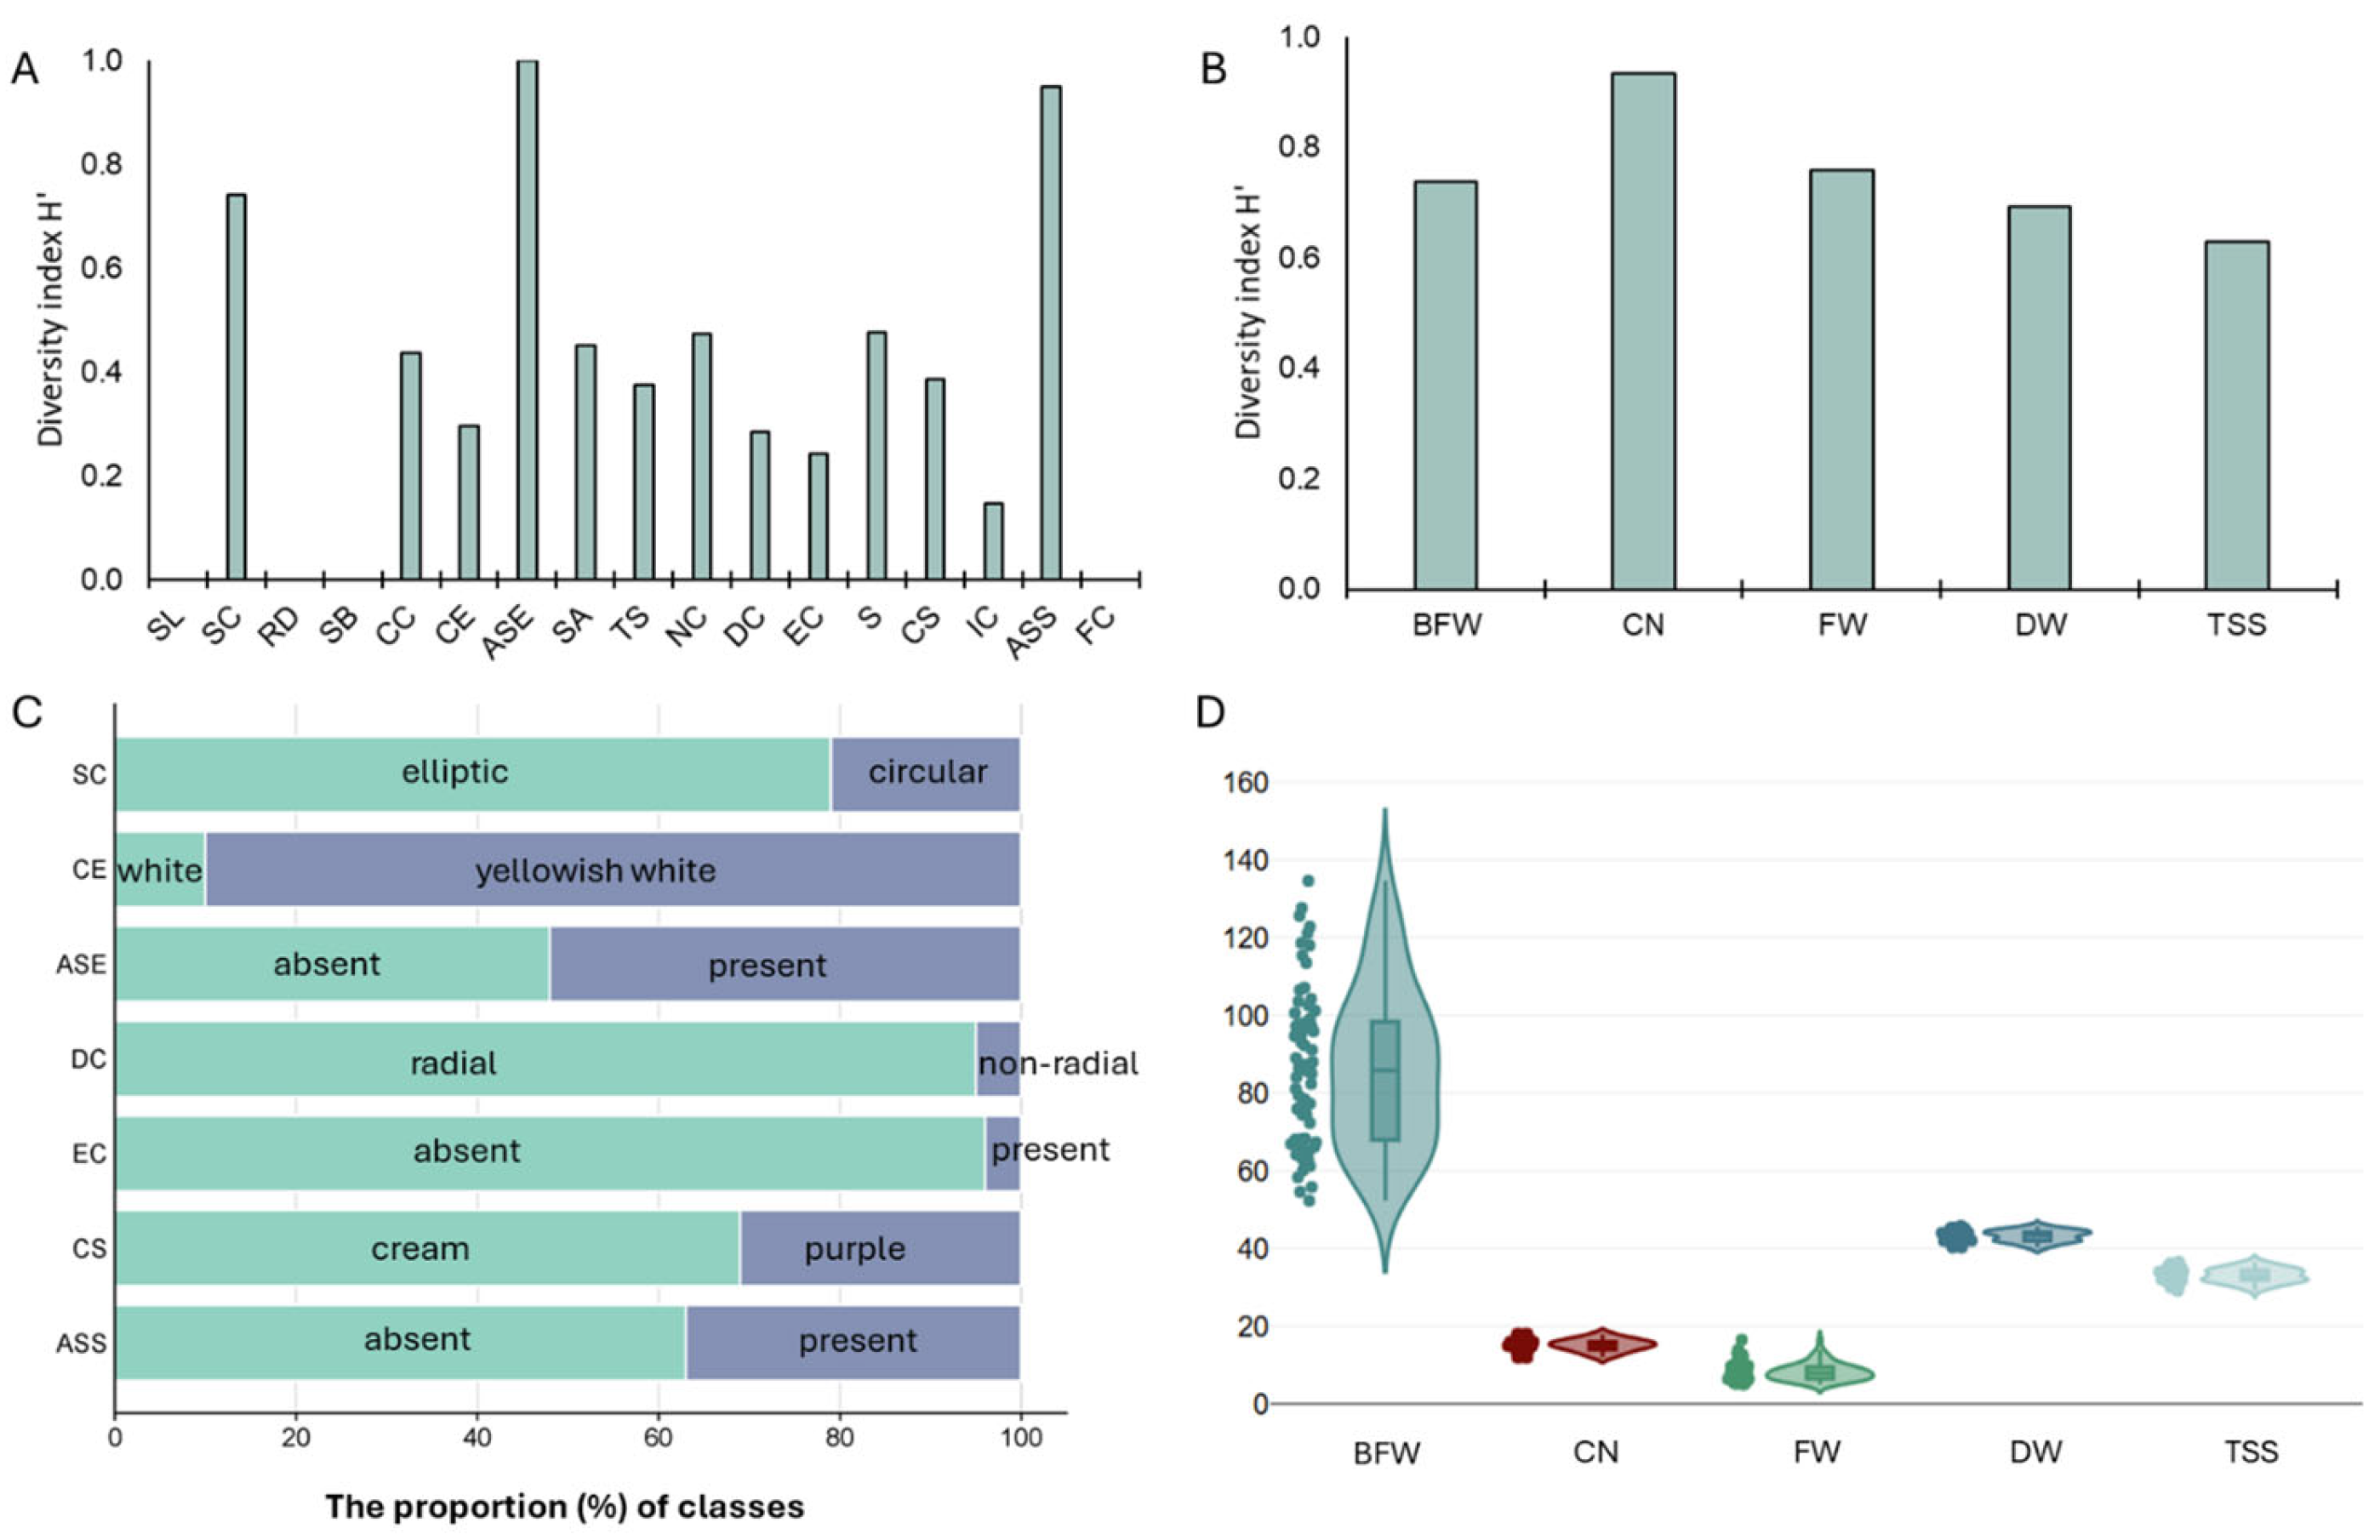
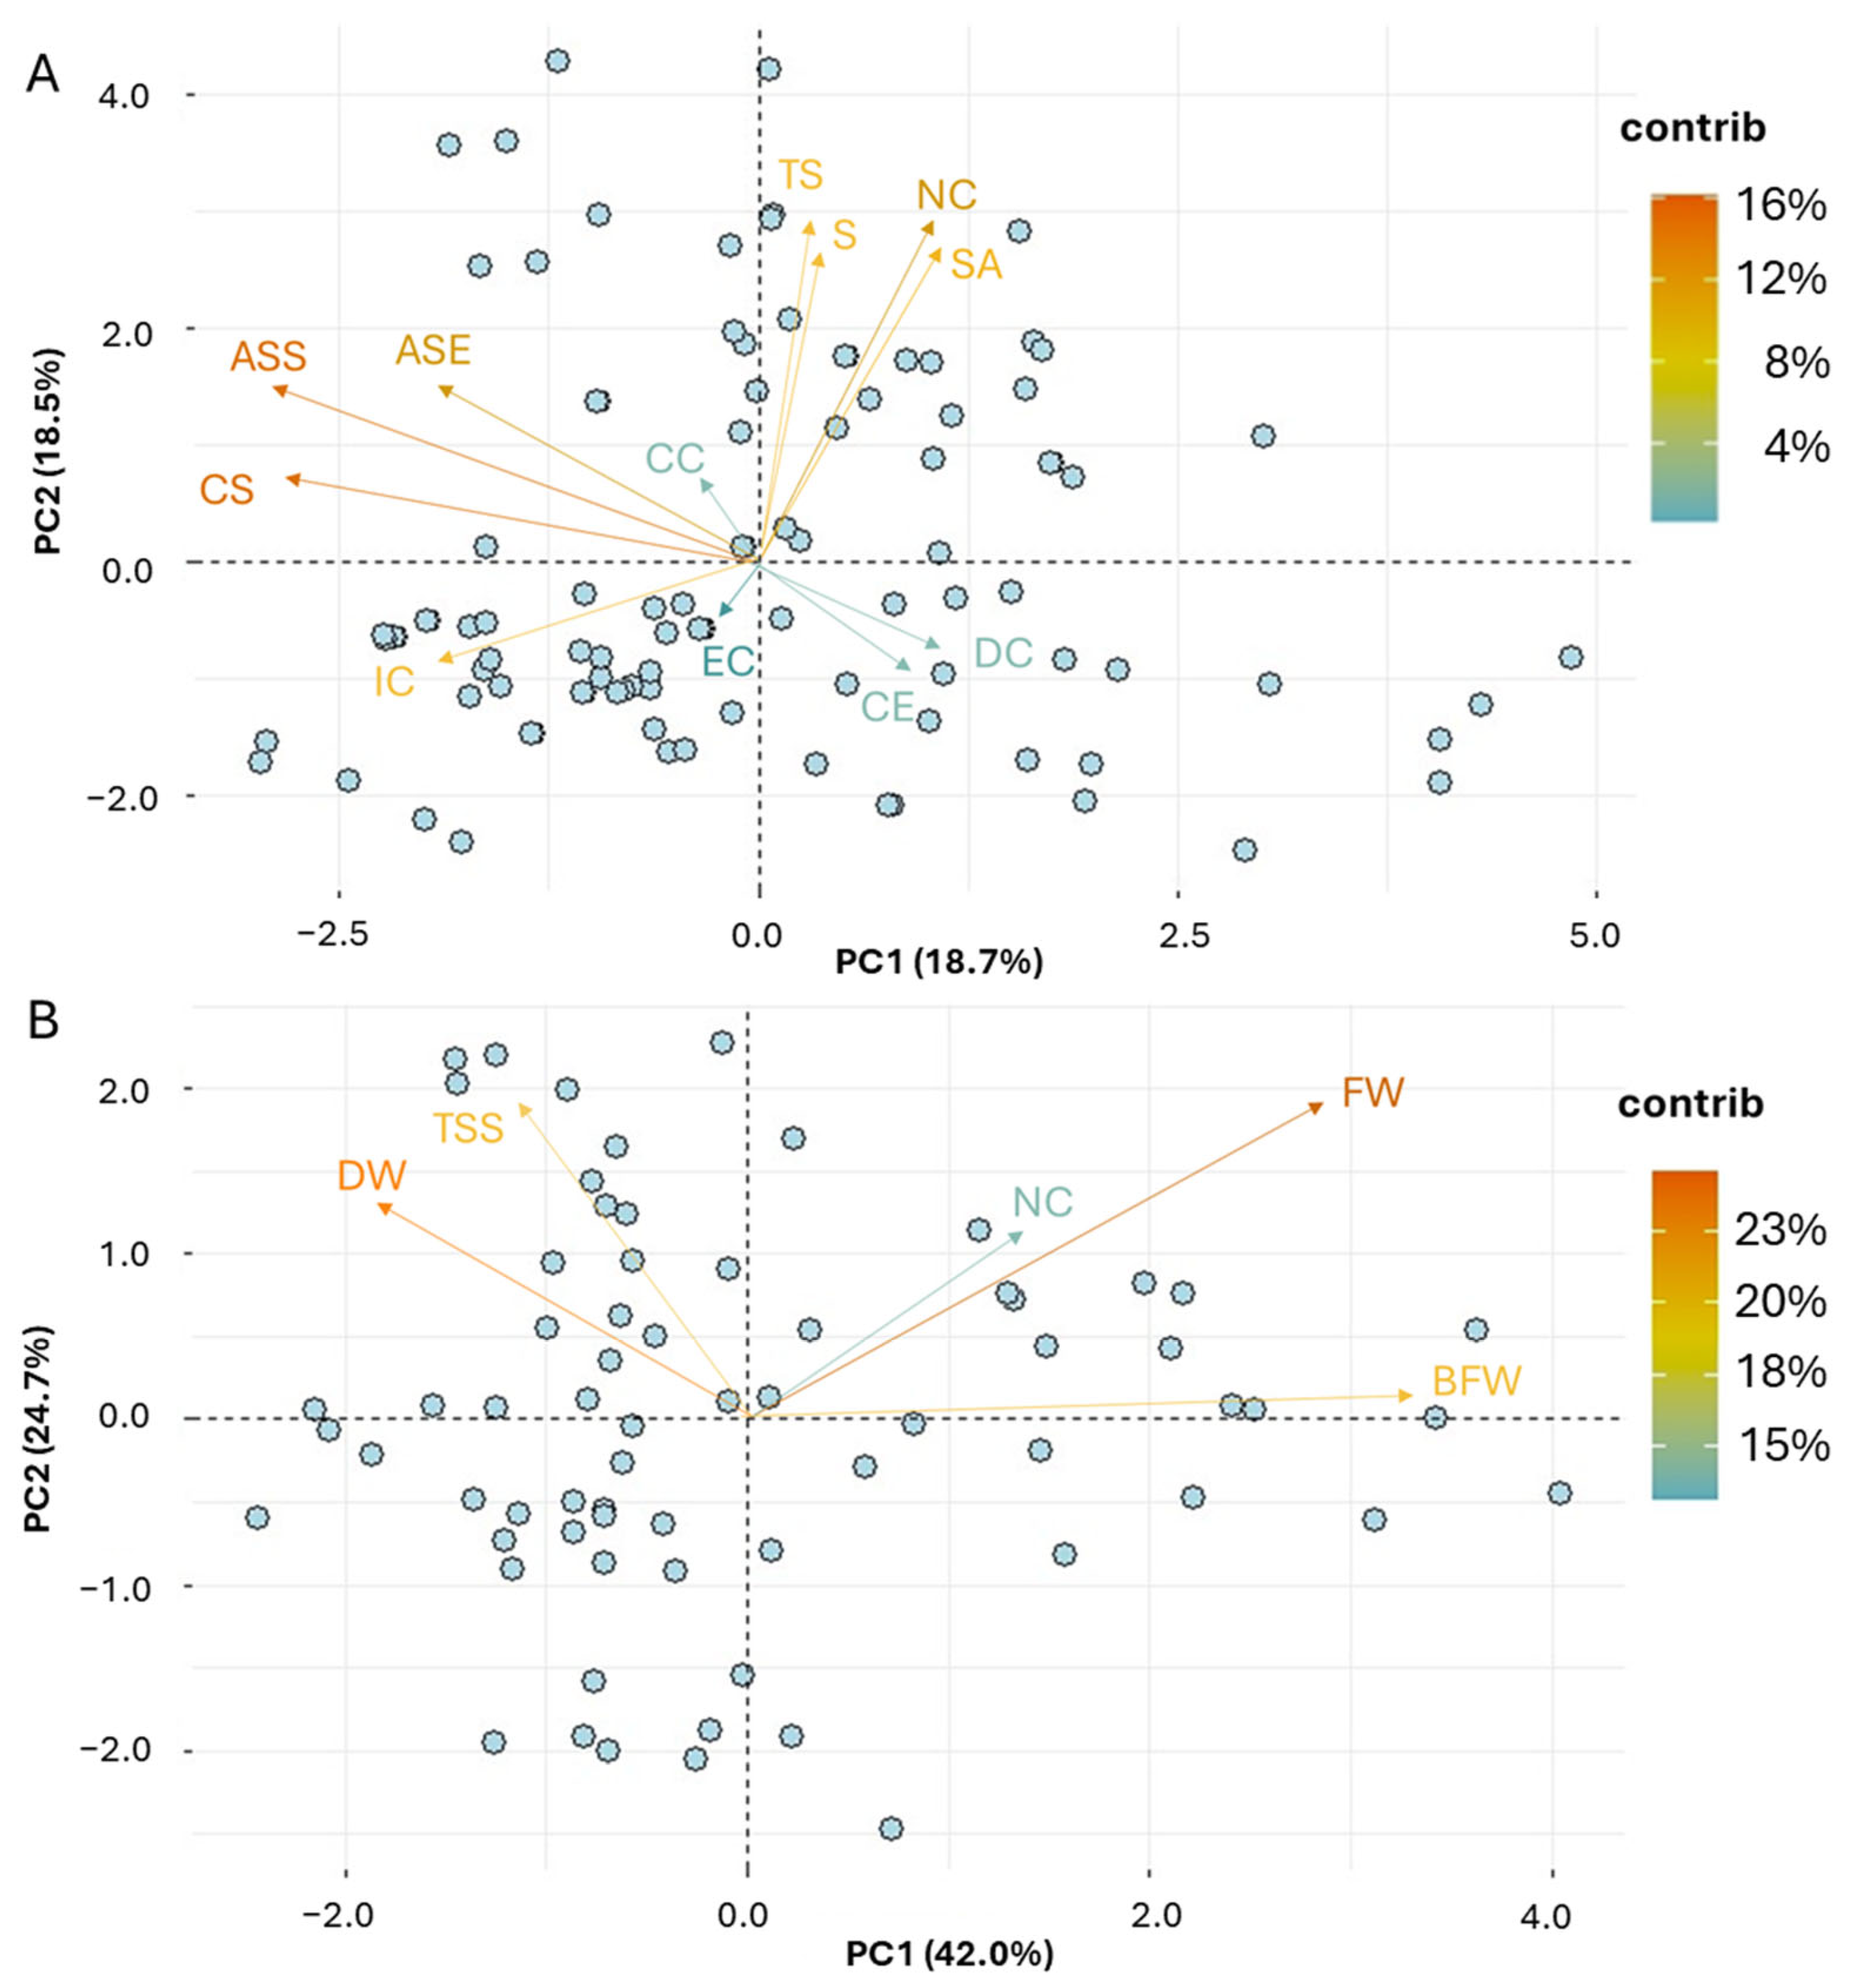
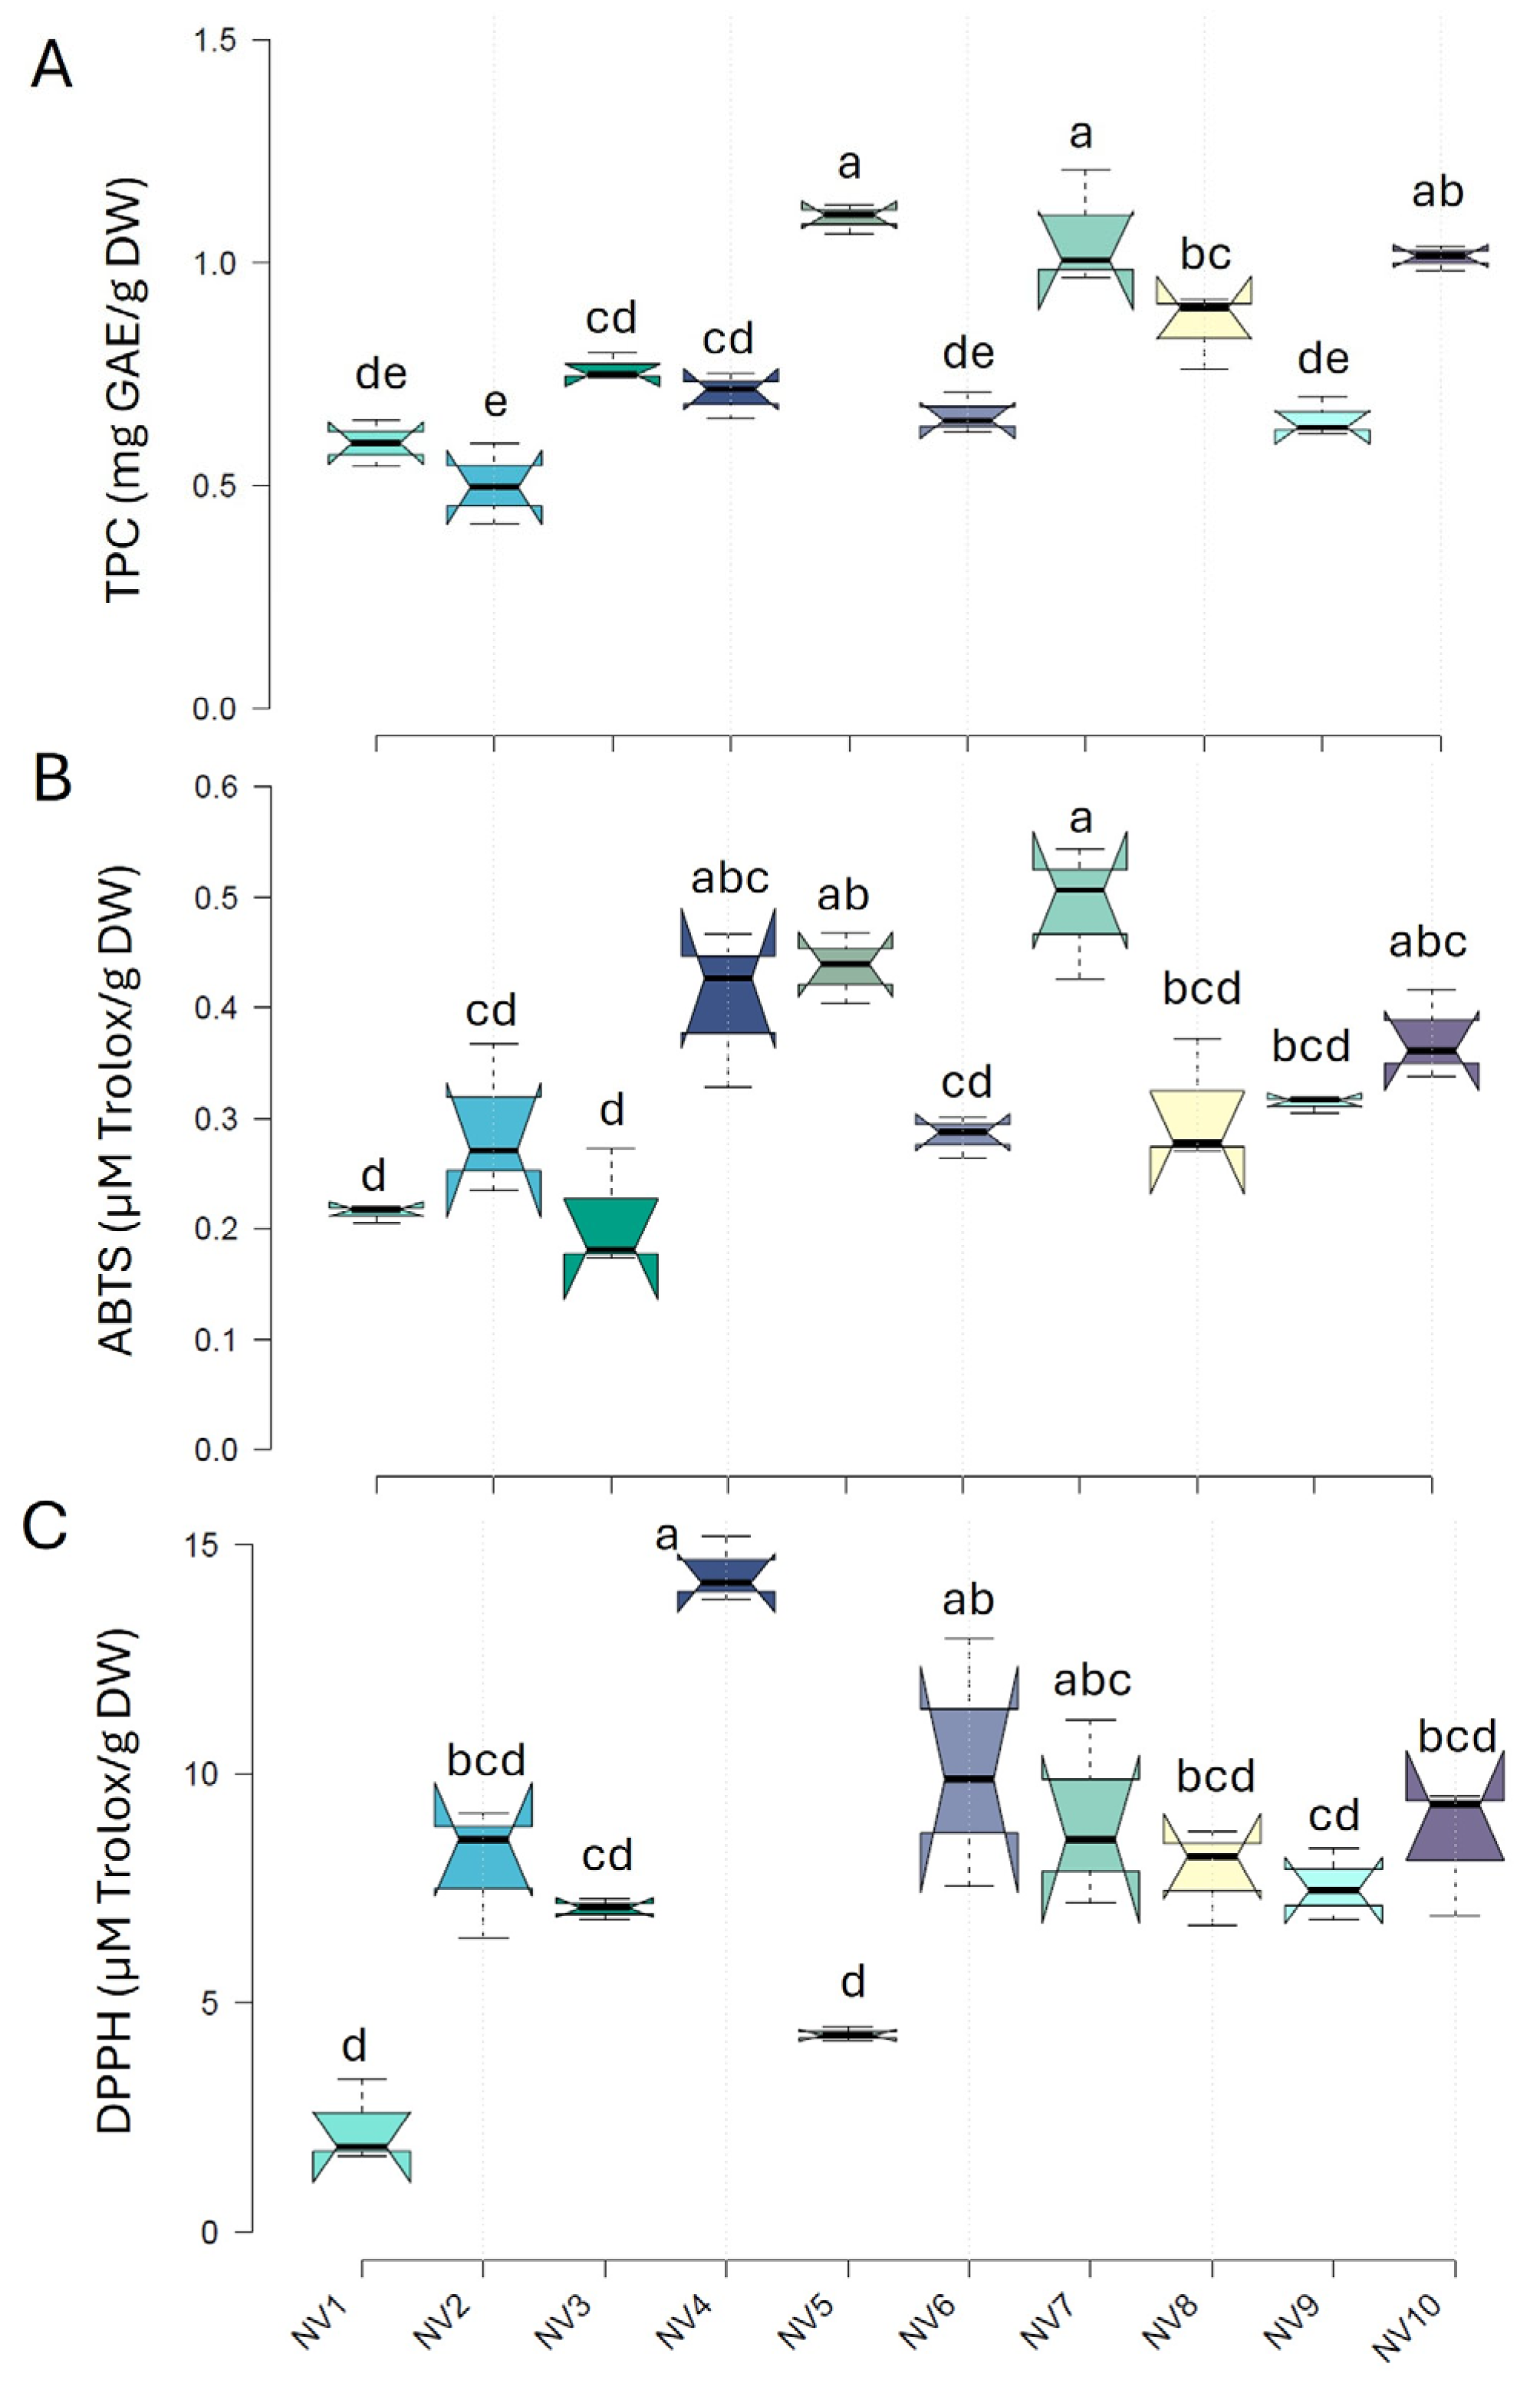
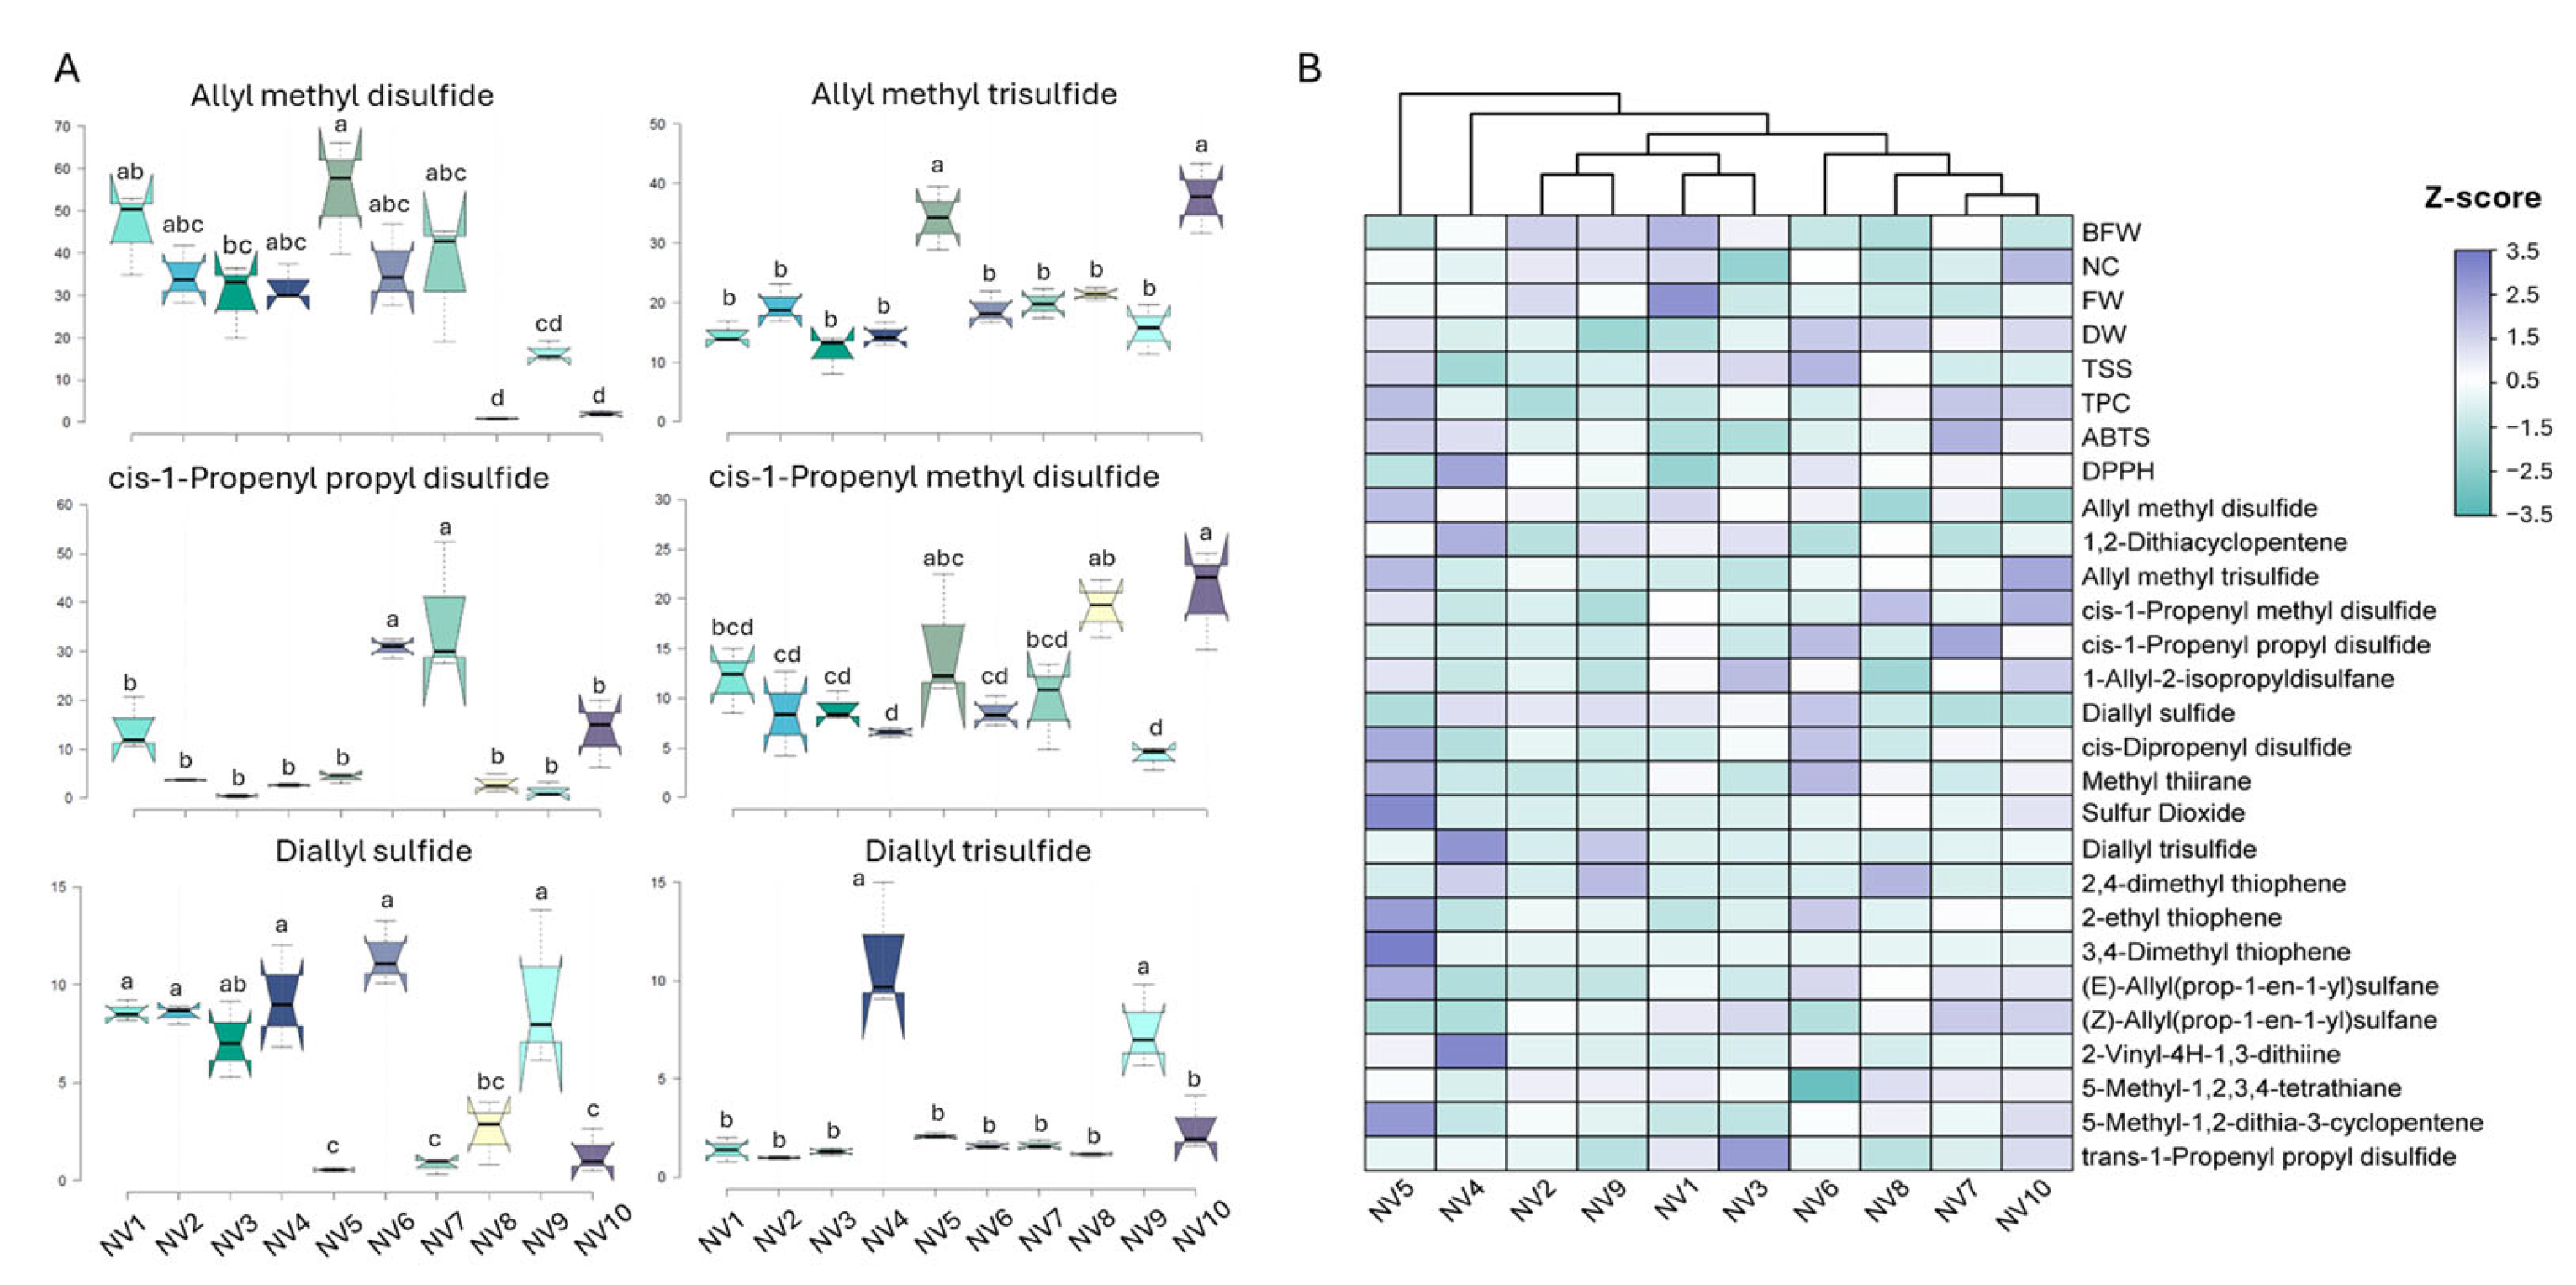
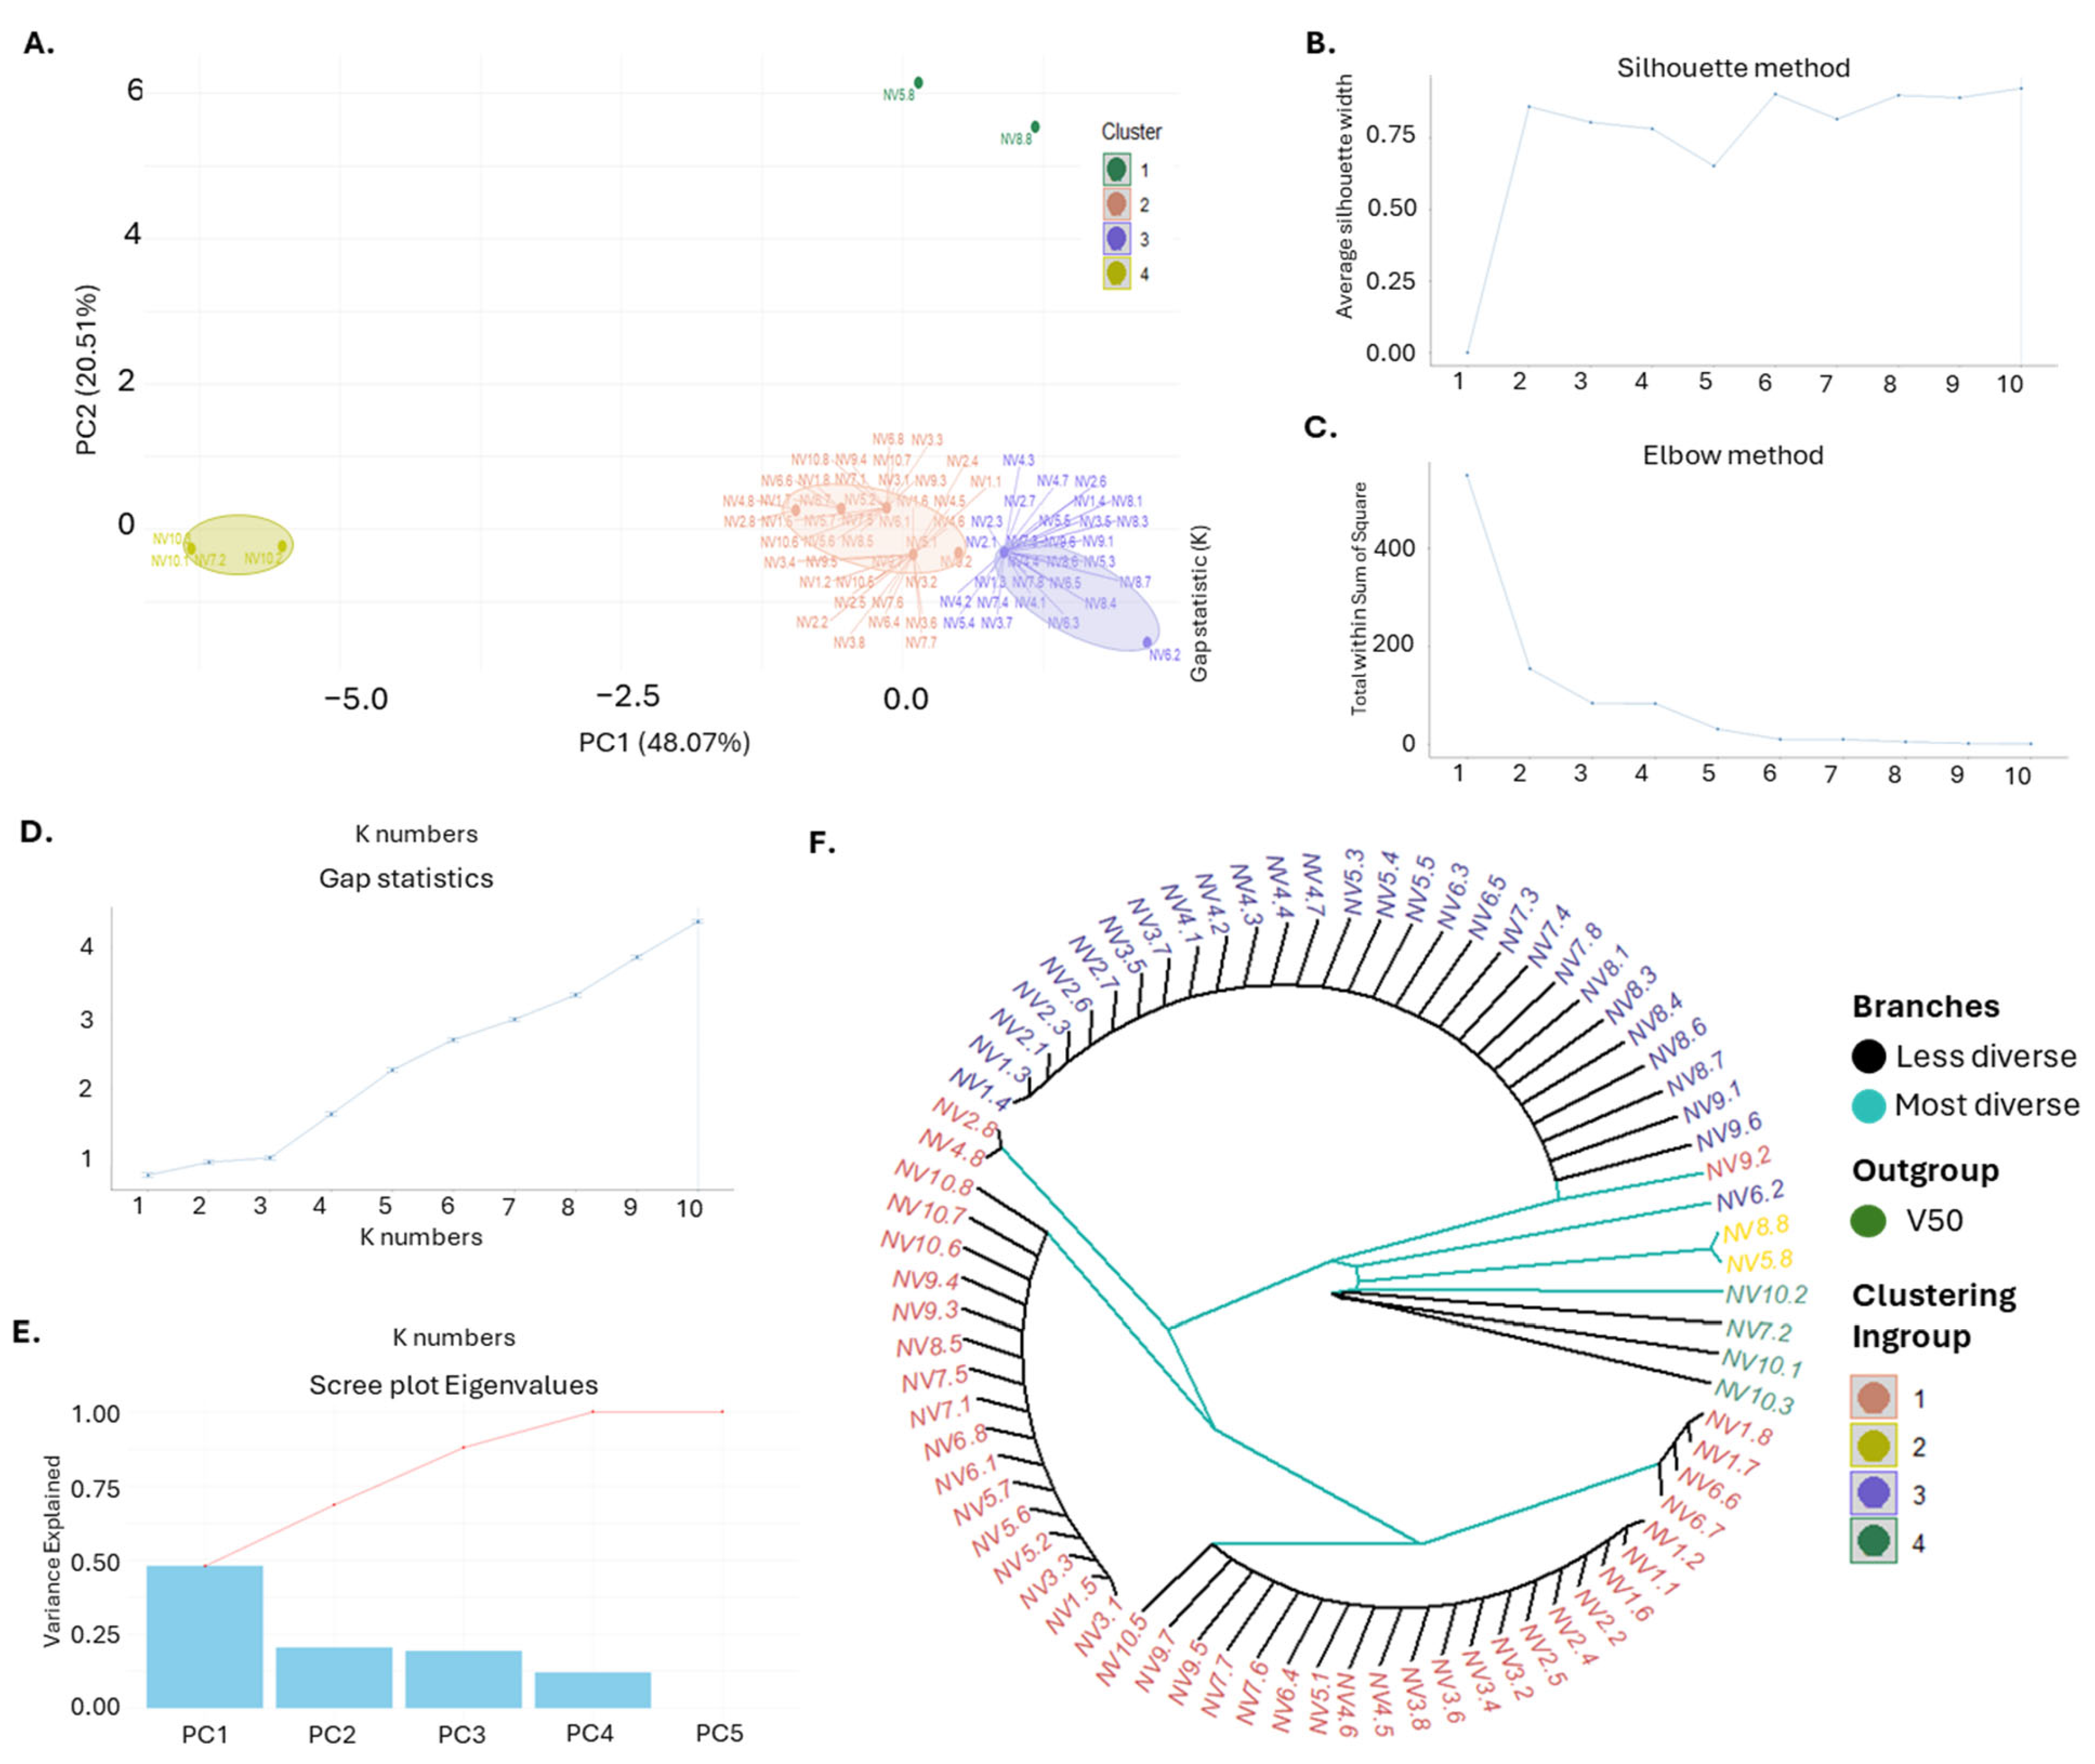

Disclaimer/Publisher’s Note: The statements, opinions and data contained in all publications are solely those of the individual author(s) and contributor(s) and not of MDPI and/or the editor(s). MDPI and/or the editor(s) disclaim responsibility for any injury to people or property resulting from any ideas, methods, instructions or products referred to in the content. |
© 2025 by the authors. Licensee MDPI, Basel, Switzerland. This article is an open access article distributed under the terms and conditions of the Creative Commons Attribution (CC BY) license (https://creativecommons.org/licenses/by/4.0/).