Article

A Biostimulant from Kappaphycus alvarezii Enhances the Growth and Development of Basil (Ocimum basilicum L.) Plants

by
Aline Nunes
1,*,
Felipe de Souza Dutra
2,3,
Lohan Rodrigues Brandão Santos
3,
Camila Pimentel Martins
3,
Alex Ricardo Schneider
2,3,
Eva Regina Oliveira
3,
Milene Stefani Pereira-Vasques
1,
Gadiel Zilto Azevedo
3,
Jorge Luiz Barcelos Oliveira
3,
Valéria Cress Gelli
4,
Alex Alves dos Santos
5,
Marcelo Maraschin
3 and
Giuseppina Pace Pereira Lima
1
1
Plant Biotechnology and Postharvest Laboratory, Department of Chemical and Biological Sciences, Institute of Biosciences, São Paulo State University, Botucatu 18618-970, SP, Brazil
2
Laboratory of Biotechnology of Natural and Synthetics Products, Institute of Biotechnology, University of Caxias do Sul, Caxias do Sul 95070-560, RS, Brazil
3
Laboratory of Plant Morphogenesis and Biochemistry, Department of Plant Science, Federal University of Santa Catarina, Florianópolis 88034-000, SC, Brazil
4
Fisheries Institute, APTA at Secretariat of Agriculture and Supplies of São Paulo State, São Paulo 11680-000, SP, Brazil
5
Company of Agricultural Research and Rural Extension of Santa Catarina, Florianópolis 88034-000, SC, Brazil
*
Author to whom correspondence should be addressed.
Horticulturae 2025, 11(4), 424; https://doi.org/10.3390/horticulturae11040424
Submission received: 27 January 2025 / Revised: 27 February 2025 / Accepted: 1 March 2025 / Published: 16 April 2025

Abstract

:
This study evaluated the efficacy and optimal concentrations of Kappaphycus alvarezii biostimulant from São Paulo (Kal-SP) and Santa Catarina (Kal-SC) for the hydroponic cultivation of basil (Ocimum basilicum). Basil plants were grown with 1%, 3%, 5%, and 7% concentrations of each extract using distilled water as a control. The extracts were applied via weekly foliar sprays. Morphological and biochemical parameters, in addition to the biogenic amine profile, were evaluated. Morphologically, 3% Kal-SP increased plant height by 17.1% and length of the roots by 54.8%, while 3% and 5% Kal-SC enhanced node number by 95.2% and 120.2%, respectively. Biochemically, 5% Kal-SP and 1% and 7% Kal-SC maximized chlorophyll and carotenoid content, 5% Kal-SP and 5–7% Kal-SC increased soluble sugars, and 7% Kal-SP and 3–7% Kal-SC elevated starch. Amino acid levels were the highest with 7% Kal-SP and 5% Kal-SC. The biogenic amine profile was also modulated by the K. alvarezii extracts, demonstrating their ability to influence compounds of interest. The results suggest that 3% or higher concentrations of these extracts can be beneficially applied to basil cultivation, with potential variations depending on the seaweed’s geographic origin.

1. Introduction

The constant search for ways to increase the productivity and quality of crops has been an ongoing challenge in the agricultural sector. In this context, using natural compounds capable of stimulating and enhancing plants’ metabolic and physiological responses emerges as a promising alternative [1]. Among the alternatives, extracts derived from natural sources, commonly referred to as biostimulants or biofertilizers, have stood out [2,3]. These products, made from renewable raw materials, such as plants and algae, contain bioactive compounds capable of stimulating the growth and development of crops sustainably [1,4].
In particular, extracts from marine algae have demonstrated their efficacy in enhancing the performance of different plant species [4]. In a review conducted by Munaro et al. [5], it is noted that the various metabolites found in micro and macroalgae have significant effects on plants. These effects include increased germination rates, enhancement in length, weight, and growth of both aerial and root parts, and early flowering. Additionally, there is an intensification of the synthesis of pigments such as chlorophylls and carotenoids, along with primary and secondary metabolites. Thus, the use of algal-based biostimulants proves to be promising for promoting sustainable and productive agriculture.
One of the seaweed species suitable for agricultural use is Kappaphycus alvarezii, containing rich compounds such as polysaccharides, proteins, vitamins, minerals, and phenolic compounds, which exert stimulating and protective effects on plants [6]. The potential of using biostimulant of K. alvarezii in agriculture has already been demonstrated by several scientific studies [7,8,9,10]. In a study by our research group [11], in a systematic literature review on the use and application of K. alvarezii in different sectors, it was verified that between 2017 and 2023 alone, 34 manuscripts addressed the use of this macroalgae in agriculture. The results of application included increasing quality and productivity (n = 22), stress reduction (n = 5), elicitor of pathogen resistance (n = 4), transcriptional changes (n = 2), and increase shelf life (n = 1).
However, there is still a need to deepen the understanding of the optimal concentrations of these biostimulants, particularly in hydroponic systems. Each plant may have specific requirements, and the interactions with hydroponic cultivation can significantly influence the efficacy and absorption of the compounds present in the extracts. Furthermore, the hydroponic market can be a significant consumer due to the expansion of its use in recent years. The global hydroponic market is estimated to reach USD 25.1 billion by 2027, with a compound annual growth rate (CAGR) of 15.6% between 2022 and 2027 [12].
Given this context, the aim of this study was to evaluate the efficiency and appropriate concentrations of the biostimulant of K. alvarezii in the hydroponic production system of basil (Ocimum basilicum) plants. Basil is not only a widely used culinary herb but also has significant medicinal properties, making it an important crop for both economic and health reasons. This investigation aims to contribute to the development of more sustainable agricultural practices, with the use of natural inputs and the minimization of environmental impacts.

2. Materials and Methods

2.1. Sample Collection

Samples of K. alvarezii, both red and green strains, were collected from two locations, the Fisheries Institute at the Research and Development Center of the North Coast in Ubatuba, São Paulo (23°27′07″ S, 45°02′49″ W) and a marine farm situated in the municipality of Florianópolis, Santa Catarina (27°42′32.724″ S, 48°33′35.5″ W), Brazil (Figure 1).
K. alvarezii samples were collected on the same day (19 February) in São Paulo (SP) and Santa Catarina (SC) to maintain homogeneity in terms of seasonality (from summer cultivation) and cultivation time.

2.2. Biostimulant

The collected algal biomass was first washed with chlorinated water to remove salt, impurities, and fouling organisms. Next, the red and green strains of K. alvarezii were weighed separately to ensure the same quantity between them for the production of the biostimulant (MIX). The extraction was conducted using an industrial blender, where the algae were crushed and filtered. For this, 500 g of each algae (green and red) was used. The biostimulant was kept in a freezer at −20 °C until analysis. To differentiate the obtained extracts, the term “Kal-SP” was used for the extract from the K. alvarezii cultivation carried out in the state of São Paulo, and “Kal-SC” was used for the extract from the cultivation carried out in the state of Santa Catarina. Information on biochemical composition is provided in the Supplementary Material (Tables S1 and S2).

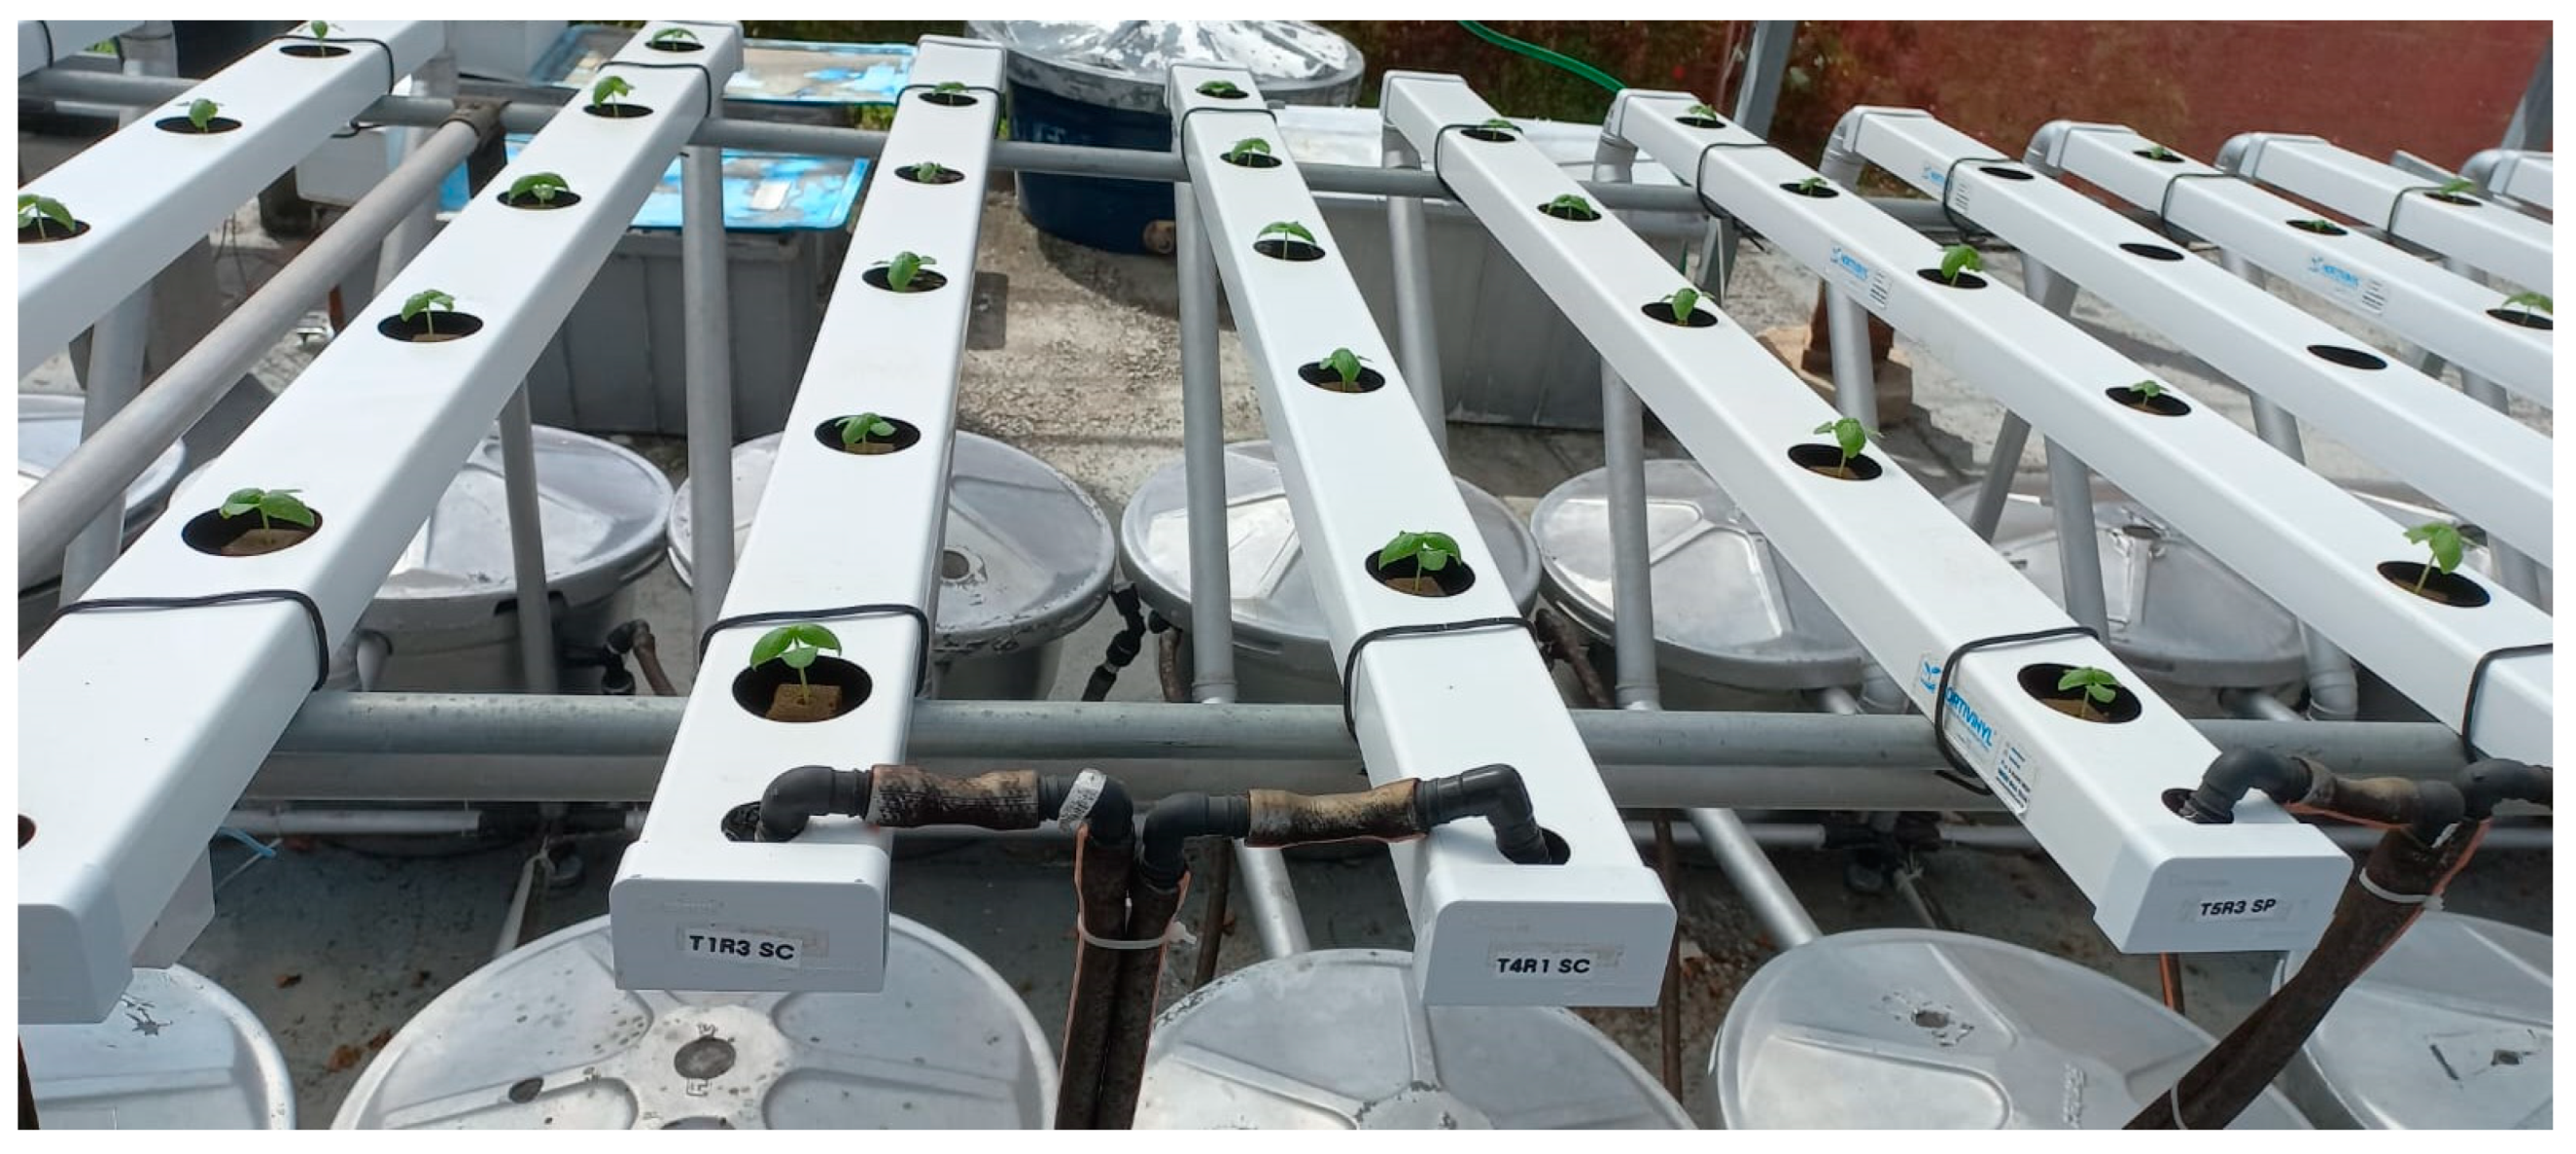
2.3. Experiment in Hydroponics

Basil seeds (Ocimum basilicum; variety of sweet basil) were obtained from the company Isla Sementes® (Porto Alegre, RS, Brazil), where they showed 97% germination, 100% purity, and validity until 2025. Initially, the seeds were sown in a spongy phenolic foam plate for hydroponics and kept in a germination incubator (30 °C). Later, they were transferred to a greenhouse to stimulate initial growth (15 h of photoperiod) and cultivated using the Nutrient Film Technique (NFT), containing a hydroponic nutrient solution (0.3 mS.cm−1 electrical conductivity) for eight days. After cotyledon growth, the plants were transferred to a hydroponic Nutrient Film Technique (NFT) system, with five net pot holes (20 cm spaced) and one individual nutritional solution tank per channel (gutters) (Figure 2). Three channels were allocated per treatment, totaling 15 plants per treatment distributed across the 15 channels. In total, 150 plants were analyzed.
The hydroponic nutrient solution was composed of calcium nitrate (Ca(NO3)2—4.5 mM), potassium nitrate (KNO3—4.9 mM), monoammonium phosphate (NH4H2PO4—1.3 mM), magnesium sulfate (MgSO4—3.3 mM), copper sulfate (CuSO4—0.006 mM), manganese sulfate (MnSO4—0.04 mM), zinc sulfate (ZnSO4—0.012 mM), boric acid (H3BO3—0.13 mM), sodium molybdate (Na2MoO4—0.001 mM), and iron chelate ethylenediamine-N,N′-bis(2-hydroxyphenyl)acetic acid (EDDHA—0.08 mM). This nutrient solution provides the plants with essential micronutrients and macronutrients for the development of basil [13].
The experiment was conducted in a single-span arch greenhouse covered with a 0.1 mm transparent polyethylene film and consisted of a hydroponic system supported by an aluminum structure that provided a slope of 1.5% from the entrance to the exit. The pumps circulated the solution for 10 min in a 10 min cycle from 8 a.m. to 6 p.m. and for 10 min in a 1 h cycle from 6 p.m. to 8 a.m. the next day.
During the cultivation period, from 1 April to 9 May 2024, the average maximum air temperature recorded was 30 °C ± 3.5 and the minimum was 20.9 °C ± 2.3. The average humidity varied from 90.7% ± 2.77 to 70.2% ± 11.1, and the photoperiod was 12/12 (light/dark).
The biostimulants from K. alvarezii were applied via foliar spray to the plants, weekly, at concentrations of 1%, 3%, 5%, and 7%. To obtain the concentrations, the pure biostimulant (100%) was diluted in distilled water. Distilled water was used as a control. In total, 10 treatments were tested, two of which were controls, one as a control for each State, i.e., SP and SC. Thus, the treatments were T1—Control; T2—1%; T3—3%; T4—5%; and T5—7%. Therefore, individual experiments were carried out with Kal-SP and Kal-SC.

Basil Cultivation

Initially, the basil plants were maintained in the nutritive solutions with a conductivity of 0.8 mS.cm−1, being increased to 1.2 mS.cm−1 after two weeks, 1.5 mS.cm−1 after another week, and 2.0 mS.cm−1 the following week. This incremental adjustment of the conductivity was determined based on the basil plant growth and development, which is indicative of accelerated growth and greater consumption of the nutrient solution as the plants grow [14]. The plants were harvested after 38 days in the channels, just as they began to flower.
The application of the biostimulant of K. alvarezii was carried out weekly using a spray bottle, totaling five foliar applications. The times of foliar spraying were specified according to the plant growth stages to optimize absorption and effectiveness. The application volume was defined according to the plants’ leaf growth; therefore, the following were carried out: 1st application—two sprays (1 mL per plant) during the early growth stage; 2nd application—three sprays (1.5 mL per plant) at the vegetative stage; 3rd application—five sprays (2.5 mL per plant) at the vegetative stage; 4th application—seven sprays (3.5 mL per plant) during the at the mid-growth stage; 5th application—twelve sprays (6 mL per plant) at the pre-flowering stage.

2.4. Morphological Analyses

The 150 plants were analyzed for the following parameters: plant height (cm), number of nodes (n), length of the roots (cm), fresh weight of shoot (g), and fresh weight of root (g). To measure the height of the aerial part and the length of the roots of the basil plants, a ruler was used for direct measurement. In addition, an analytical balance was used to weigh the plants. The dry weight of the aerial part (g) was measured for only three plants per treatment to have biomass available for oil extraction and freeze-drying for analysis of biogenic amines. Thus, to analyze the dry mass of the aerial part, the plants were collected from plants arranged in the fifth channel (gutter) of the hydroponic system, with three replicates of each treatment. Drying was carried out in an oven at 45 °C until a constant weight was reached (forced air convection drying oven with air circulation and renewal, with a fan turbine for air displacement and temperature controller; DeLeo DL—AF, Porto Alegre, RS, Brazil). The remaining plants were stored in food-grade plastic packaging and kept at −80 °C for subsequent freeze-drying (0.040 mbar vacuum, condensation chamber at −50 °C; LabConco Corporation, Kansas, MO, USA).

2.5. Biochemical Analyses

For biochemical analyses, one day before collecting all the plants, two leaves were removed from the plant found in channel two of each gutter, totaling three true replications for each treatment, and these were also carried out in triplicate for each analysis, totaling nine repetitions per treatment. The leaves removed were the two largest after the first node. On the day of removal, the leaves were weighed for all analyses and kept in a falcon tube in a −20 °C freezer. That same day, the analysis of pigments, chlorophyll-a, chlorophyll-b, and total chlorophylls and total carotenoids was carried out, due to the possibility of their degradation. The remaining analyses, i.e., total phenolic content, total flavonoid content, antioxidant activity 2,2-diphenyl−1-picrylhydrazyl (DPPH), total soluble sugars, total starch, total carbohydrate, total protein, and total amino acids, were subsequently analyzed. To carry out the analyses, the leaves were initially macerated with liquid nitrogen to guarantee the compounds’ extraction.

2.5.1. Chlorophyll (Chl) and Total Carotenoid (TCN)

Overall, 100 mg of the leaf samples were incubated in a water bath with 7 mL of dimethyl sulfoxide (DMSO; Sigma-Aldrich, St. Louis, MO, USA) for two hours at 65 °C. The extract was recovered by filtration, and the final volume of this extract was adjusted to 10 mL with DMSO, with adjustments to the protocol described by Hiscox and Israelstam [15]. The absorbance values at 480, 649, and 665 nm were obtained using a spectrophotometer (Bel Spectro LGS53, BioVera, Rio de Janeiro, Brazil). The formulas of Wellburn [16] were used, and the data are expressed in mg/g:
Chlorophyll-a = [12.19 × (A665) − 3.45 × (A649)]
Chlorophyll-b = [21.99 × (A649) − 5.32 × (A665)]
For quantification of total carotenoids in the DMSO extract, the following formula was used:
Total carotenoids = [1000 × (A480) − 2.14 × (Chl a) − 70.16 × (Chl b)]/220

2.5.2. Total Soluble Sugars (TSS)

The TSS was determined using a method adapted from Umbreit and Burris [17]. Briefly, 50 mg of the leaves were extracted with 2 mL of methanol, chloroform, and water (MCW, 12:5:3; Sigma-Aldrich, St. Louis, MO, USA) solution. The mixture was centrifuged (10 min, 4000 rpm), and the supernatant was collected. A second extraction was performed on the remaining pellet, and the supernatants were combined. The upper (aqueous) phase was collected, and 2 mL of 0.2% anthrone solution (Sigma-Aldrich, St. Louis, MO, USA) in sulfuric acid (Sigma-Aldrich, St. Louis, MO, USA) was added and vortexed (Marconi MA162, Piracicaba, SP, Brazil). The solution was heated in a water bath (100 °C) for 3 min, then cooled to room temperature. The absorbance was measured at 630 nm using a UV–vis spectrophotometer (SpectraMax 190 Microplate Reader, Molecular Devices, Silicon Valley, CA, USA). Glucose (Sigma-Aldrich, St. Louis, MO, USA) was used as a standard curve at concentrations ranging from 62.50 to 2000 μg/mL (y = 0.0018x, r2 = 0.9517).

2.5.3. Total Starch (TS)

The TS content was determined using a method adapted from Umbreit and Burris [17]. The remaining pellet from the TSS analysis was extracted with 2 mL of 30% perchloric acid (Sigma-Aldrich, St. Louis, MO, USA), centrifuged (10 min, 4000 rpm), and the supernatant was collected. This extraction was repeated, and the supernatants were combined. An aliquot of 1 mL was mixed with 2 mL of 0.2% anthrone solution in sulfuric acid and vortexed. The mixture was heated in a water bath (100 °C) for 3 min, then cooled to room temperature. The absorbance was measured at 630 nm using a microplate reader (ThermoPlate®, model P-reader; Dallas, TX, USA). A calibration curve was prepared using starch (Sigma-Aldrich, St. Louis, MO, USA) at concentrations ranging from 62.50 to 2000 μg/mL (y = 0.0016x, r2 = 0.9916).

2.5.4. Total Carbohydrate (TC)

The TC was determined using a method adapted from DuBois et al. [18]. Briefly, 50 mg of the leaf was mixed with 20 mL of distilled water, centrifuged (10 min, 4000 rpm), and 2 mL of the supernatant was collected. To this, 0.05 mL of 80% phenol (Sigma-Aldrich, St. Louis, MO, USA) and 5 mL of concentrated sulfuric acid were added. After 10 min, the mixture was vortexed and incubated in a water bath (30 °C) for 15 min. The absorbance was measured at 490 nm using a UV–vis spectrophotometer (SpectraMax 190 Microplate Reader, Molecular Devices, Silicon Valley, CA, USA). A calibration curve was prepared using galactose (Sigma-Aldrich, St. Louis, MO, USA) at concentrations ranging from 7.80 to 500 μg/mL (y = 0.0025x, r2 = 0.9992).

2.5.5. Total Phenolic Content (TPC)

The methodology employed was based on Singleton, Orthofer, and Lamuela-Raventós [19], with some modifications. For the analysis, 300 mg of each leaf was weighed and added with 6 mL of 80% methanol (Sigma-Aldrich, St. Louis, MO, USA). The mixture was then kept in the dark for 1 h. Subsequently, the samples were centrifuged (5 min, 4000 rpm, at room temperature), and 100 µL of the supernatant was collected. In a new Falcon tube, 75 µL of Folin–Ciocalteu reagent (Sigma-Aldrich, St. Louis, MO, USA) and 825 µL of 2% (w/v) sodium carbonate solution (Sigma-Aldrich, St. Louis, MO, USA) was added to the supernatant, and the mixture was left in the dark (1 h). Then, 300 µL of the sample was dispensed into microplates (n = 3). The absorbance was measured at 750 nm using a microplate reader (ThermoPlate®, model P-reader; Dallas, TX, USA). Gallic acid was used as an analytical standard (Sigma-Aldrich, St. Louis, MO, USA) at concentrations from 7.81 to 500 µg/mL (y = 0.006x, r2 = 0.9967) for the determination of TPC.

2.5.6. Total Flavonoid Content (TFC)

The TFC was determined using a method adapted from Woisky and Salatino [20]. From the supernatant obtained during the TPC analysis, 500 μL was withdrawn and mixed with 2.5 mL of absolute ethanol and 500 μL of 2% aluminum chloride solution in methanol (all Sigma-Aldrich, St. Louis, MO, USA). The mixture was then vortexed. After incubation for 1 h in the dark, the absorbance was measured at 420 nm using a microplate reader (ThermoPlate®, model P-reader; Dallas, TX, USA), with 300 μL of the sample (n = 3). A calibration curve was generated using quercetin as the standard (Sigma-Aldrich, St. Louis, MO, USA) at concentrations ranging from 7.81 to 500 μg/mL (y = 0.0056x, r2 = 0.9799).

2.5.7. DPPH Antioxidant Activity

The methodology used for the analysis was that of Kim et al. [21], with adaptations. From the supernatant obtained during the TPC analysis, 10 µL of the sample was taken, and 290 µL of reaction solution containing DPPH (Sigma-Aldrich, St. Louis, MO, USA) diluted in methanol was added. The 300 µL were plated and kept under agitation in the microplate (ThermoPlate®, model P-reader; Dallas, TX, USA) for 30 min. The reading was performed afterward at 540 nm. The DPPH radical scavenging activity was calculated using the following equation:
(%) − ((Control absorbance − Sample absorbance)/Control absorbance) × 100%
where the control absorbance is the absorbance of the diluted DPPH and the sample absorbance is the absorbance of the reaction (DPPH + extract).

2.5.8. Total Soluble Protein (TP)

The total soluble protein content was determined using the Bradford [22] method with some adaptations. Briefly, 200 mg of the leaf sample was extracted with 10 mL of phosphate-buffered saline (PBS; Sigma-Aldrich, St. Louis, MO, USA), vortexed, allowed to stand for 15 min, and centrifuged (10 min, 4000 rpm). An aliquot of 100 µL of the supernatant was mixed with 5 mL of a 1:5 dilution of the Bradford reagent (Sigma-Aldrich, St. Louis, MO, USA) in water and allowed to stand for 5 min. The absorbance was measured at 595 nm using a microplate reader (ThermoPlate®, model P-reader; Dallas, TX, USA). A calibration curve was prepared using bovine serum albumin (Sigma-Aldrich, St. Louis, MO, USA) at concentrations ranging from 3.90 to 62.5 μg/mL (y = 0.0032x, r2 = 0.9772).

2.5.9. Total Amino Acids (TAAs)

The TAA value was determined using a method adapted from Silveira et al. [23]. Briefly, 100 mg of the leaf sample was extracted with 2 mL of water, vortexed, and centrifuged (4000 rpm, 10 min). An aliquot of 1 mL of the supernatant was mixed with 3 mL of 0.2% ninhydrin solution (in sodium phosphate buffer, pH 7.0; Sigma-Aldrich, St. Louis, MO, USA) and heated in a water bath at 100 °C for 30 min. After cooling to room temperature, the absorbance was measured at 570 nm using a microplate reader (ThermoPlate®, model P-reader; Dallas, TX, USA). A calibration curve was prepared using proline (Sigma-Aldrich, St. Louis, MO, USA) at concentrations ranging from 1.95 to 499.20 μg/mL (y = 0.0026x, r2 = 0.9962).

2.6. Profile of Biogenic Amines and Amino Acids

The extraction of biogenic amines and amino acids from the samples was carried out according to the method described by Borges et al. [24]. To 150 mg of dry sample, 3 mL of 5% perchloric acid was added. The mixture was homogenized by vortexing for 30 s and placed in an ice-cold ultrasonic bath (Elma Transonic 420, Singen, Konstanz, Germany) for 30 min. Centrifugation (Hettich Mikro 220R, Kirchlengern, Herford, Germany) was carried out at 6000 rpm, 10 min, 5 °C. In total, 200 µL of the supernatant was added to a glass test tube together with 200 µL of carbonate buffer pH 11 and 400 µL of dansyl chloride reagent (Sigma-Aldrich, St. Louis, MO, USA), which was combined and incubated for 1 h in an oven at 60 °C. Subsequently, 100 µL of proline (Dinâmica, Indaiatuba, SP, Brazil) was added, and the mixture was incubated again for 1 h in the dark at room temperature with vortexing every 15 min. Then, 1000 µL of toluene (Sigma-Aldrich, St. Louis, MO, USA) was added, vortexed for 1 min, and then centrifuged at 6000 rpm, 10 min, at 5 °C. The supernatant was transferred to a plastic test tube and dried under nitrogen. Overall, 1 mL of acetonitrile (Merck) was added to resuspend the samples, which were then homogenized in a vortex for 1 min. Then, the samples were subjected to an ultrasonic bath for 1 min and centrifuged again. The supernatant was filtered with a Millex® polyethersulfone syringe filter pore (0.22 μm, diam. 33 mm, sterile, hydrophilic) and stored in a vacuum. Sample profile analyses were conducted using ultra-high-performance liquid chromatography, UHPLC (Therme Scientific Ultimate 3000, Waltham, MA, USA), following the methodology described by Diamante et al. [25]. The mobile phases consisted of 50% acetonitrile (A) and 100% acetonitrile (B), with a gradient program (all Sigma-Aldrich, St. Louis, MO, USA). The identification of biogenic amines and amino acids was based on retention times of analytical standards (Sigma-Aldrich, St. Louis, MO, USA) at 225 nm. The column used was the ACE C18 column (4.6 × 250 mm; 5 µm). The concentrations of the amines serotonin, dopamine, agmatine, tryptamine, putrescine, cadaverine, spermidine, spermine, histamine, and tyramine, as well as the amino acids 5-hydroxytryptophan and tryptophan (all Sigma-Aldrich, St. Louis, MO, USA), were expressed in µg per g.

2.7. Essential Oil Extraction

The extraction of the essential oil was attempted exhaustively, varying the volume of biomass and distilled water in a Clevenger-type apparatus (NetLab, Tatuapé, SP, Brazil). However, even with the equipment running for 8 h, it was not possible to obtain essential oil from the basil, which may have occurred due to the lack of abiotic and biotic stresses, which would have caused the plant to produce the oil. Furthermore, oil production may not have been possible due to the harvest occurring in less than 60 days.

2.8. Statistical Analysis

For data analysis, the Tukey test (p ≤ 0.05) was performed with a 5% probability of error for the comparison of the means. Morphological parameters were analyzed in their entirety, except for the leaf and dry root. The results for the biochemical parameters were based on true triplicates, involving the analysis of three individual plants per treatment. Each plant was analyzed in triplicate, resulting in a total of nine repetitions per treatment for all analyses. It is important to highlight that, due to the individualized experiments, i.e., with separate applications of Kal-SP and Kal-S, the statistical analysis was conducted considering the biostimulants separately, as both were cultivated with an individual control treatment. All data were analyzed by AgroEstat software (v. 1.1.0.712).
The morphological parameters (plant height, number of nodes, length of the roots, shoot fresh weight, root fresh weight, root dry weight, and shoot dry weight) and biochemical parameters (total phenolic content, total flavonoid content, DPPH, total soluble sugars, total starch, total carbohydrates, total proteins, and total amino acids) were analyzed by principal component analysis (PCA), using the singular value decomposition (SVD) algorithm. PCA analysis was performed using Unscrambler® X software (v. 10.4). Pearson correlation (p < 0.05) was applied to the dataset (morphological and biochemical parameters) using the Past software (v. 4.17). Mean values of biogenic amines and amino acids were used to generate a heatmap visualization of the data, created using Microsoft Excel (v. 2206).

3. Results and Discussion

3.1. Morphological Parameters

Among the morphological variables analyzed, it was found that there were different physiological responses when applying the Kal-SP and Kal-SC (Table 1). It was observed that the plants treated with the Kal-SP, at a concentration of 3%, showed a statistical difference from the other treatments, including the control, in terms of plant height (56.40 cm) and length of the roots (45.35 cm). There was an increase of 17.1% in the plant height of the 3% treatment as compared to control, as well as a 54.8% increase in the length of the roots.
As for the Kal-SC, there is better performance in plants treated with 3% and 5%, for the number of nodes per plant (45.67 and 51.53 nodes), respectively, statistically differing from the other treatments. Compared to the control, an increase of 95.2% was observed in the 3% treatment and 120.2% in the 5% treatment. In the root dry mass, it was observed that the 5% application resulted in a greater weight (3.20 g), differing statistically from the other treatments, with an increase of 37.3% in relation to the control. For the other parameters (root fresh mass, shoot fresh mass, and shoot dry mass), with both biostimulants, no statistical differences were recorded between treatments.
The statistical differences found, even for a few morphological variables (plant height, length of the roots, root dry mass, and number of nodes), demonstrate that even in a hydroponic cultivation system, which is already considered an efficient and appropriate system (i.e., efficient use of water, cultivation control, virtually absence of pests and soil-borne diseases), the use of the biostimulant of K. alvarezii can impact the growth and development of plants. Van Tol de Castro et al. [26] demonstrate that foliar application of 5% and 10% aqueous extract concentrations, similar to that obtained in our study, increased dry biomass in both roots and leaves of rice plants. Lower concentrations, such as 3%, stimulated the production of root fresh and dry biomass, while 2% increased the area, length, number, and volume of the roots. Pramanick et al. [27] describe that in potato plants treated with the foliar application, there was an increase in growth, productivity, and quality of the potatoes when 5% and 7.5% of the extract were applied. Overlal, 5% of the extract was also reported to be efficient in increasing sugarcane productivity and reducing greenhouse gas emissions [28].
Therefore, it is evident that while the effectiveness of the K. alvarezii extract on various crops has been demonstrated, there is still a need to identify the optimal concentrations of K. alvarezii. In our study, it is worth noting that the hydroponic system should also be considered a determining factor, given that, to date, no other studies have been found that have applied the biostimulant of this macroalgae in this type of cultivation system. Additionally, it is observed that the biostimulant of K. alvarezii cultivated in different locations can impact the results obtained, as will occur in this study, where the Kal-SP 3% appears to be effective in affecting plant height and length of the roots, while the Kal-SC 5% would be capable of acting on the number of nodes and root dry mass.
When using PCA, a total variance of 75% was found, with PC1 representing 48%. The parameters plant height, number of nodes, root fresh weight, shoot fresh weight, and root dry weight were grouped to the treatment of Kal-SP a 1% and 3%, and SC 7%, while length of the roots and shoot dry weight were grouped to the treatment of the Kal-SC at 5% (Figure 3).
Thus, it is observed that the cultivation of basil in a hydroponic system is affected by the use of biostimulant of K. alvarezii. However, its action on the growth and development of plants may differ depending on the location where this macroalgae is cultivated. Furthermore, it can be seen that the concentration of the extract can be decisive for the growth and development of basil, demonstrating that the highest concentration will not always induce a greater increase.

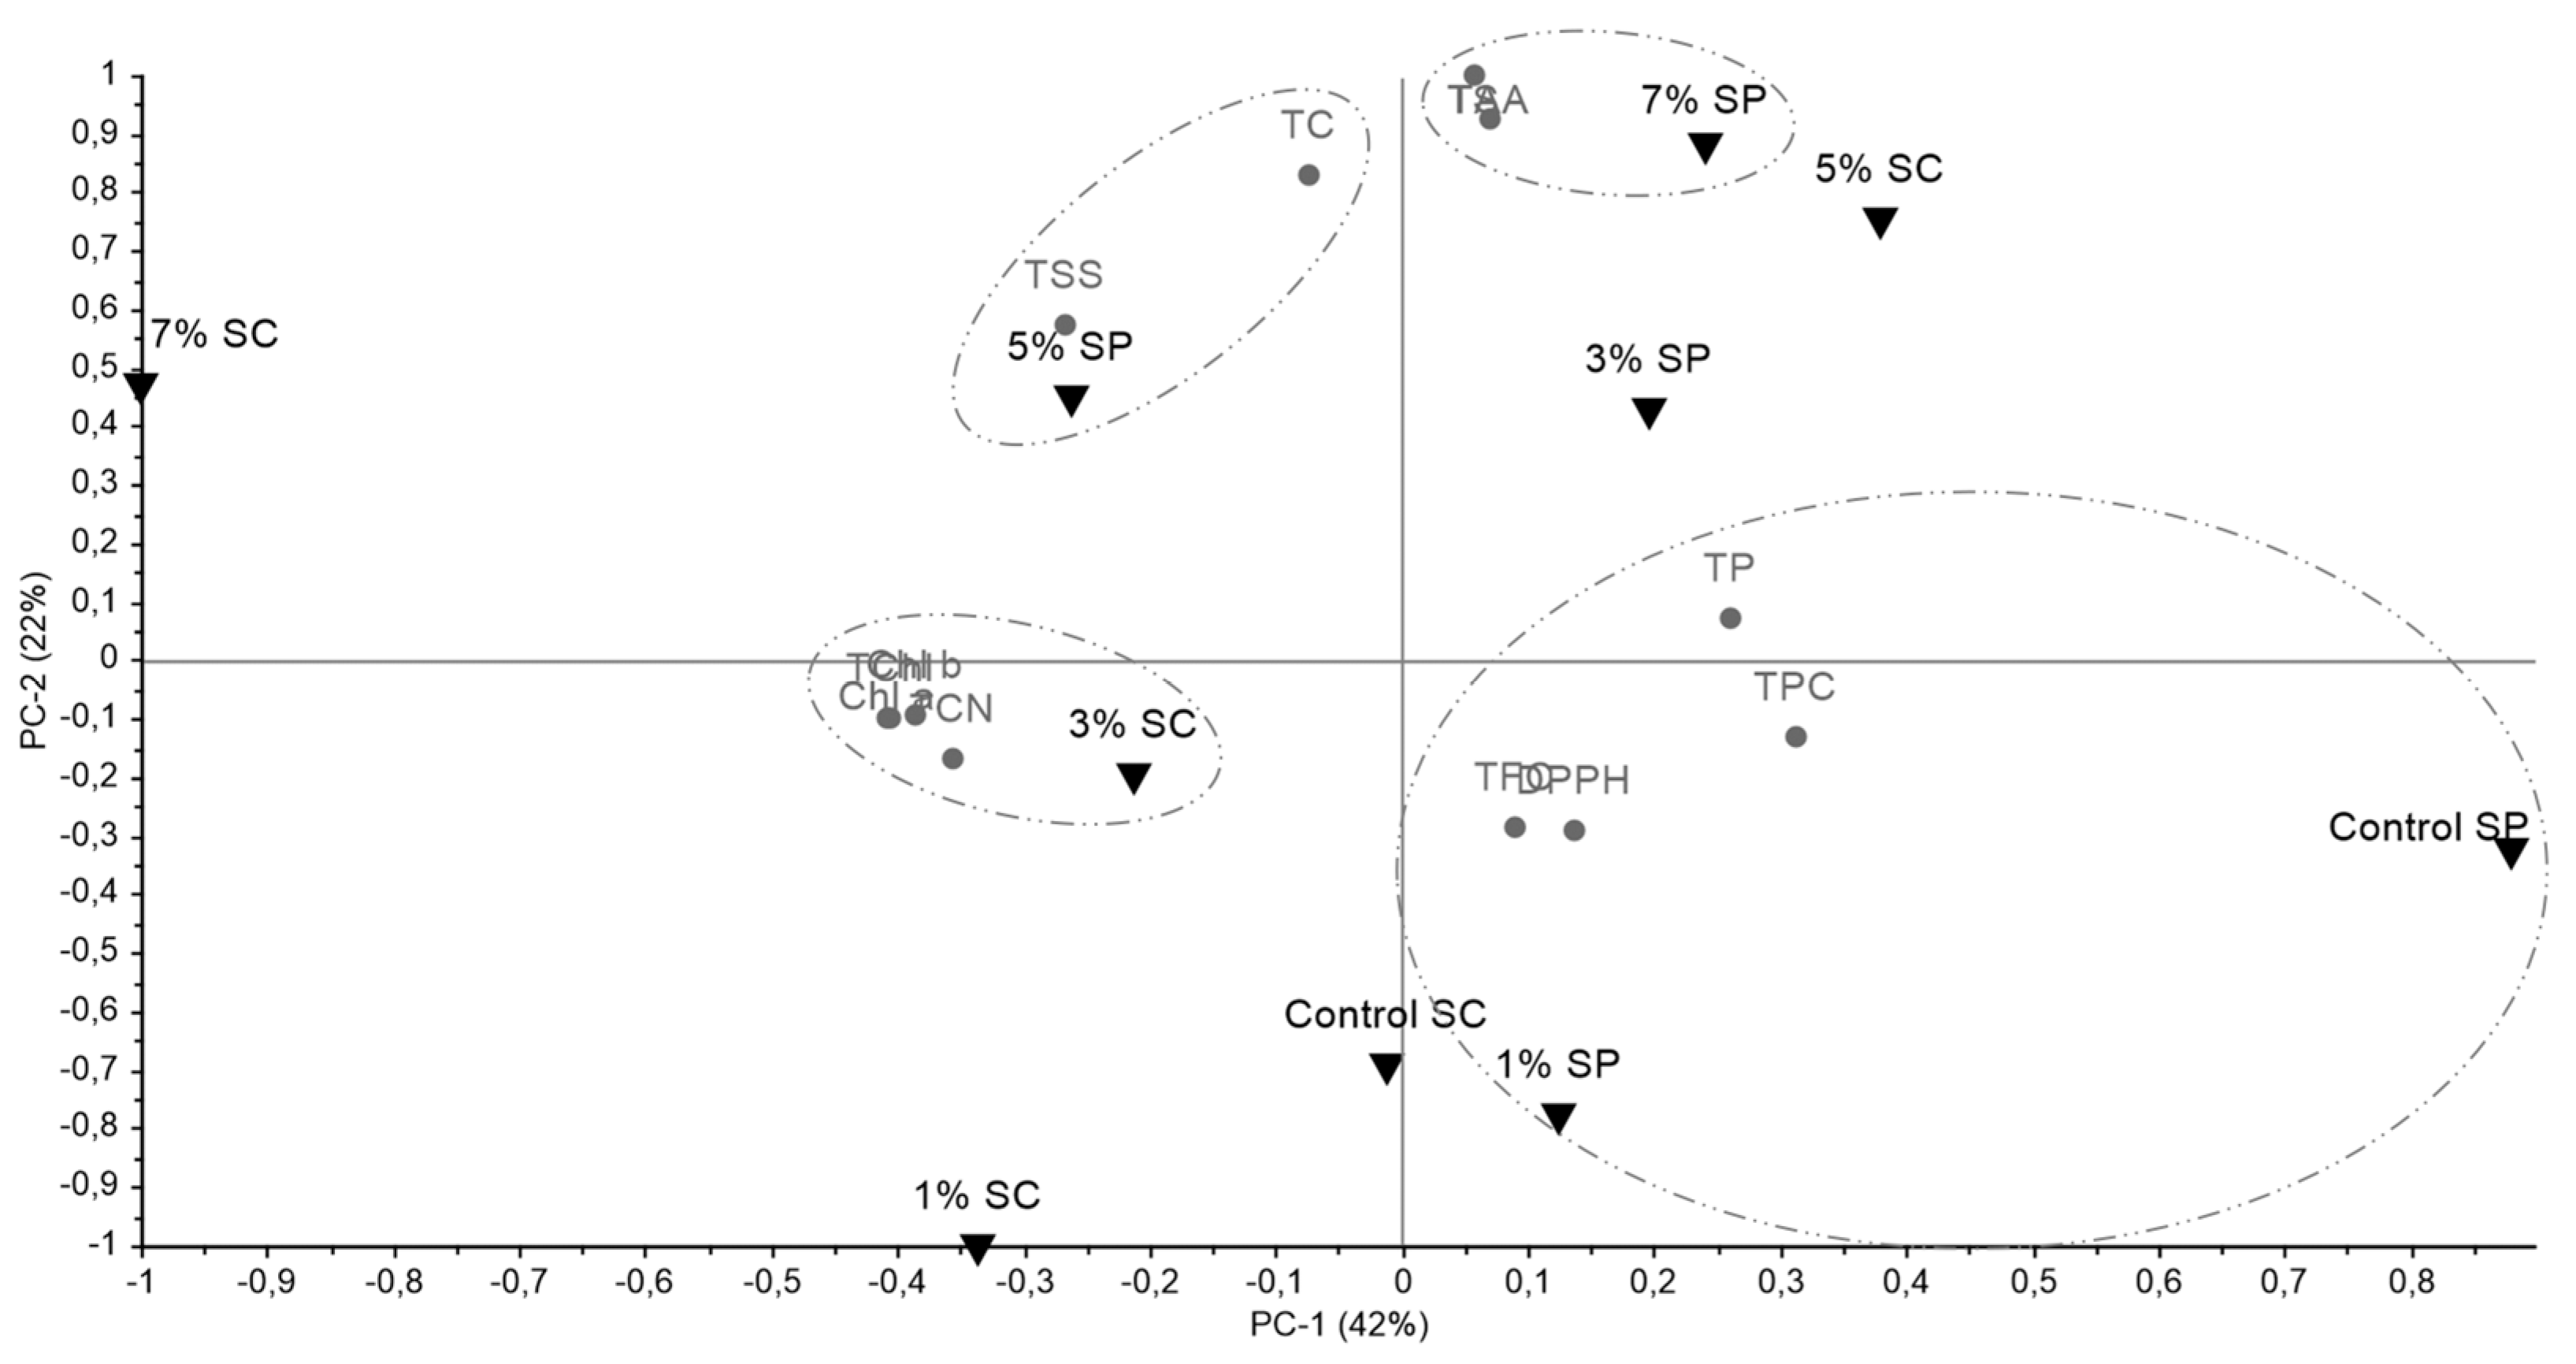
3.2. Biochemical Parameters

The analysis of chlorophyll-a, b, and total and total carotenoids in basil plants treated with Kal-SP and Kal-SC revealed significant differences (Table 2). For the basil plants treated with Kal-SP, a statistical difference was found between treatments, with the 5% extract treatment showing the highest content of chlorophyll-a (1.03 mg/g, increase of 13.19%), chlorophyll-b (0.36 mg/g, increase of 5.88%), and TCN (0.18 mg/g, increase of 20%), differing from the control and other treatments.
Regarding the basil plants treated with the Kal-SC, for chlorophyll-a and total chlorophyll, the highest levels were obtained when plants were treated with the 1% extract (1.05 mg/g and 1.42 mg/g, respectively; increase of 3.96% and 2.90%) and the 7% extract (1.10 mg/g and 1.50 mg/g, respectively; increase 8.91% and 8.70%), differing statistically from the other treatments. For TCN, the 1%, 3%, and 7% treatments did not differ, presenting the same content (0.17 mg/g) but differing from the other treatments, such as the control (increase of 6.25%) (Table 2).
Pigments such as chlorophyll-a, chlorophyll-b, total chlorophyll, and TCN play a crucial role in the biochemical and physiological processes of aromatic plants like basil. Chlorophyll is the primary light-absorbing pigment responsible for photosynthesis, allowing the plant to convert light energy into chemical energy that fuels growth and development. Variations in the concentrations of chlorophyll-a and b can impact the plant’s ability to efficiently capture and utilize light, thus affecting overall photosynthetic rates and productivity [29,30]. Additionally, carotenoids serve as accessory pigments, contributing to light harvesting, protecting the photosynthetic apparatus from oxidative damage, and acting in the synthesis of phytohormones and signaling. The carotenoids also contribute to the characteristic green leafy appearance of the plant and can influence the production of aromatic compounds that give basil its distinctive flavor and fragrance [31,32]. Maintaining the optimal levels of these key pigments is essential for ensuring the healthy growth, development, and quality of aromatic plants like basil, as they are intricately linked to the plant’s biochemical and physiological functions.
As demonstrated in this study, Shukla et al. [10] found that treatments of 0.5 mL/L and 1 mL/L with the K. alvarezii-based biostimulant (LBS6) resulted in significantly higher chlorophyll content in Pisum sativum plants cultivated under nitrogen-deficient conditions. The K. alvarezii A 71.2% increase was recorded using 1 mL/L and a 47.25% increase with 0.5 mL/L. Similarly, Nivetha et al. [9] reported that chlorophyll-a and b contents were significantly higher in maize plants sprayed with 1 mL/L of the same K. alvarezii-based biostimulant (LBS6). Compared to the control, an 86% and 79% increase in chlorophyll-a and b, respectively, was observed in the treated plants. Furthermore, the TCN also increased significantly by 87% compared to the control, demonstrating that K. alvarezii can increase pigments in different plants. It is important to note that the increases observed in these studies are higher than those found in our study, which may be attributed to the type of cultivation system used.
When analyzing the TSS, TS, and TC levels, the results showed greater similarity when the basil plants were treated with a Kal-SP and Kal-SC (Table 3). In the TSS, it was observed that the plants treated with Kal-SP 5% (29.39 mg/g) differed statistically from the other treatments, with an increase of 185.81% compared to the control. The same was observed for the Kal-SC 5% (22.85 mg/g, increase of 63.17% compared to the control); however, it did not differ from the 7% treatment (27.33 mg/g, increase of 95.01% compared to the control) but differed from the other treatments. In TS, it was observed that the plants treated with Kal-SP 7% differed from the others (9.28 mg/g), as will occur when the Kal-SC 7% (6.15 mg/g) was used but not differing from the treatments at 3% and 5% (5.05 and 6.12 mg/g, respectively). In these, an increase of 64.54% was observed when applying Kal-SP 7% in relation to the control and 99.68% when using the Kal-SC 7%.
In the TC, it was observed that the Kal-SC 5% presented the highest concentrations (63.79 mg/g), differing statistically from the other treatments, with an increase of 84.91% compared to the control. A similar result was observed for the Kal-SP 5% (48.39 mg/g, an increase of 32.00% compared to the control) and 3% (46.72 mg/g, an increase of 27.47% compared to the control).
The accumulation of TSS, TS, and TC in plants is of the utmost importance for their growth and development. These biomolecules serve as primary sources of energy and essential structural components for the proper functioning of various physiological processes. Carbohydrates, encompassing soluble sugars and starch, are the fundamental building blocks for the synthesis of essential plant structures, including cell walls, leaves, stems, and roots. Additionally, they serve as precursors for the production of other important plant compounds, including hormones, pigments, and secondary metabolites. Increasing the total of soluble sugars, total starch, and total carbohydrates in plants can bring significant agronomic and economic benefits. Elevated levels of these biomolecules can lead to the increased biomass production, faster growth, and improved yield of economically important plant parts [33,34,35].
When analyzing other studies, it was found that an increase in TSS was also observed when applying 1 mL/L of a biostimulant based on K. alvarezii (LBS6), with a concentration nine times higher than untreated maize plants [8]. For TC, an increase of 39.20% was also recorded in wheat plants treated with 1% K. alvarezii extract [36].
In the TPC analysis, the control treated plants presented higher content (13.41 mg/g), differing significantly from all of the Kal-SP treatments. For TFC, the 3% treatment had the lowest content (0.45 mg/g), differing statistically from all the others, which did not differ from each other. For the DPPH antioxidant capacity, it was found that the control treatment (42.84%) and the Kal-SP 5% (36.21%) showed superior results compared to the other treatments, with no significant difference between them (Table 4).
When analyzing the experiment of basil plants treated with the Kal-SC, it was verified that the TPC was higher in plants treated with 1% (9.48 mg/g) and 5% (10.50 mg/g), not differing from each other, but from other treatments. In TFC, there was no statistical difference between the treatments applied. In the DPPH analysis, it was observed that plants treated with distilled water (38.98%), Kal-SC 1% (44.25%), and 5% (45.34%) presented the highest antioxidant activity, differing from treatments 3% and 7% (Table 4).
As found in our research, other studies that used marine algae biostimulants have also reported a decrease in the levels of phenolic compounds in treated plants [37,38]. However, there are also studies, including those using K. alvarezii extract [9], that have shown an increase in the content of phenolics, flavonoids, and antioxidant activity in treated plants [39,40]. This suggests that the effect of marine algae biostimulants on these compounds may particularly depend on the type of crop and the cultivation system used.
Our hypothesis in this case is that the use of the biostimulant of K. alvarezii supplied the plant’s need to respond to some type of stress. Phenolics and flavonoids are secondary metabolites known to play an important role in plant defense. These secondary metabolites help neutralize reactive oxygen species (ROS) and other free radicals, preventing damage to cells and biomolecules; therefore, their increase can increase antioxidant activity [41,42].
In the TP, no difference was observed between the plants treated with Kal-SP (0.49–0.55 mg/g) except for 1% treatment, with a lower concentration (0.39 mg/g). From the Kal-SC, all treatments have similar results for TP (0.46–0.55 mg/g); only the 7% treatment differed statistically from the others, presenting a lower content (0.36 mg/g). In the overall mean between the locations, there was no statistical difference (Table 5).
For TAA, it was found that plants treated with Kal-SP 7% showed a 105.86% increase (1.79 mg/g) compared to the control (0.87 mg/g), as well as a 29.88% increase when using a 5% treatment (1.13 mg/g). A 200% increment was obtained when using Kal-SC 5% (1.41 mg/g) compared to the control (0.47 mg/g).
Proteins and amino acids play a crucial role in plants’ growth, development, and overall health. As the building blocks of plant tissues and structures, proteins are essential for forming enzymes, hormones, and other vital biomolecules that drive essential plant processes. Amino acids, which make up proteins, are involved in a wide range of metabolic pathways, facilitating nutrient absorption, energy production, and the synthesis of chlorophyll, cell walls, and other plant compounds. Additionally, certain amino acids act as signaling molecules, regulating plant responses to environmental stressors such as drought, pests, and diseases. Adequate availability and balanced ratios of proteins and amino acids are crucial for maximizing crop yields, improving nutritional quality, and enhancing the resilience of plants to challenging growing conditions [43,44].
Among the analyses of TP and TAA, it was observed that TAA was more affected when the biostimulant of K. alvarezii was used. This was also noted in a study by Nivetha et al. [9], where the application of 1 mL/L of a K. alvarezii-based biostimulant (LBS6) resulted in a significant 60-fold increase in TAA content in sprayed corn plants compared to the control. Similarly, Shukla et al. [10] found that pea plants under optimal N conditions, treated with the same biostimulant (LBS6) at 1 mL/L and 0.5 mL/L, had a significantly higher TAA content than the control. This was also observed in plants under N-deficient conditions, where there was a 28.14% increase in treated plants compared to untreated plants.
When employing PCA on the biochemical parameters, a total variance of 80% was observed between PC1, PC2, and PC3, with PC1 representing 42% (Figure 4; Supplementary Material—Figure S1). Four distinct clusters were observed across the quadrants, with the 7% SP treatment grouping with TS and TAA; the 5% SP treatment grouping with TSS and TC; the 3% SC treatment grouping with the pigments (chlorophyll-a, b, total, and TCN); and the SP control and 1% SP grouping with the polyphenols and antioxidant activity (TP, TPC, TFP, and DPPH).
The different treatments and their respective groupings suggest that the application of biostimulant of K. alvarezii, at different concentrations, had varying effects on the measured biochemical parameters in the plants. To understand if these biochemical parameters could be correlated with morphological parameters, a Pearson correlation analysis was performed, considering data from basil plants treated with Kal-SP and Kal-SC (Figure 5). Between the morphological and biochemical parameters, negative correlations were observed, such as between root size and TFC (−0.68), between number of nodes and TFC (−0.68), and between root dry mass and DPPH (−0.69).
Regarding the positive relationships, it was observed that the plant height parameter was correlated with the number of nodes (0.78); root size was associated with shoot dry mass (0.77); the number of nodes was correlated with root dry mass (0.67); the root fresh mass was associated with shoot fresh mass (0.74); and the shoot fresh mass and root dry mass (0.67). Among the biochemical parameters, positive correlations were observed in the pigments (chl a and b; a and total; b and total; chl a and TCN; total chl and TCN—from 0.77 to 0.99), as well as between TAA and TSS (0.87).
The positive correlation between plant height and number of nodes suggests that taller plants tend to have a greater number of nodes. This could indicate a coordinated growth response, where increased vertical growth is accompanied by the production of more nodes, potentially providing more sites for branching and leaf development. The positive association between length of the roots and shoot dry mass indicates that plants with larger root systems also tend to have higher aboveground biomass. This could be a result of the root’s ability to acquire more water and nutrients, which in turn supports increased shoot growth and development. The correlation between number of nodes and root dry mass implies that plants with more nodes also have higher root biomass. This relationship may reflect a balanced allocation of resources between the shoot and root systems, where increased above-ground growth is matched by corresponding below-ground development [45,46,47].
The negative correlations between length of the roots, number of nodes, and TFC suggest that increased investment in structural components, such as roots and stems, may come at the expense of the production of certain secondary metabolites. The negative relationship between root dry mass and DPPH could indicate a trade-off between root biomass accumulation and the plant’s antioxidant capacity, potentially due to resource allocation constraints or differential regulation of primary and secondary metabolism.

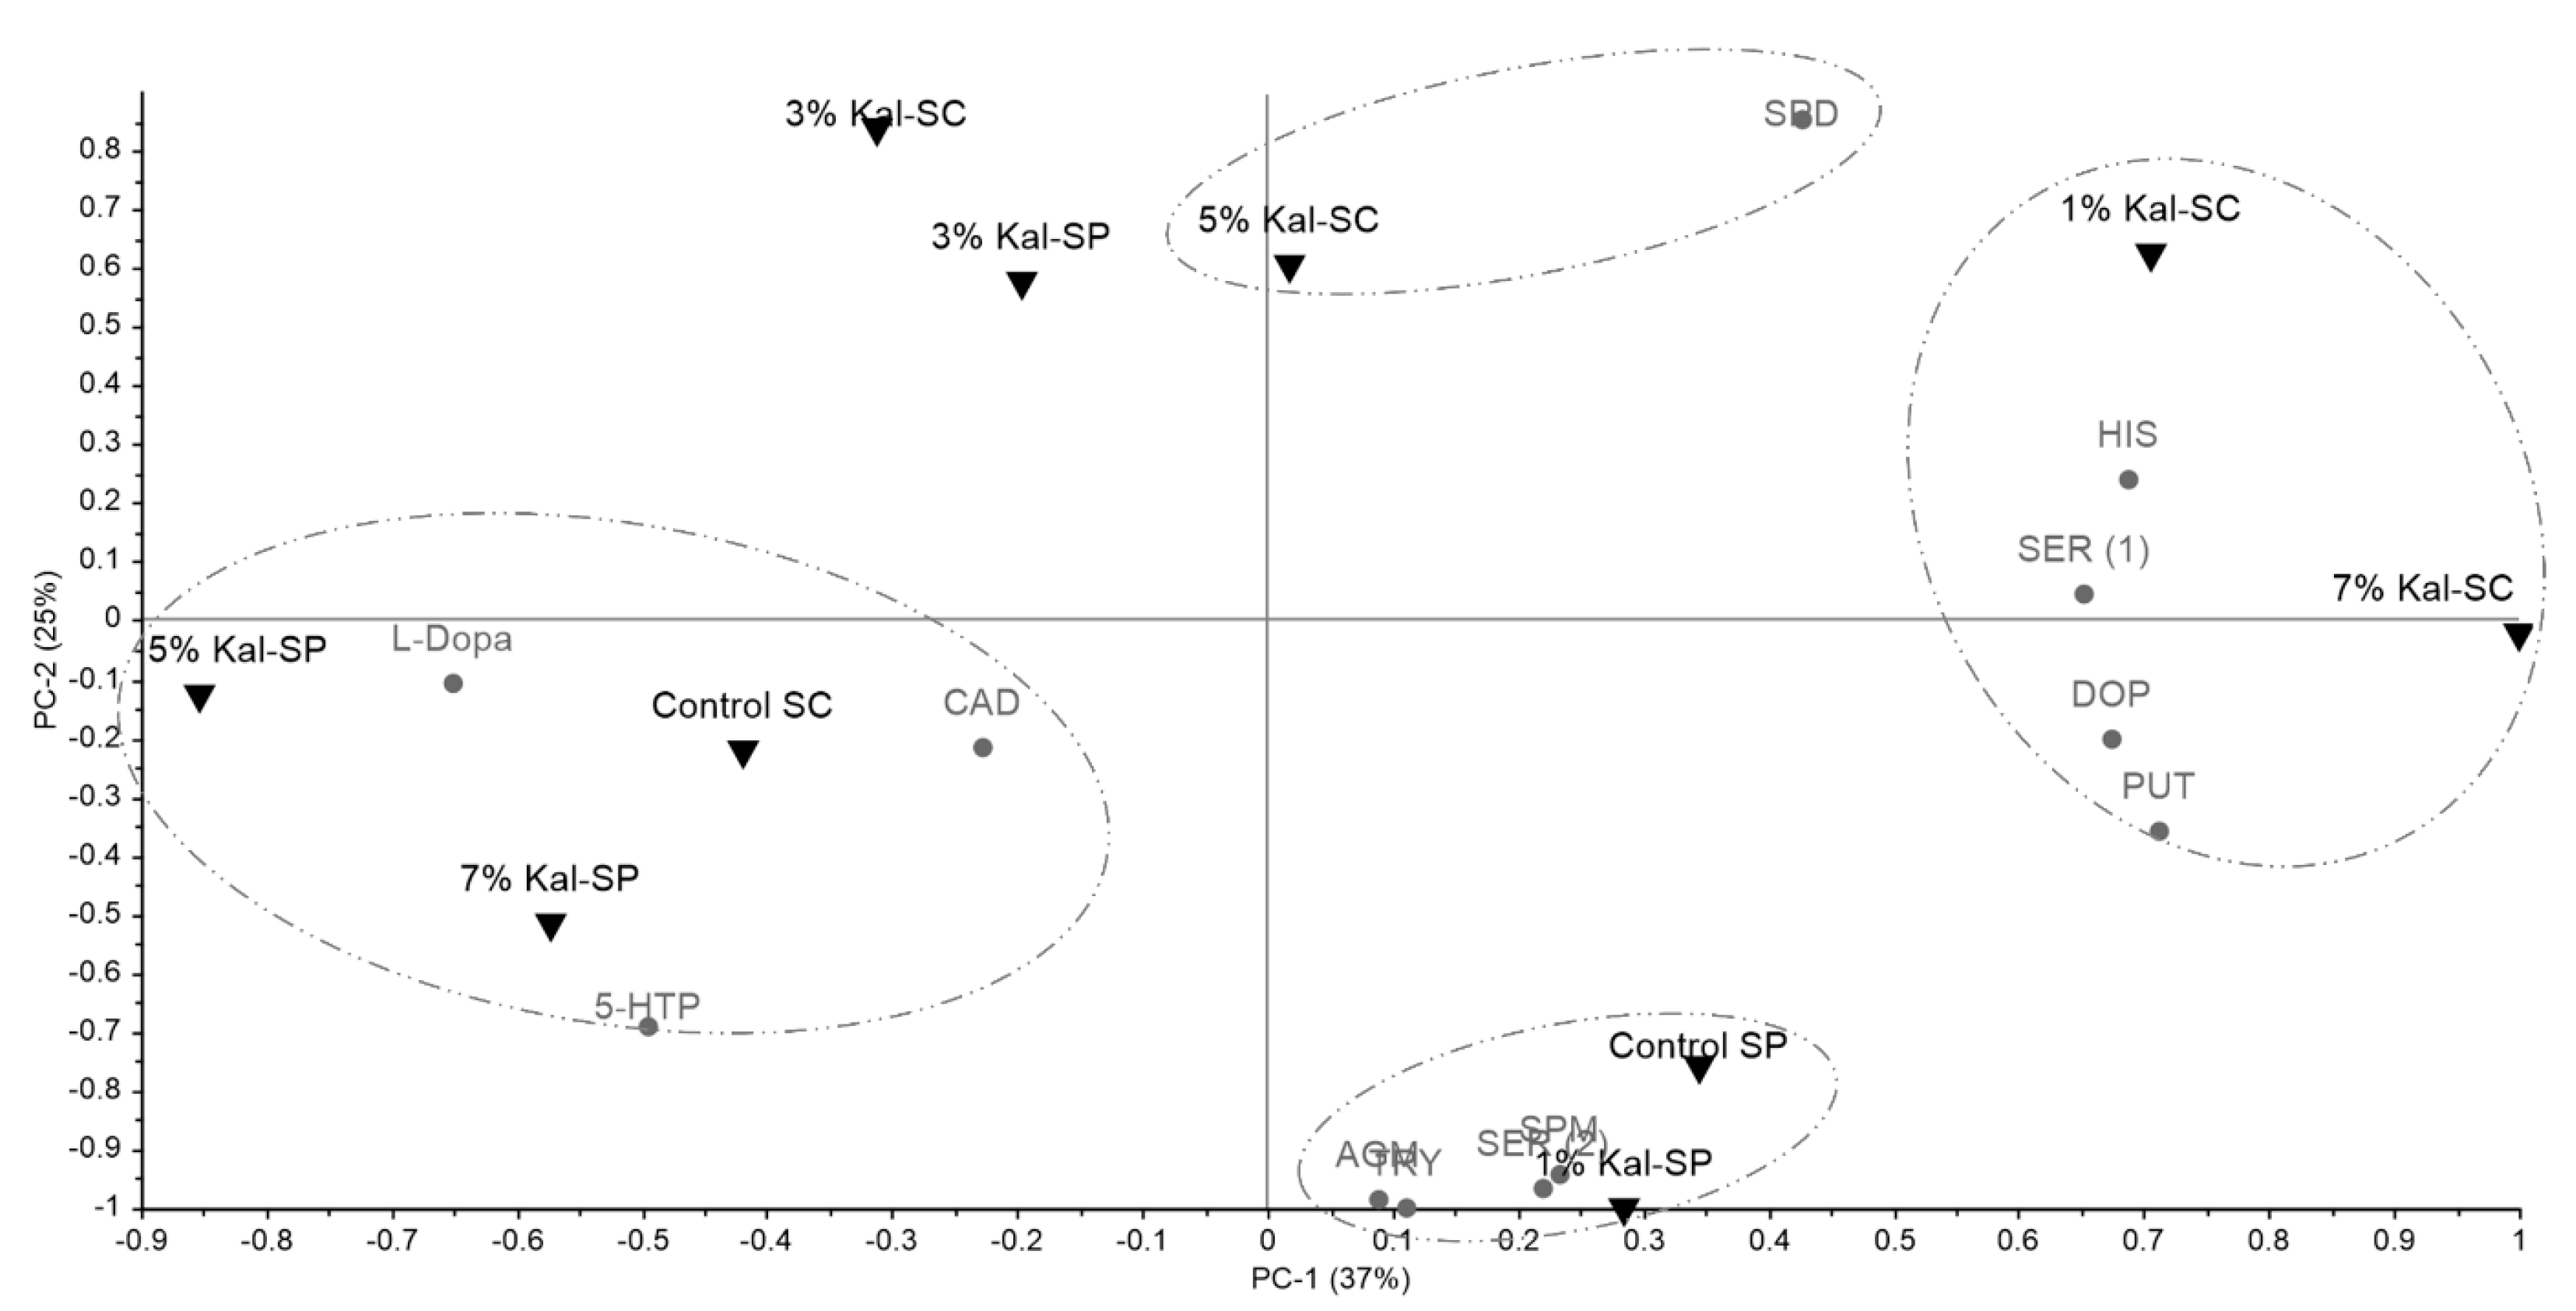
3.3. Biogenic Amines and Precursor Amino Acids

In the analysis of amino acids and biogenic amines, 12 compounds were identified: 5-hydroxytryptophan (5-HTP), tryptophan (TRY), serotonin (s1—SER s1), agmatine (AGM), putrescine (PUT), cadaverine (CAD), histamine (HIS), serotonin (s2—SER s2), spermidine (SPD), L-dopamine (L-Dopa), dopamine (DOP), and spermine (SPM). The highest concentrations were observed for 5-HTP and TRY, followed by SER (s1) (Table 6).
The results showed significant variation among treatments from the two locations and in concentrations (Table 6). For 5-HTP, a statistical difference was noted only in the Kal-SC experiment, where the control (680.80 µg/g) differed significantly from the others. In the TRY analysis for the Kal-SP experiment, the control (433.04 µg/g) and the 1% treatment (433.91 µg/g) differed statistically from other treatments. In the Kal-SC experiment, the 3% treatment had the lowest concentration, differing from all other groups.
Regarding serotonin (s1), a significant difference was observed only in the Kal-SC experiment, with the 1% (34.42 µg/g) and 7% (30.22 µg/g) treatments showing the highest values. For agmatine, statistical differences were found in both experiments. In the SP experiment, concentrations were higher for the 1% (14.93 µg/g) and 7% (14.78 µg/g) treatments, significantly differing from the others, as well as in the SC experiment, where the 7% treatment had a higher concentration (15.67 µg/g).
Putrescine was found in higher concentrations in the control (6.21 µg/g) and Kal-SP 1% (5.70 µg/g), differing from the others. For Kal-SC, the 7% treatment showed a higher concentration (7.30 µg/g). Cadaverine was present in higher concentrations in Kal-SP (0.39 µg/g), significantly different from others, as well as in Kal-SC 1% (0.24 µg/g). Histamine concentrations were highest in the control (1.90 µg/g), Kal-SP 1% (1.65 µg/g), and 3% (1.40 µg/g), as well as in Kal-SC 7% (4.18 µg/g).
Serotonin (s2) was detected at higher concentrations in Kal-SP 1% (7.88 µg/g), significantly differing from other treatments, as well as in the control (5.01 µg/g) from the SC experiment, Kal-SC (5.20 µg/g), and 7% (5.46 µg/g). Spermidine in the SP experiment did not show distinct concentrations; however, higher levels were observed in the SC experiment for the 1% (0.20 µg/g) and 5% (0.23 µg/g) treatments.
L-Dopa showed low concentrations, but a statistical difference was noted in the SP experiment, with 5% (0.014 µg/g) and 7% (0.013 µg/g) standing out. Dopamine was found in higher concentrations in the control of the SP experiment (0.67 µg/g), as well as in the 1% (0.63 µg/g). In the SC experiment, higher concentrations were obtained for the 1% (0.75 µg/g) and 7% (0.80 µg/g) treatments. Spermine was found in the highest concentrations in the SP control (19.78 µg/g), differing from the others, while the SC experiment showed only low concentrations, with the highest being in the 5% (0.22 µg/g) and 7% (0.25 µg/g) treatments.
The biogenic amines identified in basil leaves, especially those present in higher concentrations such as 5-HTP, TRY, and SER (s1), play crucial roles in various biological functions. For instance, 5-HTP, produced from tryptophan by tryptophan hydroxylase and a precursor of serotonin, is essential for the treatment of neurological and metabolic disorders, including depression, anxiety, sleep disturbances, and obesity [48]. TRY, after consumption, is metabolically transformed into bioactive metabolites and has the potential to contribute to the treatment of conditions such as autism, cardiovascular diseases, chronic kidney disease, depression, and multiple sclerosis [49]. SER is primarily associated with important brain functions, regulating mood, sleep, and appetite [50]. Thus, these amines are essential for human health. Our study found that basil contains interesting concentrations of these three biogenic amines, making it a relevant plant for human consumption. However, except for the SC experiment regarding SER (s1) data, the concentrations of biostimulants did not lead to significant increases, which may be explained by the increase in primary metabolites in the plants, such as carbohydrates, thus altering distinct metabolic pathways.
It is important to highlight that these identified biogenic amines play a significant role in plants. These compounds are closely linked to the functionality and protection of plants. For instance, 5-HTP serves as an alternative pathway for melatonin production, which regulates cellular growth and adapts to adverse conditions, such as water stress. TRY, in addition to being a precursor for important plant hormones like auxin, also contributes to synthesizing compounds that protect plants against pathogens, thereby playing a role in stress conditions. On the other hand, SER acts as a signaling molecule, modulating physiological responses and enhancing resistance to abiotic stresses, such as salinity and extreme temperatures. Thus, these biogenic amines are fundamental for the homeostasis and adaptation of plants to their environments [51,52,53,54,55,56].
It is worth noting that despite the discrepancies in the results, which may indicate increases or decreases influenced by factors beyond the treatments, higher concentrations were observed for the samples of SER (s1), AGM, PUT, CAD, HIS, SER (s2), L-Dopa, and DOP when using the biostimulant from K. alvarezii, with some results about Kal-SP and others to Kal-SC. To identify a possible pattern among the samples, PCA was employed.
In the PCA, a total variance of 75% was achieved (PC1, PC2, PC3), with PC1 accounting for 37% of the model (Figure 6 and Supplementary Material—Figure S2). Four clusters were identified: SPD grouped with Kal-SC 5%; HIS, SER (s1), DOP, and PUT grouped with Kal-SC 1% and 7%; AGM, TRY, SPM, and SER (s2) grouped with control SP and Kal-SP 1%; and L-Dopa, CAD, and 5-HTP grouped with control SC, Kal-SP 5%, and 7% (Figure 6).
Thus, based on the results obtained from the PCA, it is evident that the treatments can influence the composition of biogenic amines. However, there is no standardization among the data; only the 3% concentration of the biostimulant from both locations (Kal-SP and Kal-SC) was found to be grouped, but it was not associated with any of the biogenic amines. This may indicate that it presents low or medium concentrations. From the PCA, we can conclude that the use of the biostimulant could be a strategy to optimize certain compounds, particularly those not grouped with the controls from the SP and SC experiments, such as HIS, SER (s1), DOP, and PUT. Nonetheless, it is suggested that further investigations be conducted to examine how the biostimulant may influence the concentrations of biogenic amines.

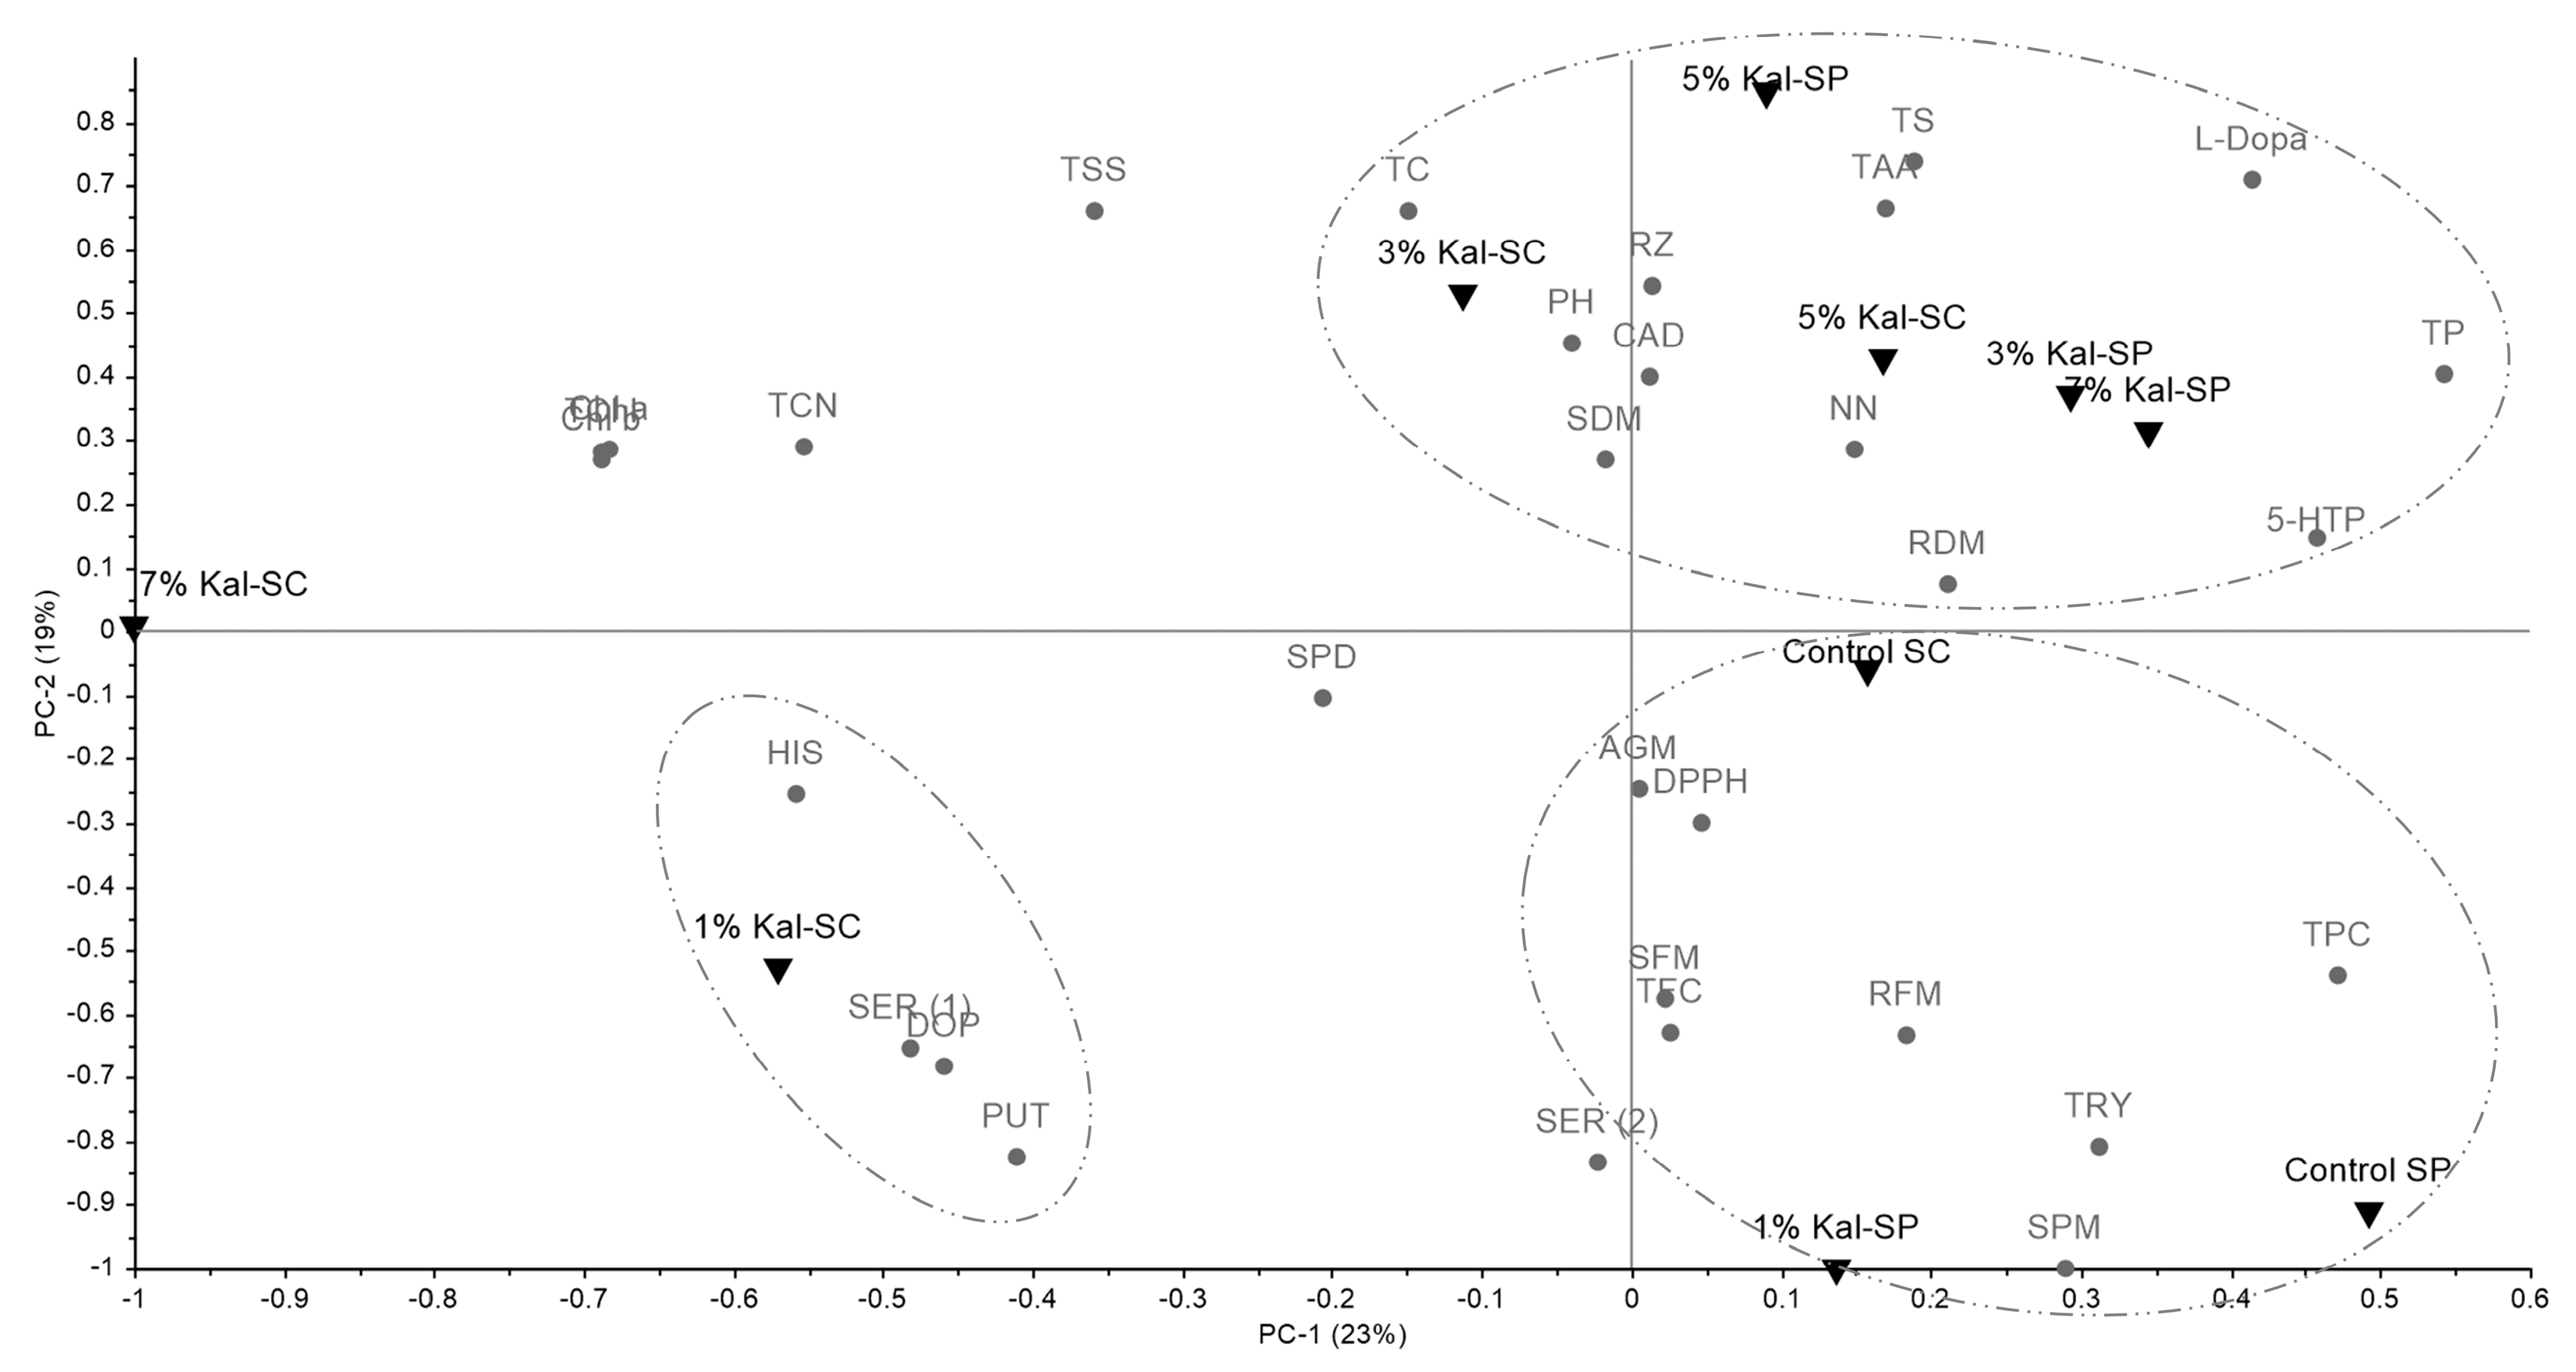
3.4. Complete Analysis of All Data

By employing PCA on all the data analyzed for basil plants treated with the biostimulant from K. alvarezii, a total variation of only 59% was achieved (PC1, PC2, and PC3) due to the volume of data (Figure 7 and Supplementary Material—Figure S3). However, although the total variance does not fully represent the model, two groups with similar patterns were identified, with the 3% and 5% treatments located in the same quadrant, as occurred for the control treatments. The treatments with biostimulants at 3% and 5% of Kal-SP and Kal-SC, along with 7% Kal-SP, clustered with morphological variables (PH, RZ, SDM, RDM, NN), biochemical variables (TAA, TC, TS, TP), and the biogenic amine L-Dopa. The second cluster included the control treatments and 1% Kal-SP, which also encompassed morphological variables (RFM, SFM, SPM), biochemical variables (TFC, TPC, and DPPH), and biogenic amines (SER s2, TRY, AGM). The 1% Kal-SC treatment was found separately, associated with the biogenic amines HIS, SER s1, DOP, and PUT. The 7% Kal-SC treatment was found to be distanced from all the others (Figure 7).
The PCA results indicate that the application of the biostimulant from K. alvarezii influenced the morphological, biochemical, and metabolic traits of basil plants. This suggests that while significant patterns were observed, additional factors may also be affecting the data. The grouping of treatments at 3% and 5% with various morphological and biochemical variables highlights the biostimulant role in enhancing plant growth and metabolite production. The control samples also exhibited similar patterns, suggesting that even in the absence of the biostimulant, certain biochemical responses were consistently present.
Therefore, the median concentrations (3% and 5%) demonstrate greater consistency in enhancing and influencing various attributes of basil plants. Despite the distinct compositions of the biostimulants—particularly concerning total phenolic content, total carotenoids, and total protein (Supplementary Material, Table S1)—these concentrations effectively promote growth and development while positively impacting bioactive compounds.
Overall, these findings underscore the potential of K. alvarezii as a valuable agent for optimizing plant performance, while also indicating the need for further research to fully understand the mechanisms involved.

4. Conclusions

This study demonstrated the efficacy of Kappaphycus alvarezii biostimulants in enhancing the growth and biochemical composition of hydroponic basil plants. The optimal concentrations were found to be 3–7% for the Kal-SP extract and 3–5% for the Kal-SC extract, with distinct effects on morphological, physiological, and metabolic parameters.
The observed variations in the performance of Kal-SP and Kal-SC extracts highlight the importance of considering the geographic origin and cultivation conditions of the seaweed source when developing sustainable biostimulant applications. Further research is needed to elucidate the underlying mechanisms responsible for the observed bioactive effects and optimize the application strategies for large-scale hydroponic basil production.
Overall, the findings of this study contribute to the advancement of environmentally friendly agricultural practices and the development of biobased solutions for enhancing crop performance and quality. The use of K. alvarezii extracts as natural plant biostimulants presents a promising approach for improving the productivity and nutritional profile of basil and other high-value horticultural crops.

Supplementary Materials

The following supporting information can be downloaded at https://www.mdpi.com/article/10.3390/horticulturae11040424/s1: Table S1: Biochemical analysis of the biostimulants derived from Kappaphycus alvarezii cultivated in São Paulo (Kal-SP) and Santa Catarina (Kal-SC), Brazil, applied to basil plants; Table S2: Metabolomic profile by 1H nuclear magnetic resonance (mM) of the biostimulants derived from Kappaphycus alvarezii cultivated in São Paulo (Kal-SP) and Santa Catarina (Kal-SC), Brazil, applied to basil plants; Figure S1: Principal component analysis (PC2 and PC3) calculated from the dataset of chlorophyll-a (Chl a), chlorophyll-b (Chl b), total chlorophyll (TChl), total carotenoid (TCN), total soluble sugars (TSS), total starch (TSS), total carbohydrate (TC), total phenolic content (TPC), total flavonoid content (TFC), DPPH, total protein (TP), and total amino acid (TAA) of basil plants treated with foliar application of biostimulants of Kappaphycus alvarezii (1%, 3%, 5%, and 7%) cultivated in the locations of São Paulo and Santa Catarina, Brazil; Figure S2: Principal component analysis (PC2 and PC3) calculated from the dataset of biogenic amine profile of basil plants treated with foliar application of biostimulants of Kappaphycus alvarezii (1%, 3%, 5%, and 7%) cultivated in the locations of São Paulo and Santa Catarina, Brazil; Figure S3: Principal component analysis (PC2 and PC3) calculated from the dataset of plant height (cm), length of the roots (cm), number of nodes (n.), root fresh mass (g), shoot fresh mass (g), root dry mass (g), shoot dry mass (g), chlorophyll-a (Chl a), chlorophyll-b (Chl b), total chlorophyll (TChl), total carotenoid (TCN), total soluble sugars (TSS), total starch (TSS), total carbohydrate (TC), total phenolic content (TPC), total flavonoid content (TFC), DPPH, total protein (TP), total amino acid (TAA), and biogenic amine profile of basil plants treated with foliar application of biostimulants of Kappaphycus alvarezii (1%, 3%, 5%, and 7%) cultivated in the locations of São Paulo and Santa Catarina, Brazil.

Author Contributions

Conceptualization, A.N., M.M. and G.P.P.L.; methodology, A.N., E.R.O. and M.S.P.-V.; software, A.N.; validation, A.N.; formal analysis: F.d.S.D., L.R.B.S., C.P.M., A.R.S., E.R.O., M.S.P.-V. and G.Z.A.; investigation, A.N.; resources, M.M. and G.P.P.L.; data curation, A.N.; writing—original draft preparation, A.N.; writing—review and editing, A.N., F.d.S.D., L.R.B.S., C.P.M., A.R.S., E.R.O., M.S.P.-V., G.Z.A., J.L.B.O., V.C.G., A.A.d.S., M.M. and G.P.P.L.; visualization: A.N.; supervision, M.M. and G.P.P.L.; project administration: M.M. and G.P.P.L.; funding acquisition: A.N., M.M. and G.P.P.L. All authors have read and agreed to the published version of the manuscript.

Funding

Grant 2023/03886−1, São Paulo Research Foundation (FAPESP), on behalf of A. Nunes. The research fellowship from CNPq on behalf of M. Maraschin (process no. 405949/2022-7), G.P.P. Lima (process no. 311719/2023-6), E.R. Oliveira (process no. 303956/2023-2), A.R. Schneider (process no. 142391/2020-4), and M.S. Pereira-Vasques (process no. 151752/2024-9). The research fellowship from CAPES on behalf of F.S. Dutra (process no. 88887.696139/2022-00).

Data Availability Statement

The data presented in this study are available upon request to the corresponding author due to privacy and the amount of data generated.

Acknowledgments

We thank the fish farmer from Santa Catarina who kindly provided the green and red algae for the study, as well as the Fisheries Institute of the State of São Paulo for providing the samples.

Conflicts of Interest

The authors declare no conflict of interest.

References

  1. Jamiołkowska, A. Natural Compounds as Elicitors of Plant Resistance against Diseases and New Biocontrol Strategies. Agronomy 2020, 10, 173. [Google Scholar] [CrossRef]
  2. Rouphael, Y.; Colla, G. Editorial: Biostimulants in Agriculture. Front. Plant Sci. 2020, 11, 40. [Google Scholar] [CrossRef]
  3. Daniel, A.I.; Fadaka, A.O.; Gokul, A.; Bakare, O.O.; Aina, O.; Fisher, S.; Burt, A.F.; Mavumengwana, V.; Keyster, M.; Klein, A. Biofertilizer: The Future of Food Security and Food Safety. Microorganisms 2022, 10, 1220. [Google Scholar] [CrossRef] [PubMed]
  4. Illera-Vives, M.; Seoane Labandeira, S.; Fernández-Labrada, M.; López-Mosquera, M.E. Agricultural Uses of Seaweed. In Sustainable Seaweed Technologies; Elsevier: Amsterdam, The Netherlands, 2020; pp. 591–612. [Google Scholar] [CrossRef]
  5. Munaro, D.; Nunes, A.; Schmitz, C.; Bauer, C.; Coelho, D.S.; Oliveira, E.R.; Yunes, R.A.; Moura, S.; Maraschin, M. Metabolites produced by macro- and microalgae as plant biostimulants. Stud. Nat. Prod. Chem. 2021, 71, 87–120. [Google Scholar]
  6. Rudke, A.R.; de Andrade, C.J.; Ferreira, S.R.S. Kappaphycus alvarezii Macroalgae: An Unexplored and Valuable Biomass for Green Biorefinery Conversion. Trends Food Sci. Technol. 2020, 103, 214–224. [Google Scholar] [CrossRef]
  7. Shukla, P.S.; Nivetha, N.; Nori, S.S.; Bose, D.; Kumar, S.; Khandelwal, S.; Critchley, A.; Suryanarayan, S. Understanding the mode of action of AgroGain®, a biostimulant derived from the red seaweed Kappaphycus alvarezii in the stimulation of cotyledon expansion and growth of Cucumis sativa (cucumber). Front. Plant Sci. 2023, 14, 1136563. [Google Scholar] [CrossRef] [PubMed]
  8. van Tol de Castro, T.A.; Tavares, O.C.H.; de Oliveira Torchia, D.F.; Pereira, E.G.; Rodrigues, N.F.; Santos, L.A.; do Amaral Vendramini, A.L.; da Mata, M.R., Jr.; Viêgas, C.V.; Berbara, R.L.L.; et al. Regulation of Growth and Stress Metabolism in Rice Plants through Foliar and Root Application of Seaweed Extract from Kappaphycus alvarezii (Rhodophyta). J. Appl. Phycol. 2024, 36, 2295–2310. [Google Scholar] [CrossRef]
  9. Nivetha, N.; Shukla, P.S.; Nori, S.S.; Kumar, S.; Suryanarayan, S. A red seaweed Kappaphycus alvarezii-based biostimulant (AgroGain®) improves the growth of Zea mays and impacts agricultural sustainability by beneficially priming rhizosphere soil microbial community. Front. Microbiol. 2024, 15, 1330237. [Google Scholar] [CrossRef]
  10. Shukla, P.S.; Nivetha, N.; Nori, S.S.; Kumar, S.; Critchley, A.T.; Suryanarayan, S. A biostimulant prepared from red seaweed Kappaphycus alvarezii induces flowering and improves the growth of Pisum sativum grown under optimum and nitrogen-limited conditions. Front. Plant Sci. 2024, 14, 1265432. [Google Scholar] [CrossRef]
  11. Nunes, A.; Azevedo, G.Z.; de Souza Dutra, F.; dos Santos, B.R.; Schneider, A.R.; Oliveira, E.R.; Moura, S.; Vianello, F.; Maraschin, M.; Lima, G.P.P. Uses and Applications of the Red Seaweed Kappaphycus alvarezii: A Systematic Review. J. Appl. Phycol. 2024, 36, 3409–3450. [Google Scholar] [CrossRef]
  12. Markets and Markets. Hydroponics Market by Growing System (Aggregate Hydroponic Systems, Liquid Hydroponic Systems, Hybrid Hydroponic Systems), Equipment, Crop Type, and Region—Global Forecast to 2027. 2024. Available online: https://www.marketsandmarkets.com/Market-Reports/hydroponics-market-140124230.html (accessed on 3 November 2024).
  13. Song, J.; Yang, J.; Jeong, B.R. Characterization of physiology, photosynthesis, and nutrition based on induced deficiencies of macro- and micronutrients in basil (Ocimum basilicum L.). Agronomy 2024, 14, 208. [Google Scholar] [CrossRef]
  14. Meselmani, M.A.A. Nutrient solution for hydroponics. In Recent Research and Advances in Soilless Culture; IntechOpen: London, UK, 2023. [Google Scholar] [CrossRef]
  15. Hiscox, J.D.; Israelstam, G.F. A method for the extraction of chlorophyll from leaf tissue without maceration. Can. J. Bot. 1979, 57, 1332–1334. [Google Scholar] [CrossRef]
  16. Wellburn, A.R. The Spectral Determination of Chlorophylls a and b, as Well as Total Carotenoids, Using Various Solvents with Spectrophotometers of Different Resolution. J. Plant Physiol. 1994, 144, 307–313. [Google Scholar] [CrossRef]
  17. Umbreit, W.W.; Burris, R.H. Method for glucose and others sugars. In Manometric Techniques: A Manual Describing Methods Applicable to the Study of Tissue Metabolism, 4th ed.; Umbreit, W.W., Burris, R.H., Stauffer, J.P., Eds.; Burgess: Minneapolis, MN, USA, 1964. [Google Scholar]
  18. DuBois, M.; Gilles, K.A.; Hamilton, J.K.; Rebers, P.A.; Smith, F. Colorimetric Method for Determination of Sugars and Related Substances. Anal. Chem. 1956, 28, 350–356. [Google Scholar] [CrossRef]
  19. Singleton, V.L.; Orthofer, R.; Lamuela-Raventós, R.M. [14] Analysis of total phenols and other oxidation substrates and antioxidants by means of folin-ciocalteu reagent. Methods Enzymol. 1999, 299, 152–178. [Google Scholar] [CrossRef]
  20. Woisky, R.G.; Salatino, A. Analysis of Propolis: Some Parameters and Procedures for Chemical Quality Control. J. Apic. Res. 1998, 37, 99–105. [Google Scholar] [CrossRef]
  21. Kim, D.-O.; Lee, K.W.; Lee, H.J.; Lee, C.Y. Vitamin C Equivalent Antioxidant Capacity (VCEAC) of Phenolic Phytochemicals. J. Agric. Food Chem. 2002, 50, 3713–3717. [Google Scholar] [CrossRef]
  22. Bradford, M. A Rapid and Sensitive Method for the Quantitation of Microgram Quantities of Protein Utilizing the Principle of Protein-Dye Binding. Anal. Biochem. 1976, 72, 248–254. [Google Scholar] [CrossRef]
  23. Da Silveira, C.M.; Furlong, E.B. Caracterização de Compostos Nitrogenados Presentes Em Farelos Fermentados Em Estado Sólido. Food Sci. Technol. 2007, 27, 805–811. [Google Scholar] [CrossRef]
  24. Borges, C.V.; Belin, M.A.F.; Amorim, E.P.; Minatel, I.O.; Monteiro, G.C.; Gomez Gomez, H.A.; Monar, G.R.S.; Lima, G.P.P. Bioactive Amines Changes during the Ripening and Thermal Processes of Bananas and Plantains. Food Chem. 2019, 298, 125020. [Google Scholar] [CrossRef]
  25. Diamante, M.S.; Borges, C.V.; da Silva, M.B.; Minatel, I.O.; Corrêa, C.R.; Gomez Gomez, H.A.; Lima, G.P.P. Bioactive Amines Screening in Four Genotypes of Thermally Processed Cauliflower. Antioxidants 2019, 8, 311. [Google Scholar] [CrossRef]
  26. van Tol de Castro, T.A.; Tavares, O.C.H.; de Oliveira Torchia, D.F.; Oliveira da Silva, H.F.; de Moura, O.V.T.; Cantarino, R.E.; de Abreu Lopes, S.; Viêgas, C.V.; do Amaral Vendramini, A.L.; Santos, L.A.; et al. Organic Fragments of K-Carrageenan, Lipids and Peptides plus K-Rich Inorganic Fraction in Kappaphycus alvarezii Biomass Are Responsible for Growth Stimulus in Rice Plant When Applied Both Foliar and Root Pathway. Algal Res. 2023, 71, 103040. [Google Scholar] [CrossRef]
  27. Pramanick, B.; Brahmachari, K.; Mahapatra, B.S.; Ghosh, A.; Ghosh, D.; Kar, S. Growth, Yield and Quality Improvement of Potato Tubers through the Application of Seaweed Sap Derived from the Marine Alga Kappaphycus alvarezii. J. Appl. Phycol. 2017, 29, 3253–3260. [Google Scholar] [CrossRef]
  28. Singh, I.; Anand, K.G.V.; Solomon, S.; Shukla, S.K.; Rai, R.; Zodape, S.T.; Ghosh, A. Can We Not Mitigate Climate Change Using Seaweed Based Biostimulant: A Case Study with Sugarcane Cultivation in India. J. Clean. Prod. 2018, 204, 992–1003. [Google Scholar] [CrossRef]
  29. Tanaka, A.; Tanaka, R. Chlorophyll Metabolism. Curr. Opin. Plant Biol. 2006, 9, 248–255. [Google Scholar] [CrossRef]
  30. Agathokleous, E.; Feng, Z.; Peñuelas, J. Chlorophyll Hormesis: Are Chlorophylls Major Components of Stress Biology in Higher Plants? Sci. Total Environ. 2020, 726, 138637. [Google Scholar] [CrossRef]
  31. Winterhalter, P.; Rouseff, R. Carotenoid-derived aroma compounds: An introduction. In ACS Symposium Series; American Chemical Society: Washington, DC, USA, 2001; pp. 1–17. [Google Scholar] [CrossRef]
  32. Sun, T.; Rao, S.; Zhou, X.; Li, L. Plant Carotenoids: Recent Advances and Future Perspectives. Mol Hortic. 2022, 2, 3. [Google Scholar] [CrossRef]
  33. Couée, I.; Sulmon, C.; Gouesbet, G.; El Amrani, A. Involvement of Soluble Sugars in Reactive Oxygen Species Balance and Responses to Oxidative Stress in Plants. J. Exp. Bot. 2006, 57, 449–459. [Google Scholar] [CrossRef]
  34. Julius, B.T.; Leach, K.A.; Tran, T.M.; Mertz, R.A.; Braun, D.M. Sugar Transporters in Plants: New Insights and Discoveries. Plant Cell Physiol. 2017, 58, 1442–1460. [Google Scholar] [CrossRef]
  35. Thalmann, M.; Santelia, D. Starch as a Determinant of Plant Fitness under Abiotic Stress. New Phytol. 2017, 214, 943–951. [Google Scholar] [CrossRef]
  36. Zodapea, S.T.; Mukherjee, S.; Reddy, M.P.; Chaudhary, D.R. Effect of Kappaphycus alvarezii (Doty) Doty ex Silva. extract on grain quality, yield and some yield components of wheat (Triticum aestivum L.). Int. J. Plant Prod. 2009, 3, 97–101. [Google Scholar]
  37. Shukla, P.S.; Prithiviraj, B. Ascophyllum nodosum Biostimulant Improves the Growth of Zea mays Grown Under Phosphorus Impoverished Conditions. Front. Plant Sci. 2021, 11, 601843. [Google Scholar] [CrossRef] [PubMed]
  38. Seğmen, E.; Özdamar Ünlü, H. Effects of Foliar Applications of Commercial Seaweed and Spirulina Platensis Extracts on Yield and Fruit Quality in Pepper (Capsicum annuum L.). Cogent Food Agric. 2023, 9, 2233733. [Google Scholar] [CrossRef]
  39. Ashour, M.; Hassan, S.M.; Elshobary, M.E.; Ammar, G.A.G.; Gaber, A.; Alsanie, W.F.; Mansour, A.T.; El-Shenody, R. Impact of Commercial Seaweed Liquid Extract (TAM®) Biostimulant and Its Bioactive Molecules on Growth and Antioxidant Activities of Hot Pepper (Capsicum annuum). Plants 2021, 10, 1045. [Google Scholar] [CrossRef]
  40. Mannino, G.; Ricciardi, M.; Gatti, N.; Serio, G.; Vigliante, I.; Contartese, V.; Gentile, C.; Bertea, C.M. Changes in the Phytochemical Profile and Antioxidant Properties of Prunus Persica Fruits after the Application of a Commercial Biostimulant Based on Seaweed and Yeast Extract. Int. J. Mol. Sci. 2022, 23, 15911. [Google Scholar] [CrossRef]
  41. Kulbat, K. The role of phenolic compounds in plant resistance. Biotechnol. Food Sci. 2016, 80, 97–108. [Google Scholar] [CrossRef]
  42. Kumar, S.; Abedin, M.M.; Singh, A.K.; Das, S. Role of Phenolic Compounds in Plant-Defensive Mechanisms. In Plant Phenolics in Sustainable Agriculture; Springer: Singapore, 2020; pp. 517–532. [Google Scholar] [CrossRef]
  43. Hildebrandt, T.M.; Nunes Nesi, A.; Araújo, W.L.; Braun, H.-P. Amino Acid Catabolism in Plants. Mol. Plant 2015, 8, 1563–1579. [Google Scholar] [CrossRef]
  44. Yang, Q.; Zhao, D.; Liu, Q. Connections between amino acid metabolisms in plants: Lysine as an example. Front. Plant Sci. 2020, 11. [Google Scholar] [CrossRef]
  45. Chang, F.; Guo, C.; Sun, F.; Zhang, J.; Wang, Z.; Kong, J.; He, Q.; Sharmin, R.A.; Zhao, T. Genome-wide association studies for dynamic plant height and number of nodes on the main stem in summer sowing soybeans. Front. Plant Sci. 2018, 9, 1184. [Google Scholar] [CrossRef]
  46. Sulistyo, A.; Purwantoro; Sari, K.P. Correlation, path analysis and heritability estimation for agronomic traits contribute to yield on soybean. IOP Conf. Ser. Earth Environ. Sci. 2018, 102, 012034. [Google Scholar] [CrossRef]
  47. Li, M.; Liu, Y.; Wang, C.; Yang, X.; Li, D.; Zhang, X.; Xu, C.; Zhang, Y.; Li, W.; Zhao, L. Identification of traits contributing to high and stable yields in different soybean varieties across three Chinese latitudes. Front. Plant Sci. 2020, 10, 1642. [Google Scholar] [CrossRef] [PubMed]
  48. Maffei, M.E. 5-Hydroxytryptophan (5-HTP): Natural Occurrence, Analysis, Biosynthesis, Biotechnology, Physiology and Toxicology. Int. J. Mol. Sci. 2020, 22, 181. [Google Scholar] [CrossRef] [PubMed]
  49. Friedman, M. Analysis, Nutrition, and Health Benefits of Tryptophan. Int. J. Tryptophan Res. 2018, 11. [Google Scholar] [CrossRef]
  50. Jones, L.A.; Sun, E.W.; Martin, A.M.; Keating, D.J. The Ever-Changing Roles of Serotonin. Int. J. Biochem. Cell Biol. 2020, 125, 105776. [Google Scholar] [CrossRef]
  51. Ishihara, A.; Hashimoto, Y.; Tanaka, C.; Dubouzet, J.G.; Nakao, T.; Matsuda, F.; Nishioka, T.; Miyagawa, H.; Wakasa, K. The Tryptophan Pathway Is Involved in the Defense Responses of Rice against Pathogenic Infection via Serotonin Production. Plant J. 2008, 54, 481–495. [Google Scholar] [CrossRef] [PubMed]
  52. Back, K.; Tan, D.-X.; Reiter, R.J. Melatonin Biosynthesis in Plants: Multiple Pathways Catalyze Tryptophan to Melatonin in the Cytoplasm or Chloroplasts. J. Pineal Res. 2016, 61, 426–437. [Google Scholar] [CrossRef]
  53. Vitalini, S.; Dei Cas, M.; Rubino, F.M.; Vigentini, I.; Foschino, R.; Iriti, M.; Paroni, R. LC-MS/MS-Based Profiling of Tryptophan-Related Metabolites in Healthy Plant Foods. Molecules 2020, 25, 311. [Google Scholar] [CrossRef]
  54. He, H.; Lei, Y.; Yi, Z.; Raza, A.; Zeng, L.; Yan, L.; Xiaoyu, D.; Yong, C.; Xiling, Z. Study on the Mechanism of Exogenous Serotonin Improving Cold Tolerance of Rapeseed (Brassica napus L.) Seedlings. Plant Growth Regul. 2021, 94, 161–170. [Google Scholar] [CrossRef]
  55. Sadak, M.S.; Ramadan, A.A.E.-M. Impact of Melatonin and Tryptophan on Water Stress Tolerance in White Lupine (Lupinus termis L.). Physiol. Mol. Biol. Plants 2021, 27, 469–481. [Google Scholar] [CrossRef]
  56. Xu, L.; Zhu, Y.; Wang, Y.; Zhang, L.; Li, L.; Looi, L.J.; Zhang, Z. The potential of melatonin and its crosstalk with other hormones in the fight against stress. Front. Plant Sci. 2024, 15. [Google Scholar] [CrossRef]
Figure 1. Collection sites of the macroalgae Kappaphycus alvarezii in Ubatuba, São Paulo (SP), and Florianópolis, Santa Catarina (SC). Source: Elaborated by the author (2024).
Horticulturae 11 00424 g001
Figure 2. Hydroponic cultivation, with individualization using boxes and channels. Source: Elaborated by the author (2024).
Horticulturae 11 00424 g002
Figure 3. Principal component analysis (PC1 and PC2) calculated from the dataset of plant height, length of the roots (root size), number of nodes, root fresh mass, shoot fresh mass, root dry mass, and shoot dry mass of basil plants grown in a hydroponic system and treated with biostimulant of Kappaphycus alvarezii (1%, 3%, 5%, and 7%) cultivated in the locations of São Paulo and Santa Catarina, Brazil.
Horticulturae 11 00424 g003
Figure 4. Principal component analysis (PC1 and PC2) calculated from the dataset of chlorophyll-a (Chl a), chlorophyll-b (Chl b), total chlorophyll (TChl), total carotenoid (TCN), total soluble sugars (TSS), total starch (TSS), total carbohydrate (TC), total phenolic content (TPC), total flavonoid content (TFC), DPPH, total protein (TP), and total amino acid (TAA) of basil plants treated with foliar application of biostimulants of Kappaphycus alvarezii (1%, 3%, 5%, and 7%) cultivated in the locations of São Paulo and Santa Catarina.
Horticulturae 11 00424 g004
Figure 5. Pearson correlation (p < 0.05) between biochemical and morphological parameters of basil plants treated with biostimulants of Kappaphycus alvarezii. PH—plant height; RZ—root size (length of the roots); NN—number of nodes; RFM—root fresh mass; SFM—shoot fresh mass; RDM—root dry mass; SDM—shoot dry mass; Chl a—chlorophyll-a; Chl b—chlorophyll-b; TChl—total chlorophyll; TCN—total carotenoid; TSS—total soluble sugars; TS—total starch; TC—total carbohydrate; TPC—total phenolic content; TFC—total flavonoid content; DPPH—antioxidant activity via 2,2-Diphenyl-1-picrylhydrazyl; TP—total protein; TAA—total amino acid.
Horticulturae 11 00424 g005
Figure 6. Principal component analysis (PC1 and PC2) calculated from the dataset of biogenic amine profile of basil plants treated with foliar application of biostimulants of Kappaphycus alvarezii (1%, 3%, 5%, and 7%) cultivated in the locations of São Paulo and Santa Catarina, Brazil. 5-HTP—5-hydroxytryptophan; TRY—tryptophan; SER (s1)—serotonin (s1); AGM—agmatine; PUT—putrescine; CAD—cadaverine; HIS—histamine; SER (s2)—serotonin (s2); SPD—spermidine; L-dopamine; DOP—dopamine; SPM—spermine.
Horticulturae 11 00424 g006
Figure 7. Principal component analysis (PC1 and PC2) calculated from the dataset of plant height (cm), length of the roots (cm), number of nodes (n), root fresh mass (g), shoot fresh mass (g), root dry mass (g), shoot dry mass (g), chlorophyll-a (Chl a), chlorophyll-b (Chl b), total chlorophyll (TChl), total carotenoid (TCN), total soluble sugars (TSS), total starch (TSS), total carbohydrate (TC), total phenolic content (TPC), total flavonoid content (TFC), DPPH, total protein (TP), total amino acid (TAA), and biogenic amine profile of basil plants treated with foliar application of biostimulants of Kappaphycus alvarezii (1%, 3%, 5%, and 7%) cultivated in the locations of São Paulo and Santa Catarina, Brazil. PH—plant height; RZ—root size (length of the roots); NN—number of nodes; RFM—root fresh mass; SFM—shoot fresh mass; RDM—root dry mass; SDM—shoot dry mass; 5-HTP—5-hydroxytryptophan; TRY—tryptophan; SER (s1)—serotonin (s1); AGM—agmatine; PUT—putrescine; CAD—cadaverine; HIS—histamine; SER (s2)—serotonin (s2); SPD—spermidine; L-dopamine; DOP—dopamine; SPM—spermine.
Horticulturae 11 00424 g007
Table 1. Mean value and standard deviation (±) of plant height (cm), length of the roots (cm), number of nodes (n.), root fresh mass (g), shoot fresh mass (g), root dry mass (g), and shoot dry mass (g) of basil plants treated with foliar application of biostimulant of Kappaphycus alvarezii (1%, 3%, 5%, and 7%) cultivated in the locations of São Paulo and Santa Catarina, Brazil.
TreatmentPlant HeightLength of the RootsNumber of NodesRoot Fresh MassRoot Dry MassShoot Fresh MassShoot Dry Mass
São Paulo
Control48.17 ± 3.62 b29.30 ± 4.11 b32.40 ± 4.01 a72.40 ± 7.30 a2.27 ± 0.70 a135.40 ± 16.0 a11.67 ± 2.31 a
1%45.31 ± 1.12 b30.24 ± 6.69 b34.73 ± 1.12 a78.27 ± 8.62 a2.47 ± 0.64 a143.27 ± 14.6 a18.00 ± 6.00 a
3%56.40 ± 2.43 a45.35 ± 7.50 a34.50 ± 2.43 a80.60 ± 6.43 a2.53 ± 0.99 a149.47 ± 11.7 a21.00 ± 8.66 a
5%49.33 ± 1.28 b29.15 ± 0.62 b37.93 ± 1.28 a60.27 ± 11.8 a2.13 ± 0.52 a119.27 ± 6.50 a14.67 ± 4.51 a
7%49.57 ± 5.75 b28.40 ± 7.22 b29.67 ± 5.75 a74.40 ± 4.66 a2.20 ± 0.41 a132.13 ± 7.51 a15.67 ± 6.51 a
Santa Catarina
Control50.53 ± 4.31 a32.33 ± 3.49 a23.40 ± 6.61 b73.20 ± 8.28 a2.33 ± 0.90 b130.13 ± 21.0 a15.33 ± 8.08 a
1%48.57 ± 1.31 a29.49 ± 3.19 a28.93 ± 3.36 b74.67 ± 8.38 a2.20 ± 0.77 b131.87 ± 9.91 a10.67 ± 1.53 a
3%46.87 ± 3.70 a30.27 ± 3.80 a45.67 ± 8.80 a71.13 ± 10.0 a2.60 ± 0.63 b123.87 ± 9.93 a10.33 ± 2.52 a
5%47.83 ± 5.91 a32.87 ± 4.79 a51.53 ± 1.10 a67.47 ± 6.35 a3.20 ± 1.26 a132.20 ± 10.7 a13.00 ± 2.52 a
7%51.67 ± 1.36 a30.70 ± 1.54 a34.53 ± 6.23 b67.60 ± 9.55 a2.53 ± 0.74 b138.93 ± 12.2 a14.67 ± 5.69 a
Means followed by different letters in the columns differ statistically using the Scott and Knott test (p < 0.05). Lowercase letters represent statistical differences between treatments for each of the locations analyzed separately. Heatmap colors were calculated per column (variable) through the highest values (red), medium values (yellow), and the lowest value (green).
Table 2. Mean value and standard deviation (±) of chlorophyll-a (mg/g), chlorophyll-b (mg/g), total chlorophyll (mg/g), and total carotenoid (mg/g) of basil plants treated with foliar application of biostimulant of Kappaphycus alvarezii (1%, 3%, 5%, and 7%) cultivated in the locations of São Paulo and Santa Catarina, Brazil.
TreatmentChlorophyll-aChlorophyll-bTotal ChlorophyllTotal Carotenoid
São Paulo
Control0.91 ± 0.07 b0.34 ± 0.04 b1.25 ± 0.10 b0.1480 ± 0.01 c
1%0.96 ± 0.05 b0.34 ± 0.01 b1.30 ± 0.06 b0.1646 ± 0.01 b
3%0.95 ± 0.05 b0.35 ± 0.02 b1.30 ± 0.07 b0.1581 ± 0.01 c
5%1.03 ± 0.06 a0.36 ± 0.03 a1.39 ± 0.09 a0.1787 ± 0.02 a
7%0.96 ± 0.05 b0.35 ± 0.02 b1.32 ± 0.07 b0.1581 ± 0.01 c
Santa Catarina
Control1.01 ± 0.07 b0.37 ± 0.02 a1.38 ± 0.08 b0.1537 ± 0.02 b
1%1.05 ± 0.08 a0.38 ± 0.04 a1.42 ± 0.11 a 0.1742 ± 0.01 a
3%1.01 ± 0.13 b0.37 ± 0.05 a1.38 ± 0.19 b0.1701 ± 0.03 a
5%0.94 ± 0.04 b0.35 ± 0.03 a1.29 ± 0.07 b0.1593 ± 0.00 b
7%1.10 ± 0.09 a0.40 ± 0.03 a1.50 ± 0.12 a0.1748 ± 0.01 a
Means followed by different letters in the columns differ statistically using the Scott and Knott test (p < 0.05). Lowercase letters represent statistical differences between treatments for each of the locations analyzed separately. Heatmap colors were calculated per column (variable) through the highest values (red), medium values (yellow), and the lowest value (green).
Table 3. Mean value and standard deviation (±) of total soluble sugars (mg/g), total starch (mg/g), and total carbohydrate (mg/g) of basil plants treated with foliar application of biostimulant of Kappaphycus alvarezii (1%, 3%, 5%, and 7%) cultivated in the locations of São Paulo and Santa Catarina, Brazil.
TreatmentTotal Soluble SugarsTotal StarchTotal Carbohydrate
São Paulo
Control10.28 ± 1.17 c5.64 ± 0.95 c36.66 ± 3.95 b
1%20.92 ± 1.93 b2.28 ± 0.25 c28.16 ± 6.56 c
3%18.46 ± 1.76 b6.69 ± 4.77 b46.72 ± 6.49 a
5%29.39 ± 14.22 a6.30 ± 2.40 b48.39 ± 2.43 a
7%22.14 ± 8.54 b9.28 ± 3.82 a38.19 ± 3.06 b
Santa Catarina
Control14.01 ± 0.38 b3.08 ± 0.61 b34.49 ± 7.29 c
1%19.61 ± 4.35 b2.49 ± 0.63 b31.56 ± 5.74 c
3%18.09 ± 5.63 b5.05 ± 1.73 a32.16 ± 0.14 c
5%22.85 ± 1.61 a6.12 ± 5.93 a63.79 ± 7.39 a
7%27.33 ± 8.99 a6.15 ± 1.18 a57.07 ± 8.18 b
Means followed by different letters in the columns differ statistically using the Scott and Knott test (p < 0.05). Lowercase letters represent statistical differences between treatments for each of the locations analyzed separately. Heatmap colors were calculated per column (variable) through the highest values (red), medium values (yellow), and the lowest value (green).
Table 4. Mean value and standard deviation (±) of the total phenolic content (mg/g), total flavonoid content (mg/g), and DPPH antioxidant activity (%) of basil plants treated with foliar application of biostimulant of Kappaphycus alvarezii (1%, 3%, 5%, and 7%) cultivated in the locations of São Paulo and Santa Catarina, Brazil.
TreatmentTotal PhenolicTotal FlavonoidDPPH
São Paulo
Control13.41 ± 3.69 a0.78 ± 0.06 a42.84 ± 10.04 a
1%11.10 ± 0.55 b0.73 ± 0.20 a31.93 ± 8.44 b
3%8.19 ± 1.47 c0.45 ± 0.12 b27.05 ± 4.68 b
5%10.97 ± 2.06 b0.69 ± 0.11 a36.21 ± 11.12 a
7%9.67 ± 3.04 c0.77 ± 0.17 a33.20 ± 7.38 b
Santa Catarina
Control8.12 ± 2.59 b0.65 ± 0.06 a38.98 ± 13.49 a
1%9.48 ± 3.32 a0.78 ± 0.09 a44.25 ± 13.62 a
3%7.04 ± 1.29 b0.59 ± 0.06 a33.12 ± 6.35 b
5%10.50 ± 2.95 a0.68 ± 0.10 a45.34 ± 7.73 a
7%6.30 ± 1.86 b0.64 ± 0.26 a31.36 ± 4.93 b
Means followed by different letters in the columns differ statistically using the Scott and Knott test (p < 0.05). Lowercase letters represent statistical differences between treatments for each of the locations analyzed separately. Heatmap colors were calculated per column (variable) through the highest values (red), medium values (yellow), and the lowest value (green).
Table 5. Mean value and standard deviation (±) of total protein (mg/g) and total amino acid (mg/g) of basil plants treated with foliar application of biostimulant of Kappaphycus alvarezii (1%, 3%, 5%, and 7%) cultivated in the locations of São Paulo and Santa Catarina, Brazil.
TreatmentTotal ProteinTotal Amino Acid
São Paulo
Control0.55 ± 0.11 a0.87 ± 0.15 c
1%0.39 ± 0.11 b0.35 ± 0.04 e
3%0.52 ± 0.08 a0.59 ± 0.18 d
5%0.52 ± 0.14 a1.13 ± 0.28 b
7%0.49 ± 0.11 a1.79 ± 0.27 a
Santa Catarina
Control0.55 ± 0.13 a0.47 ± 0.09 d
1%0.46 ± 0.06 a0.38 ± 0.10 d
3%0.51 ± 0.08 a0.78 ± 0.27 c
5%0.51 ± 0.10 a1.41 ± 0.65 a
7%0.36 ± 0.09 b0.95 ± 0.18 b
Means followed by different letters in the columns differ statistically using the Scott and Knott test (p < 0.05). Lowercase letters represent statistical differences between treatments for each of the locations analyzed separately. Heatmap colors were calculated per column (variable) through the highest values (red), medium values (yellow), and the lowest value (green).
Table 6. Heatmap of the biogenic amine profile (µg/g) of basil plants treated with foliar application of biostimulants of Kappaphycus alvarezii (1%, 3%, 5%, and 7%) cultivated in the locations of São Paulo and Santa Catarina, Brazil.
TreatmentControl SP1% Kal-SP3% Kal-SP5% Kal-SP7% Kal-SPControl SC1% Kal-SC3% Kal-SC5% Kal-SC7% Kal-SC
5-HTP627.33 ± 55.33 a 575.17 ± 54.88 a 561.16 ± 57.67 a 669.53 ± 44.89 a583.05 ± 17.92 a 680.80 ± 56.51 a482.66 ± 12.72 b522.21 ± 73.74 b571.23 ± 1.53 b526.14 ± 26.78 b
TRY433.04 ± 6.99 a433.91 ± 22.98 a386.97 ± 15.88 b396.64 ± 5.20 b398.71 ± 15.87 b414.90 ± 16.94 a395.30 ± 10.29 a336.09 ± 12.64 b406.48 ± 3.61 a382.65 ± 21.84 a
SER (s1)27.34 ± 0.95 a23.61 ± 1.12 a23.59 ± 1.17 a22.33 ± 0.38 a20.76 ± 5.79 a20.77 ± 0.69 b34.42 ± 2.73 a19.47 ± 1.19 b20.93 ± 1.51 b30.22 ± 5.10 a
AGM13.02 ± 0.03 a14.93 ± 0.57 a9.46 ± 1.09 c11.47 ± 0.29 b14.78 ± 1.86 a10.24 ± 0.49 b6.58 ± 0.82 c10.12 ± 1.62 b10.03 ± 0.02 b15.67 ± 0.32 a
PUT6.21 ± 0.02 a5.70 ± 0.54 a5.26 ± 0.03 b3.84 ± 0.31 c5.01 ± 0.21 b4.77 ± 0.03 c6.15 ± 0.15 b4.24 ± 0.07 c4.33 ± 0.07 c7.30 ± 1.10 a
CAD0.13 ± 0.00 c0.15 ± 0.02 c0.19 ± 0.01 c0.29 ± 0.10 b0.39 ± 0.01 a0.16 ± 0.01 b0.24 ± 0.01 a0.08 ± 0.01 c0.19 ± 0.02 b0.21 ± 0.05 b
HIS1.90 ± 0.04 a1.65 ± 0.49 a1.40 ± 0.31 a0.78 ± 0.06 b1.17 ± 0.09 b0.57 ± 0.04 e2.40 ± 0.02 c1.47 ± 0.07 d2.61 ± 0.01 b4.18 ± 0.08 a
SER (s2)5.09 ± 0.10 c7.88 ± 0.53 a4.18 ± 0.00 d3.91 ± 0.15 d6.45 ± 0.21 b5.01 ± 0.22 a5.20 ± 0.19 a4.30 ± 0.32 b3.41 ± 0.00 c5.46 ± 0.49 a
SPD0.10 ± 0.03 a0.11 ± 0.04 a0.20 ± 0.12 a0.03 ± 0.00 a0.04 ± 0.01 a0.07 ± 0.00 b0.20 ± 0.06 a0.12 ± 0.00 b0.23 ± 0.04 a0.14 ± 0.02 b
L-Dopa0.004 ± 0.00 c0.004 ± 0.00 c0.008 ± 0.00 b0.014 ± 0.00 a0.013 ± 0.00 a0.004 ± 0.00 a0.004 ± 0.00 a0.004 ± 0.00 a0.006 ± 0.00 a0.000 ± 0.00 a
DOP0.67 ± 0.08 a0.63 ± 0.01 a0.44 ± 0.01 b0.53 ± 0.00 b0.47 ± 0.06 b0.58 ± 0.03 c0.75 ± 0.00 a0.43 ± 0.03 d0.66 ± 0.01 b0.80 ± 0.09 a
SPM19.78 ± 3.37 a15.71 ± 2.61 b0.08 ± 0.01 c0.11 ± 0.00 c0.10 ± 0.02 c0.10 ± 0.00 c0.17 ± 0.00 b0.13 ± 0.00 c0.22 ± 0.02 a0.25 ± 0.03 a
Means followed by different letters in the columns differ statistically using the Scott and Knott test (p < 0.05). Lowercase letters represent statistical differences between treatments for each of the locations analyzed separately. Heatmap colors were calculated per line (biogenic amine) through the highest values (red), medium values (yellow), and the lowest value (green). 5-HTP—5-hydroxytryptophan; TRY—tryptophan; SER (s1)—serotonin (s1); AGM—agmatine; PUT—putrescine; CAD—cadaverine; HIS—histamine; SER (s2)—serotonin (s2); SPD—spermidine; L-Dopa—L-dopamine; DOP—dopamine; SPM—spermine.
Disclaimer/Publisher’s Note: The statements, opinions and data contained in all publications are solely those of the individual author(s) and contributor(s) and not of MDPI and/or the editor(s). MDPI and/or the editor(s) disclaim responsibility for any injury to people or property resulting from any ideas, methods, instructions or products referred to in the content.

