Article

Development of SNP Markers and Core Collection Construction of Berberis L. Based on SLAF-Seq in Xinjiang, China

1
College of Horticulture, Xinjiang Agricultural University, Urumqi 830052, China
2
Xinjiang Branch of the National Forest and Grass Germplasm Resources Facility Preservation Bank, Xinjiang Uygur Autonomous Region Forest and Grass Germplasm Resources Center, Urumqi 830000, China
*
Author to whom correspondence should be addressed.
Horticulturae 2025, 11(4), 434; https://doi.org/10.3390/horticulturae11040434
Submission received: 4 March 2025 / Revised: 16 April 2025 / Accepted: 16 April 2025 / Published: 18 April 2025

Abstract

:
Berberis L. (Berberidaceae) are important medicinal and edible plants in Xinjiang, China, and genetic diversity research and the construction of core collection will help to elucidate the genetic background of Berberis L. and is of great significance for exploitation and utilisation. In this study, 150 samples of Berberis L. from Xinjiang in China were used for Sequencing of Specific Locus Amplified Fragments (SLAF-seq), obtaining 207,786 SNP markers, of which 36,353 had integrity > 0.5 and minor allele frequency (MAF) > 0.05. We constructed a phylogenetic tree based on these high-quality SNPs, which divided Berberis L. into three groups. Further, we divided them into five groups through population structure analysis. Extensive genetic exchange was observed among Berberis L. from different regions. Core Hunter II software was used to screen 45 core collections from 150 Berberis L., which could represent 99.8% genetic diversity of Berberis L. in Xinjiang, China. The core collection in Tekes and Wensu had the largest distribution, which can be used as key conservation areas to provide basic materials for the conservation and utilisation of Berberis L. in Xinjiang, China.

1. Introduction

Berberis L. belongs to the Berberidaceae family and is a perennial herb or shrub [1]. It is estimated that there are about 650 species of Berberis L. worldwide [2,3] and about 250 species in China [4,5]. Xinjiang in China, located in the centre of the Asian–European continent, and with its unique geographical environment and climatic conditions, it has nurtured rich Berberis L. germplasm resources [6]. Berberis L. plays an important role in traditional Uyghur medicine [7], and it has efficacy in clearing heat, anti-inflammatory effects, and antibacterial effects, and can be used to treat a variety of diseases, such as dysentery, upper respiratory tract infections, acute conjunctivitis, chronic hepatitis, hypertension, and diabetes [8,9]. In addition, the fruits of Berberis L. have been widely used in functional foods, nutraceuticals and natural colouring agents since ancient times [10]. It is worth mentioning that Berberis L. plays an irreplaceable role in maintaining the biodiversity and ecological protection system of the region, due to its outstanding resistance and ornamental value, which can prevent soil erosion, conserve water and improve soil quality [11]. However, in recent years, the destruction of Berberis L. habitats due to natural factors such as climate change, species invasions, changes in soil properties, and anthropogenic factors such as land reclamation, over-excavation, pests and diseases, and habitat destruction, has resulted in obvious patchiness, reduced diversity of germplasm resources, and limited renewal of populations. Therefore, it is important to carry out genetic diversity research for the conservation and utilisation of Berberis L. resources in Xinjiang, China.
Molecular marker technology has become one of the main methods for studying genetic diversity and building core collections. Single Nucleotide Polymorphism (SNP) is a third-generation molecular marker developed from the nucleic acid sequence of the species itself. It has many sites and a wide distribution, and is the novel genetic marker that can directly reflect differences in DNA levels between individuals of different organisms [12]. SLAF-seq is a rapid, accurate, efficient, and cost-effective method for developing large-scale SNP and InDel markers [13], and has been widely used for genetic diversity, population structure analysis, core collection resources and fingerprinting in plants such as Olea europaea L. [14], Allium sativum L. [15], Isatis tinctoria L. [16], and Hevea brasiliensis (Willd. ex A. Juss.) MülL. Arg. [17]. Tian et al. [17] used SNP to cluster 195 rubber tree resources into two categories and established a core collection of 21 materials according to a 10% sampling rate. Akishev et al. [18] used RAPD to analyse the genetic diversity of Berberis iliensis in Kazakhstan and found that 26% of the total diversity was among populations and 74% within populations, which makes it genetically diverse and easily adapted to environmental changes. Pinar et al. [19] analysed the genetic diversity of two populations of Berberis L. in Turkey and Kyrgyzstan by ISSR using 20 primers, and finally clustered them into four classes. Recent research [20] has revealed the evolution of the chloroplast genome of Berberis L. and developed suitable molecular markers for the identification of medicinal species. However, few studies have been reported on the development of a large number of SNPs in Berberis L. using SLAF-seq.
We carried out genetic diversity and population structure analyses based on 150 SNP markers of Berberis L. plants in Xinjiang, and also screened the core collection. These conclusions can provide a molecular basis for the development and use of Berberis L. in Xinjiang, and a theoretical basis for the study of the origin and domestication of Berberis L. in Xinjiang.

2. Materials and Methods

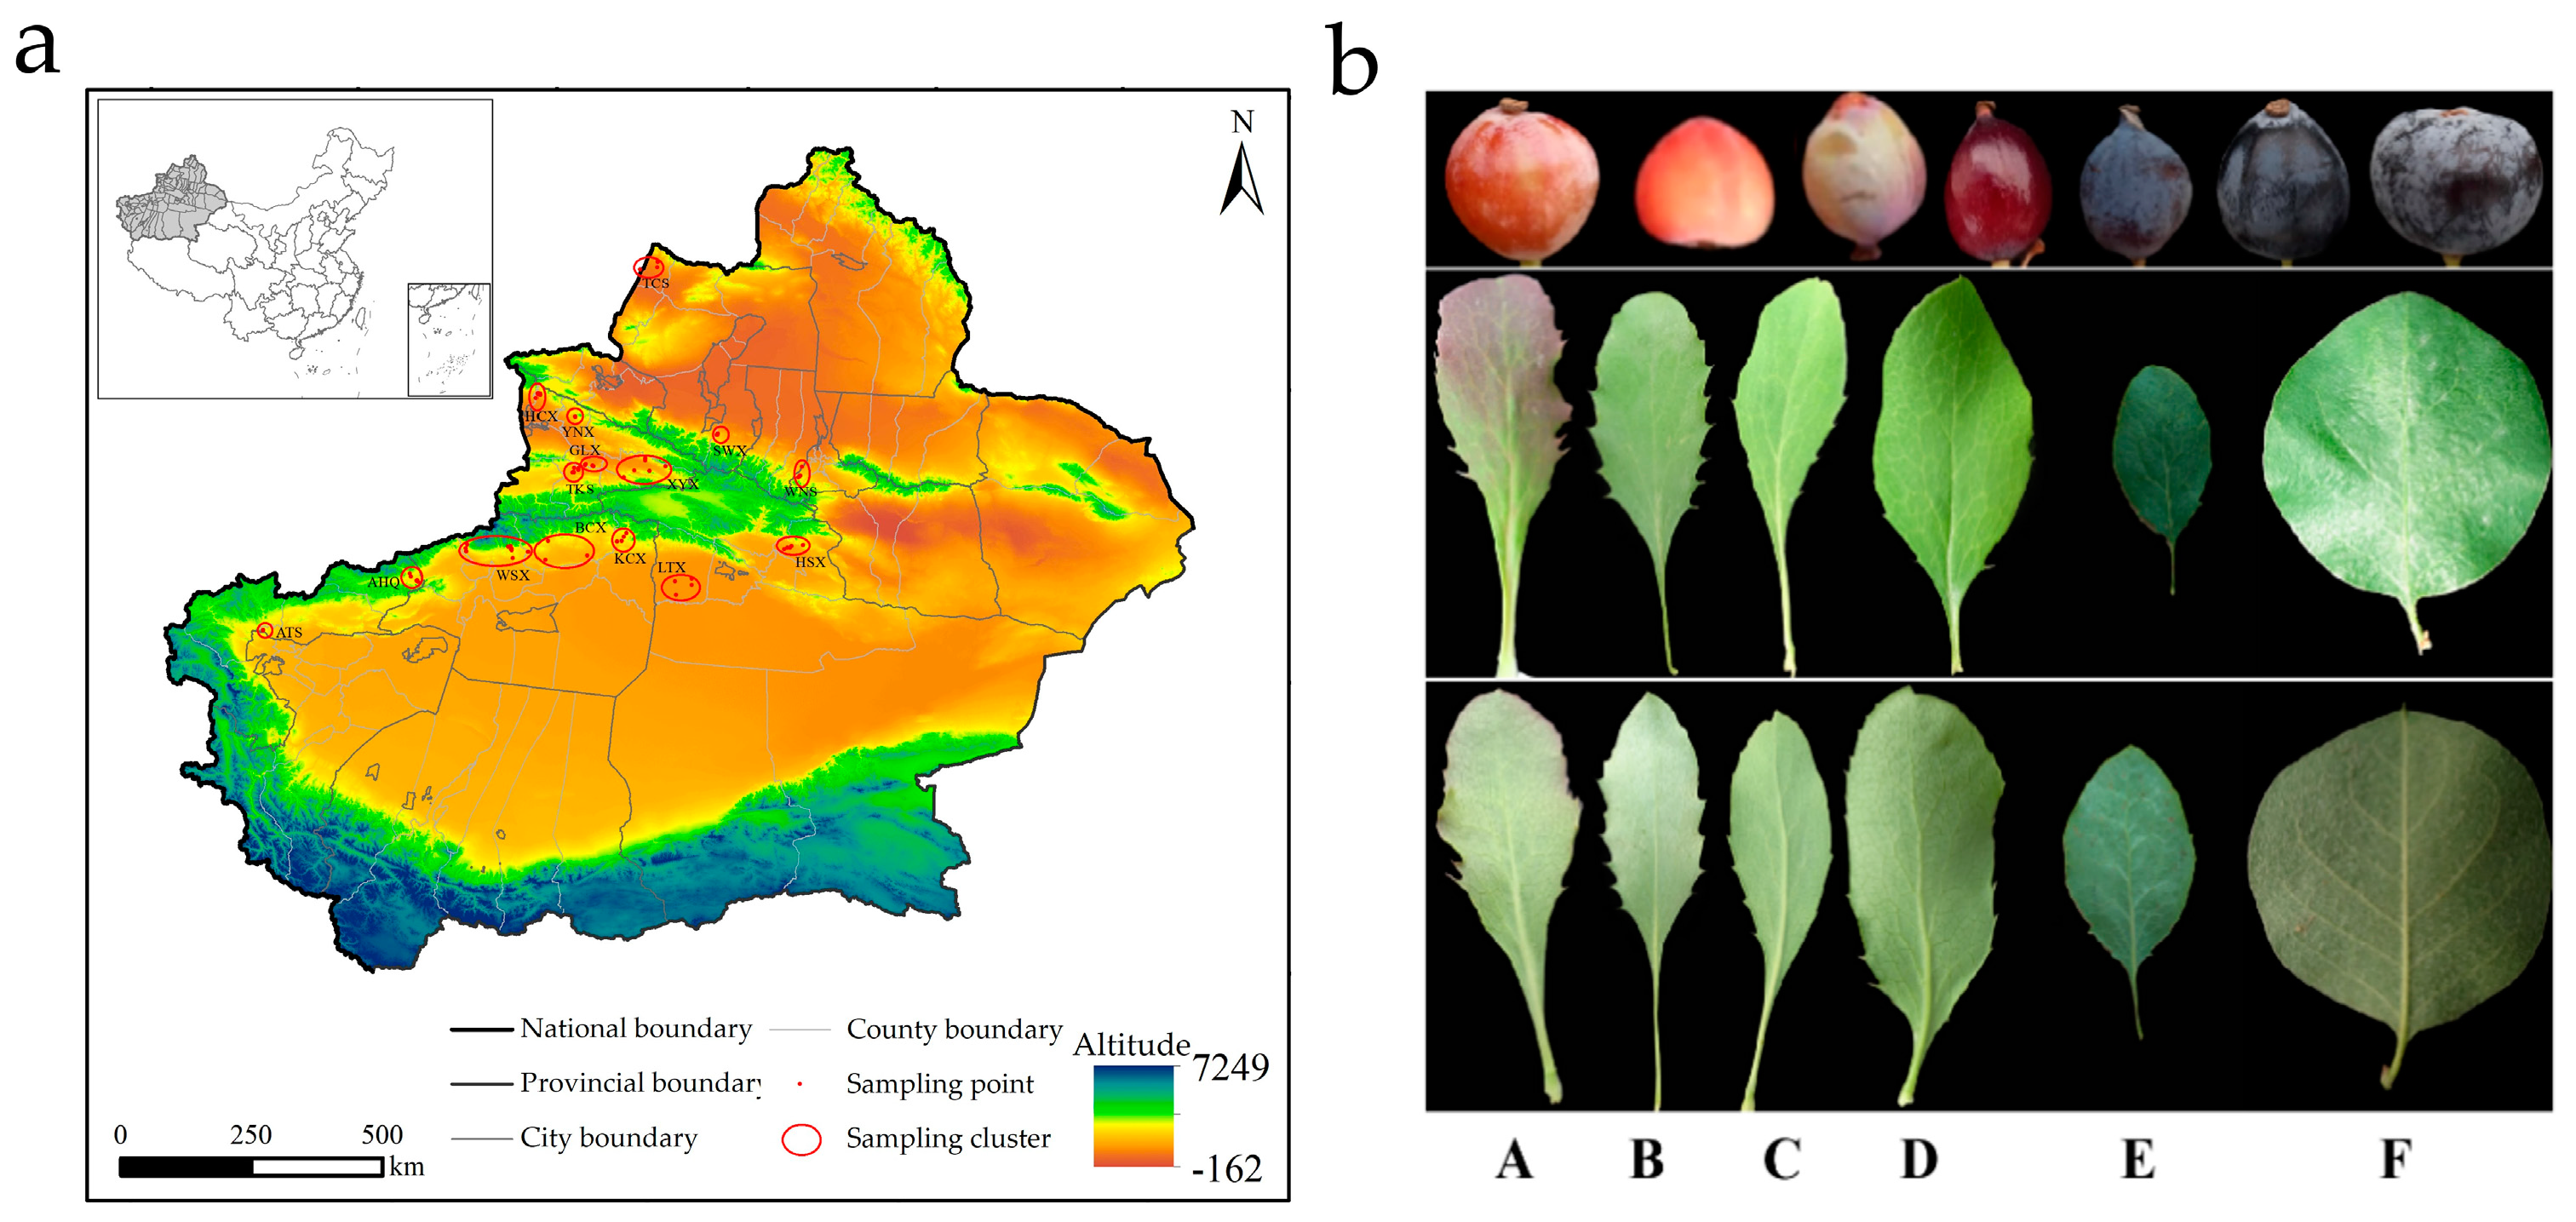
2.1. Plant Materials and Population Sampling

During the period from July 2022 to September 2024, sample collection was systematically carried out in the main distribution area of Berberis L. in Xinjiang. Based on the results of the preliminary research, 15 representative natural populations of Berberis L. were selected for the study. The sampling area covered six regions in Xinjiang, China: the Tacheng region (n = 2, n represents the number of populations), Ili Kazakh Autonomous Prefecture (n = 5), Urumqi (n = 1), Bayingolin Mongolian Autonomous Prefecture (n = 2), the Aksu region (n = 3), and Kizilsu and Kirgiz Autonomous Prefectures (n = 2). A total of 150 samples were collected, which consisted of 107 Berberis hetropoda Schrenk, 41 Berberis nummularia Bunge, and 2 Berberis kaschgarica Rupr. (Table S1).
In each population, fresh young leaves of healthy growing plants without pests and diseases were collected by a random sampling method. The collected leaves were immediately placed in plastic bags with silica gel used for subsequent DNA extraction. The total of the major Berberis L. species collected in this survey and the specific sampling information of each population are shown in Figure 1a,b.

2.2. DNA Extraction and Enzyme Digestion Design

Total genomic DNA was extracted following a modified cetyltrimethyl ammonium bromide (CTAB) method [21], and the concentration and quality of DNA were detected using 0.8% agarose gel electrophoresis and an ND-1000 spectrophotometer (Thermo Fisher Scientific, Waltham, MA, USA), respectively [22]. The quantified DNA was diluted to 100 ng/µL for SLAF sequencing. To obtain more than 100,000 SLAF tags (defined as enzyme fragment sequences of 364–394 bp), a computer simulation of digestion enzyme prediction was used to select for a low percentage of restriction fragments with repetitive sequences, and the restriction endonuclease cleavage combination was determined to be restriction enzyme combination (RsaI + HinCII).

2.3. SLAF Sequencing and Data Evaluation

Genomic DNA from each accession was digested with RsaI and HinCII to obtain the SLAF tags, followed by fragment end reparation, dual-index [23] paired-end adapter ligation, PCR amplification, and target fragment selection for SLAF library construction. Finally, SLAF sequencing was performed using the Illumina HiSeq TM 2500 platform (Illumina, Inc., San Diego, CA, USA) to obtain raw data.
The raw data obtained from sequencing were identified using dual index to obtain reads for each sample. After filtering the splices of sequencing reads, the sequencing quality was evaluated by calculating the guanine–cytosine (GC) content and Q30 (Q = −10 × log10p, which denotes a probability of error of 0.1% and a confidence level of 99.9%).

2.4. Development of SLAF Tags and SNP Markers

Raw sequencing data were categorised by sample using dual-indexed tags. Reads from each sample originated from one SLAF segment based on sequence similarity. The sequence similarity of the same SLAF tag across samples was much higher than the similarity between different SLAF tags. A SLAF tag can be defined as a polymorphic SLAF tag if its sequence differs among different samples.
SNP markers were developed by using the sequence type with the highest depth in each SLAF tag as the reference sequence, comparing the sequenced reads to the reference sequence using bwa (0.7.10-r789) [24] and developing SNPs using both GATK (v3.8) [25] and samtools (v1.9) [26] to obtain the SNP marker intersections. These were used as the final reliable SNP marker dataset, and among these reliable SNPs, those with completeness > 0.5 and MAF > 0.05 were considered highly consistent and used for subsequent analysis.

2.5. Genetic Relationships Among Samples

Phylogenetic trees for each sample were constructed using MEGA X software, based on the neighbour-joining method using the Kimura 2-parameter model with bootstrap replicated 1000 times [27].
The population structure of the study materials was based on SNP analysis using admixture software [28]. For the population, the number of subclusters (K-values) was predetermined to be 1–10 for clustering, and the clustering results were cross-validated to determine the optimal number of subclusters based on the trough of the cross-validation error rate. Q-matrix stacked plots for each K-value were generated using Pophelper (http://royfrancis.github.io/pophelper, accessed on 16 April 2024). The clustering of the samples was obtained using the smart PCoA programme in the EIGENSOFT package based on the SNP data, which was subjected to principal component analysis. The first two PCs were used to categorise the samples, and each principal component explained the percentage of total variation.

2.6. Construction of Core Collection

Using Core Hunter II software ( v2.0), the weighted indices Modified Rogers Distance (0.7) and Shannon Diversity Index (0.3) were screened according to the total germplasm proportion of 0.1, 0.2, 0.3, 0.4, 0.5, 0.6, 0.7, 0.8, and 0.9 gradient. Gene coverage (CV) evaluation was performed to finalise the core collection. The core collection was evaluated using genetic diversity parameters and phenotypic traits, and the t-test was used to test the significance of differences.

2.7. Construction of DNA Fingerprints

Based on the SNP marker information obtained from the above analysis, DNA fingerprints were constructed using qrencode software, and 2D codes were automatically generated by inputting genotypes.

3. Results

3.1. Sequence and Quality Statistics

A restriction enzyme combination (RsaI + HinCII) was determined on the basis of a computer simulation of digestion enzyme prediction, which produced 135,975 SLAF tags of 364–394 bp in length. A total of 724 Mb of sequencing data was obtained by SLAF library construction and high-throughput sequencing, with the maximum and minimum reads coming from XYX2 and BCX3, respectively. The average values of GC content and Q30 values were 38.90% and 95.77%, respectively (Table S2), indicating that the base error rate was low and the enzyme combination was accurate.

3.2. Development of Polymorphic SLAF Tags and Selection of SNP Markers

A total of 409,851 SLAF tags were developed from 150 Berberis L., including 12,623 polymorphic tags with an average depth of 12.28×. A total of 207,786 population SNP markers were obtained, with completeness ranging from 15.86% to 55.47%. In addition, 36,353 SNP markers with completeness > 0.5 and MAF > 0.05, and high agreement and confidence were screened, indicating some genetic differences among the 150 samples of Berberis L. (Table S1).

3.3. Genetic Relationships and Phylogenetic Tree Construction

The phylogenetic tree analysis of 150 Berberis L. based on SNP markers showed the evolutionary relationships and the proximity of their relatives (Figure 2). The results of SNP clustering showed that the clustering was basically according to species. The B. hetropoda Schrenk was clustered into two groups. Among them, group I contained 65 B. hetropoda Schrenk (43.3%), and group II contained 42 B. hetropoda Schrenk (28.0%). The other Berberis L. species were clustered into group III, containing 41 B. nummularia Bunge (27.0%) and 2 B. kaschgarica Rupr. (1.0%), indicating that two species were relatively close to each other, and that there were differences in SNPs between different Berberis L. species. It is noteworthy that B. nummularia Bunge of Tekes, Luntai, and Wensu counties clustered together, and B. hetropoda Schrenk from Aheqi and Xinyuan counties clustered together, suggesting that there are also differences between the same Berberis L.

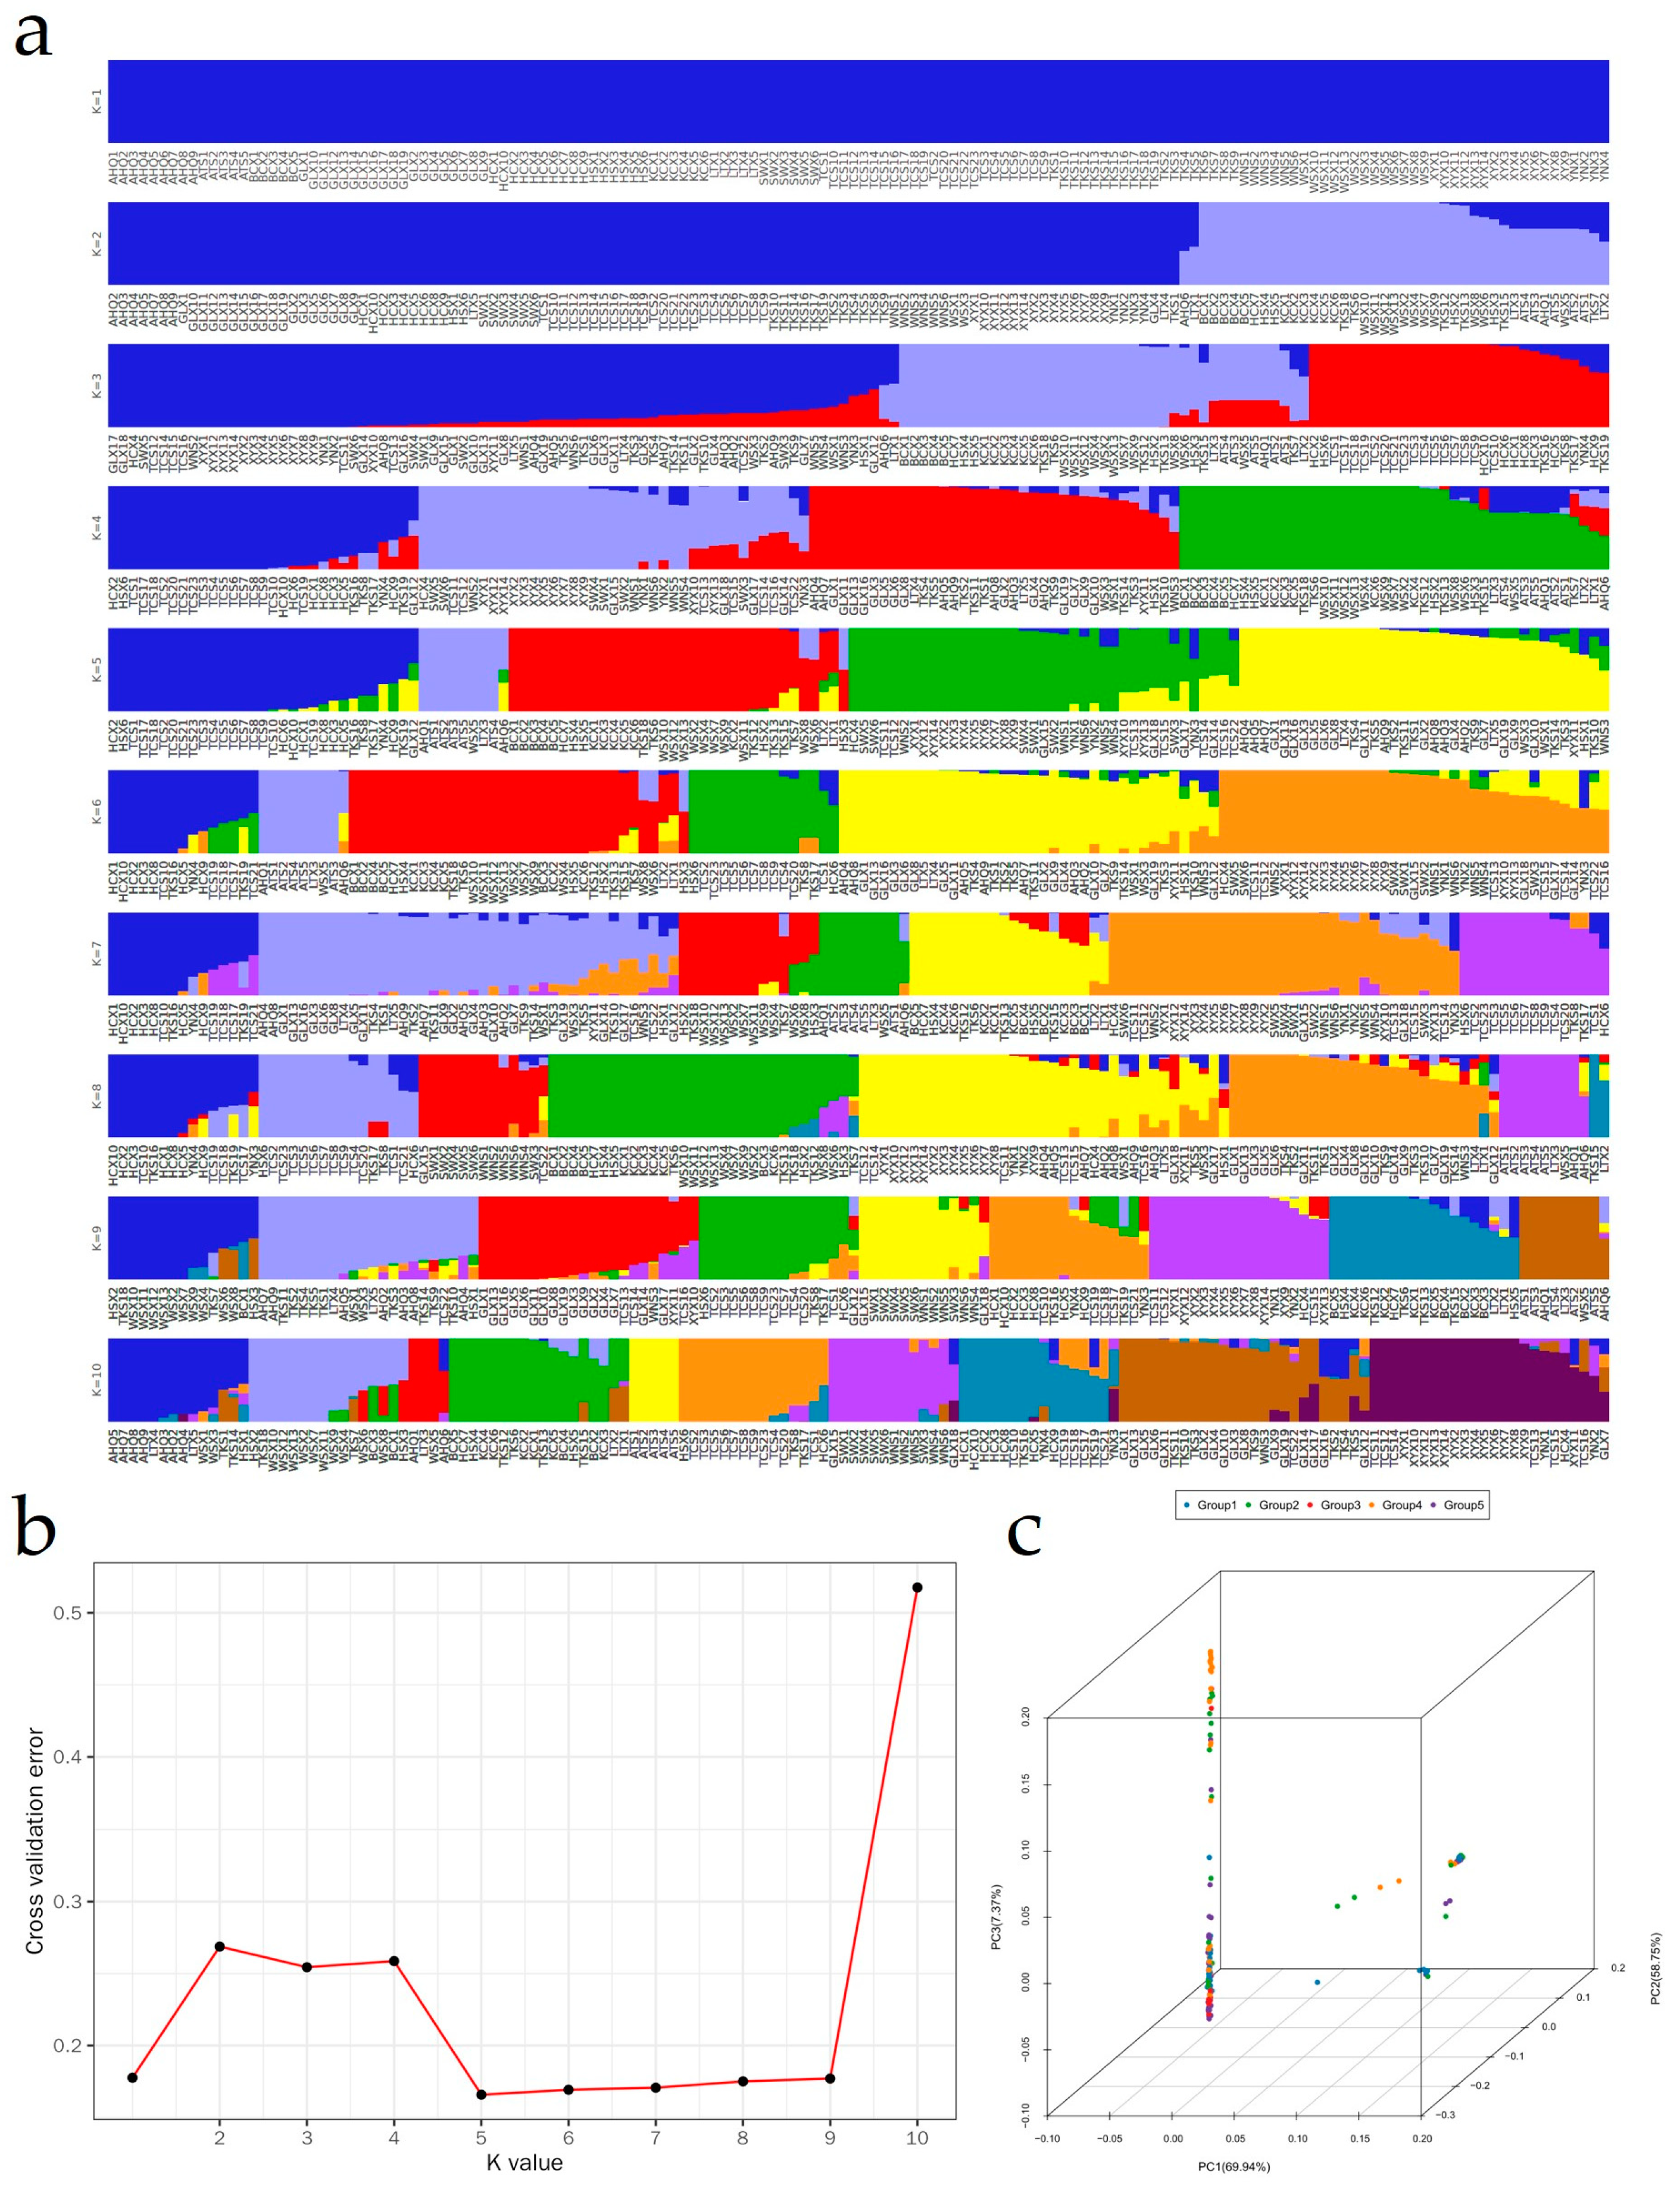
3.4. Population Structure and Principal Components Analysis

A total of 150 samples of Berberis L. were analysed for genetic diversity using SNP. The population structure was analysed under the assumption that the number of clusters (K) ranged from 1 to 10. At a minimum value of ΔK of 5, there were five clusters, suggesting that of our samples may have originated from five primitive ancestors.
Figure 3a shows that in this study, Berberis L. was clustered into five groups throughout Xinjiang, China. The results are inconsistent with the classification results of the phylogenetic tree. Among them, B. hetropoda Schrenk were clustered into three groups; most of B. hetropoda Schrenk originating from Gongliu were clustered into group I, most of B. hetropoda Schrenk originating from Huocheng and Tacheng were clustered into group II, and B. hetropoda Schrenk, originating from Yining, Shawan, and Urumqi, were clustered into group V. This indicates that B. hetropoda Schrenk produced population genetic differentiation due to geographical distribution segregation. All the B. kaschgarica Rupr. and the B. nummularia Bunge of WSX3, WSX5, ATS1, ATS3, ATS4, ATS5, AHQ1, AHQ6, HSX3, and LTX3 were clustered into group III. The B. nummularia Bunge originating from Wensu, Kuqa, Baicheng, Tekes, Luntai, and Heshuo were clustered into group IV.
Principal coordinate analysis (PCoA) based on SNP markers revealed that PC1, PC2, and PC3 cumulatively explained 92.98% of the variance (Figure 3c). The 150 Berberis L. showed a clear trend of spatial separation, as only a small number of samples from groups I, II, IV, and V were tightly clustered on the right side of the coordinate axis, with genetic relationships close to each other; the remaining germplasm is scattered on the left side of the principal coordinate axis, indicating that the genetic relationships between the groups are relatively distant and the overall genetic basis is relatively narrow.

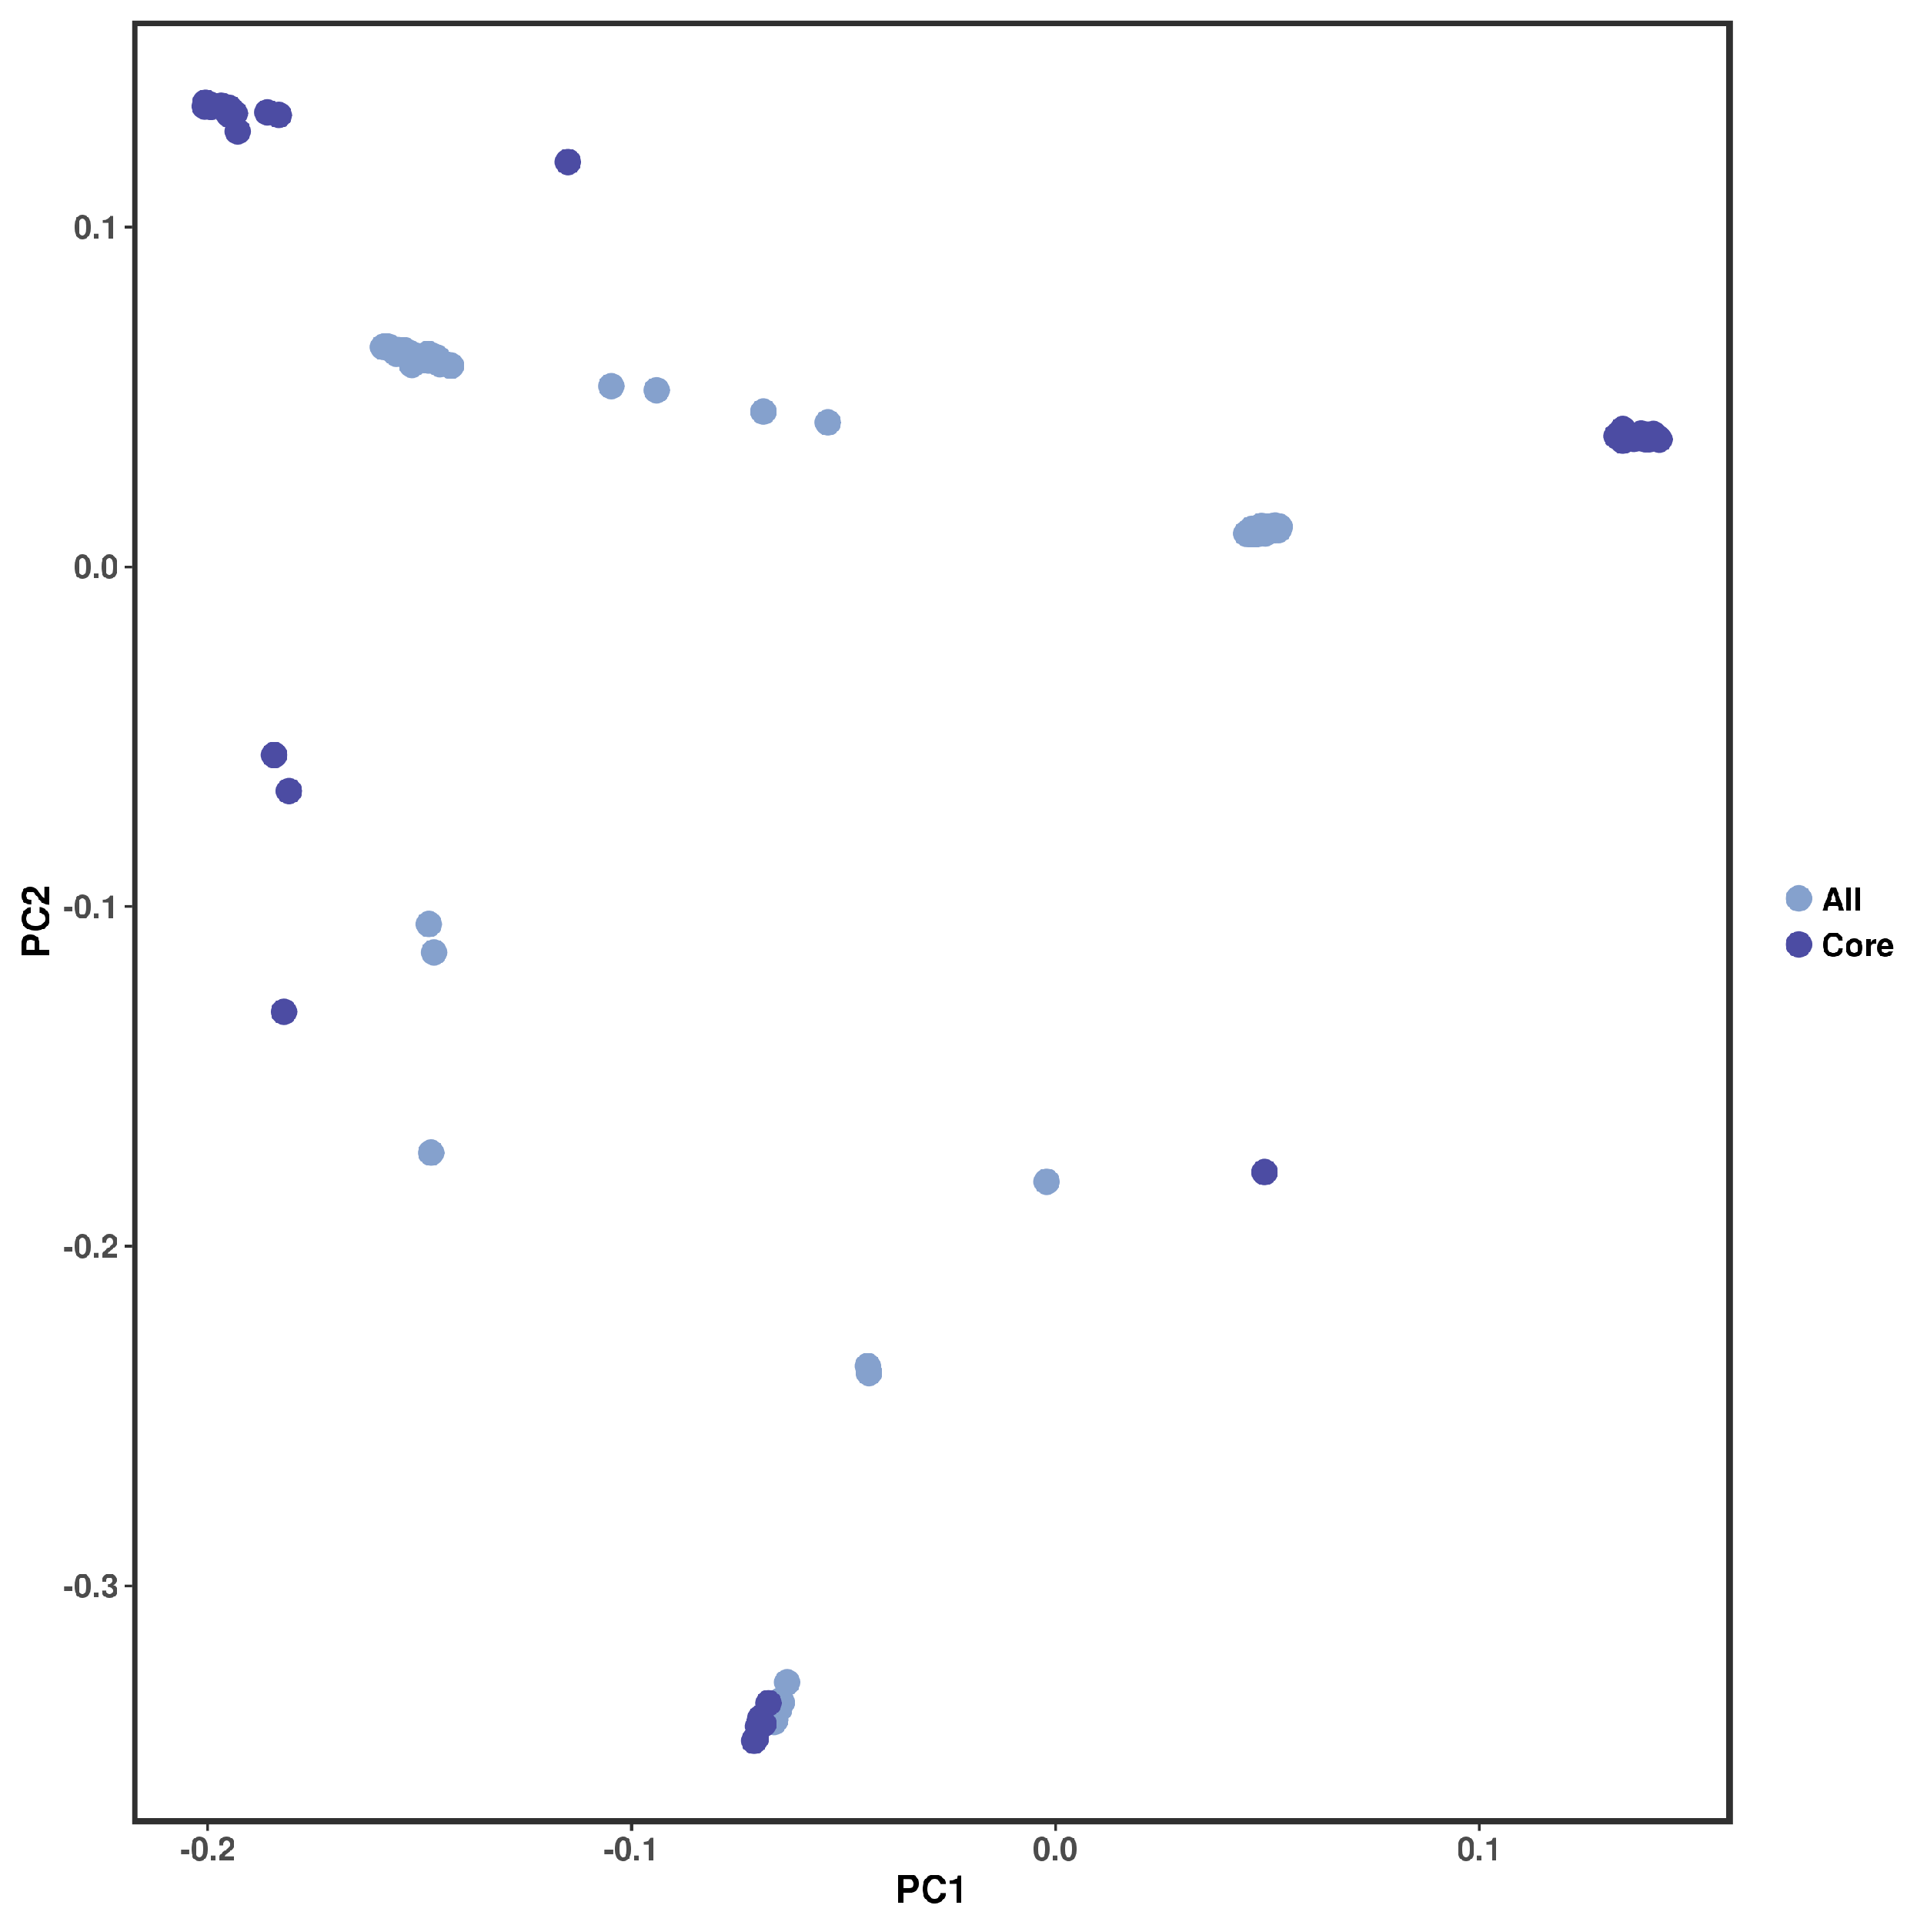
3.5. Construction and Evaluation of Core Collection

Among the 45 core collections, there are 8 germplasm each from population structure groups I and V (Figure 3), with a contribution rate of 17.78% each; there are 7 germplasm each from population structure groups II and IV (Figure 3), with a contribution rate of 15.56% each; there are 15 germplasm from population structure group III (Figure 3), with a contribution rate of 33.33%. More than half of the resources in group III come from Tekesi and Wensu, indicating that these two areas should be the focus of future Berberis L. conservation efforts (Table S3).
The genetic diversity parameters of the core collection (Table S4) showed that the retention rates of Observed heterozygosity (Ho), Expected heterozygosity (He), Nei diversity index (H), Shannon–Wiener index (I), and Polymorphism information content (PIC) were 107.21%, 124.37%, 125.36%, 118.86%, and 120.69%, respectively. The t-test results showed that the genetic diversity index differences between the constructed core collection of Berberis L. and the initial collection, as well as between the core collection and the reserved collection, were not significant. PCoA was used to compare the geometric distribution of the genetic structure of the constructed core collection and all collections (Figure 4). The results showed that the core collection was evenly distributed among all the collections in the principal coordinates, and could comprehensively represent the wild Berberis L. in Xinjiang, China.

3.6. The DNA Fingerprints

The SNP markers of Berberis L. were selectively screened using qrencode based on the characteristics of high marker quality, representativeness, high discrimination, even genome distribution, and strong specificity. The genetic diversity of candidate markers was analysed and further evaluated using phylogenetic trees, population structure, and principal component analysis to construct a 2D barcode fingerprint map for each Berberis L., with a prediction accuracy of 100% (Figure 5).

4. Discussion

4.1. Optimisation of Molecular Markers Based on SLAF-Seq and SNPs

SNP molecular markers—as an efficient and universally applicable technical tool with a richer number of polymorphisms, higher accuracy, and greater stability than second-generation sequencing—have been widely used for SNP mining in a variety of plants [29,30,31,32]. Xia et al. [29] used the SLAF-seq technique to amplify the genes of 158 Rosa chinensis samples and screened 1,816,980 SNP markers, which successfully classified the 158 individuals into two major taxa and revealed their population structure, proving that SNP markers can be used for species identification, genetic diversity analysis, and population structure studies. Zhou et al. [30] obtained 201,817 SNPs with high consistency in the Brassica napus population based on SLAF-seq technology, which comprehensively revealed the genetic diversity, population structure, and linkage disequilibrium pattern of this population, and laid the foundation for genetic analysis of important agronomic traits in this rapeseed population. In this study, 409,851 SLAF tags and 207,786 SNP markers were obtained by the SLAF-seq technique. In addition, the genetic diversity index is an important indicator to quantify the degree of genetic variation within a population or species, and a large value of the genetic diversity index implies that there is a large amount of genetic variation within the population. The genetic diversity indices of the Berberis L. obtained using SLAF-seq in this study (He = 0.232, PIC = 0.232) were higher than the results of RAPD markers and ISSR markers of other Berberis L. in Central Asia (He = 0.226 [18], PIC = 0.120 [19]). Therefore, SLAF-seq can effectively reveal the genetic diversity of Berberis L. in Xinjiang, China.

4.2. Phylogenetic Analysis Based on SNPs

The maintenance of and change in genetic diversity are driven by multiple factors such as reproductive mechanisms, genetic mutations, natural selection, and population isolation. However, the impact of environmental changes and human interference as external driving forces is particularly complex and far-reaching. Meng et al. [33] used SLAF-seq to study 147 Glycine soja samples collected from China, Korea, and Japan. In the study, neighbour-joining trees were constructed by phylogenetic analysis was performed to comprehensively analyse the genetic relationships of G. soja germplasm resources from different regions. On this basis, the genetic diversity of G. soja germplasm resources in different regions was analysed. The results showed that the germplasm resources from the Yangtze River, the Korean peninsula, and northeast China were closely related. Nilkanta et al. [34] assessed the population genetic structure of Melocanna humilis Kurz using the ISSR molecular marker, divided 93 individuals into three clusters, and there was significant mixed clustering of individuals from different regions. Our SNP marker-based genetic structure analysis, principal component analysis, and genetic diversity index combined showed that Berberis L. from Xinjiang exhibited rich genetic differentiation and diversity. Phylogenetic tree analyses further revealed that Berberis L. were not clustered together strictly according to their geographical distribution, especially B. nummularia Bunge from Tekes, Luntai, and Wensu which clustered together, and B. hetropoda Schrenk from Aheqi and Xinyuan which clustered together. Since species expansion usually follows a cost minimisation path, it tends to spread along rivers, valleys, and other low-resistance terrains [35,36]. However, the complex and diverse topography of Xinjiang has resulted in a relatively limited natural dispersal capacity of Berberis L. We hypothesise that human activities spread the Berberis L. of the Xinyuan-Gongliu group along the ancient Silk Road to the regions of Luntai, Wensu, and Ahachi [37].

4.3. Construction and Evaluation of Core Collection Based on SNPs

Construction of the core collection is designed to maximise the genetic diversity of the entire germplasm resource with minimal resource input and genetic redundancy. It is crucial to select an appropriate sampling strategy and appropriate sampling rate to construct a reasonable core collection [38], and a constructed core collection has a basic sampling rate of 5–30%, usually around 15%. Sun et al. [39] identified 59 core collections from 212 Siberian apricot samples using SSR and a sampling proportion of 25%, which can effectively represent the genetic diversity of all germplasm. Tian et al. [17] constructed a core collection bank of 195 H. brasiliensis (Willd. ex A. Juss.) Müll. Arg. using SNP, five different sampling ratios, and cluster analysis, and determined that the optimal preservation ratio was 10%, which effectively preserved the germplasms. In this study, 45 core collections were successfully screened based on the combined assessment of weighted index (weight 0.7) and genetic diversity index (weight 0.3), with a sampling ratio of 30%.
To verify the representativeness and diversity of the core collection, a comprehensive assessment was conducted in this study using a variety of methods, such as genetic diversity parameters, t-test, and PCoA. The results showed that the genetic diversity parameters of the core collection, including Ho, He, H, I, and PIC retention rate, all exceeded 100%. The t-test results showed that there was no significant difference in the genetic diversity parameters between the core collection and the initial collection and the reserved collection, indicating that the sampling strategy and selection method of this study were scientific and effective. The results of the principal coordinate analysis also showed that the core collection showed a uniform geometric distribution in the initial collection, further verifying the rationality and effectiveness of the selection results. The results of this study are consistent with previous assessments of genetic diversity parameters, t-test, and principal coordinate analysis of plants such as Phoebe zhennan S. K. Lee and F. N. Wei [40] and Glycyrrhiza uralensis Fisch. [41]. Therefore, the core collection we constructed was equally well represented.

5. Conclusions

In this study, the genetic diversity analysis of 150 Xinjiang Berberis L. was carried out using SLAF-seq, and 207,786 SNP markers were obtained, and 36,353 polymorphic SNP markers were screened out. These markers have important application value in the analysis of population structure, core collection screening, and DNA fingerprint mapping of Berberis L. populations in Xinjiang, China. The research clarified and constructed 45 core collections of wild Berberis L., whose genetic diversity can better represent the 150 original germplasms. The results of this study provide a theoretical basis and practical guidance for the efficient identification of Berberis L., mining of superior genes, and germplasm creation and breeding of new varieties.

Supplementary Materials

The following supporting information can be downloaded at: https://www.mdpi.com/article/10.3390/horticulturae11040434/s1, Table S1 Information table on wild berberis germplasm sampling in the Tianshan Mountains of Xinjiang. Table S2 Simplified sequencing of SLAF and SNP information statistics for Berberis in Xinjiang. Table S3 Genetic coverage of core germplasm of 150 samples of Berberis species in Xinjiang. Table S4 Genetic diversity assessment of 150 Berberis in Xinjiang based on polymorphic SNP markers.

Author Contributions

Conceptualization, L.Z. and R.L.; methodology, Y.S.; formal analysis, R.L., Z.W. and M.A.; investigation, X.Y.; writing—original draft preparation, R.L.; writing—review and editing, L.Z. All authors have read and agreed to the published version of the manuscript.

Funding

The project was funded by the Forestry and Grassland Science and Technology of the Autonomous Region (XJLCKJ-2025-09).

Data Availability Statement

The raw sequence data reported in this paper have been uploaded to the China National Centre for Bioinformation Genome Sequence Archive (CNCB-GSA) database with the accession number CRA022301.

Conflicts of Interest

The authors declare no conflicts of interest.

References

  1. Sarraf, M.; Babaei, A.B.; Naji-Tabasi, S. Investigating functional properties of barberry species an overview. J. Sci. Food Agric. 2019, 99, 5255–5269. [Google Scholar] [CrossRef]
  2. Azim, R.; Awan, S.I.; Tahir, M.M.; Malik, F.A.; Alwahibi, M.S.; Ali, M.A.; Elshiki, M.S.; Kamal, A. Morphological and phylogenetic insights into Berberis species: A tool for species identification and conservation. Genet. Resour. Crop Evol. 2024, 72, 4569–4582. [Google Scholar] [CrossRef]
  3. Goodarzi, S.; Khadivi, A.; Abbasifar, A.; Akramian, M. Phenotypic, pomological and chemical variations of the seedless barberry (Berberis vulgaris L. var. asperma). Sci. Hortic. 2018, 238, 38–50. [Google Scholar] [CrossRef]
  4. Ying, J.S.; Editorial Board for Flora of China. Flora of China (Revised English Version); Ying, J.S., Ed.; Science Press: Beijing, China, 2011; Volume 19, pp. 715–771. [Google Scholar]
  5. Li, Y.-K.; Harber, J.; Peng, C.; Du, Z.-Q.; Xing, Y.-W.; Yu, C.-C. Taxonomic synopsis of Berberis (Berberidaceae) from the northern Hengduan mountains region in China, with descriptions of seven new species. Plant Divers. 2022, 44, 505–517. [Google Scholar] [CrossRef] [PubMed]
  6. Mao, Z.M.; An, Z.X.; Zhou, G.L.; Yang, C.Y.; Han, Y.L.; Li, X.Y.; Zhang, Y.F. Flora of Xinjiang, Book II; Xinjiang Science &Technology &Hygiene Publishing House: Urumqi, China, 1996; Volume 2, pp. 1–4. [Google Scholar]
  7. Zhang, X.M. Kuwanisi Pazilijiang hplc determination of berberine in Berberis L. leaf of Vitamin Botrytis cinerea. Cap. Food Med. 2012, 19, 50. [Google Scholar]
  8. Safari-Khuzani, A.; Rezaei, M.; Khadivi, A. Screening of the superior f1 segregating populations of barberry (Berberis L. spp.) for cultivation based on phenotypic characterizations. Ind. Crops Prod. 2020, 158, 113054. [Google Scholar] [CrossRef]
  9. Imenshahidi, M.; Hosseinzadeh, H. Berberine and barberry (Berberis L. vulgaris) a clinical review. Phytother. Res. 2019, 33, 504–523. [Google Scholar] [CrossRef]
  10. Yang, L.; Zhang, Z.; Hu, X.; You, L.; Khan, R.A.A.; Yu, Y. Phenolic contents, organic acids, and the antioxidant and bio activity of wild medicinal Berberis plants as sustainable sources of functional food. Molecules 2022, 27, 2497. [Google Scholar] [CrossRef]
  11. Khan, T.; Khan, I.A.; Rehman, A.; Ahmed, N. Conservation status evaluation of berberis species across the Karakoram Mountain Ranges, Pakistan using iucn red list categories and criteria. J. For. Res. 2016, 6, 172–177. [Google Scholar] [CrossRef]
  12. Huan, J.; He, Z.; Lei, Y.; Li, W.; Jiang, L.; Luo, X. The genetic diversity of Bletilla spp. Based on SLAF-seq and oligo-FISH. Genes 2022, 13, 1118. [Google Scholar] [CrossRef]
  13. Sun, X.; Liu, D.; Zhang, X.; Li, W.; Liu, H.; Hong, W.; Jiang, C.; Guan, N.; Ma, C.; Zeng, H.; et al. Slaf-seq: An efficient method of large-scale de novo SNP discovery and genotyping using high-throughput sequencing. PLoS ONE 2013, 8, e58700. [Google Scholar] [CrossRef]
  14. Wu, W.; Shao, M.; Qi, J.; Jin, G.; Zhang, R.; Yao, Y.; Jiang, C. Integrating genetic analysis of germplasm wealth for enhanced selection and improvement in olive (Olea europaea L.): Insights from leaves. Plant Cell Rep. 2024, 43, 247. [Google Scholar] [CrossRef]
  15. Yang, J.; Sun, M.; Ren, X.; Li, P.; Hui, J.; Zhang, J.; Lin, G. Revealing the genetic diversity and population structure of garlic resource cultivars and screening of core cultivars based on specific length amplified fragment sequencing (SLAF-seq). Genes 2024, 15, 1135. [Google Scholar] [CrossRef] [PubMed]
  16. Liu, G.; Li, Y.; Sun, X.; Guo, X.; Jiang, N.; Fang, Y.; Chen, J.; Bao, Z.; Ma, F. Association study of SNP locus for color related traits in herbaceous peony (Paeonia lactiflora Pall.) Using slaf-seq. Front. Plant Sci. 2022, 13, 1032449. [Google Scholar] [CrossRef]
  17. Tian, M.; Li, W.; Luo, P.; He, J.; Zhang, H.; Yan, Q.; Ye, Y. Genetic diversity analysis and core germplasm bank construction in cold resistant germplasm of rubber trees (Hevea brasiliensis). Sci. Rep. 2024, 14, 14533. [Google Scholar] [CrossRef] [PubMed]
  18. Akishev, Z.D.; Smekenov, I.T.; Usenova, A.N.; Duisenova, A.B.; Smailov, B.B.; Mukhidinov, N.M.; Bissenbaev, A.K. RAPD analysis of genetic diversity in Berberis L. iliensis a species endemic to Kazakhstan. Int. J. Biol. Chem. 2012, 3, 48–53. [Google Scholar]
  19. Pinar, H.; Yahya, H.N.; Erċışlı, S.; Coskun, O.F.; Yaman, M.; Turgunbaev, K.; Uzun, A. Molecular characterization of barberry genotypes from Turkey and Kyrgyzstan. Erwerbs-Obstbau 2021, 63, 403–407. [Google Scholar] [CrossRef]
  20. Li, H.; Abdullah, H.; Yang, H.; Guo, H.; Yuan, Y.; Ahmed, I.; Li, G.; Wang, Y.; Chang, Y.; Tian, X. Chloroplast genome evolution of Berberis L. (Berberidaceae): Implications for phylogeny and metabarcoding. Gene 2025, 933, 148959. [Google Scholar] [CrossRef]
  21. Chen, Z.; He, Y.; Iqbal, Y.; Shi, Y.; Huang, H.; Yi, Z. Investigation of genetic relationships within three miscanthus species using SNP markers identified with SLAF-seq. BMC Genomics 2022, 23, 43. [Google Scholar] [CrossRef]
  22. Xia, Y.; Xu, J.; Duan, J.; Liu, Q.; Huang, H.; Yi, Z.; Chen, Z. Transgenic Miscanthus lutarioriparius that co-expresses Cry 2Aa# and Bar genes. Can. J. Plant Sci. 2019, 99, 841–851. [Google Scholar]
  23. Kozich, J.J.; Westcott, S.L.; Baxter, N.T.; Highlander, S.K.; Schloss, P.D. Development of a dual-index sequencing strategy and curation pipeline for analyzing amplicon sequence data on the MiSeqIllumina sequencing platform. Appl. Environ. Microbiol. 2013, 79, 5112–5120. [Google Scholar] [CrossRef] [PubMed]
  24. Mendel, J.M.; Korjani, M.M. On establishing nonlinear combinations of variables from small to big data for use in later processing. Inf. Sci. 2014, 280, 98–110. [Google Scholar] [CrossRef]
  25. Li, H.; Durbin, R. Fast and accurate short read alignment with burrows–Wheeler transform. Bioinformatics 2010, 14, 1754–1760. [Google Scholar] [CrossRef] [PubMed]
  26. Li, H.; Handsaker, B.; Wysoker, A.; Fennell, T.; Ruan, J.; Homer, N. The sequence alignmentmap format and SAMtools. Bioinformatics 2009, 25, 2078–2079. [Google Scholar] [CrossRef]
  27. Kumar, S.; Stecher, G.; Li, M.; Knyaz, C.; Tamura, K. Mega x: Molecular evolutionary genetics analysis across computing platforms. Mol. Biol. Evol. 2018, 35, 1547–1549. [Google Scholar] [CrossRef] [PubMed]
  28. Alexander, D.H.; Novembre, J.; Lange, K. Fast model-based estimation of ancestry in unrelated individuals. Genome Res. 2009, 19, 1655–1664. [Google Scholar] [CrossRef]
  29. Xia, A.-N.; Yang, A.-A.; Meng, X.-S.; Dong, G.-Z.; Tang, X.-J.; Lei, S.-M.; Liu, Y.-G. Development and application of rose (Rosa chinensis jacq.) SNP markers based on slaf-seq technology. Genet. Resour. Crop Evol. 2021, 69, 173–182. [Google Scholar] [CrossRef]
  30. Zhou, Q.; Zhou, C.; Zheng, W.; Mason, A.S.; Fan, S.; Wu, C.; Fu, D.; Huang, Y. Genome-wide snp markers based on slaf-seq uncover breeding traces in rapeseed (Brassica napus L.). Front. Plant Sci. 2017, 8, 648. [Google Scholar] [CrossRef]
  31. Wei, Q.; Wang, W.; Hu, T.; Hu, H.; Wang, J.; Bao, C. Construction of a SNP-based genetic map using SLAF-seq and QTL analysis of morphological traits in eggplant. Front. Genet. 2020, 11, 178. [Google Scholar] [CrossRef]
  32. Wang, R.J.; Gao, X.F.; Yang, J.; Kong, X.R. Genome-wide association study to identify favorable SNP allelic variations and candidate genes that control the timing of spring bud flush of tea (Camellia sinensis) using SLAF-seq. J. Agric. Food Chem. 2019, 67, 10380–10391. [Google Scholar] [CrossRef]
  33. Meng, J.; Yang, G.; Li, X.; Zhao, Y.; He, S. Population structure of wild soybean (Glycine soja) based on slaf-seq have implications for its conservation. PeerJ 2023, 11, e16415. [Google Scholar] [CrossRef] [PubMed]
  34. Nilkanta, H.; Amom, T.; Tikendra, L.; Rahaman, H.; Nongdam, P. ISSR marker based population genetic study of Melocanna baccifera (Roxb.) Kurz: A commercially important bamboo of manipur, north-east india. Scientifica 2017, 2017, 3757238. [Google Scholar] [CrossRef] [PubMed]
  35. Lu, Y.; Zhang, C.; Li, X.; Liang, Y.; Wang, Y.; Li, W. Development of EST-SSR markers and their application in the analysis of the genetic diversity of Sophora japonica linn. Trees Struct. Funct. 2020, 34, 1147–1156. [Google Scholar] [CrossRef]
  36. Li, X.; Wang, X.; Zhang, D.; Huang, J.; Shi, W.; Wang, J. Historical spread routes of wild walnuts in central asia shaped by man-made and nature. Front. Plant Sci. 2024, 15, 12. [Google Scholar] [CrossRef]
  37. Boulnois, L. Silk Road: Monks, Warriors and Merchants on the Silk Road; W. W. Norton & Co. Inc.: New York, NY, USA, 2004; pp. 178–181. [Google Scholar]
  38. Pengliang, W.; Jiexia, S.; Hongying, W.; Chen, Y.; Xie, Y.; Wang, H.; He, G.; Chen, N.; Wei, C.; Yang, L.; et al. Analysis of germplasm genetic diversity and construction of a core collection in Camellia oleifera C.Abel by integrating novel simple sequence repeat markers. Genet. Resour. Crop Evol. 2023, 70, 1517–1530. [Google Scholar]
  39. Sun, Y.; Zhang, Y.; Chen, J.; Liu, R.; Wang, S.; Dong, S. Comparison of selection methods to establish a core collection of the Siberian apricot using trait and SSR data. Tree Genet. Genomes 2024, 20, 40. [Google Scholar] [CrossRef]
  40. Zhu, Y.; An, W.; Peng, J.; Li, J.; Gu, Y.; Jiang, B.; Chen, L.; Zhu, P.; Yang, H. Genetic diversity of nanmu (Phoebe zhennans. Lee. Et f. N. Wei) breeding population and extraction of core collection using nSSR, cpSSR and phenotypic markers. Forests 2022, 13, 1320. [Google Scholar] [CrossRef]
  41. Liu, Y.; Geng, Y.; Xie, X.; Zhang, P.; Hou, J.; Wang, W. Core collection construction and evaluation of the genetic structure of Glycyrrhiza in China using markers for genomic simple sequence repeats. Genet. Resour. Crop Evol. 2020, 67, 1839–1852. [Google Scholar] [CrossRef]
Figure 1. The distribution of sampling sites and main species of Berberis L. in Xinjiang. (a) Distribution of sampling sites and populations of Berberis L. in Xinjiang; (b) Morphological characteristics of leaves and fruits of the three major Berberis L. in Xinjiang.
Horticulturae 11 00434 g001
Figure 2. The phylogenetic tree of Berberis L. based on the neighbour-joining method in Xinjiang. The purple, green, and blue indicate group I, group II, and group III, respectively.
Horticulturae 11 00434 g002
Figure 3. Population structure and PCoA of 150 accessions of Berberis L. in Xinjiang. (a) Cross-validation error rate of each k = 5 value of admixture. Blue, purple, red, green, yellow indicate group I, group II, group III, group IV, and group V of Berberis L., respectively; (b) cross-validation error rate of each k (k = 1–10) value of admixture; (c) PCoA. Blue, green, red, yellow, and purple indicate group I, group II, group III, group IV, and group V of Berberis L., respectively.
Horticulturae 11 00434 g003
Figure 4. The principal coordinate analysis of the initial collection and core collection of Berberis L. in Xinjiang.
Horticulturae 11 00434 g004
Figure 5. DNA fingerprinting of Berberis L. in Xinjiang. The yellow, green, blue, and purple represent C/C, A/A, T/T, and G/G, respectively, with missing data shown in grey and heterozygous sites shown in white.
Horticulturae 11 00434 g005
Disclaimer/Publisher’s Note: The statements, opinions and data contained in all publications are solely those of the individual author(s) and contributor(s) and not of MDPI and/or the editor(s). MDPI and/or the editor(s) disclaim responsibility for any injury to people or property resulting from any ideas, methods, instructions or products referred to in the content.

