Abstract
Paulownia fortunei are economically important trees in China. A greening mutant was used to study greening by comparative transcriptomics and proteomics using leaf tissues from wild-type and greening mutant growing under normal conditions. Chlorophyll content analysis showed a decrease in the chlorophyll b content in the mutant line. Non-parametric transcriptome and proteome analyses were performed to screen for genes and proteins active in the regulation of P. fortunei greening. qRT-PCR was carried out to confirm 10 genes identified in the transcriptome. In the transcriptome analysis, the pathways associated with the yellow phenotype included tRNA amino acid biosynthesis, nitrogen metabolism and circadian rhythm as represented by the genes encoding Vals, gltx, aspS, NR, GluL, gdhA, phyB, CSNK2A and CSNK2B. The iTRAQ-based proteomics analysis indicated that photosynthesis and carotenoid biosynthesis were altered in the chlorophyll-deficient P. fortunei and petH, petF, atpF and Z-ISO were the key proteins dysregulated in the greening mutants compared to the wild-type. Together, the transcriptomic and iTRAQ analyses identified 10 DEGs that were perturbed in the greening mutants in the main pathways of photosynthesis, starch and sucrose metabolism, glutathione metabolism and peroxisome functions. PetJ, E3.2.1.21, GST and CAT were differentially regulated in the chlorophyll-deficient mutant.
1. Introduction
Paulownia fortunei, of the Paulowniaceae family, is an important fast-growing timber species in China. Wild-type plants exhibit green leaves, with advantages including rapid growth and high-quality wood, making them widely used in furniture manufacturing and ecological afforestation [1]. Recently, a naturally occurring mutant with yellow early in its growth was identified. The mutant produces broad, ovate leaves yellow-green in color, hairy and shiny on the top side, with stellate hairs on the underside. The petiole is light red on the top and yellow to light green on the underside. Each leaf starts out as yellow-green but gradually turns green. The tree continues to produce new leaves and shoots that are yellow-green in color throughout the growth cycle [2]. The mutant phenotypes are stably inherited. The plant has elevated antioxidant enzyme activity and increased resistance to . The physiological and molecular causes of the yellowing in the mutant are unclear [2].
Leaf coloration mutants have been identified in several plant species, such as wheat (Triticum aestivum L.) [3], Arabidopsis thaliana [4], rice (Oryza sativa) [5] and soybean (Glycine max) [6]. Chlorophyll-deficient mutants have been used to study chlorophyll metabolism, chloroplast morphology and development, photosynthesis and the physiology of chlorophyll mutants [7]. While some genes have been cloned from chlorophyll-related mutants in certain higher plants, there is limited information on greening mutant genes and protein profiles, especially in non-model crops. A two-dimensional gel electrophoresis analysis of the proteins of a chlorophyll mutant (W02S) and the wild-type rice seedlings revealed 44 differentially expressed proteins (DEPs), including an enolase, a chloroplast 29-kDa ribonucleoprotein and a proteasome alpha subunit, which was significantly expressed in the greening mutant [8]. In the leaves of a chlorophyll-deficient rape mutant, iTRAQ (Isobaric tag for relative and absolute quantitation) proteomic analysis showed that the levels of 443 proteins were significantly different from the WT, mainly in the pathways involved in photosynthesis, porphyrin and chlorophyll metabolism, biosynthesis of secondary metabolites, carbon fixation and RNA degradation [9]. In chlorotic tea (Camellia sinensis), a proteomics study identified 19 DEPs with the roles in chlorosis, including inhibition of those involved in carbohydrate synthesis, transport and flavonoid metabolism 4-coumarate-CoA ligase (4CL) and increases in Mg chelatase and chlorophyll b reductase, which promote chlorophyll b accumulation as a response to the weakened carbon metabolism during chlorosis [10]. In Camellia chekiangoleosa, the incomplete structure of chloroplast-like vesicles, the decrease in blue-green chlorophyll a and the increase in yellow-green chlorophyll b are the direct causes of yellowing leaf formation [11]. In the leaves of the Acer pseudosieboldianum mutant, 20 structural genes involved in anthocyanin biosynthesis, 12 transcription factors and 8 genes related to anthocyanin transport were identified as participants in the leaf-coloring process, revealing a complex metabolic network in the mutant leaves [12].
However, current research has mainly focused on model crops and economically important crops, with limited studies on the molecular mechanisms of leaf color mutants in woody plants, especially in Paulownia. In this study, we used the yellow leaf mutant (wild-type) of P. fortunei as material, combined with transcriptomic and proteomic analyses, aiming to identify key genes and proteins that may regulate the greening process in P. fortunei, and to provide a theoretical basis for further elucidating the molecular mechanisms underlying this mutant phenotype.
2. Materials and Methods
2.1. Plant Materials
The yellow leaf mutant (wild-type, WT) of P. fortunei and a stable line characterized by green leaves were collected from street trees on Jiangshan Road, Zhengzhou, Henan, China. The green mutant (MT) was observed for 4 consecutive years and stably produced yellow-green young leaves. Green leaves of normal plants (WT) and yellow leaves of greening MT were collected from the same location, flash-frozen in liquid nitrogen and stored at −80 °C. Each material was randomly sampled three times.
2.2. Chlorophyll Content Measurements
The chlorophyll content of WT and greening MT leaves were measured in three biological replicates and three technical replicates according to Lichtenthaler [13]. Chlorophyll was extracted from 100 mg leaf samples of WT and greening MT using 80% acetone (v/v). The extracts were spectrophotometrically (Shanghai Youke Instrument and Meter Co., Shanghai, China) analyzed at 645 and 663 nm. Student’s t-test was used to compare the chlorophyll contents in the WT and MT.
2.3. Transcriptome Sequencing and Identification of Differentially Expressed Genes (DEGs)
Three leaf samples were randomly selected from the WT and the greening MT, with three technical replicates set. Total RNA was extracted from the leaf tissues using TRizol Universal according to the manufacturer’s protocol (Tiangen, Beijing, China). Total RNA from the WT and greening MT leaves was analyzed for purity, concentration and integrity using a Nanodrop, Qubit 2.0 and Agilent 2100 (Agilent technologies, Santa Clara, CA, USA). The cDNA library was subjected to RNA-Seq analysis sequencing using an Illumina HiSeq4000 high throughput sequencing platform (Emeryville, CA, USA) by Huada Technology Service Co., Ltd., Shenzhen, China. DEGs between different samples were determined at FDR ≤ 0.001 and |log2Ratio (Fold Change)| ≥ 2 to judge the significance of differential gene expression [14].
2.4. Extraction and Detection of Proteins and Identification of DEPs
Plant proteins were extracted from the frozen leaf samples using TCA/acetone and SDT cleavage [15]. The protein concentration of the extracted samples was determined by Coomassie Brilliant Blue method and sodium dodecyl sulfate-polyacrylamide gel electrophoresis (SDS-PAGE). The obtained protein samples were stored at 80 °C. The iTRAQ test was completed by Shanghai Zhongke New Life Science Research Institute, Shanghai, China. Each material was randomly sampled three times.
2.5. Data Analysis
Protein databases were predicted by the transcriptome data, and protein identification was performed using Mascot 2.2 (Matrix Science, Shanghai, China) and Proteome Discoverer 1.4 (Thermo Scientific, Shanghai, China). A protein was considered differentially expressed when its protein abundance differed by >1.2 or <0.83 (average of all alignment group ratios) at a p value < 0.05 (t-test for all alignment groups).
Association analysis was carried out for all quantifiable data at the proteome and transcriptome levels. Spearman was used to determine the correlation between protein and mRNA expression levels [16]. According to the corresponding difference multiple, the correlation results were divided into three categories: the same trend, the opposite trend and association but no difference.
The DEGs/DEPs were compared using BLAST version 1.4.0 with the annotated heterologous genes in the Nr database (ftp://ftp.ncbi.nlm.nih.gov/blast/db, accessed on 24 September 2022) [17], Nt database (ftp://ftp.ncbi.nlm.nih.gov/blast/db, accessed on 25 September 2022), Swiss-Prot (https://ngdc.cncb.ac.cn/databasecommons/database/id/5614, accessed on 25 September 2022), Interpro (http://www.ebi.ac.uk/interpro, accessed on 25 September 2022) and COG database (http://www.ncbi.nlm.nih.gov/COG, accessed on 25 September 2022) [18]. The DEGs/DEPs were further annotated and classified against the GO database (http://geneontology.org, accessed on 26 September 2022) using Blast2GO Basic 6.0 [19] and KEGG (http://www.genome.jp/kegg, accessed on 26 September 2022) [20]. Fisher’s exact test was used to compare the distribution of individual GO classifications or KEGG pathways in the target protein pool and the overall protein pool. Enrichment analysis of the GO annotations or KEGG pathway annotations was carried out for target unigenes or proteins. Collection slant proteins were extracted from the frozen leaf samples using TCA/acetone and SDT cleavage [15]. The obtained protein samples were stored at 80 °C. The iTRAQ test was completed by Shanghai Zhongke New Life Science Research Institute, Shanghai, China. Analysis of the association between transcriptome and proteome data was performed in R version 4.2.1.
2.6. qRT-PCR Analysis
Ten genes were randomly selected for qRT-PCR validation. The total RNA samples of the WT and greening MT samples used for RNA-Seq analysis were also used for qRT-PCR validation. Reactions of 20 μL total volume contained 1 μL diluted cDNA template, 1 μL forward and reverse primers (10 μmolL−1), 10 µL SYBR Premix Ex Taq II solution and 8 μL ddH2O. The qRT-PCR reaction conditions for amplification were as follows: 5 min denaturation at 95 °C followed by 40 cycles of 95 °C for 3 min, 60 °C for 30 s and 72 °C for 30 s. Each experiment was repeated three times with three biological replicates. Fluorescence quantitative PCR amplification was performed in an ABI StepOne Plus type real-time PCR machine using SYBR Green Supermix (Boi-Rad, Hercules, CA, USA) on a LightCycler®® 96 Real-Time PCR System (ABI®® 7500). Triplicate quantitative assays were performed on each cDNA sample, and the 18S rRNA reference gene was used as an internal control. Transcript levels were calculated relative to the level of 18S rRNA using the 2−∆∆ct method [21].
3. Results
3.1. Physiological Characteristics of P. fortunei Mutant Deficient in Greening
Under normal growth conditions, the leaf color of the mutant plant changed as the leaves aged. The newly emerged leaves of the mutant plant are yellow, and as the plant grows, the leaf color gradually changes from yellow to yellow-green (Figure 1A left and Figure 1B). The leaves of the WT plants are all green (Figure 1A right and Figure 1C). Chlorophyll a, chlorophyll b, carotenoid, chlorophyll a/b and total chlorophyll were measured. An asterisk indicates a significant difference (p < 0.05) between the greening mutant and the wild type of P. fortunei (Figure 1D).
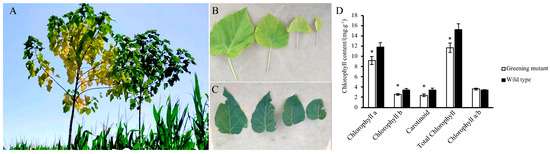
Figure 1.
(A–C) P. fortunei leaf color in greening mutant and WT. (A Left) and (B), the greening mutant. (A Right) and (C), the WT. (D) The total chlorophyll content was measured in the greening mutant (open) and the wild-type (solid) P. fortunei. An asterisk indicates a significant difference (p < 0.05) between the greening mutant and the wild type of P. fortunei.
3.2. Transcriptome Sequencing Analysis
A total of 18.15 Gb data were obtained by transcriptome sequencing of leaves from the WT and the greening mutant of P. fortunei. After assembly and redundancy filtering, 81,610 unigenes were obtained with a total length of 101,727,851 bp, an average length of 1246 bp, an N50 of 2014 bp, and a GC content of 41.27%. These data show that the sequencing is of fairly high quality and can be used for de novo assembly and annotation.
3.3. DEG Analysis and Functional Annotation
The FPKM method was used to screen the expression levels of the unigenes (differential expression at ≥2.00, FDR ≤ 0.001). A total of 1664 DEGs were identified, accounting for 49.0% of the total number of unigenes. Among them, 817 genes were up-regulated, accounting for 49.1% of the total DEGs, and 847 genes were down-regulated, accounting for 50.9% of the total DEGs. Using BLAST analysis, 81,610 unigenes and 1664 DEGs were compared with the Nr, Nt, Swiss-Prot, GO, COG, Interpro and KEGG public databases. A total of 62,575 unigenes were annotated, accounting for 76.7% of the total unigenes. A total of 1524 of the DEGs were annotated, accounting for 91.6% of the total DEGs. The rates of annotation of the unigenes and DEGs in each database are shown in Table 1.

Table 1.
Summary of functional annotation of unigenes and DEGs between the WT and the greening mutant of P. fortunei.
3.4. GO Functional Analysis of DEGs
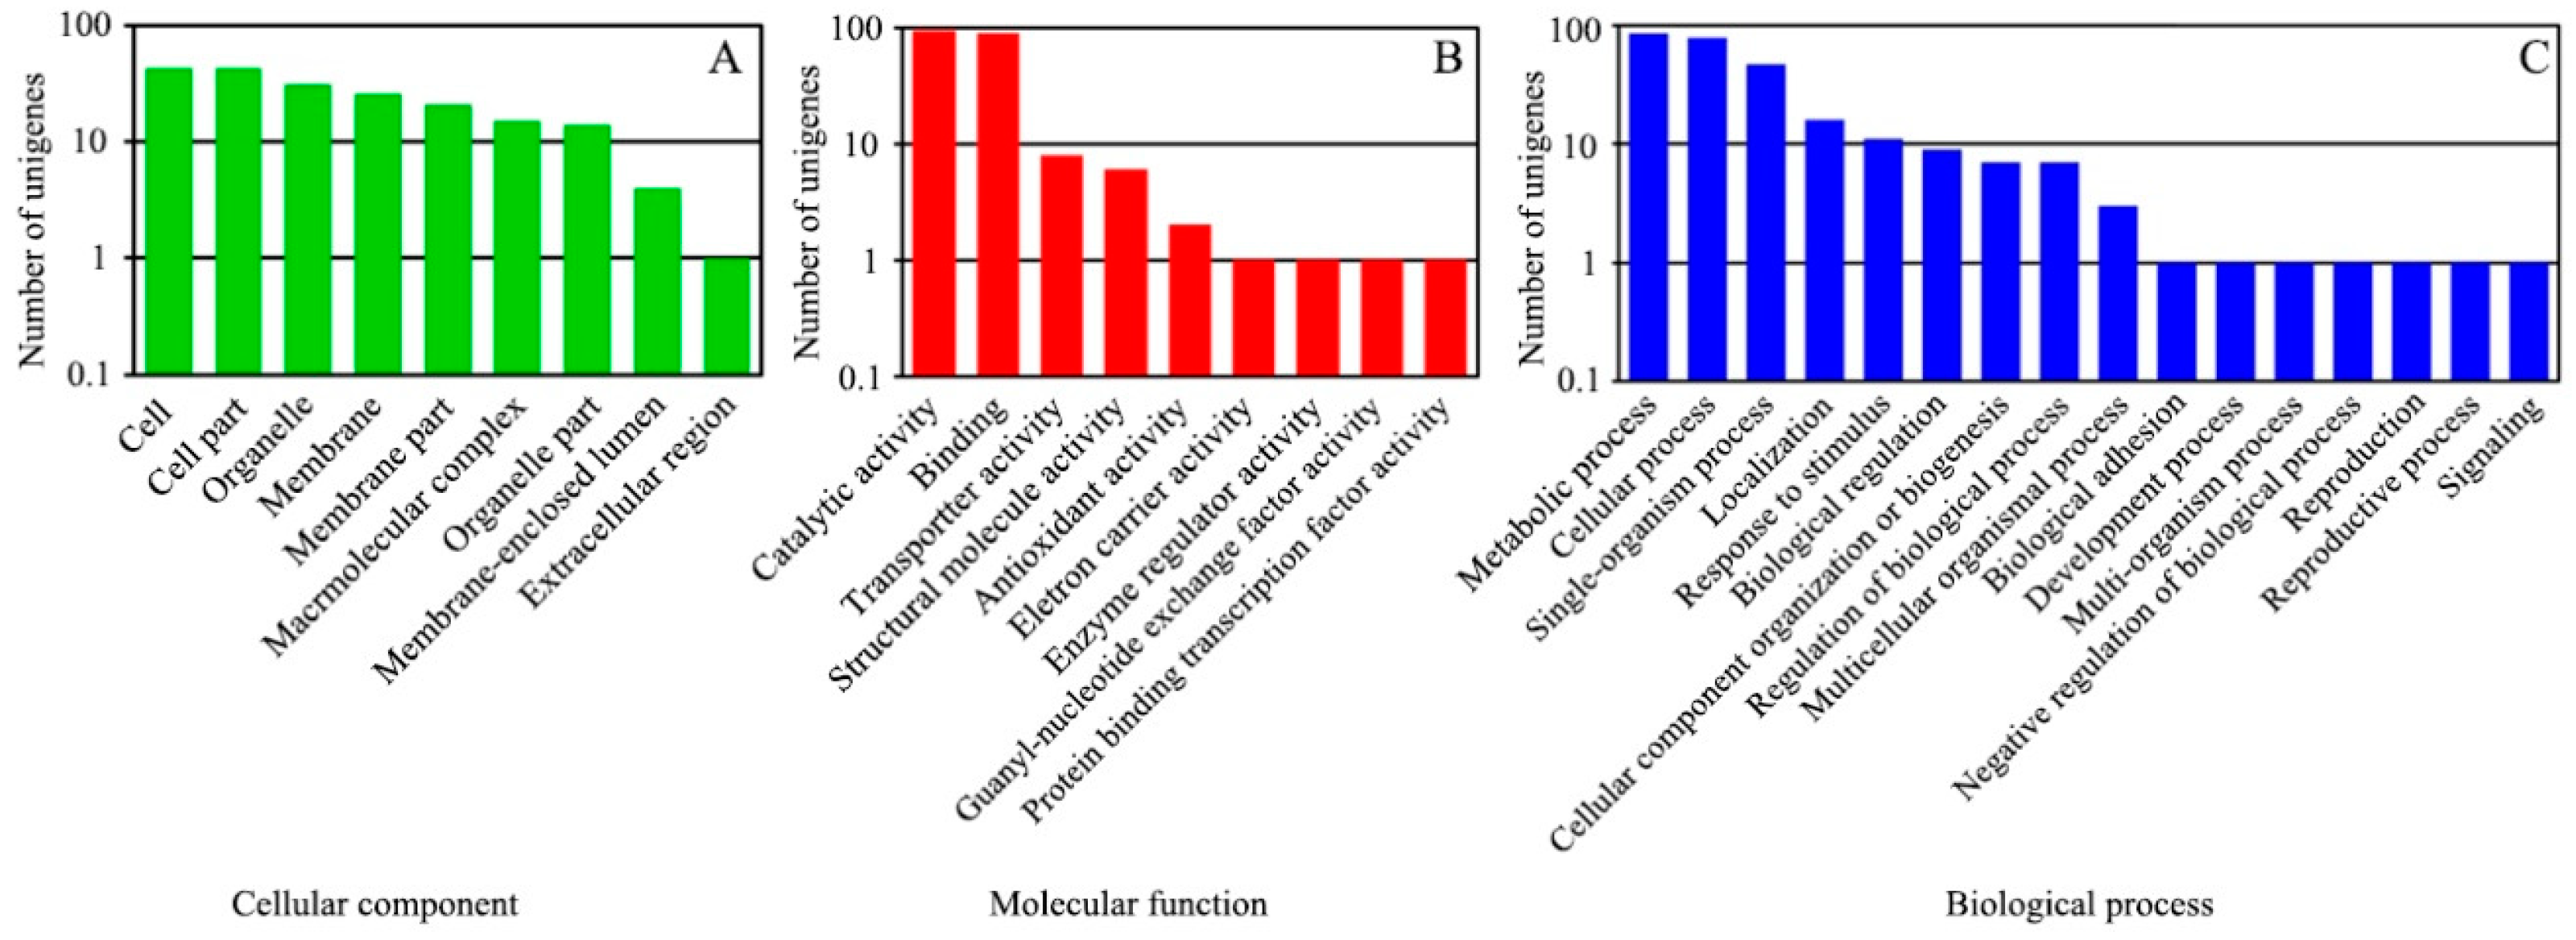
The Blast2GO software was used to perform GO classification and functional annotation on the 1664 DEGs. The results were divided into three major categories, cell components, molecular functions and biological processes, in 34 subclasses (Figure 2).

Figure 2.
GO classification of DEGs. The DEGs between the WT and the greening mutant of P. fortunei belonged to three major categories: (A) cell components, (B) molecular functions, (C) biological processes.
Among these DEGs, 148 obtained GO functional annotation. Sixty-one of the DEGs (41.2%) were classified into nine categories in the cellular component category; 134 (90.5%) were classified into nine categories in the molecular functions category and 11 (75.5%) were classified into sixteen categories in the biological processes category. In the cellular component category, cell part and cell accounted for the largest proportion (70.5% and 70.5%, respectively), followed by organelles (50.8%), and membrane-enclosed lumen and the extracellular region (Figure 2A). In the molecular functions category, catalytic activity and binding accounted for the largest proportion (69.4% and 66.2%, respectively), followed by transporter activity (6.0%) and structural molecule activity (4.5%), with a few genes falling into the enzyme regulator activity, electron carrier activity, protein binding transcription factor activity and guanyl-nucleotide exchange factor activity subclasses (Figure 2B). In the biological processes category, metabolic process, cellular process, single organism process and localization accounted for the largest proportions (78.2%, 70.9%, 42.7% and 70.5%, respectively), followed by signaling, developmental process and biological adhesion subcategories (Figure 2C).
3.5. KEGG Functional Annotation of DEGs
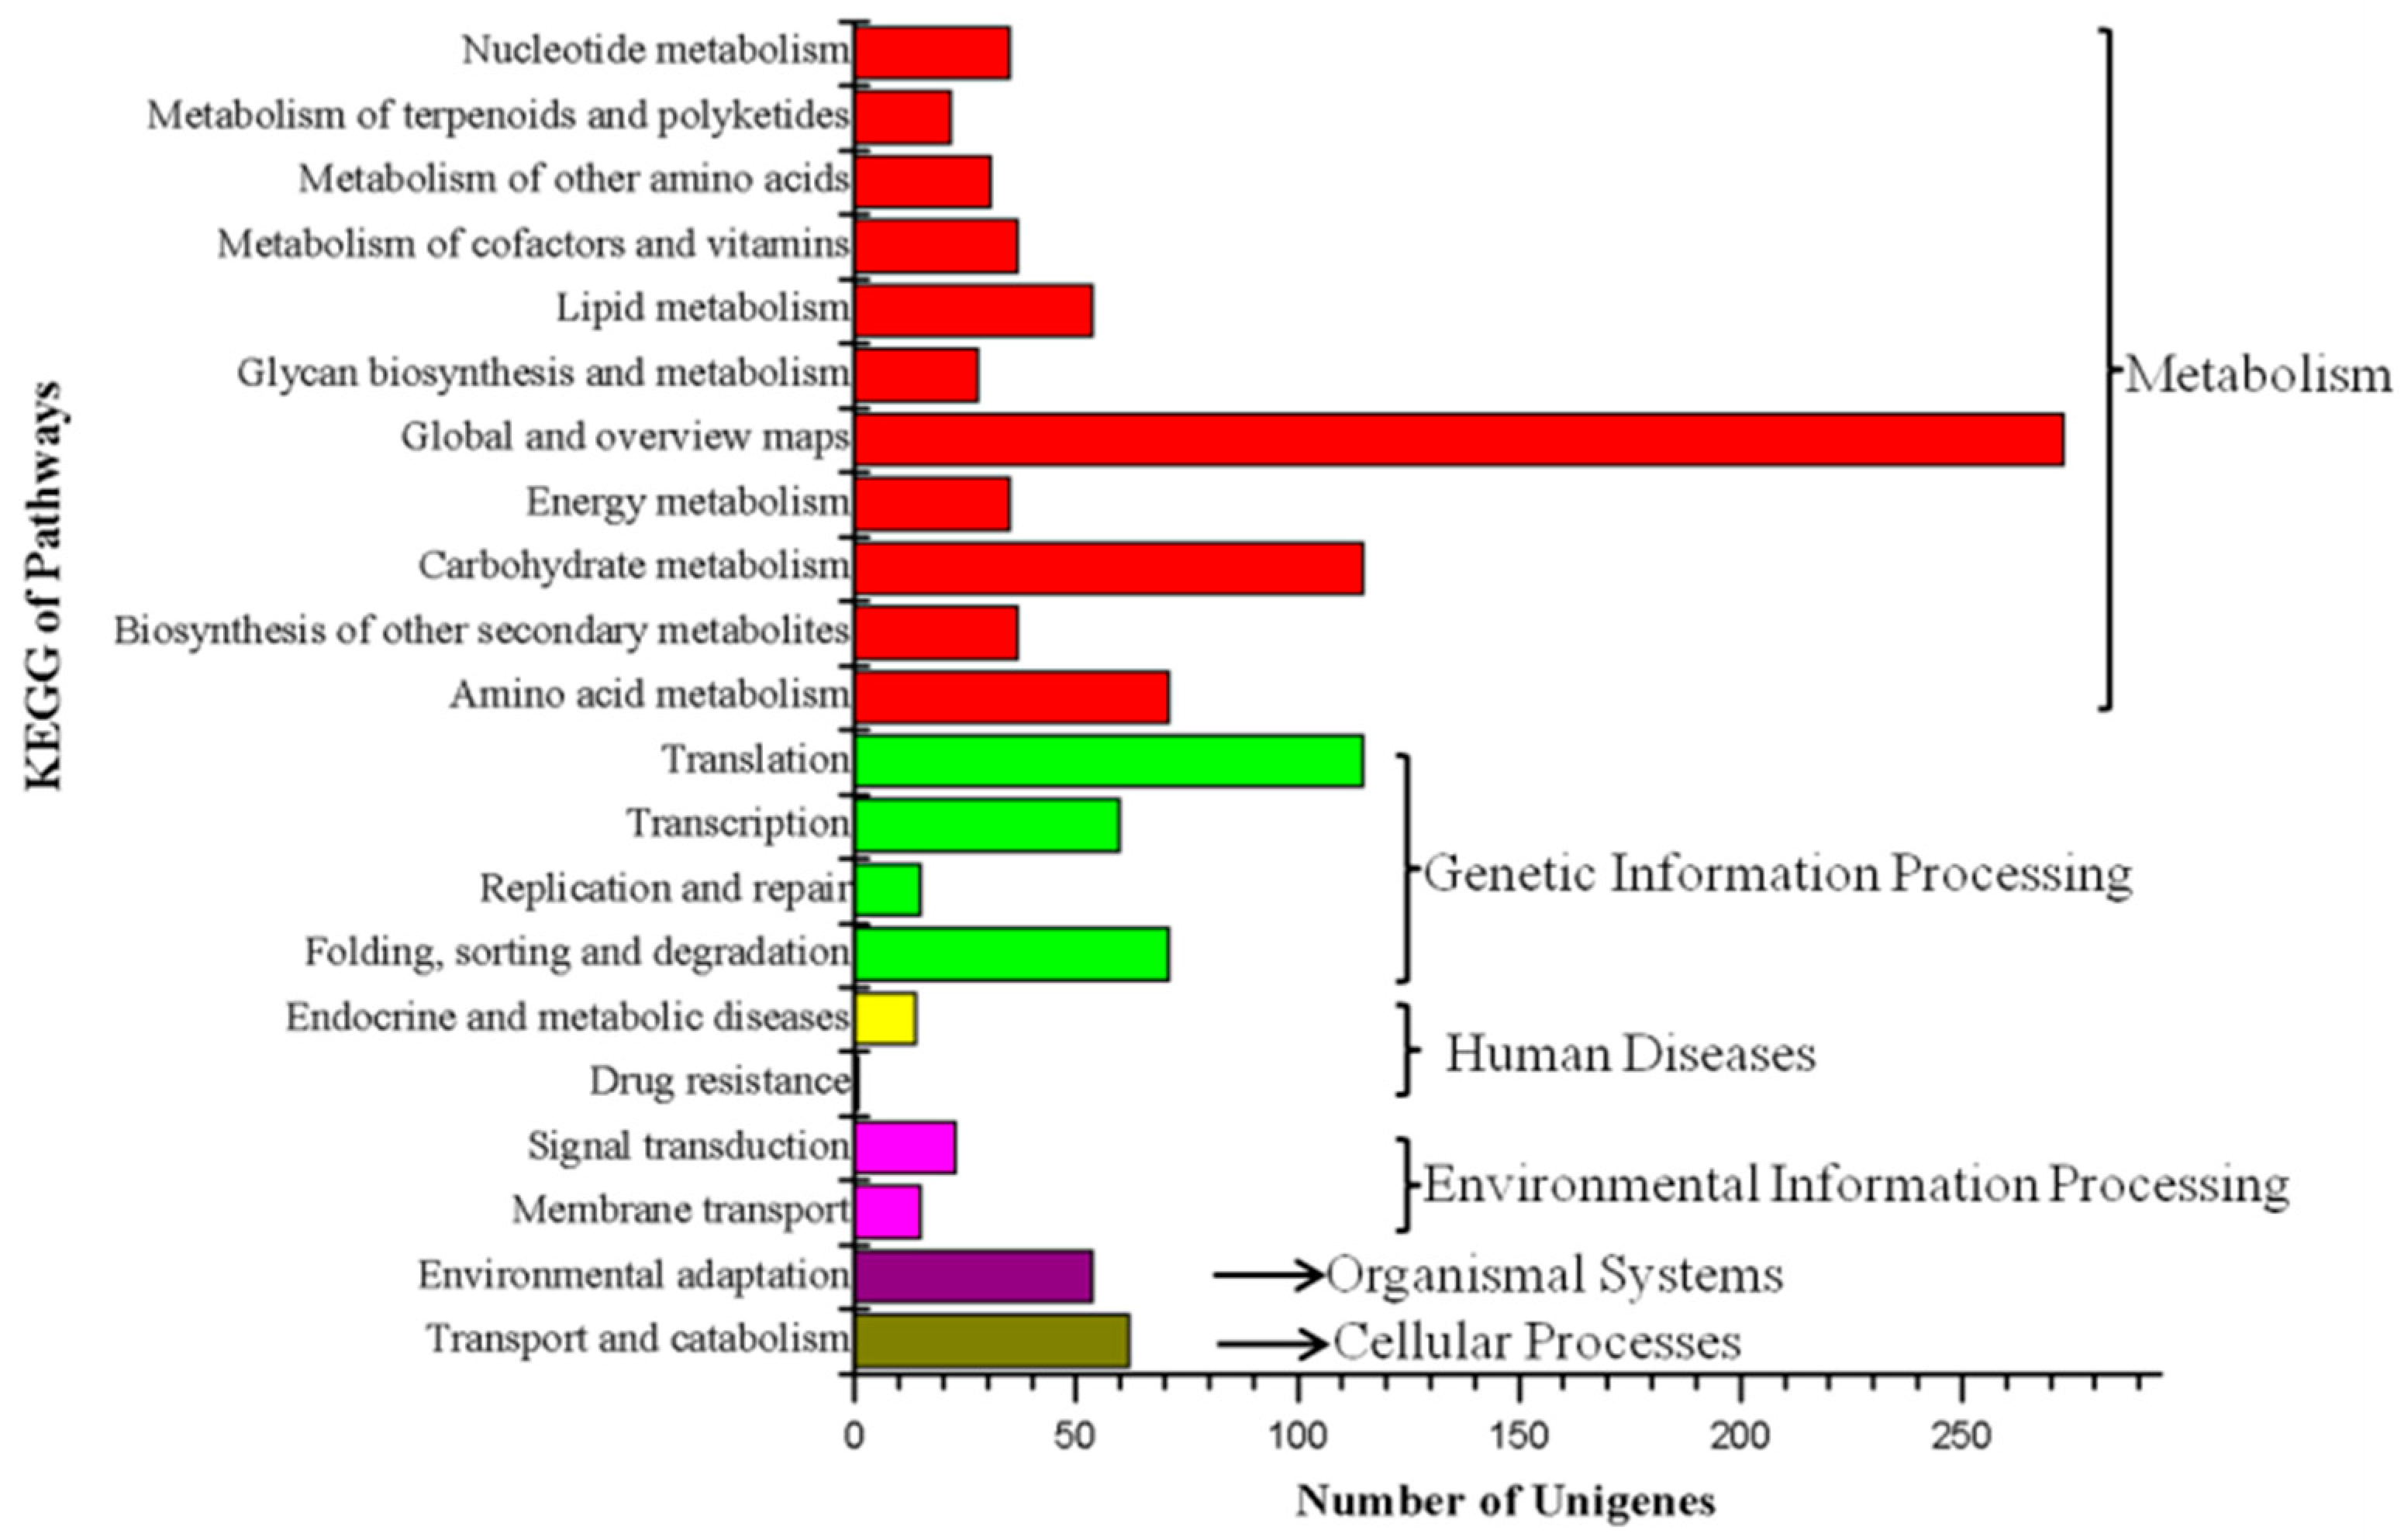
The 1664 DEGs were compared with the KEGG database, resulting in 1146 annotated DEGs. There were 122 KEGG pathways represented and the annotation results were divided into six categories: cell processes, environmental information processing, genetic information processing, human diseases, metabolism and biological systems (Figure 3). In the metabolic class, the DEGs were annotated into pathways related to translation (115), carbohydrate metabolism (115), amino acid metabolism (71), folding, sorting and degradation (71) and transport and catabolism (71). KEGG enrichment analysis results showed that the most enriched categories were Aminoacyl-tRNA biosynthesis and Pentose and glucuronate interconversions, followed by glycosaminoglycan degradation, other types of O-glycan biosynthesis, nitrogen metabolism, phenylalanine metabolism, galactose metabolism, phenylalanine, tyrosine and tryptophan biosynthesis, insulin resistance, circadian rhythm in plants and monobactam biosynthesis.
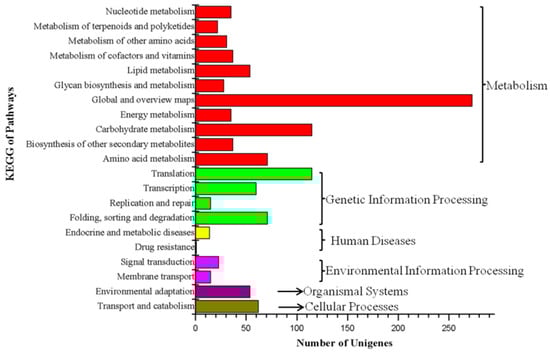
Figure 3.
KEGG functional classification analysis of the DEGs between the WT and the greening mutant of P. fortunei.
3.6. Protein Information Identified by ITRAQ
The mass spectrometric analysis obtained 208,715 spectra, and a total of 26,487 peptides and 6193 proteins were identified between the greening mutant and the WT of P. fortunei. There were 360 differentially expressed proteins (DEPs) with changes > 1.2-fold or <0.83-fold (p value < 0.05). Of these DEPs, 178 proteins were up-regulated, 182 down-regulated and 56 uncharacterized.
The identified proteins represented a range of relative molecular masses: 10 to 20 kD (18.8%), 20 to 30 kD (20.4%), 30 to 40 kD (15.4%), 40 to 50 kD (12.6%) and greater than 100 kD (5.3%). The identified proteins were represented by 1 peptide (1549), 2 to 5 peptides (2687), 6 to 10 peptides (1193) or 11 or more peptides (728). The peptide sequence coverage of each protein varied from 40 to 100%, 30 to 40%, 20 to 30%, 10 to 20% and <10% protein, accounting for 13.4%, 9.5%, 14.2%, 22.4% and 40.5% of the total proteins, respectively. This indicates that nearly 60% of the identified proteins are well represented by peptide sequences (>10% coverage).
3.7. GO Functional Analysis of DEPs
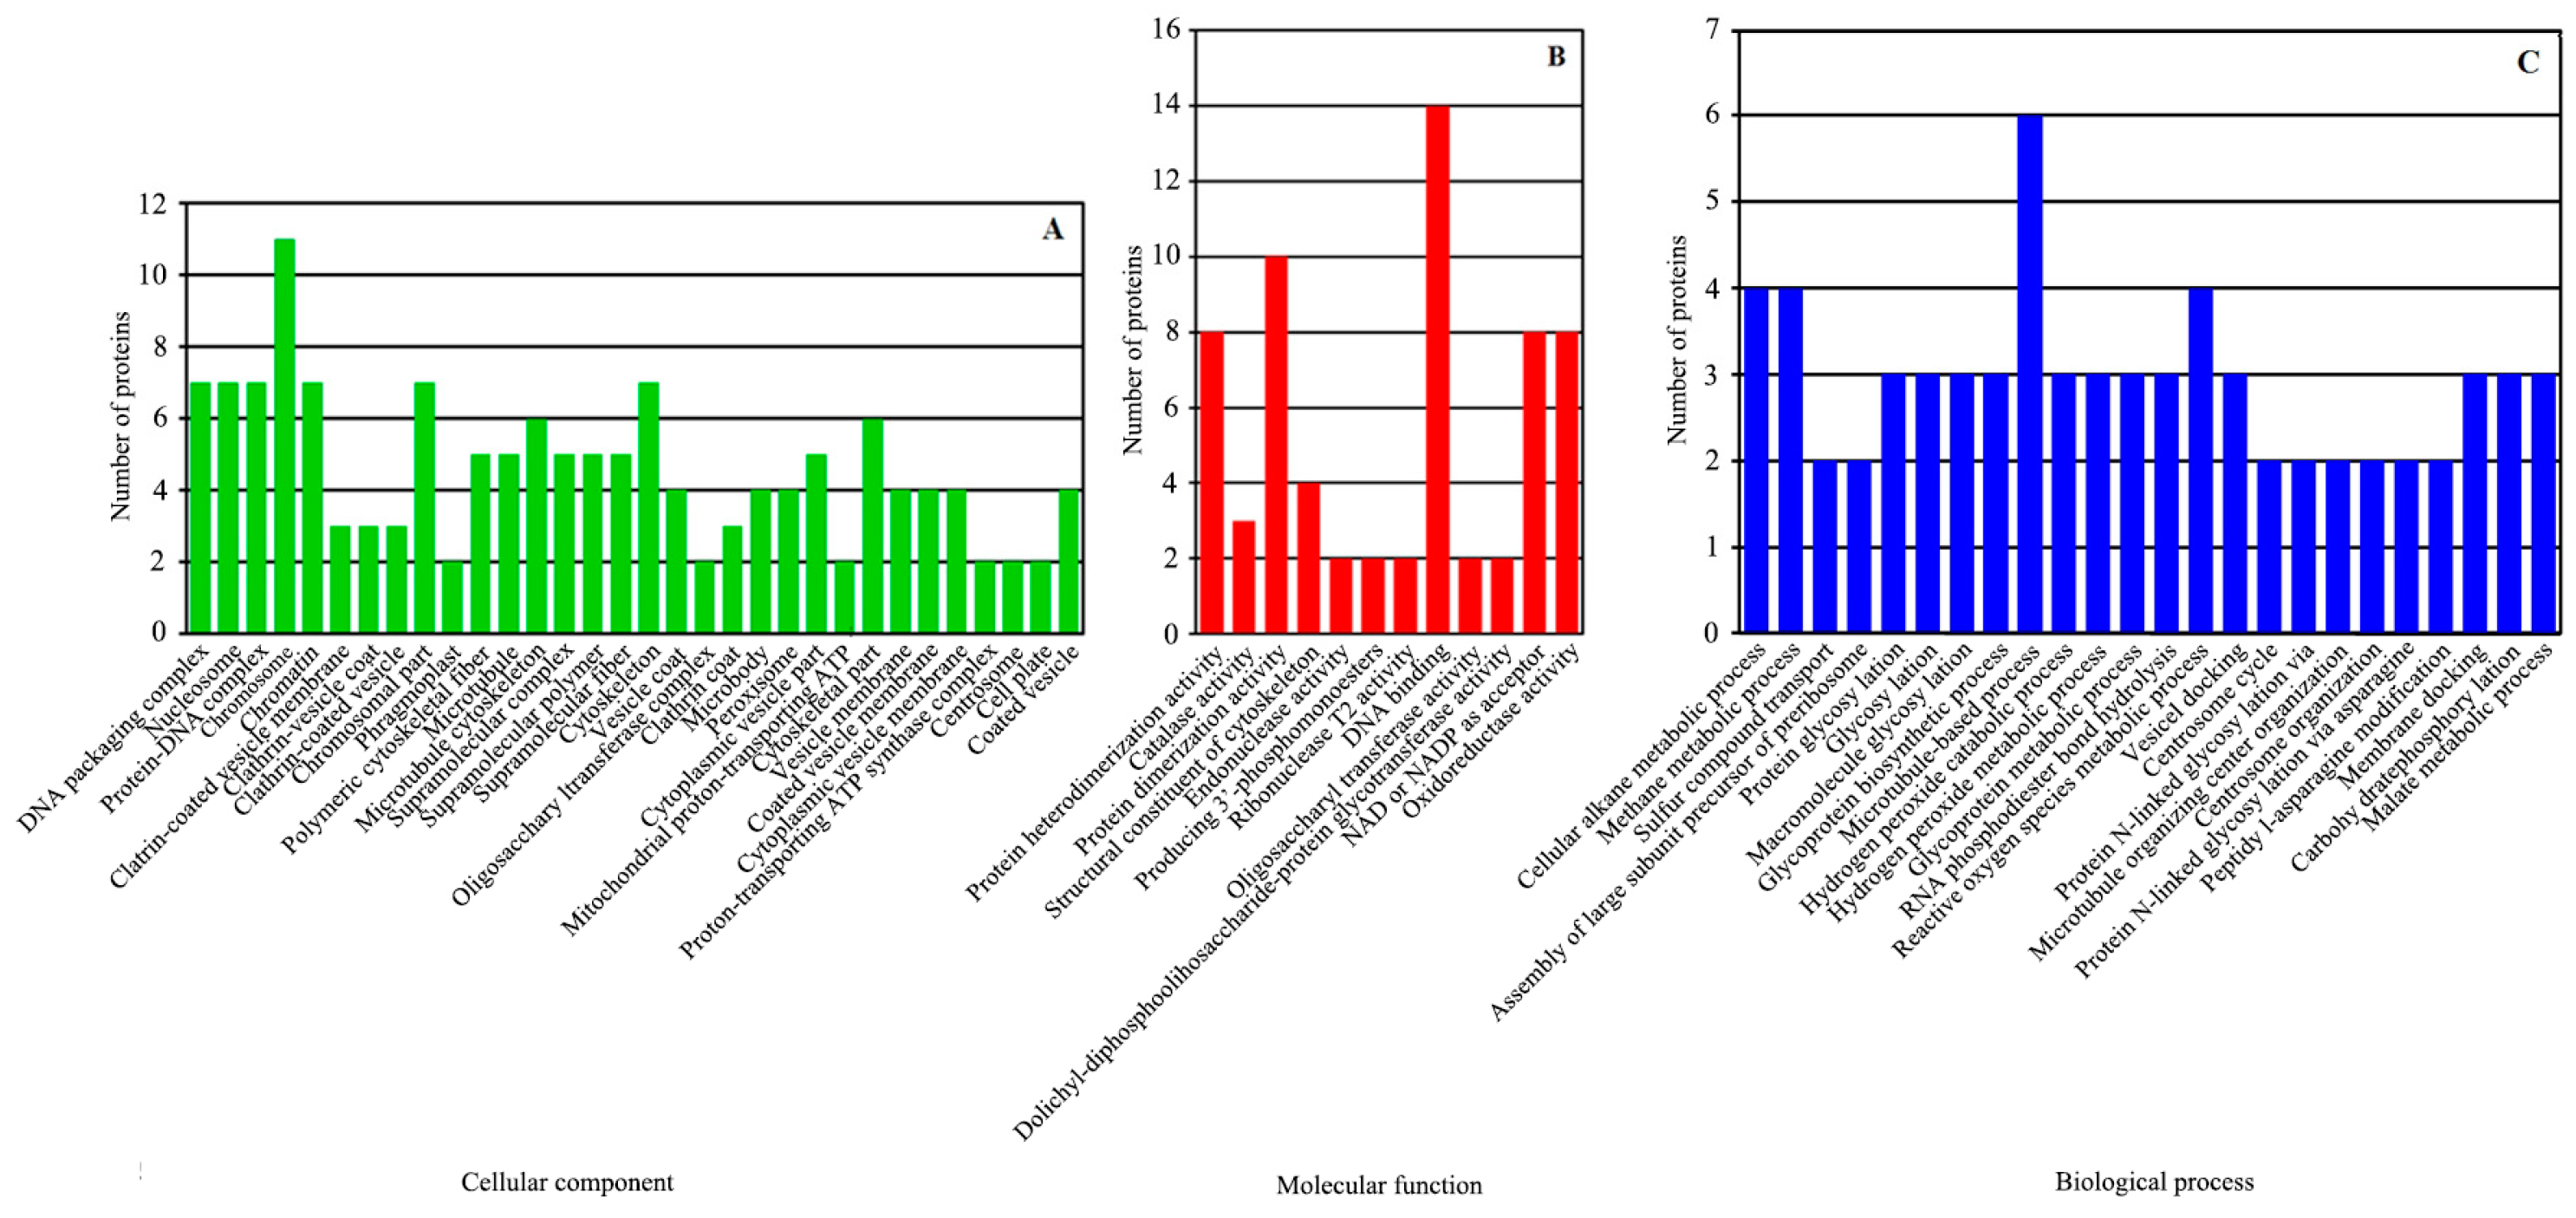
The 360 DEPs were compared with the GO database. The results were enriched in 252 protein clusters and 68 functional categories. The DEPs matched 32 GO terms in cell components, 12 GO terms in molecular function and 24 GO terms in biological process (Figure 4). They were mainly enriched in the following GO classifications: DNA packaging complex (p = 3.85 × 10⁻⁵), nucleosome (p = 3.85 × 10⁻⁵), protein–DNA complex (p = 3.48 × 10⁻⁵), chromosome (p = 0.00015), chromatin (p = 0.00068), clathrin-coated vesicle membrane (p = 0.00342), clathrin vesicle coat (p = 0.00342) and clathrin-coated vesicle (p = 0.00572) in cell components (Figure 4A); protein heterodimerization activity (p = 0.00023), catalase activity (p = 0.00075), protein dimerization activity (p = 0.00108), structural constituent of cytoskeleton (p = 0.00919), endonuclease activity, active with either ribo- or deoxyribonucleic acids and producing 3′-phosphomonoesters (p = 0.00972), endoribonuclease activity, and producing 3′-phosphomonoesters (p = 0.00972) in molecular functions (Figure 4B) and cellular alkane metabolic process (p = 0.00015), methane metabolic process (p = 0.00015), sulfur compound transport (p = 0.00972), assembly of large subunit precursor of preribosome (p = 0.00972), protein glycosylation (p = 0.01258) and glycosylation (p = 0.01258) in biological processes (Figure 4C).

Figure 4.
GO functional classification analysis of DEPs. The DEPs between the greening mutant and the WT of P. fortunei belonged to three major categories: (A) cell components, (B) molecular functions, (C) biological processes.
3.8. KEGG Function Annotation and Analysis of DEPs
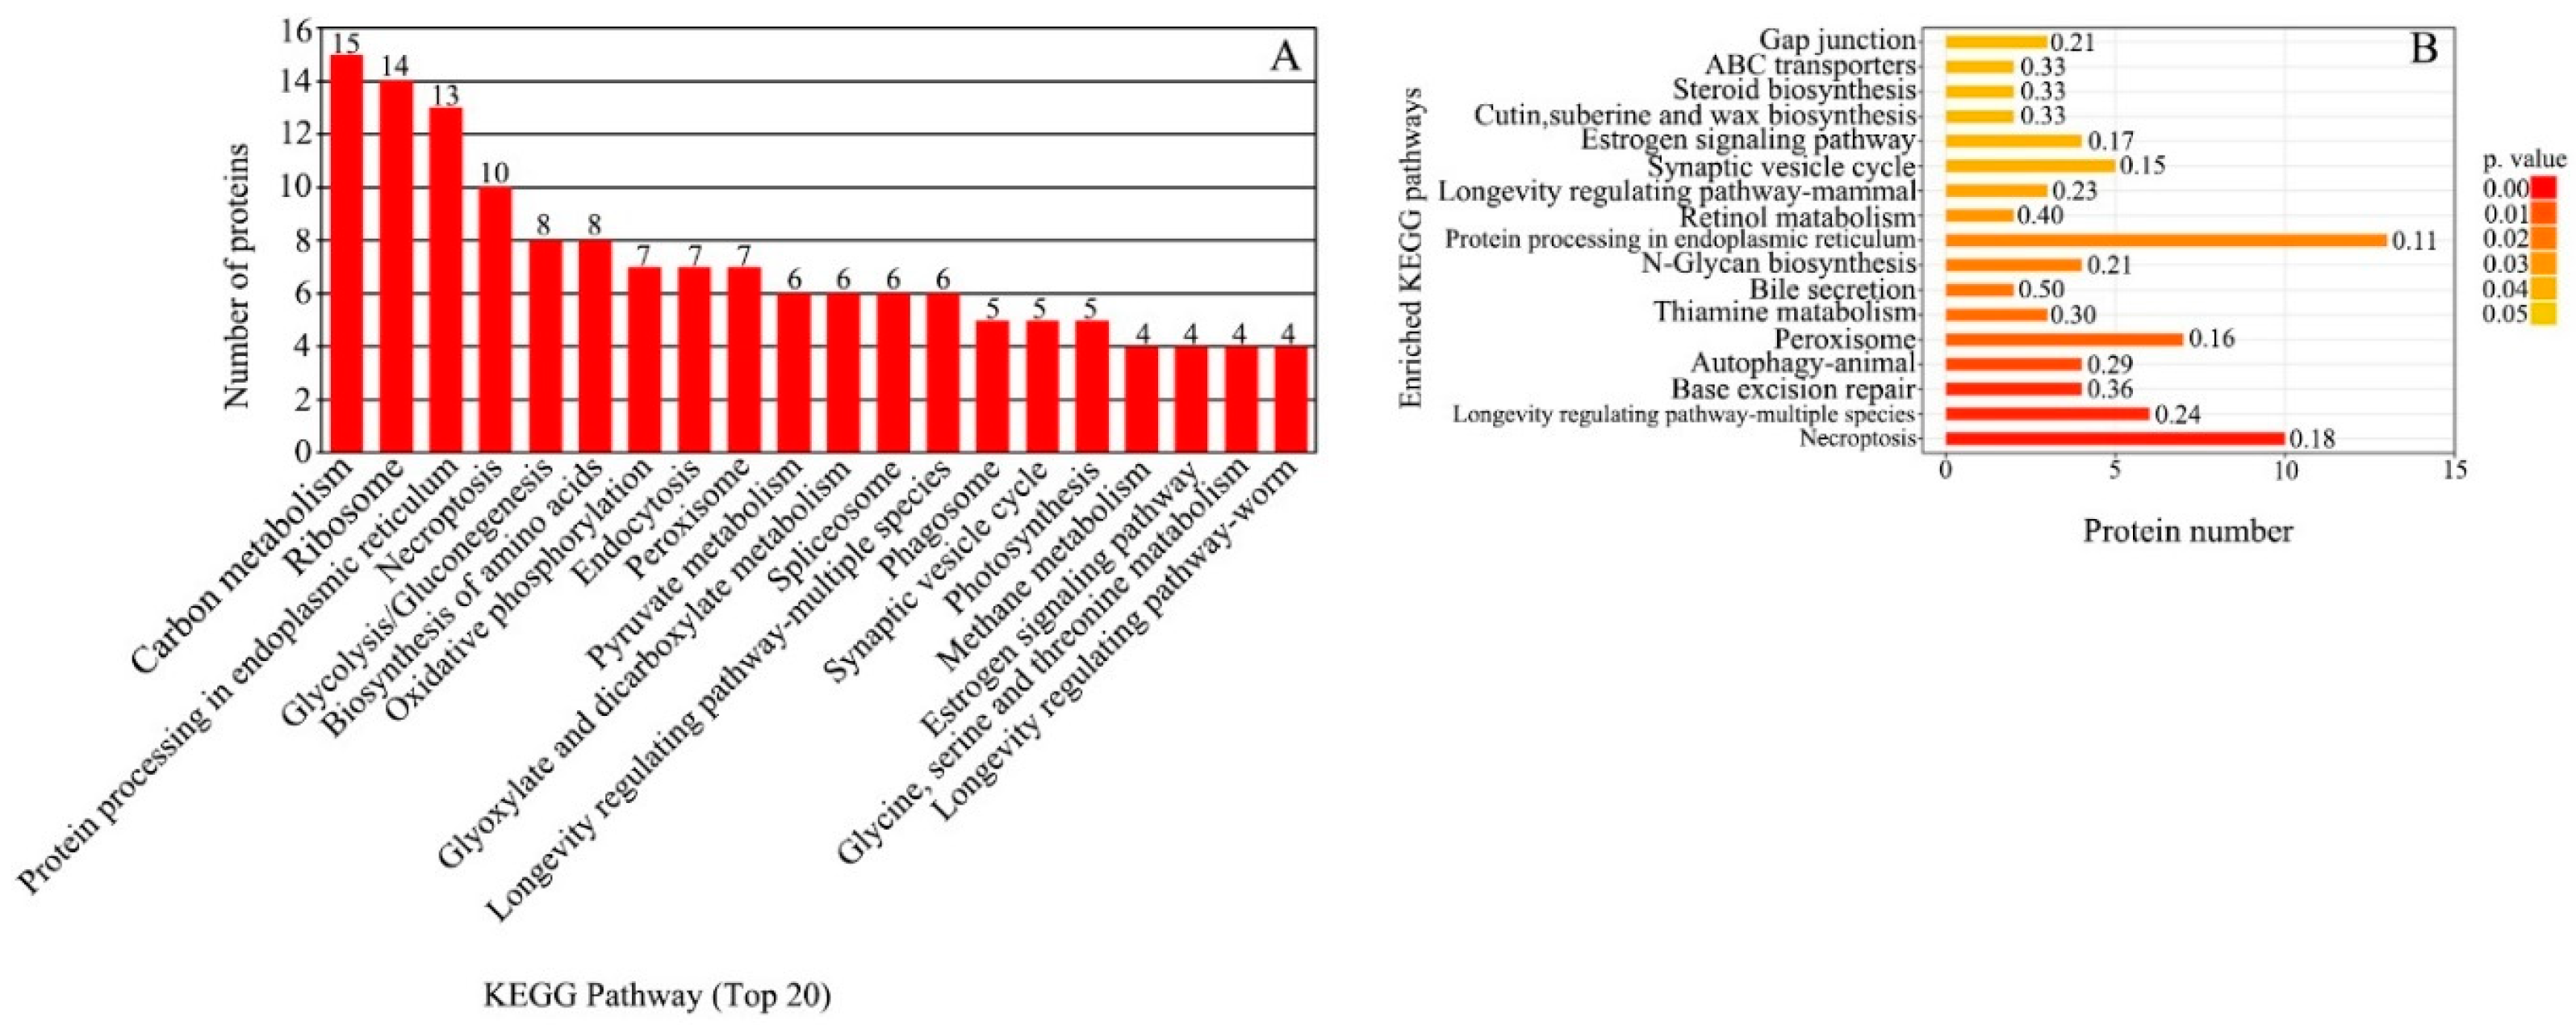
The 360 DEPs were compared with the KEGG database. A total of 142 DEPs were annotated into 160 KEGG pathways. The annotations were across six categories: metabolism, environmental information processing, human diseases, cellular processes, genetic information processing and organismal systems. The DEPs were mainly annotated in carbon metabolism (15 DEPs), followed by ribosome (14 DEPs), protein processing in endoplasmic reticulum (13 DEPs) and necroptosis (10 DEPs) (Figure 5A). KEGG enrichment analysis showed that 50 DEPs were significantly enriched in 17 pathways (p ≤ 0.05) (Figure 5B). The main pathways included necroptosis (p = 0.001083), peroxisome (p = 0.012567), thiamine metabolism (p = 0.017209), N-glycan biosynthesis (p = 0.021707), protein processing in endoplasmic reticulum (p = 0.024249), retinol metabolism (p = 0.029971), steroid biosynthesis (p = 0.023249), ABC transporters (p = 0.043249) and gap junction (p = 0.043940).
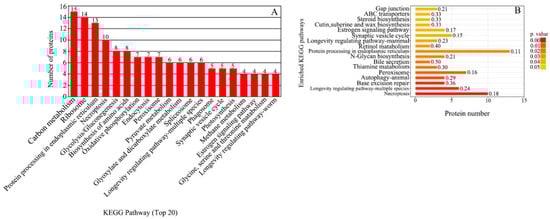
Figure 5.
KEGG pathway analysis of DEPs between the greening mutant and the WT of P. fortunei. (A) KEGG pathway functional classifications and distribution. (B) KEGG enrichment analysis of DEPs.
3.9. Correlation Analysis Between Transcriptome and Proteome
Correlation analysis showed that there were 6227 proteins, 72,087 transcripts and 6171 correlations in the comparison between the WT and the greening mutant of P. fortunei. Among them, fourteen DEPs and transcripts were shared within the two datasets, including nine DEPs that were up-regulated in both datasets, three DEPs that were down-regulated and two DEPs that were inversely related. The GO classification of these 14 DEPs were mainly cellular process, metabolic process, positive regulation of biological process, response to stimulus, biological regulation and detoxification. The 14 DEPs were mainly associated with KEGG pathways in photosynthesis, phenylpropanoid biosynthesis, glutathione metabolism, tryptophan metabolism, glyoxylate and dicarboxylate metabolism, starch and sucrose metabolism, peroxisome, MAPK signaling pathways in plant and cyanoamino acid metabolism.
3.10. DEGs/DEPs Related to Leaf Color Regulation in P. fortunei
According to the analysis of the transcriptome (Table 2), 11 DEGs were determined to be differentially expressed in relation to leaf color in P. fortunei, and the genes were annotated in the aminoacyl-tRNA biosynthesis, nitrogen metabolism, and circadian rhythm-plant metabolic pathways. In the proteomic analysis, four DEPs were deemed related to the regulation of leaf color in P. fortunei, which were annotated in carotenoid biosynthesis and photosynthesis, respectively. As a result of the combined analysis of the transcriptome and proteome, four DEGs/DEPs, in photosynthesis, glutathione metabolism, peroxisome and cyanomino acid metabolism, were considered to be related to the regulation of the leaf color of P. fortunei.
Table 2.
Statistical analysis of screened DEGs/DEPs related to leaf color in the greening mutant of P. fortunei.
3.11. Validation of DEGs Expression
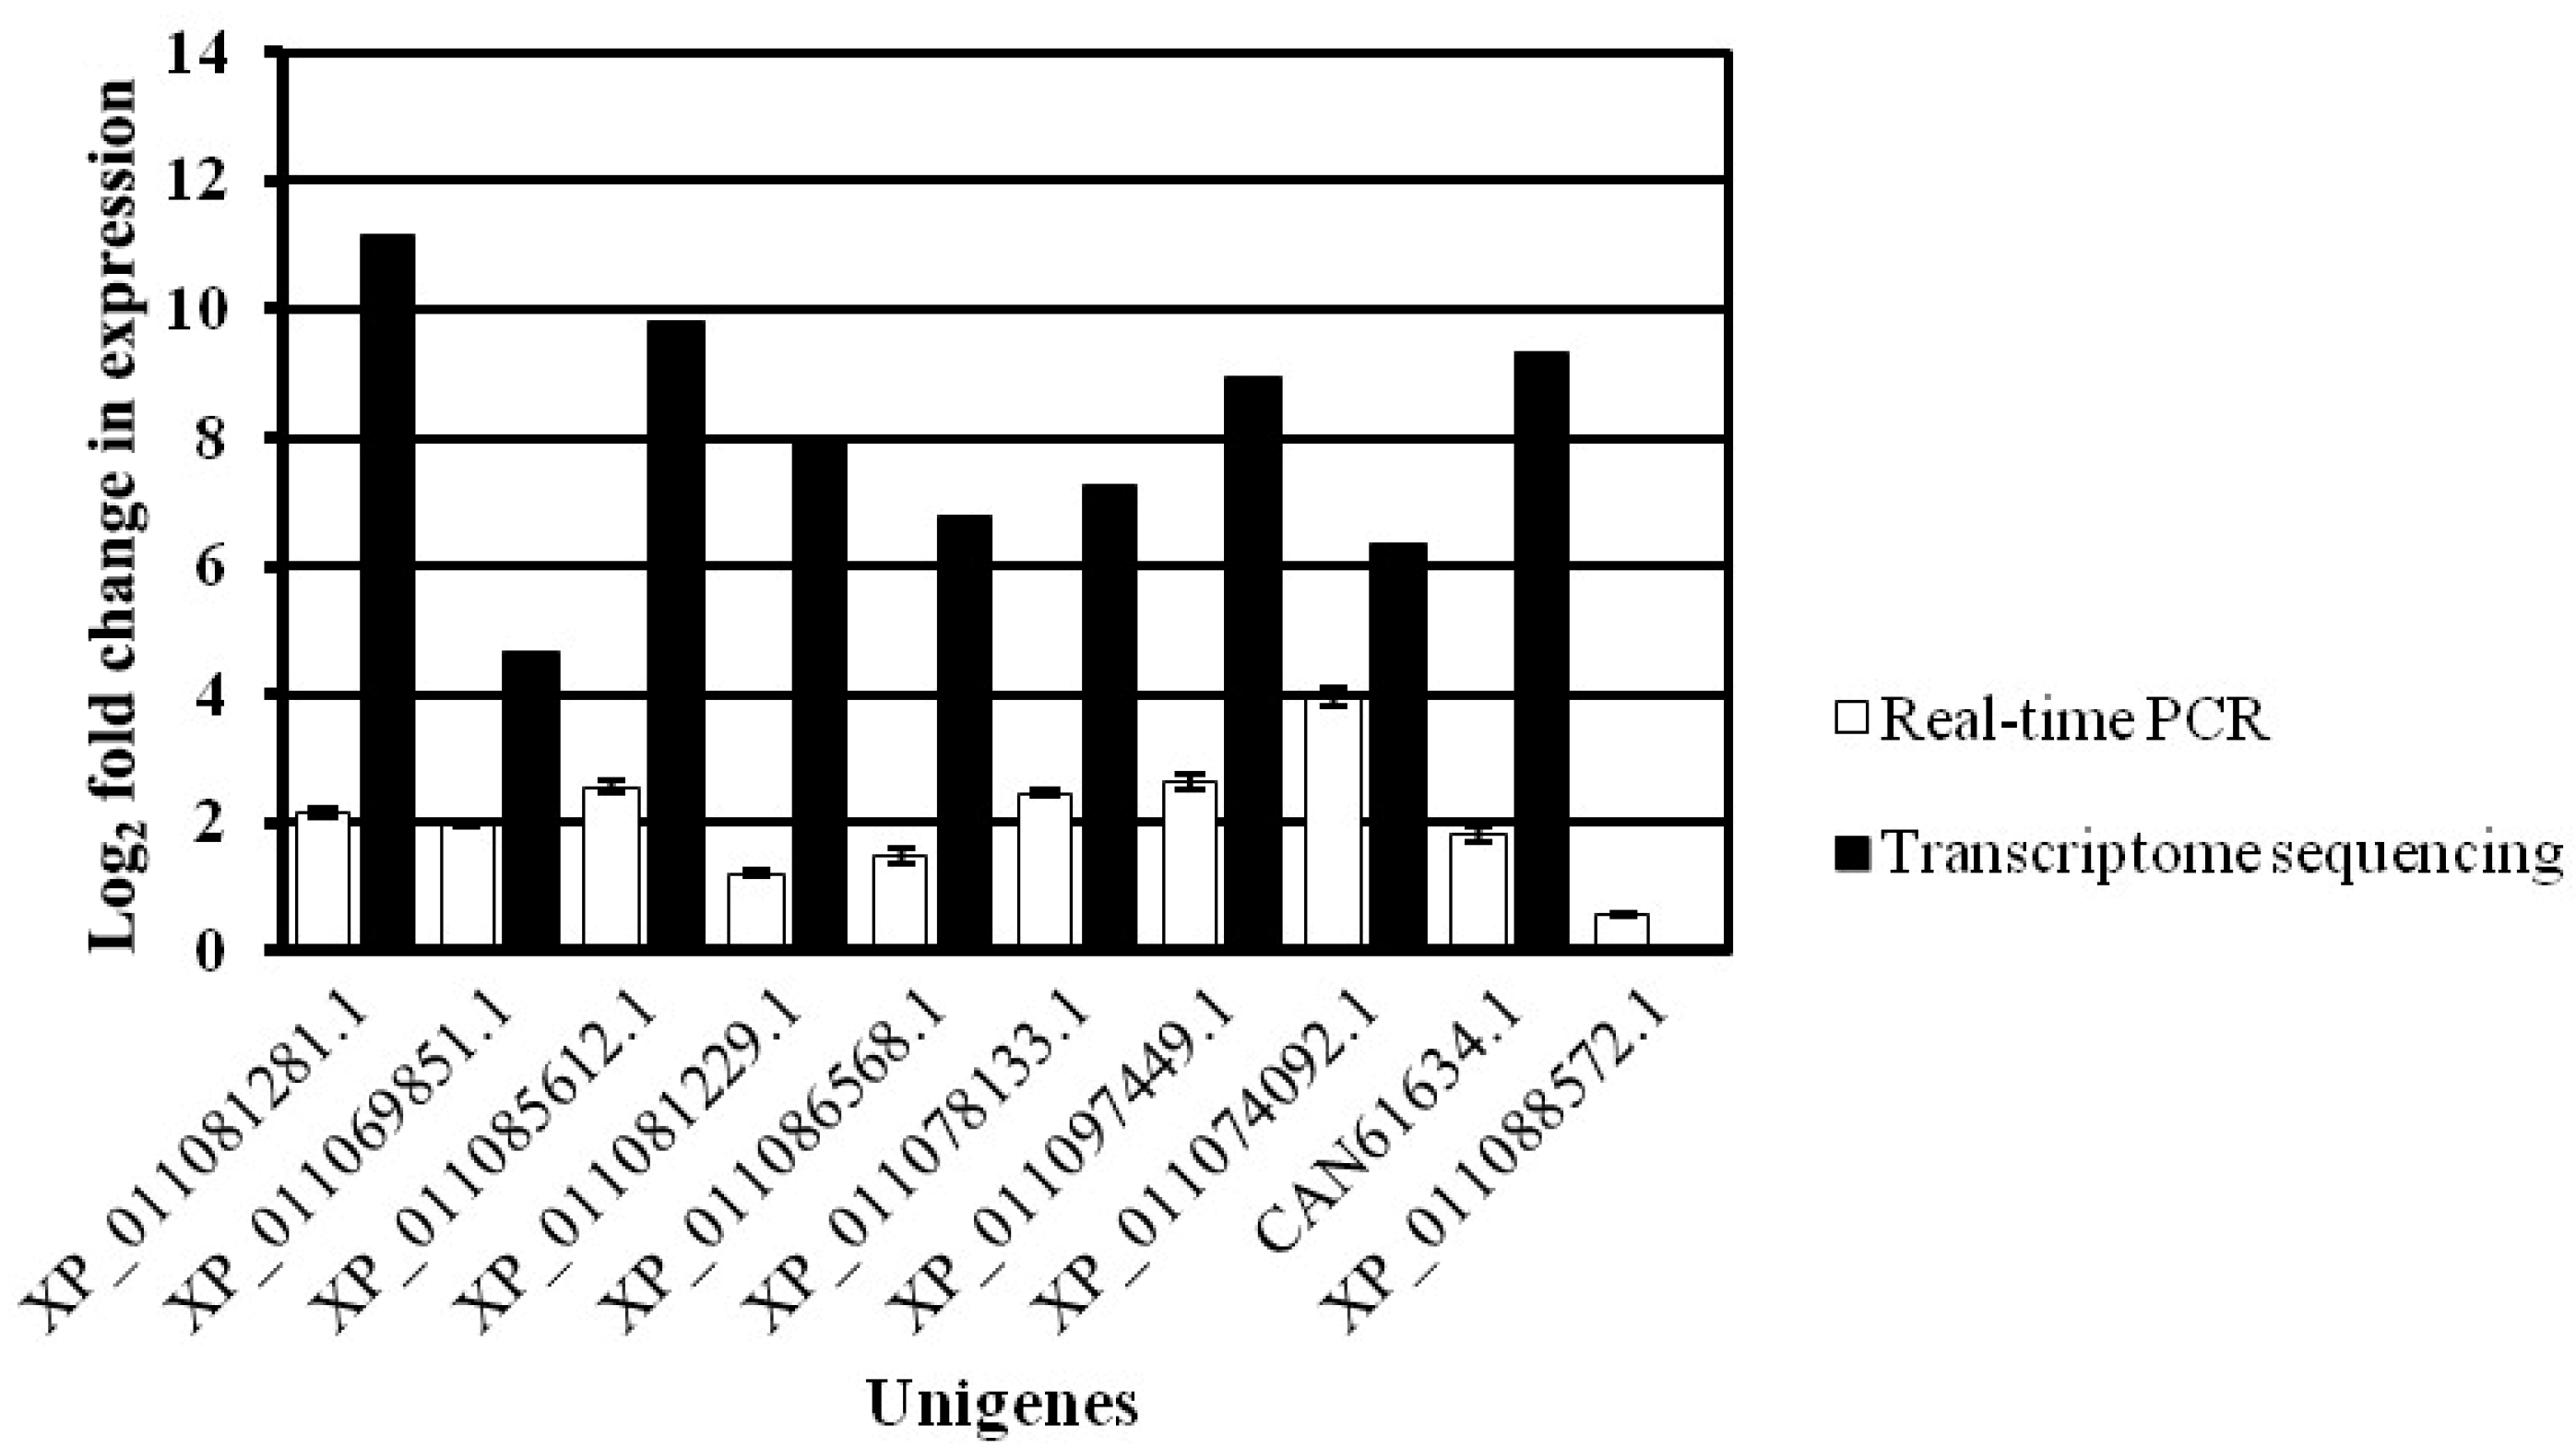
To confirm the RNA-Seq data, 10 DEGs with consistent expression trends in the transcriptomics and proteomics were selected for quantitative real-time PCR (qRT-PCR). The sequence-specific primers used for qRT-PCR, including the 18S rRNA gene and the 10 selected genes, are listed in Supplemental Table S1.
The qRT-PCR data were consistent with the RNA-Seq data in terms of relative fold changes in the expression of these genes between the WT and the greening mutant of P. fortunei. The qRT-PCR results verified the expression level of the DEGs found in RNA-Seq data (Figure 6).
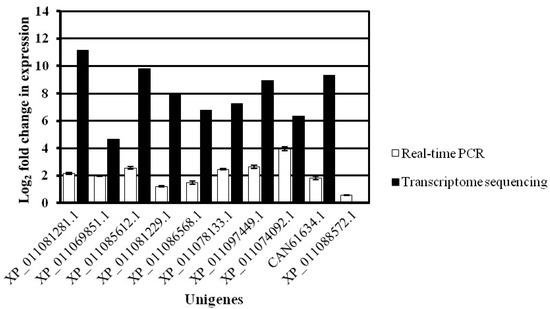
Figure 6.
qRT-PCR analysis of 10 DEGs in the WT and the greening mutant of P. fortunei. qRT-PCR as white and transcriptome as black. The y axis shows the log2 fold change in expression of the transcript. The x axis shows the unigenes. The error bars show the qRT-PCR signals.
4. Discussion
Chlorophyll-deficient mutants often have impaired chloroplast development and reduced photosynthesis [38]. In this study, we determined the chlorophyll content of a greening mutant in P. fortunei and performed transcriptomics and proteomics analyses to identify potential molecular components underlying the phenotype.
Chlorophyll a and chlorophyll b are the main photosynthetic pigments in the leaves of higher plants, and their content and proportion determine the color of the leaves. The contents of chlorophyll a and chlorophyll b in the P. fortunei greening mutant were significantly lower than those in the WT, possibly due to impaired chlorophyll synthesis. In the leaf color mutates, the total chlorophyll, chlorophyll a, chlorophyll b, and their ratio can be changed, with decreases in chlorophyll b content [39]. The decrease in chlorophyll b content in most greening mutants is greater than that in chlorophyll a content, and the corresponding chlorophyll a/b increases [40]. Decreases in chlorophyll b content and altered leaf color may be related to mutation of the gene encoding Mg-chelatase, a decrease in activity which can result in the accumulation of the chlorophyll intermediate protoporphyrin IX (Proto). The corresponding decrease in chlorophyll eventually leads to a decrease in the synthesis of chlorophyll a and chlorophyll b [41]. The present study indicates that the chlorophyll a/b ratio of the P. fortunei greening mutant increased significantly and the decrease in chlorophyll b content led to the production of greening mutants.
The aminoacyl-tRNA biosynthesis pathway was identified as dysregulated in the transcriptome of the mutant (Table 2). Aminoacyl-tRNA biosynthesis plays an important role in chloroplast development and regulation of chloroplast ribosome biogenesis. Aminoacyl-tRNA synthetase is an important component of protein synthesis, catalyzing the linkage of an amino acid to its cognate tRNA [22]. In comparison of the WT and the mutant in P. fortunei, the genes encoding Vals, gltx and aspS were up-regulated in the mutant. Disruption of the biosynthetic pathway of aminoacyl-tRNA synthetases can result in the degradation of chloroplasts, causing impaired chlorophyll biosynthesis [22,23,24].
Nitrogen assimilation can affect plant greening, since the enhancement of nitrogen metabolism can cause a decrease in photosynthesis and carbon metabolism [42]. At the same time, L-glutamic acid, in the nitrogen metabolism pathway, plays an important role in the development of chloroplasts, and L-glutamic acid can promote the synthesis of chlorophyll [43]. Cytosolic and chloroplastic glutamine synthetase play roles in the chlorophyll synthesis pathway, and ammonia assimilation occurs through glutamine synthetase. Therefore, chloroplast mutants exhibit leaf chlorosis under normal growth conditions [26]. In this study, NR and glnA are up-regulated genes in the mutant. These genes promote nitrogen metabolism, producing nitrite and L-glutamic acid, respectively. Therefore, it is possible that the chlorophyll content of the Paulownia Chl-deficient mutant is impaired due to decreases in nitrite and L-glutamic acid [25,42,43]. gdhA was down-regulated in the mutant, and normally plays an inhibitory role in the nitrogen metabolism pathway. The product of the gdhA gene assimilates ammonia, and it is speculated that the accumulation of ammonia metabolites in the P. fortunei greening mutant blocks chlorophyll synthesis, which ultimately leads to chloroplast defects in the greening mutants.
The circadian rhythm-plant pathway was identified as dysregulated in the mutant in the transcriptome analysis. In the greening mutant, the genes phyB, CSNK2A and CSNK2B were up-regulated. Phytochrome B (phyB) plays an important role in chlorophyll synthesis. phyB mutant plants have lower transcript levels of the chlorophyll synthesis-related genes ChlH and GUN4, which encode the activation factors of subunit H and magnesium chelatase (Mg-chelatase), respectively. Reduction in the transcript levels of ChlH and GUN4 reduce the activity of Mg-chelatase. Additionally, phyB expression is also mediated by the transcriptional regulation of ChlH and GUN4 genes [44]. This hinted that the phyB gene was inhibited in the P. fortunei greening mutant, resulting in decreased Mg-chelase activity, which finally blocked chlorophyll synthesis.
Different light qualities also affect chlorophyll synthesis and far-red light can alter the photosynthetic efficiency of PSII [27]. Protein kinase CK2 is composed of two alpha and two beta subunits. CK2 is involved in the phosphorylation of hundreds of proteins in various cellular processes and signaling pathways. In light-induced signaling, overexpression of CKB1 or CKB2 causes enhanced responses to far-red light [28,29]. The CSNK2A and CSNK2B genes were inhibited in the P. fortunei greening mutant, which reduced the chlorophyll content in the P. fortunei greening mutant.
The photosynthesis and carotenoid biosynthesis pathways were altered in the proteomic data (Table 2). Chlorophyll plays an important role in photosynthesis in higher plants [45]. Photosystem I (PSI), photosystem II (PSII), cytochrome b6/f Complex and F-type ATPase are four protein complexes active in photosynthesis. These complexes work together to convert light energy into chemical energy, namely ATP and NADPH. The proteins petH, petF and atpF have been shown to play important roles in chlorophyll synthesis in diverse species, including barley [31], rice [46] and Arabidopsis [33]. In P. fortunei, the enzymes petH, petF and atpF were more abundant in the WT than in the greening mutant. This indicates that the dysregulation of these three proteins might inhibit chlorophyll synthesis in the P. fortunei greening mutant.
Carotenoids are a signal of plant development and stress response in higher plants. Carotenoids function as photoprotective agents under the high light intensity needed for photosynthesis. The carotenoid biosynthesis enzyme Z-ISO was down-regulated in the WT compared to the greening mutant of P. fortunei [30]. This protein may then promote carotenoid biosynthesis in the P. fortunei greening mutant.
Transcriptomes and proteomics analyses showed that petJ, β-glucosidase, GST and CAT, in the photosynthesis, cyanomino acid metabolism, glutathione metabolism and peroxisome pathways, were consistently down-regulated in the P. fortunei greening mutant (Table 2). PetJ encodes cytochrome c6, which normally does that in the plant. PetJ can be significantly expressed in cytochrome c6-deficient mutants [36]. β-glucosidase (E3.2.1.21) encodes the enzyme that synthesizes D-glucose, which alters the oxygen release of photosystem II (PSII) and the induction of chlorophyll a fluorescence [46,47]. β-glucosidase is a rate-limiting enzyme in the photosynthesis reaction and has a significant effect on inhibiting photosynthesis [37]. Glutathione reductase catalyzes the interconversion of reduced and oxidized forms of glutathione (GSH), and uses an NADPH coenzyme, which is provided by pentose phosphate bypass metabolism. An increase in glutathione peroxidase leads to a decrease in chlorophyll content [35,48]. The peroxidase pathway uses important defense enzymes, such as peroxidase (POD) and catalase (CAT), to decompose H2O2 and scavenge reactive oxygen species (ROS) produced by stress [49,50]. The encoding catalase was responsive to light and seasonal changes in peach (Prunus persica (L.) Batsch.) [51]. The enzymes petJ, E3.2.1.21, GST and CAT were more abundant in the WT compared to the greening mutant of P. fortunei. This indicates that the dysregulation of these four genes might inhibit chlorophyll synthesis in the P. fortunei greening mutant. Although we have identified several candidate genes and proteins potentially involved in regulating the yellowing of P. fortunei leaves using multi-omics approaches, this study has certain limitations. The differentially expressed genes/proteins identified (particularly petJ, E3.2.1.21, GST and CAT) remain putative regulatory factors lacking direct genetic evidence. Further validation through gene knockout or VIGS/CRISPR gene editing is required to confirm whether these genes directly regulate chlorophyll b biosynthesis or perform other important functions.
Mutations affecting chloroplast biogenesis or chlorophyll biosynthesis can lead to transient yellowing. For example, albino or pale-yellow mutants in Arabidopsis and rice often display delayed greening due to impaired protochlorophyllide oxidoreductase (POR) activity or disrupted thylakoid membrane assembly [52,53]. Epigenetic modifications, such as DNA methylation or histone acetylation, can temporally suppress genes involved in chlorophyll production. In Arabidopsis, the clk-1 mutant shows delayed greening due to methylation-mediated repression of LHCB (light-harvesting complex) genes, which is gradually reversed as the plant matures [54]. Similarly, cmt3 (chromomethylase) mutants exhibit altered chlorophyll accumulation linked to DNA methylation changes [55].Therefore, in P. fortunei, the phenotype of the greening mutant may be influenced by multiple factors, potentially involving the epigenetic regulation of chlorophyll-related genes, and gradually recovering as the leaves mature.
5. Conclusions
In this study, transcriptome and proteome sequencing of greening mutant Paulownia leaves were carried out. Transcriptome and iTRAQ analysis identified 10 DEGs, which mainly affected the main pathways of photosynthesis, starch and sucrose metabolism, glutathione metabolism and peroxisome function of mutant plants.
Supplementary Materials
The following supporting information can be downloaded at: https://www.mdpi.com/article/10.3390/horticulturae11040441/s1, Table S1: Primers used for qRT-PCR analysis.
Author Contributions
Conceptualization, H.L. and Y.F.; methodology, H.L., W.T. and Y.F.; software, H.L.; validation, H.L. and Y.F.; formal analysis, H.L.; writing—original draft preparation, H.L. and Y.F.; writing—review and editing, H.L. and Y.F.; visualization, W.T.; supervision, W.T.; project administration, Y.F. All authors have read and agreed to the published version of the manuscript.
Funding
This research was funded by Henan Science and Technology Think Tank Research Topic, grant number HNKJZK-2025-12A and the Major Project of Philosophy and Social Science Research in Higher Education Institutions of Henan Province, grant number 2025-YYZD-12.
Data Availability Statement
The original data for this study were not uploaded to publicly available platforms due to the gene functional validation experiments having not yet been completed. For further inquiries, please contact the corresponding author Yongming Fan (fanyongming@ncwu.edu.cn). Upon completion of the gene functional validation, the raw data will be promptly deposited in a public repository.
Conflicts of Interest
The authors declare no conflicts of interest.
References
- Sławińska, N.; Zając, J.; Olas, B. Paulownia Organs as Interesting New Sources of Bioactive Compounds. Int. J. Mol. Sci. 2023, 24, 1676. [Google Scholar] [CrossRef]
- Ru, G.X.; Liu, X.N.; Zhu, X.H.; Zhang, L.C.; Wang, Y.R.; Zhou, S.Q. Physiological Characteristic Analysis of Etiolation Mutant in Paulownia fortune. J. Nanjing For. Univ. (Nat. Sci. Ed.) 2017, 41, 181–185. (In Chinese) [Google Scholar]
- Zivcak, M.; Brestic, M.; Botyanszka, L.; Chen, Y.E.; Allakhverdiev, S.I. Phenotyping of Isogenic Chlorophyll-less Bread and Durum Wheat Mutant Lines in Relation to Photoprotection and Photosynthetic Capacity. Photosyn. Res. 2018, 139, 239–251. [Google Scholar] [CrossRef] [PubMed]
- Yang, Y.N.; Safarova, R.B.; Park, S.Y.; Sakuraba, Y.; Oh, M.H.; Zulfugarov, I.S.; Lee, C.B.; Tanaka, A.; Paek, N.C.; Lee, C.H. Chlorophyll Degradation and Light-harvesting Complex II Aggregate Formation during Dark-induced Leaf Senescence in Arabidopsis Pheophytinase Mutants. J. Plant Biol. 2019, 62, 27–38. [Google Scholar] [CrossRef]
- Lin, W.W.; Guo, X.D.; Pan, X.F.; Li, Z.W. Chlorophyll Composition, Chlorophyll Fluorescence, and Grain Yield Change in es/mutant Rice. Int. J. Mol. Sci. 2018, 19, 2945. [Google Scholar] [CrossRef] [PubMed]
- Sakowska, K.; Alberti, G.; Genesio, L.; Peressotti, A.; Delle Vedove, G.; Gianelle, D.; Colombo, R.; Rodeghiero, M.; Panigada, C.; Juszczak, R. Leaf and Canopy Photosynthesis of a Chlorophyll Deficient Soybean Mutant. Plant Cell Environ. 2018, 41, 1427–1437. [Google Scholar] [CrossRef]
- Shi, D.Y.; Zheng, X.; Li, L.; Lin, W.H.; Xie, W.J.; Yang, J.P.; Chen, S.J.; Jin, W.W. Chlorophyll Deficiency in the Maize Elongated Mesocotyl 2 Mutant is Caused by a Defective Heme Oxygenase and Delaying Grana Stacking. PLoS ONE 2013, 8, e80107. [Google Scholar] [CrossRef]
- Dong, H.; Zeng, H. Identification of Differentially Expressed Proteins of a New Rice Mutant with Albino Green-revertible Trait in the Seedling Stage. Can. J. Plant Sci. 2010, 90, 283–292. [Google Scholar] [CrossRef]
- Chu, P.; Yan, G.X.; Yang, Q.; Zhai, L.N.; Zhang, C.; Zhang, F.Q.; Guan, R.Z. iTRAQ-based Quantitative Proteomics Analysis of Brassica napus Leaves Reveals Pathways Associated with Chlorophyll Deficiency. J. Proteom. 2015, 113, 244–259. [Google Scholar] [CrossRef]
- Dong, F.; Shi, Y.Z.; Liu, M.Y.; Fan, K.; Zhang, Q.F.; Ruan, J. iTRAQ-based Quantitative Proteomics Analysis Reveals the Mechanism Underlying the Weakening of Carbon Metabolism in Chlorotic Tea Leaves. Int. J. Mol. Sci. 2018, 19, 3943. [Google Scholar] [CrossRef]
- Huang, B.; Huang, W.; Liu, Z.; Peng, Y.; Qu, Y.; Zhou, W.; Huang, J.; Shu, H.; Wen, Q. Cytological, Physiological, and Transcriptome Analysis of Leaf-Yellowing Mutant in Camellia chekiangoleosa. Int. J. Mol. Sci. 2024, 26, 132. [Google Scholar] [CrossRef]
- Gong, Z.H.; Chen, S.H.; Li, X.Y.; Lv, W.W.; Li, M.R.; Jin, X.M.; Gao, Y.F.; Rong, L.P. Anthocyanin metabolites and related regulatory genes analysis in leaves of Acer Pseudosieboldianum mutant during different periods of color change. BMC Genom. 2025, 26, 182. [Google Scholar] [CrossRef]
- Lichtenthaler, H.K. Chlorophylls and carotenoids: Pigments of photosynthetic biomembranes. Method. Enzymol. 1987, 148, 350–382. [Google Scholar]
- Mortazavi, A.; Williams, B.A.; McCue, K.; Schaeffer, L.; Wold, B. Mapping and quantifying mammalian transcriptomes by RNA-Seq. Nat. Methods 2008, 5, 621–628. [Google Scholar] [CrossRef]
- Jorrin-Novo, J.V. Plant proteomics methods and protocols. Plant Proteom. 2014, 1072, 3–13. [Google Scholar]
- Xiao, C.; Ye, J.; Máximo Esteves, R.; Rong, C. Using Spearman’s correlation coefficients for exploratory data analysis on big dataset. Concurr. Comp. Pract. E 2016, 28, 3866–3878. [Google Scholar] [CrossRef]
- Deng, Y.Y.; Li, J.Q.; Wu, S.F.; Zhu, Y.P.; He, F.C. Integrated NR database in protein annotation system and its localization. Comput. Eng. 2006, 32, 71–72. [Google Scholar]
- Tatusov, R.L.; Galperin, M.Y.; Natale, D.A.; Koonin, E.V. The COG database: A tool for genome scale analysis of protein functions and evolution. Nucleic Acids Res. 2000, 28, 33–36. [Google Scholar] [CrossRef]
- Conesa, A.; Götz, S. Blast2GO: A comprehensive suite for functional analysis in plant genomics. Inter. J. Plant Genom. 2008, 2008, 619832. [Google Scholar] [CrossRef]
- Kanehisa, M.; Goto, S.; Sato, Y.; Furumichi, M.; Tanabe, M. KEGG for integration and interpretation of large-scale molecular data sets. Nucleic Acids Res. 2012, 40, D109–D114. [Google Scholar] [CrossRef]
- Livak, K.; Schmittgen, T. Analysis of relative gene expression data using real-time quantitative PCR and the 2−∆∆CT method. Methods 2001, 25, 402–408. [Google Scholar] [CrossRef]
- Wang, Y.L.; Wang, C.M.; Zheng, M.; Lyu, J.; Xu, Y.; Li, X.H.; Niu, M.; Long, W.H.; Wang, D.; Wang, H.Y.; et al. WHITE PANICLE1, a Val-tRNA synthetase regulating chloroplast ribosome biogenesis in rice, is essential for early chloroplast development. Plant Physiol. 2016, 170, 2110–2123. [Google Scholar] [CrossRef]
- Stange-Thomann, N.; Thomann, H.U.; Lloyd, A.J.; Lyman, H.; Söll, D. A point mutation in Euglena gracilis chloroplast tRNA(Glu) uncouples protein and chlorophyll biosynthesis. Proc. Natl. Acad. Sci. USA 1994, 91, 7947–7951. [Google Scholar] [CrossRef]
- Schön, A.; Gough, S.; Söll, D. Chloroplast tRNA(Asp): Nucleotide sequence and variation of in vivo levels during plastid maturation. Plant Mol. Biol. 1992, 20, 601–607. [Google Scholar] [CrossRef]
- Zhang, X.; Ma, F.; Zhu, X.; Zhu, J.Y.; Rong, J.F.; Zhan, J.; Chen, H.; He, C.L.; Wang, Q. The acceptor side of photosystem II is the initial target of nitrite stress in Synechocystis sp. strain PCC 6803. Appl. Environ. Microbiol. 2017, 83, e02952-16. [Google Scholar] [CrossRef]
- Chatterjee, A.; Kundu, S. Revisiting the chlorophyll biosynthesis pathway using genome scale metabolic model of Oryza sativa japonica. Sci. Rep. 2015, 5, 14975. [Google Scholar] [CrossRef]
- Zhen, S.; van Iersel, M.W. Far-red light is needed for efficient photochemistry and photosynthesis. J. Plant Physiol. 2017, 209, 115–122. [Google Scholar] [CrossRef]
- Zhu, J.; Wang, W.S.; Ma, D.; Zhang, L.Y.; Ren, F.; Yuan, T.T. A role for CK2 β subunit 4 in the regulation of plant growth, cadmium accumulation and H2O2 content under cadmium stress in Arabidopsis thaliana. Plant Physiol. Biochem. 2016, 109, 240–247. [Google Scholar] [CrossRef]
- Bu, Q.Y.; Zhu, L.; Dennis, M.D.; Yu, L.; Lu, S.X.; Person, M.D.; Tobin, E.M.; Browning, K.S.; Huq, E. Phosphorylation by CK2 enhances the rapid light-induced degradation of phytochrome interacting factor 1 in Arabidopsis. J. Biol. Chem. 2011, 286, 12066–12074. [Google Scholar] [CrossRef]
- Li, F.Q.; Murillo, C.; Wurtzel, E.T. Maize Y9 encodes a product essential for 15-cis-zeta-carotene isomerization. Plant Physiol. 2007, 144, 1181–1189. [Google Scholar] [CrossRef]
- Ohashi, K.; Tanaka, A.; Tsuji, T. Formation of the photosynthetic electron transport system during the early phase of greening in barley leaves. Plant Physiol. 1989, 91, 409–414. [Google Scholar] [CrossRef] [PubMed]
- Chen, H.L.; Li, C.R.; Liu, L.P.; Zhao, J.Y.; Cheng, X.Z.; Jiang, G.H.; Zhai, W.S. The Fd-GOGAT1 mutant gene lc7 confers resistance to Xanthomonas oryzae pv. oryzae in rice. Sci. Rep. 2016, 6, 26411. [Google Scholar] [CrossRef]
- Robison, M.M.; Ling, X.Y.; Smid, M.P.L.; Zarei, A.; Wolyn, D.J. Antisense expression of mitochondrial ATP synthase subunits OSCP (ATP5) and (ATP3) alters leaf morphology, metabolism and gene expression in Arabidopsis. Plant Cell Physiol. 2009, 50, 1840–1850. [Google Scholar] [CrossRef] [PubMed]
- Ardelean, I.; Matthijs, H.C.P.; Havaux, M.; Joset, F.; Jeanjean, R. Unexpected changes in photosystem I function in a cytochrome c6-deficient mutant of the cyanobacterium Synechocystis PCC 6803. FEMS Microbiol. Lett. 2002, 213, 113–119. [Google Scholar] [CrossRef]
- Zeng, F.R.; Qiu, B.Y.; Wu, X.J.; Niu, S.N.; Wu, F.B.; Zhang, G.P. Glutathione-mediated alleviation of chromium toxicity in rice plants. Biol. Trace Elem. Res. 2012, 148, 255–263. [Google Scholar] [CrossRef]
- Zhang, F.; Zhang, P.; Zhang, Y.; Wang, S.C.; Qu, L.H.; Liu, X.Q.; Luo, J. Identification of a peroxisomal-targeted aldolase involved in chlorophyll biosynthesis and sugar metabolism in rice. Plant Sci. 2016, 250, 205–215. [Google Scholar] [CrossRef]
- Patro, L.; Mohapatra, P.K.; Biswal, U.C.; Biswal, B. Dehydration induced loss of photosynthesis in Arabidopsis leaves during senescence is accompanied by the reversible enhancement in the activity of cell wall β-glucosidase. J. Photochem. Photobiol. B 2014, 137, 49–54. [Google Scholar] [CrossRef]
- Wu, Z.M.; Zhang, X.; Wang, J.L.; Wan, J.M. Leaf chloroplast ultrastructure and photosynthetic properties of a chlorophyll-deficient mutant of rice. Photosynthetica 2014, 52, 217–222. [Google Scholar] [CrossRef]
- Wu, Z.M.; Zhang, X.; He, B.; Diao, L.P.; Sheng, S.L.; Wang, J.L.; Guo, X.P.; Su, N.; Wang, L.F.; Jiang, L.; et al. A chlorophyll-deficient rice mutant with impaired chlorophyllide esterification in chlorophyll biosynthesis. Plant Physiol. 2007, 145, 29–40. [Google Scholar] [CrossRef]
- Gutiérrez-Nava, M.D.L.; Gillmor, C.S.; Jiménez, L.F.; Guevara-García, A.; León, P. Chloroplast biogenesis genes act cell and noncell autonomously in early chloroplast development. Plant Physiol. 2004, 135, 471–482. [Google Scholar] [CrossRef]
- Falbel, T.G.; Staehelin, L.A. Partial blocks in the early steps of the chlorophyll synthesis pathway: A common feature of chlorophyll b-deficient mutants. Physiol. Plant 1996, 97, 311–320. [Google Scholar] [CrossRef]
- Satou, M.; Enoki, H.; Oikawa, A.; Ohta, D.; Saito, K.; Hachiya, T.; Sakakibara, H.; Kusano, M.; Fukushima, A.; Saito, K.; et al. Integrated analysis of transcriptome and metabolome of Arabidopsis albino or pale green mutants with disrupted nuclear-encoded chloroplast proteins. Plant Mol. Biol. 2014, 85, 411–428. [Google Scholar] [CrossRef]
- Castelfranco, P.A.; Weinstein, J.D.; Schwarcz, S.; Pardo, A.D.; Wezelman, B.E. The Mg insertion step in chlorophyll biosynthesis. Arch. Biochem. Biophys. 1979, 192, 592–598. [Google Scholar] [CrossRef]
- Inagaki, N.; Kinoshita, K.; Kagawa, T.; Tanaka, A.; Ueno, O.; Shimada, H.; Takano, M. Phytochrome B mediates the regulation of chlorophyll biosynthesis through transcriptional regulation of ChlH and GUN4 in rice seedlings. PLoS ONE 2015, 10, e0135408. [Google Scholar] [CrossRef]
- Croce, R.; van Amerongen, H. Natural strategies for photosynthetic light harvesting. Nat. Chem. Biol. 2014, 10, 492–501. [Google Scholar] [CrossRef]
- Sridharan, G.; Daneau, E.; Fragata, M. Relationship between chlorophyll a fluorescence induction and oxygen evolution in barley (Hordeum vulgare) thylakoids treated with alpha-, beta-, and gamma-cyclodextrins. Can. J. Bot. 2002, 80, 741–751. [Google Scholar] [CrossRef]
- Górnaś, P.; Siger, A.; Juhņeviča, K.; Lācis, G.; Šnē, E.; Segliņa, D. Cold-pressed Japanese quince (Chaenomeles japonica (Thunb.) Lindl. ex Spach) seed oil as a rich source of α-tocopherol, carotenoids and phenolics: A comparison of the composition and antioxidant activity with nine other plant oils. Eur. J. Lipid Sci. Technol. 2014, 116, 563–570. [Google Scholar] [CrossRef]
- Sen, G.; Eryilmaz, I.E.; Ozakca, D. The effect of aluminium-stress and exogenous spermidine on chlorophyll degradation, glutathione reductase activity and the photosystem II D1 protein gene (psbA) transcript level in lichen Xanthoria parietina. Phytochemistry 2014, 98, 54–59. [Google Scholar] [CrossRef]
- Christensen, J.H.; Bauw, G.; Welinder, K.G.; Van Montagu, M.; Boerjan, W. Purification and characterization of peroxidases correlated with lignification in poplar xylem. Plant Physiol. 1988, 118, 125–135. [Google Scholar] [CrossRef]
- Vitali, A.; Botta, B.; Delle Monache, G.; Zappitelli, S.; Ricciardi, P.; Melino, S.; Petruzzelli, R.; Giardina, B. Purification and partial characterization of a peroxidase from plant cell cultures of Cassia didymobotrya and biotransformation studies. Biochem. J. 1998, 331, 513–519. [Google Scholar] [CrossRef]
- Bagnoli, F.; Danti, S.; Magherini, V.; Cozza, R.; Innocenti, A.M.; Racchi, M.L. Molecular cloning, characterisation and expression of two catalase genes from peach. Funct. Plant Biol. 2004, 31, 349–357. [Google Scholar] [CrossRef] [PubMed]
- Sakamoto, W.; Miyagishima, S.Y.; Jarvis, P. Chloroplast biogenesis: Control of Plastid Development, Protein Import, Division and Inheritance. Arab. Book 2008, 6, e0110. [Google Scholar] [CrossRef] [PubMed]
- Liu, X.; Yu, F.; Rodermel, S. An Arabidopsis Mutant with High Cyclic Electron Flow Around Photosystem I (Hcef) Involving the NADPH Dehydrogenase Complex. Plant Cell 2010, 22, 221–233. [Google Scholar]
- Chinnusamy, V.; Ohta, M.; Kanrar, S.; Lee, B.H.; Hong, X.; Agarwal, M.; Zhu, J.K. ICE1: A Regulator of Cold-Induced Transcriptome and Freezing Tolerance in Arabidopsis. Genes Dev. 2003, 17, 1043–1054. [Google Scholar] [CrossRef]
- Zhang, X.; Yazaki, J.; Sundaresan, A.; Cokus, S.; Chan, S.W.; Chen, H.; Henderson, I.R.; Shinn, P.; Pellegrini, M.; Jacobsen, S.E.; et al. Genome-Wide High-Resolution Mapping and Functional Analysis of DNA Methylation in Arabidopsis. Cell 2006, 126, 1189–1201. [Google Scholar] [CrossRef]

Disclaimer/Publisher’s Note: The statements, opinions and data contained in all publications are solely those of the individual author(s) and contributor(s) and not of MDPI and/or the editor(s). MDPI and/or the editor(s) disclaim responsibility for any injury to people or property resulting from any ideas, methods, instructions or products referred to in the content. |
© 2025 by the authors. Licensee MDPI, Basel, Switzerland. This article is an open access article distributed under the terms and conditions of the Creative Commons Attribution (CC BY) license (https://creativecommons.org/licenses/by/4.0/).