Article

A Lithium Battery Health Evaluation Method Based on Considering Disturbance Belief Rule Base

1
High-Tech Institute of Xi’an, Xi’an 710025, China
2
School of Computer Science and Information Engineering, Harbin Normal University, Harbin 150025, China
3
High-Tech Institute, Fan Gong-Ting South Street on the 12th, Qingzhou 262500, China
*
Authors to whom correspondence should be addressed.
These authors contributed equally to this work.
Batteries 2024, 10(4), 129; https://doi.org/10.3390/batteries10040129
Submission received: 5 March 2024 / Revised: 5 April 2024 / Accepted: 10 April 2024 / Published: 13 April 2024
(This article belongs to the Section Battery Performance, Ageing, Reliability and Safety)

Abstract

:
Lithium-ion batteries are widely used in modern society as important energy storage devices due to their high energy density, rechargeable performance, and light weight. However, the capacity and performance of lithium-ion batteries gradually degrade with the number of charge or discharge cycles and environmental conditions, which can affect the reliability and lifetime of the batteries, so it is necessary to accurately evaluate their health. The belief rule base (BRB) model is an evaluation model constructed based on rules that can handle uncertainties in the operation of lithium-ion batteries. However, lithium-ion batteries may be affected by disturbances from internal or external sources during operation, which may affect the evaluation results. To prevent this problem, this paper proposes a disturbance-considering BRB modeling approach that considers the possible effects of disturbances on the battery in the operating environment and quantifies the disturbance-considering capability of the assessment model in combination with expert knowledge. Second, robustness and interpretability constraints are added in this paper, and an improved optimization algorithm is constructed that maintains or possibly improves the resistance of the model to disturbance. Finally, using the lithium-ion batteries provided by the National Aeronautics and Space Administration (NASA) Prediction Centre of Excellence and the University of Maryland as a case study, this paper verifies that the proposed modeling approach is capable of constructing robust models and demonstrates the effectiveness of the improved optimization algorithm.

Graphical Abstract

1. Introduction

As an important part of modern power systems, lithium-ion batteries have undergone rapid development in electric vehicles, renewable energy, and other fields. Currently, there is a growing demand for lithium batteries in various industries. However, the performance and remaining life of the battery decrease as its usage time increases. Additionally, environmental factors such as temperature and humidity can harm the components in the battery, affecting its capacity. Therefore, it is particularly important to conduct in-depth research and effectively evaluate the health of lithium-ion batteries.
Several evaluation models for health status evaluation have been developed by researchers, and four common types of modeling approaches have been summarized. The data-driven approach involves the collection of large amounts of data, which are analyzed and modeled to discover patterns, relationships, and regularities. This approach typically uses data to guide decisions, predict future events, and optimize systems [1]. The advantage of data-driven modeling is that the patterns and laws of the system can be learned from the data to support more accurate predictions and decisions. However, in real systems, models based on data-driven approaches may be inconsistent or unfair across different datasets due to external factors, such as data limitations and system complexity. The knowledge-driven approach is a modeling methodology based on a priori knowledge and the experience of domain experts, which is aimed at better understanding and describing the behavior and relationships of complex systems [2,3,4]. The knowledge-driven modeling approach aims to enhance the performance and explanatory power of the model by leveraging the knowledge and experience of domain experts in the modeling process. However, this approach typically relies on a set of physical assumptions and a priori knowledge that may not hold in real systems. Model failure or loss of accuracy may be caused by these assumptions. The model-driven approach focuses on the use of formal models to guide the different phases of system development. The reliability and consistency of system development are improved by this approach, errors are reduced, and the system is made easier to maintain and evolve [5,6]. However, it also requires an investment of time and resources to learn and use modeling tools and techniques. For the hybrid-driven approach, the different modeling approaches mentioned above are combined with this modeling approach to overcome the limitations of a single approach and provide a more comprehensive and flexible solution to accommodate complex and diverse problems.
A modeling approach based on a hybrid-driven method was proposed by Yang et al. [7]. The traditional fuzzy rules are extended by integrating the belief rule framework, resulting in the construction of a belief rule base (BRB) model. This model uses the transparently interpretable evidential reasoning (ER) approach as its inference engine. BRB models are widely used in equipment health evaluation due to their strong interpretability. The health state evaluation of lithium batteries is a challenging field due to the large amount of uncertainty and ambiguous data that need to be dealt with. The BRB model can effectively integrate and process complex and inconsistent information, including data from multiple sensors and expert knowledge, and it can provide more accurate and reliable evaluation results through its belief assignment mechanism. This not only enhances the accuracy of the evaluation but also improves the ability to predict the health of the battery. Finally, the BRB model provides a more flexible and dynamic evaluation framework than traditional evaluation methods, allowing it to adapt to rapidly changing data environments and evolving battery technologies.
However, in real operating environments, Li-ion batteries are often affected by a variety of external disturbances, such as temperature variations, charge/discharge cycles, and changes in usage conditions. Fluctuations and changes in battery performance and health can be caused by these disturbances. Without considering the disturbance factors, the changes and fluctuations in the real environment may not be captured by the evaluation model, leading to biased evaluation results. In addition, the performance of the battery may be affected by the condition and operation of other components in the system. For example, the dynamic characteristics of the vehicle while driving may affect the onboard battery of an electric vehicle, and the performance of the battery may also be affected by the operational status of devices such as charge controllers and inverters in a solar energy storage system. There are certain variations and uncertainties in the manufacturing process of lithium-ion batteries, such as material selection and process parameters, which may result in different performance characteristics for the same battery model. In summary, the consideration of disturbance factors is critical to an accurate evaluation of the state of health of lithium-ion batteries, as it allows for a more comprehensive consideration of the true operating conditions of the battery under different environmental conditions, operating conditions, and system configurations, thus improving the accuracy and reliability of the evaluation.
Disturbances in lithium-ion batteries are typically small changes in input parameters or fluctuations caused by uncertainties in the model structure or parameters. Various BRB models were developed by Han et al. [8,9] to evaluate lithium-ion battery health. Among the existing models, a complex system evaluation model considering disturbed ER rules was constructed by Tang et al. [10], a sensor-disturbed complex system based on the BRB model was constructed by Lian et al. [11], and a new multi-source uncertainty-informed BRB expert system was constructed by Feng et al. [12] to solve the problem of stochastic environmental disturbances. However, in the existing research, there is little in the literature on the robustness of the model to disturbances, and a model that is robust to disturbances should maintain a good performance state when disturbances occur. Therefore, a method is needed to measure the disturbance resistance of the model. The robustness of the BRB model was defined by Cao et al. [13], and the robustness of the BRB model was analyzed from four aspects. However, a reasonable method to solve the problem of weak robustness in the input conversion part was not provided. In this paper, based on the study by Cao, a modeling approach that takes into account the disturbance of lithium-ion batteries is proposed, which aims to be able to analyze the decisions made by the model when it encounters a disturbance and to measure the disturbance-resistant capability of the model. In addition, since existing optimization approaches do not consider robust optimization, this paper proposes an improved optimization algorithm that aims to improve the disturbance resistance of the model. In summary, the modeling approaches proposed in this paper help to improve battery management systems and provide a new way of thinking for researchers in battery health evaluation. The specific contributions are as follows:
(1)
The operating environment of lithium-ion batteries is complex, so disturbances are introduced, and the battery health state evaluation model of the BRB model considering disturbances is established, which is capable of measuring its disturbance-resistant capability.
(2)
An improved optimization algorithm is proposed that embeds robustness and interpretability constraints to effectively improve the robustness of the model and maintain the interpretability of the BRB model itself.
The problem description of the BRB model is presented in Section 2, the construction of the disturbance BRB model is presented in Section 3, the optimization algorithm is presented in Section 4, the case study is presented in Section 5, and, finally, the conclusion is given in Section 6.

2. Problem Formulation and Basic BRB Construction

The main problem addressed in this paper is described in Section 2.1, and the underlying BRB modeling process is given in Section 2.2.

2.1. Formulation of the Problem

In the BRB process, the reference values of the prior attributes are sampled by the system, and the sampled data are obtained for rule aggregation and ER reasoning. The reference values of attributes in the antecedent and posterior of the prior rule of the BRB model are derived from expert knowledge, which comes from the experience summarized by experts who analyze the mechanism of lithium-ion batteries and record the data in long-term practice; therefore, the BRB model itself has strong interpretability. However, heat is generated by lithium-ion batteries during charging and discharging. Poor heat dissipation design or high-temperature environments can cause the temperature to become too high, leading to disturbances in the batteries, which can reduce the reliability of BRB systems built with expert knowledge. For example, the growth of a solid electrolyte interface (SEI) layer was found to be a key factor in battery performance in a study by S. Edge et al. [14]. This layer typically forms during the first cycle of the battery and results in a capacity reduction of approximately 10%. As the battery ages, the thickness of the SEI layer increases for several reasons, including diffusion of solvent molecules through the existing SEI and newly exposed electrode surfaces due to cracking and deposition of by-products. These effects increase the overall impedance of the cell, leading to a reduction in performance. High temperatures can accelerate the growth of the SEI layer, while high currents can lead to particle rupture and new SEI formation. Lithium plating is also an issue, particularly at low temperatures or during fast charging, where lithium metal forms on the surface of the negative electrode rather than being inserted into it. These factors ultimately affect the capacity and performance of the battery. The above-described effects inside the battery due to environmental changes, can be summarized as disturbances in the battery due to external or internal causes. In this section, two problems with evaluating the presence of lithium-ion batteries are described:
1.
When a disturbance occurs in a lithium-ion battery, the construction of a disturbance evaluation model, which combines expert knowledge to analyze the reliability of the model in the case of a disturbance, can be expressed as follows:
[ y , y ] = ξ M S E ( [ X 1 , X 1 ] , [ X 2 , X 2 ] , , [ X M , X M ] , δ )
where y represents the predicted value of the model, while y′ represents the predicted value after the disturbance. ξ M S E denotes the function of the computational process of the model, X i denotes the input vector of the ith input attribute, X i denotes the input after the disturbance, and δ denotes the expert knowledge.
2.
Evaluating the Disturbance Resistance of Established Lithium-Ion Battery Evaluation Models. Lithium-ion battery evaluation models may be affected by disturbances from internal and external sources, which can impact their reliability. Therefore, it is necessary to design an effective approach to understand the disturbance resistance of the model and minimize its effect on reliability.
ϑ = Γ ( max ( ϑ 1 , ϑ 2 , ϑ 3 , ϑ 4 ) | T ( n ) )
where ϑ denotes a metric that measures the disturbance resistance of the model, Γ ( · ) denotes the function that calculates ϑ , ϑ 1 ϑ 4 are the four parts of the disturbance resistance metric of the model, and T(n) is the lithium-ion battery data collected at the nth moment.

2.2. Modeling Framework for the Basic BRB Model

The BRB model is a set of expert systems consisting of IF–THEN rules, where each rule contains a condition part and a conclusion part. Taking the kth rule as an example, the following can be obtained:
R k : I F   x 1   i s   A 1 k x 2   i s   A 2 k   x M   i s   A M k T H E N   { ( D 1 , β 1 , k ) , ( D 2 , β 2 , k ) ( D N , β N , k ) } ( n = 1 N β N , k 1 ) , w i t h   r u l e   w e i g h t   θ k ( k = 1 , 2 , , L )   a n d   a t t r i b u t e   w e i g h t s   δ i ( i = 1 , 2 , , M )
where A i k is the referential value of the antecedent attribute X 1 , , X M . β N , k is the belief degree of the result D N . θ k is the weight of the kth belief rule. δ i is the weight of attribute X i . L is the number of rules in the belief rule base. The kth rule is said to be complete if n = 1 N β N , k = 1 , otherwise it is not complete.
The inference steps of a BRB model a with an ER inference engine are as follows.
Step 1 (Input information transformation): The quantitative and qualitative information can be transformed into a belief distribution by a membership function; that is, the membership degree of each input value corresponding to the reference value is calculated. In this paper, the triangular membership function is used as the input transformation function of the BRB model, which is expressed as follows:
α i , j = ( Y i , j + 1 x i ) · ( Y i , j + 1 Y i , j ) 1 Y i , j x i Y i , j + 1 , j = 1 , 2 , , J i 1 α i , j + 1 = 1 α i , j Y i , j x i Y i , j + 1 , j = 1 , 2 , , J i 1 α i , s = 0 s = 1 , 2 , , J i , s j , j + 1
The final belief distribution is described as follows:
S ( x i ) = { ( A i , j , α i , j ) , i = 1 , , M ; j = 1 , , J i }
where A i , j represents the jth reference value corresponding to the ith input, which is a semantic value, Y i , j represents the reference value corresponding to A i , j , and α i , j is the membership degree of the corresponding reference value.
Step 2 (Rule activation weight): The rule activation weights are calculated as follows:
ω k = θ k i = 1 M ( α i k ) δ i ¯ / l = 1 L θ l i = 1 M ( α i k ) δ i ¯ , δ i ¯ = δ i max i = 1 , , M { δ i }
where θ k [ 0 , 1 ] is the rule weight of the kth rule, δ i ¯ is the normalized weight, and α i k represents the belief degree of A i , j k in the kth rule.
Step 3 (ER iterates over aggregation rules):
Step 3.1: The activation rule belief degree is transformed to the basic probability mass (bpm), which is expressed as follows:
F n , k = ω k β n , k , F D , k = 1 ω k n = 1 N β n , k , F ¯ D , k = 1 ω k , F ˜ D , k = ω k ( 1 n = 1 N β n , k )
where F n , k represents the basic probability setting for the evaluation result D n , and F D , k represents the basic probability setting for the set D = { D 1 , D 2 , , D N } , that is, the basic probability F D , k = F ¯ D , k + F ˜ D , k that is not set to any evaluation result D n .
Step 3.2: After iteratively combining the first k rules using the D-S criterion, the following formula is obtained:
F n , I ( k + 1 ) = K I ( k + 1 ) ( F n , I ( k ) F n , k + 1 + F n , I ( k ) F D , k + 1 + F D , I ( k ) F n , k + 1 )
F ˜ D , I ( k + 1 ) = K I ( k + 1 ) ( F ˜ D , I ( k ) F ˜ D , k + 1 + F ˜ D , I ( k ) F ¯ D , k + 1 + F ¯ D , I ( k ) F ˜ D , k + 1 )
K I ( k + 1 ) = 1 [ 1 n = 1 N t = 1 t n N F n , I ( k ) F t , k + 1 ]
β ^ n = F n , I ( L ) / 1 F ¯ D , I ( L ) , β ^ D = F ˜ D , I ( L ) / 1 F ¯ D , I ( L )
where β ^ n represents the belief degree relative to the evaluation result D n , β ^ D represents the belief degree that is not set to any evaluation result D n , and β ^ D + n = 1 N β ^ n = 1 .
Step 4: The final output distribution is generated based on the belief degree of the evaluation results:
S ( x ) = { ( D n , β ^ n ) , n = 1 , , N }
The expected utility of S ( x ) in Equation (12) is determined by the utility of a single evaluation result D n , denoted as μ ( D n ) :
μ ( S ( x ) ) = n = 1 N μ ( D n ) β n

3. Modeling of the Disturbance BRB

A robustness analysis of a model is conducted to determine the maximum capacity of the model to resist disturbances, and the concept of Lipschitz stabilization has been introduced to the model by many studies to explore its resistance to disturbances [15,16,17,18,19].
Mathematically, Lipschitz stability is a property of continuous functions or mappings where there exists an upper bound on the difference between the values of the function f(x) when the inputs to the function are slightly changed. Specifically, a function is Lipschitz-stable over its domain of definition if there exists a constant L(L > 0) for which the following inequality holds for all x 1 and x 2 .
f ( x 1 ) f ( x 2 ) L · x 1 x 2
This means that the difference between the function values is controlled for small changes in the input, so the Lipschitz stability can be used to describe the smoothness and robustness of the function. In the BRB model, the training and output of the model can be regarded as a process of function processing, and the robustness corresponds to the ability of the model to resist disturbances. Therefore, the Lipschitz stability of a BRB model can be defined as follows:
For T , N , the condition of Lipschitz stability on T N is that there exists a minimum constant ϑ B R B [ 0 , ] , such that:
j = 1 N y j y j ϑ B R B × i = 1 T x i x i
where, for all ( x 1 , , x T ) , ( x 1 , , x T ) T , ( y 1 , , y N ) , ( y 1 , , y N ) N   x i is the input value x i corresponding to the generated disturbance value. y j denotes the result produced by the disturbance value x i ( i = 1 , , T ; j = 1 , , N ) . · is the Manhattan distance.
In lithium batteries, disturbances often involve small changes in the inputs or parameters of the model, so the disturbance data in this paper are simulated by adding a disturbance factor to the data. The function for generating the disturbed data is as follows:
x = x + Δ × r a n d o m ( 1 , 1 )
where Δ denotes the disturbance factor, and random(−1,1) denotes a random value between −1 and 1. Since the size of the disturbance factor directly affects the prediction results of the model, the disturbance factor should be set according to the actual system.
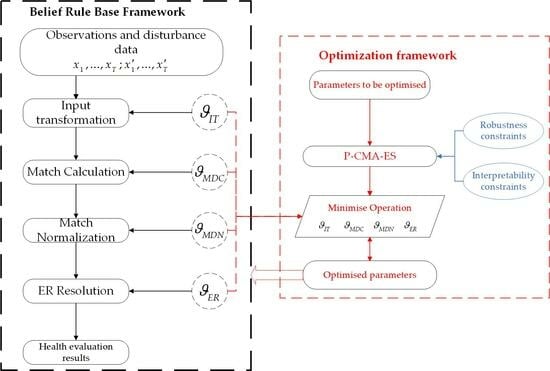
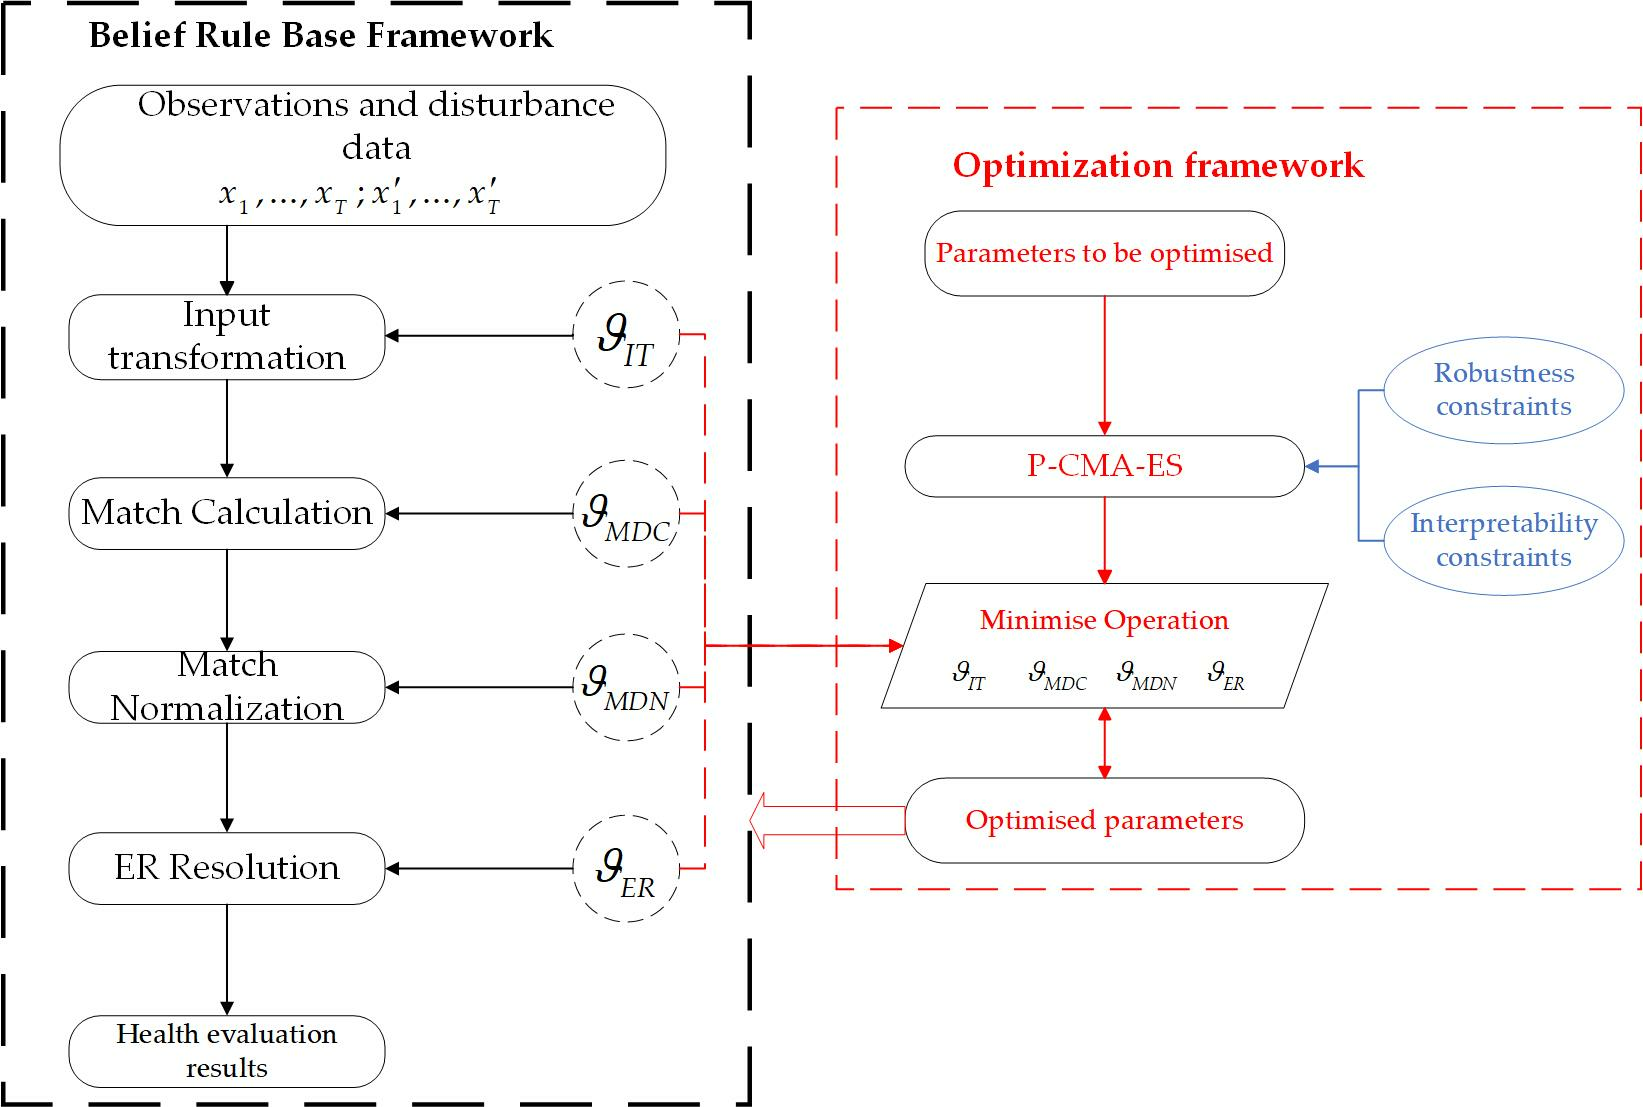
The BRB disturbance analysis process is divided into four specific steps, and the analysis framework is shown in Figure 1, which includes (1) input transformation, (2) matching degree calculation, (3) matching degree normalization, and (4) rule aggregation. The Lipschitz constants of these parts are denoted by ϑ I T , ϑ M D C , ϑ M D N , ϑ E R , respectively [13]. The framework of the disturbance analysis for the whole model is given in Figure 1.
Step 1: In the actual operation of lithium-ion batteries, the collected data may fluctuate due to disturbances, and ϑ I T represents the maximum fluctuation that can be generated by the BRB model during input transformation. The ith input message x i and the corresponding disturbance input message x i , ϑ I T is calculated as follows:
ϑ I T i = ( Y j γ j + Y j + 1 Y j + 1 ) · ( x i x i ) 1   Y j x i , x Y j + 1 ( Y j Y j + Y j + 1 Y j + 1 ) · ( x i x i ) 1   Y j x i Y j + 1 , Y j x i Y j + 1 ( j j ) ϑ I T = max { ϑ I T i | i = 1 , , M }
where Y j , Y j are the membership degrees of the jth attribute reference value A j ( j = 1 , , J i ) corresponding to x , x , respectively.
Step 2: The Lipschitz constant is calculated for the individual degree of matching α i k . The input data of the lithium-ion battery are transformed to obtain the belief degree, and the corresponding rule is activated based on the belief degree. The matching degree between the activation rule and the belief degree is denoted by ϑ M D C . Taking the kth rule as an example, the distance between the belief degree and the corresponding activation rule in the rule space is measured, and the closer the distance is, the greater the matching degree.
ϑ M D C i = w k α i k = δ i · ( α i k ) δ i 1 · j = 1 j i J i ( α j k ) δ j ϑ M D C = max { ϑ M D C i | i = 1 , , M }
where δ i is the normalized weight of the ith attribute, and α i k is the vector of matching degrees produced by the reference values in the kth rule.
Step 3: The normalization calculation of the matching degree is conducted next. The matching degrees are normalized to better measure the match between attributes and rules.
ϑ M D N i k = w k α i l = w k h = 1 h k L w h α i h ( h = 1 L w h α i h ) 2 l k w k w l α i k ( h = 1 L w h α i h ) 2 l k ϑ M D N = max { ϑ M D N i k | i = 1 , , M , k = 1 , , L }
Step 4: The Lipschitz constant calculation of the inferred result β n is next conducted for the activation weight ω k . The relationship between the degree of belief obtained after the ER inference and the L rule is denoted by β n . The degree of fluctuation of the degree of belief, calculated by combining the reference value given by the expert, is denoted by ϑ E R . The smaller the value of ϑ E R , the more limited the response to small disturbances in the belief degree space, resulting in a relatively small change in belief degree.
C 1 ( n ) = l = 1 l k L ( ω l ( β n , l 1 ) + 1 ) , C 2 ( n ) = l = 1 L ( ω l ( β n , l 1 ) + 1 ) ; R 1 = l = 1 l k L ( 1 ω l ) , R 2 = l = 1 L ( 1 ω l )
ϑ E R n , k = | β n ω k | = [ ( β n , k 1 ) C 1 ( n ) + R 1 ] × [ n = 1 N C 2 ( n ) N R 2 ] [ C 1 ( n ) R 2 ] × [ n = 1 N ( β n , k 1 ) C 1 ( n ) + N R 1 ] [ n = 1 N C 2 ( n ) N R 2 ] 2 ϑ E R = max { ϑ E R n , k | n = 1 , , N , k , , L }
Step 5: The overall resistance to disturbance of the model built based on the health assessment of lithium-ion batteries is described as follows.
ϑ M o d e l = ϑ I T × ϑ M D C × ϑ M D N × ϑ E R
The overall disturbance resistance of the model is denoted by ϑ M o d e l .
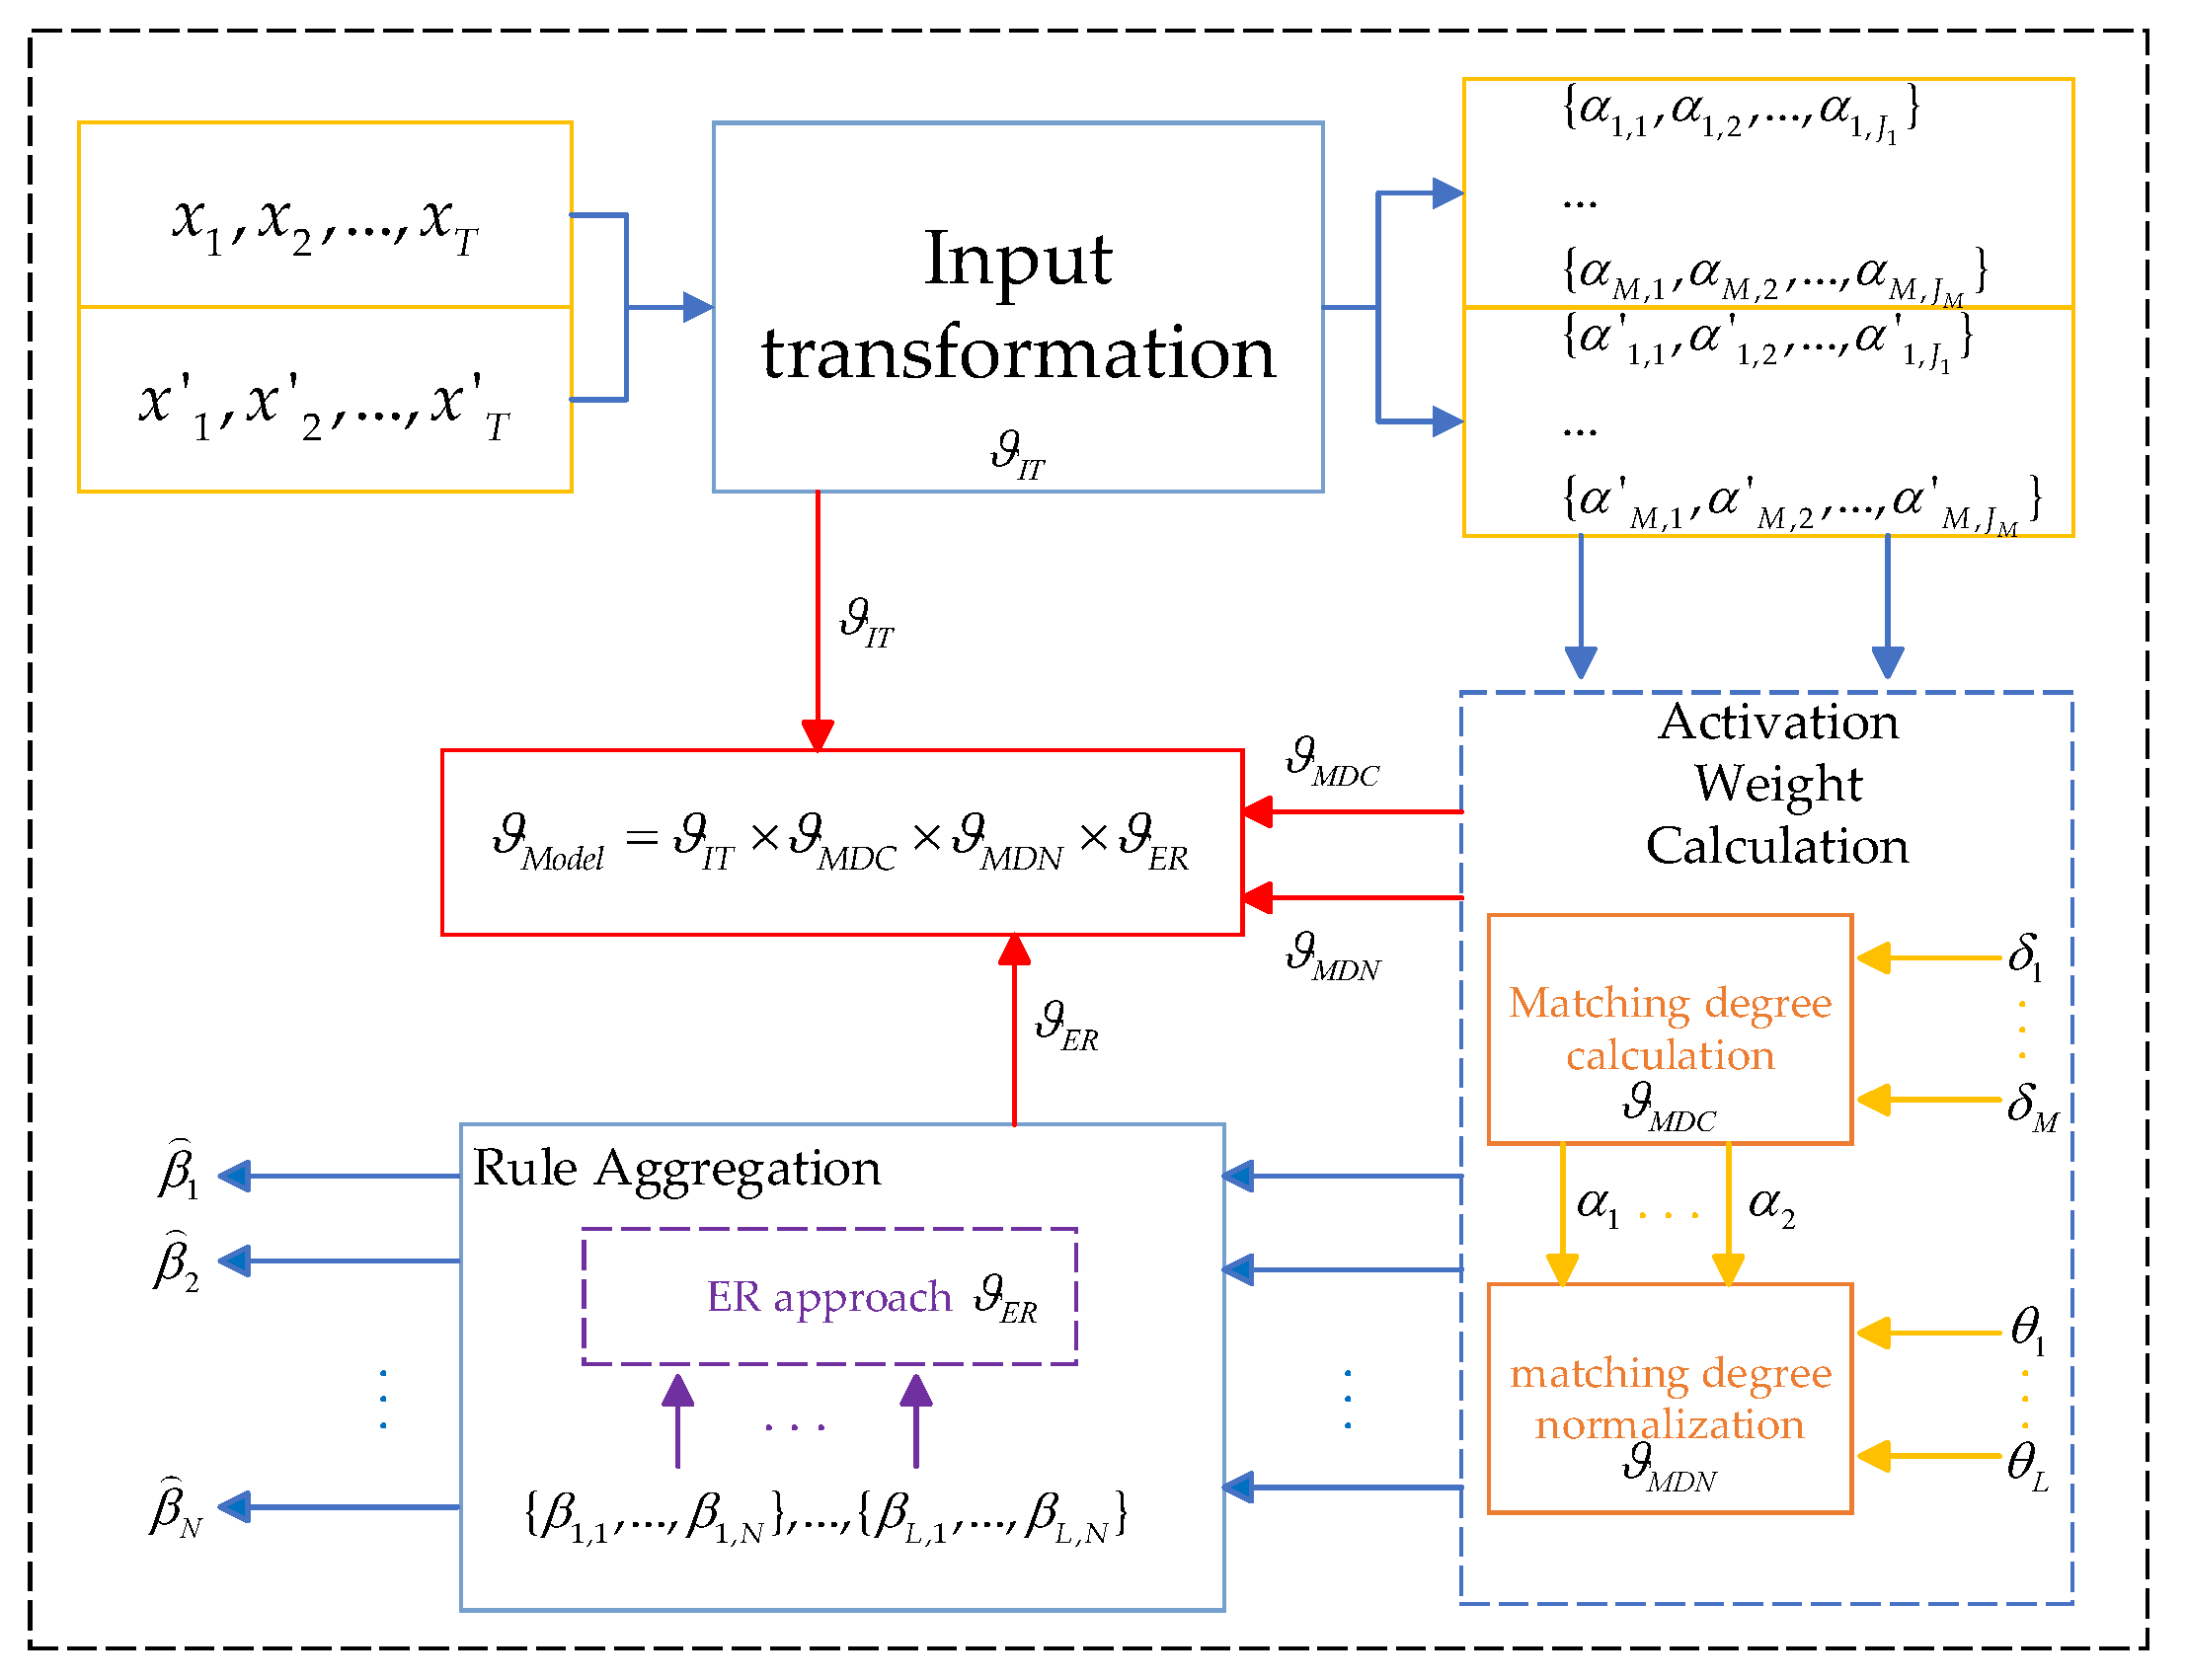
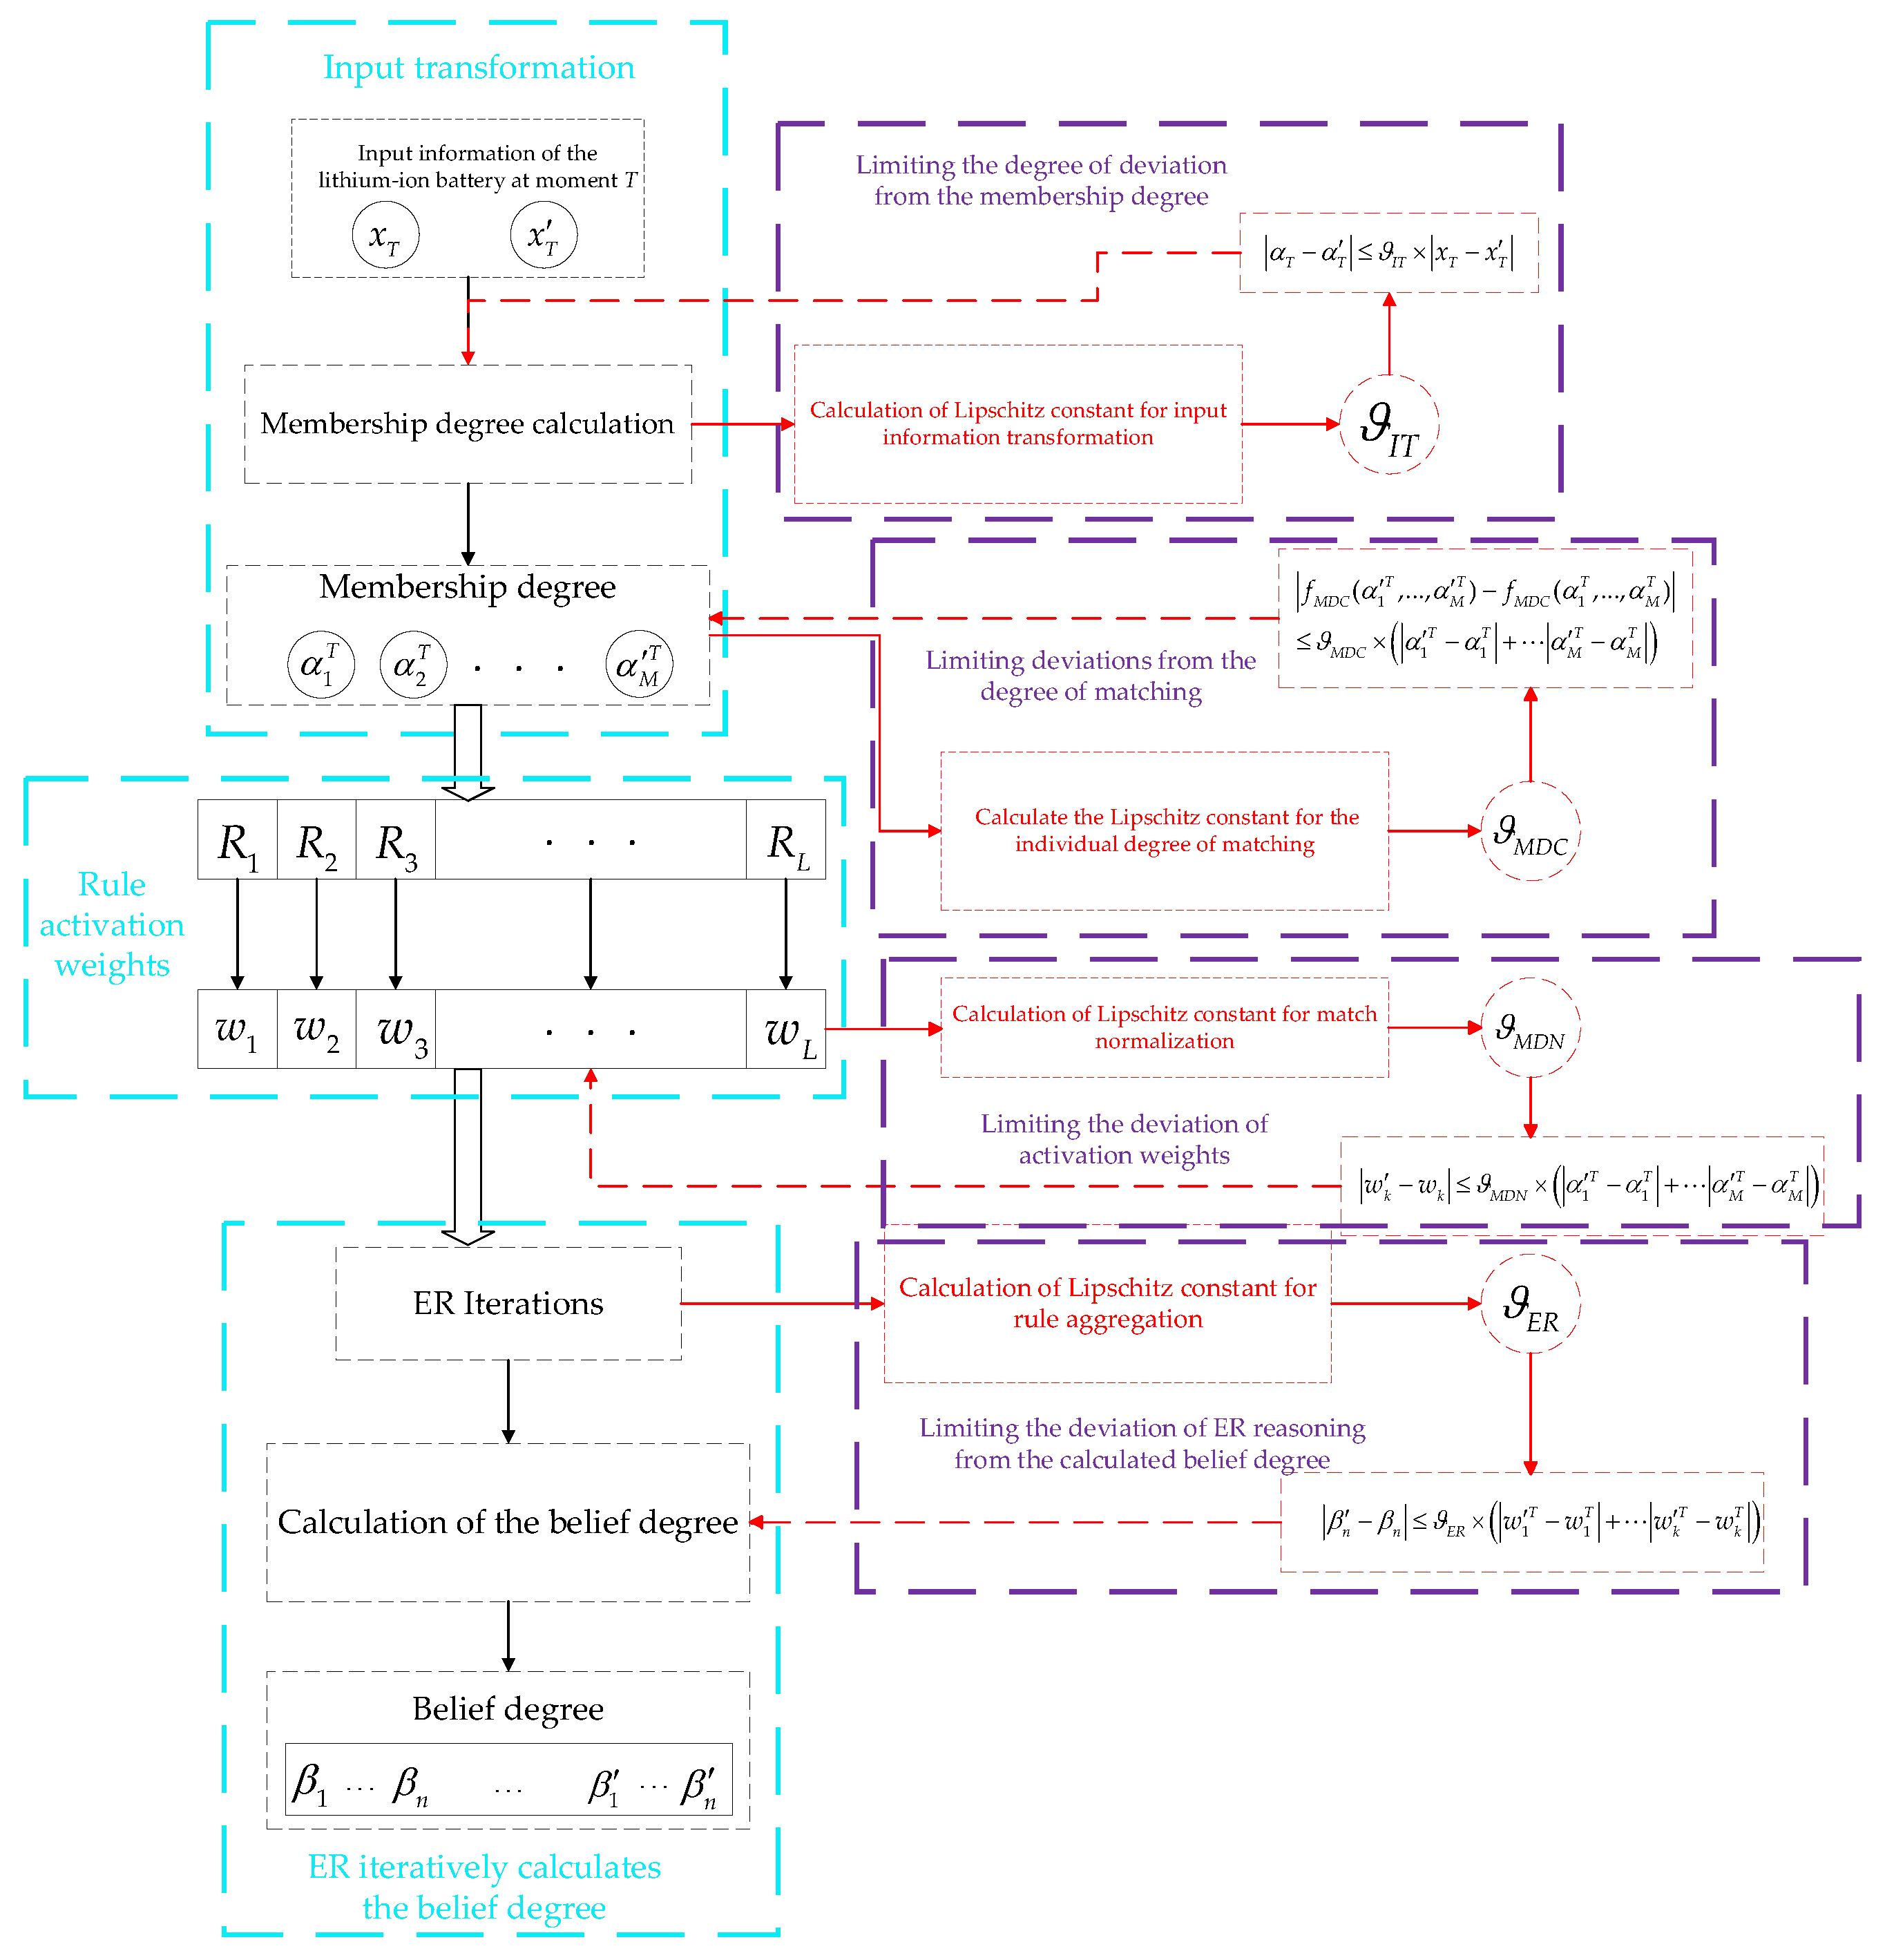
To facilitate the understanding of the decision processing made by the disturbance BRB model when encountering a disturbance in practical applications, this paper simulates that the lithium-ion battery is disturbed by the data x T collected at the moment of T, where the disturbed data is denoted as x T , and the overall operation process of the model is shown in Figure 2.
The input data at the Tth moment and the disturbed data are calculated by the membership degree α j T , α j T ( j = 1 , , J i ) corresponding to the attribute reference value through the membership degree function, and the model calculates the Lipschitz constant ϑ I T for the input transformation according to Equation (17), and combined with the definition of Lipschitz stabilization, the membership degree calculated from the input x T after the disturbance is limited by ϑ I T and thus does not deviate too much.
The membership degree is calculated from the membership function, which further activates the corresponding rule and generates the corresponding matching degree, ϑ M D C , is used to limit the matching degree generated from the disturbance data from deviating excessively, where f M D C ( α 1 T , , α M T ) = i = 1 M ( α i T ) δ ¯ i denotes the matching degree calculation. The calculated degree of matching corresponds to the activation weights of the rules activated by the degree of membership after performing the normalization of Equation (6) on L rules. ϑ M D N denotes the maximum value of the activation weights after the disturbance that differs from the activation weights generated by the original data at the time of normalization.
After activating the corresponding rule by the membership degree, the final belief degree is calculated iteratively using the ER of Equations (7)–(11), and ϑ E R calculated by Equations (20)–(21) represents the maximum degree of deviation from the value of the belief degree obtained from the disturbance data after the ER calculation.
Remark 1. 
The maximum value of the Lipschitz constants for each part of the model is determined by the model itself and has no relation to the disturbance itself, and ϑ I T , ϑ M D C , ϑ M D N , ϑ E R indicate that in the calculation of each of the four parts, the disturbed data will fluctuate due to the effect of Lipschitz stabilization and thus be limited to fluctuate within a certain range. ϑ B R B denotes the Lipschitz constant of the model, i.e., the input disturbed data produce the maximum value of the final output of the maximum value of the deviation from the belief degree. Therefore, the smaller the Lipschitz constant, the smaller the range of fluctuations that can be produced by the disturbance data, and the more resistant the model is to disturbances.

4. Model Optimization Strategy

In this paper, the P-CMA-ES (projection covariance matrix adaptive evolution strategy) [20,21,22,23] is used as the global optimization algorithm. Real-time performance is usually required to evaluate the health of lithium-ion batteries, especially under dynamic operating conditions. The fast convergence capability of the P-CMA-ES means that a near-optimal solution can be found in a relatively short period, providing timely information about the health of the battery and enabling timely action to be taken.
For accurate prediction of battery health by the model, accuracy is chosen as the global optimization objective of the model in this paper. The effectiveness of the BRB model in matching the predicted Li-ion battery values to the actual system values is quantified using the mean square error (MSE). The optimization objectives are described as follows:
min   ξ M S E ( Ω ) = 1 T t = 1 T ( y y ^ ) 2 , Ω = { γ , β , θ , w } s t . n = 1 N β n , k = 1 , k = 1 , , L 0 β n , k 1 , n = 1 , , N ; k = 1 , , L 0 θ k 1 , k = 1 , , L 0 w i 1 , i = 1 , , M
where y is the predicted value of the model output, y ^ is the true value of the system, and Ω is the set of parameters to be optimized.
According to Equation (18), the Lipschitz constant ϑ I T can reach a maximum value of 2 / ( Y j + 1 Y j ) when α j = 1 , α j + 1 = 0 , α j = 1 , α j + 1 = 0 . This value is not affected by the disturbance but is determined solely by the reference value of the input attribute, which is typically derived from the experience accumulated by experts in the field over an extended period. To address this problem, an improved P-CMA-ES optimization algorithm is proposed in this paper to construct a constraint that considers the disturbance resistance of the model. The optimization steps are as follows.
Step 1 (Initialize the optimization target parameters): The specific optimization parameters are the input attribute reference values, belief degree, rule weight, and attribute weight. The set of target parameters can be expressed as:
Ω 0 = { Y 1 , 1 , , Y M , J M , β 1 , 1 , , β N , L , , θ 1 , , θ L , , w 1 , , w M }
Step 2 (Sampling): The data of each generation are obtained by sampling, denoted as follows:
ρ i s + 1 ~ Ω s + ε s N ( 0 , Q s ) , i = 1 , , h
where ρ i s + 1 is the ith solution in the s + 1th generation optimization. ε s is the step size. Ω s is the mean of the search distribution for generation s. Q s is the covariance matrix. N ( · ) denote the normal distribution function, where h is the number of offspring.
Step 3 (Robustness and interpretability constraints): After analyzing the disturbance of the model, a disturbance metric of the model, denoted as ϑ M o d e l , is calculated. Due to undesirable disturbances in the operation of lithium-ion batteries, the data may fluctuate when collected by a researcher. Input transformation is considered the most important process in the calculation of membership degrees within a BRB expert system. It directly affects the calculated membership degree, which in turn affects the activation of rules and ER inference. Cao [13] noted that the Lipschitz constant of the input transformation is too large, resulting in a decrease in the disturbance resistance of the model. Therefore, it is necessary to design an optimization method to improve the disturbance resistance of the model during the input transformation process.
Y i , j 1 η i , j Y i , j η i , j + Y i , j + 1 ( i = 1 , , M , j = 1 , , J i ) η i , j Y ˜ i , j η i , j + ( i = 1 , , M , j = 1 , , J i )
where η i , j and η i , j + are the lower and upper limits of Y i , j , respectively, as determined by experts in connection with the actual operating state of the lithium-ion battery, and Y ˜ i , j is the optimization result of the reference value.
In addition, the knowledge and logical relationships in the data or problem domain are described by the BRB model through a set of rules. Compared to other machine learning models, BRB models are highly interpretable [24,25,26]. However, existing research has shown that the interpretability of the model is disrupted by the optimization process. For instance, if there are three outcomes with semantic values of poor, medium, and good, the belief degree obtained by the BRB model after ER parsing may assign belief degrees of 0.45 to good and bad and a belief degree of 0.1 to medium. Assigning a high degree of belief to two conflicting semantic values is impractical. Therefore, constraints are imposed to ensure the interpretability of the model, and these are expressed as follows:
β n , k ~ ϖ n , k ( n = 1 , , N , k = 1 , , L ) ϖ n , k { { β 1 , k β 2 , k β N , k } o r { β 1 , k max ( β 1 , k , β 2 , k , ) β N , k } o r { β 1 , k β 2 , k β N , k } }
where ϖ n , k denotes the belief degree of the nth result in the kth rule under constraints.
Step 4 (Projection operation): The candidate data are projected onto a feasible hyperplane as follows:
ρ i s + 1 ( 1 + η e × ( τ 1 ) : η e × τ ) = ρ i s + 1 ( 1 + η e × ( τ 1 ) : η e × τ ) V T × ( V × V T ) 1 × ρ i s + 1 ( 1 + η e × ( τ 1 ) : η e × τ ) × V
where V = [ 1 , , 1 ] 1 × N is an all-unity N-dimensional row vector, and η e = 1 , , N denotes the number of constrained variables. τ = 1 , , N + 1 is the number of equality constraints.
Step 5 (Update the mean iteratively):
Ω s + 1 = i = 1 ϕ ω i ρ i : h s + 1
where ϕ is the offspring population size, and ω i ( i = 1 , , ϕ ) is the weight coefficient. ρ i : h s + 1 is the ith solution among the h solutions of generation s + 1.
Step 6 (Update the covariance matrix):
Q s + 1 = ( 1 e 1 e 2 ) Q s + e 1 P e s + 1 ( P e s + 1 ) T + e 2 i = 1 ι ω i ( K i : h s + 1 θ s ξ s ) × ( K i : h s + 1 θ s ξ s ) T
where ξ s represents the step size of generation s. P e s + 1 is the evolutionary path for the s + 1th generation. e 1 , e 2 are the learning rates. θ s is the number of offspring at generation s. K i : h s + 1 denotes the ith solution vector among the h solution vectors under generation s + 1.
Finally, the above six-step process is recursively executed until the optimization is complete.

5. Case Study

In this section, the proposed BRB disturbance model is used to analyze the health of a lithium-ion battery in a practical study. The validity of the disturbance model and the reasonableness of the improved optimization algorithm are confirmed.

5.1. Study Background

The case data were obtained from a dataset of aging data for 18650 lithium-ion batteries provided by the NASA Predictive Center of Excellence. This dataset uses battery model B0006, which is primarily used to measure the SOC (state of health) and the RUL (remaining useful life). The battery data were obtained by testing the battery under operating conditions at a room temperature of 24 °C. The battery was first charged in constant-current (CC) mode at 1.5 A until the battery voltage reached 4.2 V, and it was then charged in a constant-voltage (CV) mode until the charge current was reduced to 20 mA. After the battery reached its maximum capacity, the battery was discharged in a constant-current (CC) mode at 2 A until the battery voltage was reduced to 2.5 V. The charging and discharging process was then repeated until the battery reached the end of life (EOL) criterion, i.e., a 30% decrease in nominal capacity (from 2 Ah to 1.4 Ah).
Combined with the existing research on Li-ion battery modeling, 167 datasets were selected for this experiment. The constant-current stage (CC), time-CC, of the voltage increase and the constant-voltage stage (CV), time-CV, were used as the two prerequisite reference attributes of the BRB model, and the changes in the two stages with the number of cycles are shown in Figure 3. The corresponding variation in the battery capacity is shown in Figure 4.

5.2. BRB Model Construction for Lithium-Ion Battery Health State Evaluation

Based on relevant research and expert knowledge, each prerequisite attribute was categorized into four semantic values, namely, very long (VL), long (L), normal (N), and short (S). The reference values and corresponding attribute weights of the four semantic values are shown in Table 1. Based on the battery capacity degradation trend shown in Figure 4, the experts classified the health status into four levels: completely safe (CS), safe (S), little bad (LB), and very bad (VB), and the corresponding reference values are shown in Table 2. Based on the definition of expert knowledge, the rules of the BRB model used to evaluate the health status of lithium batteries can be expressed as follows:
R k : I F   T i m e - C C   i s   A 1 k T i m e C V   i s   A 2 k , T H E N ( D 1 , β 1 k ) , , ( D 4 , β 4 k ) , w i t h   r u l e   w e i g h t   θ k   a n d   a t t r i b u t e   w e i g h t s   δ i ( i = 1 , 2 , k = 1 , , 16 ) , ( n = 1 N β n k 1 )
The initial BRB model constructed from expert knowledge is denoted as BRB0. The initial rule base is given in Table 3, and these values are the initial judgments of the experts.

5.3. Comparative Experiment

In this study, the training set was randomly selected for 70% of the 165 datasets, and the test set was randomly selected for 30%, for a total of 500 training rounds. To verify the effectiveness of the disturbance BRB model constructed in this paper, the disturbance BRB model constructed based on expert knowledge and using the improved optimization algorithm is denoted as BRB-RI. In addition, to illustrate the reasonability of the improved optimization algorithm, the model constructed with the conventional optimization algorithm (which only aims at accuracy) is referred to as BRB-M.

5.3.1. Comparative Analysis of Model Accuracy and Interpretability

The interpretability of the BRB model consists of the fact that the structural parameters of the model should have corresponding meanings, and the initial reference values given by the experts are the reference values summarized by experts who have been practicing in the field of lithium-ion batteries for a long time, so the initial reference values themselves have strong interpretability. The rule distributions of the three models for lithium-ion battery health evaluation are shown in Figure 5, and it can be seen that the rules of the BRB-RI model highly approximated the expert knowledge, while a large deviation from the expert knowledge in the rules was observed in the BRB-M model due to the lack of constraints on interpretability. That is, a significant loss of interpretability of the rules was experienced by the BRB-M model during the optimization process, while better interpretability was maintained by the BRB-RI model.
The belief degree distributions of the three models are shown in Figure 6, such as the black circle in the BRB-M model. The belief degree distribution of the model deviated greatly from the expert knowledge, while a clearer description of the knowledge was provided by the BRB-RI model. In addition, the optimized attribute weights of the three models are shown in Table 4, which shows that the value of expert knowledge was more closely approximated by the BRB-RI model under the interpretability constraints, while the expert knowledge somewhat deviated from that of the BRB-M model. The combined analysis shows that the improved optimization algorithm used for the BRB-RI model has significantly improved interpretability.
The accuracy of the BRB model describes the difference between the predicted value of the model output and the actual value of the real system, and in this paper, the MSE was used as a measure of accuracy. The MSE values of the three models are shown in Table 5, and the corresponding health evaluation results are shown in Figure 7.
The trend of battery capacity change can be roughly predicted by expert knowledge, indicating the effectiveness of expert knowledge in evaluating the state of health of lithium batteries. The best predictive performance of the model was attributed to the BRB-M model, as it is optimized solely for accuracy without being constrained by interpretability and disturbance resistance. It is worth mentioning that good prediction results was still exhibited by the BRB-RI model under the constraints, indicating that the improved optimization algorithm did not cause too much of a loss in accuracy.

5.3.2. Comparative Analysis of Model Robustness

In the construction of the disturbance model, Lipschitz stabilization is introduced as the ability of the BRB model to resist disturbances, and the size of the Lipschitz constant directly determines the resistance of the model to disturbances. The values of the Lipschitz constants for the three models of this experiment are shown in Table 6.
As shown in Table 6, a significant decrease in the ϑ B R B value of the BRB-RI model was observed, indicating that the robustness constraints in the improved optimization algorithm could effectively limit the range of disturbances to the model during the optimization process, thereby increasing the robustness of the model to disturbances and resulting in a decrease in the value of the Lipschitz constant for each part. Since the BRB-M model aims only at accuracy in the optimization process, there was a loss of disturbance resistance in terms of matching calculation and normalization, which is one of the reasons for the large ϑ B R B value.
In this paper, disturbance factors of 0.001, 0.0025, 0.005, and 0.0075 were applied to the input data, and the calculated evaluation results of the models are shown in Figure 8 for the different disturbance data. As shown in Figure 8a, anomalous fluctuations in the prediction were observed for both the BRB0 model and the BRB-M model in the 0–10 datasets (red circles), while the fluctuations in the BRB-M model were more pronounced in the 32–55 datasets (Figure 8b). In addition, the BRB-M model fluctuations had a greater impact on the 32–41 datasets (red circles), during which the accuracy of the model decreased, indicating that the disturbance resistance of the BRB-M model is poor. No significant fluctuations were observed in the test of the four sets of disturbance data for the BRB-RI model, indicating that the BRB-RI model has excellent disturbance resistance. This is consistent with the data shown in Table 6, i.e., the smaller the value of ϑ B R B is, the stronger the disturbance resistance ability of the model, which verifies the validity of the calculation of the disturbed BRB evaluation models.
In Table 6, it can be observed that the Lipschitz constants of the input transformation part of the three models are larger than the values of the other parts, and in the research of Cao [13], the problem of the Lipschitz constants of the input transformation part being too large and thus leading to a decrease in the disturbance resistance of the model was mentioned, while the improved optimization algorithm considers a way of optimizing the reference value intervals of the input attribute, and the specific optimization strategy is shown in Table 7.
The optimized input attribute reference values were more reasonably divided, effectively reducing the ϑ I T value, which is one of the reasons why the BRB-RI model is more robust than the other models. To further analyze the disturbance resistance of the three models, the Lipshitz constants of the input transformation part of the models were divided into ϑ I T 1 and ϑ I T 2 , where ϑ I T 1 denotes the Lipshitz constant generated by Time-CC and ϑ I T 2 denotes the Lipshitz constant generated by Time-CV; the specific values are given in Table 8. The ϑ I T 2 values of the three models were larger than ϑ I T 1 , indicating that Time-CV is more sensitive than Time-CC. For further analysis, the disturbed data were applied separately to Time-CC and Time-CV, and the results obtained are shown in Figure 9. The data changed little after the Time-CC disturbance, while the Time-CV disturbance was more pronounced.
Then, taking the disturbance data of 0.0025 as an example, the ϑ B R B values of both the BRB-RI and BRB0 models were calculated cyclically 300 times each; none of the 300 values collected exceeded the maximum Lipschitz constant value of the model, and the obtained data are shown in Figure 10, which shows that the degree of disturbance of attribute of Time-CV was much larger than that of attribute of Time-CC. The reason is that the Time-CC attribute is more granular than the Time-CV one, and attributes with small granularity will preferentially lead to a decrease in the capacity of the model to resist disturbances, and the Time-CV attribute reference value division area is too small, which is also one of the reasons why ϑ I T 2 is larger than ϑ I T 1 .
Therefore, in the practical operation of Li-ion batteries, the suppression of disturbances caused by voltage should be given priority to ensure that the evaluation model achieves the best results.

5.3.3. Comparison with Other Models

To further illustrate the performance of the model proposed in this paper, this study is divided into two parts for comparative analysis with other models. In the first part, this paper compares the BRB-I model proposed by Han [8], which considers interpretability, and the WOA-BRB model proposed by Zhao et al. in terms of model performance. Both the WOA-BRB and BRB-I models use the whale optimization algorithm. In the second part, this paper compares the model proposed in this study with other machine learning models such as the BPNN model, RBF model, SVM model, and LSTM model, and the results are shown in Table 9.
As shown in Table 9, in the first part, the accuracy of the BRB-I and WOA-BRB models is slightly better than that of the BRB-RI model, but in the study of [9], the WOA-BRB model uses an initial reference value, which means that the ϑ I T value is the same as that of the BRB0 model and is therefore less resistant to disturbances in the transformation of the input information. According to the optimized parameters of the BRB-I model given in [8], the Lipschitz constant of the BRB-I model is calculated as shown in Table 10. Compared with the BRB-RI model, the disturbance resistance of the BRB-I model is also weaker than that of the BRB-RI model. Taken together, the BRB-RI model is superior to all the other models in terms of robustness and achieves a balance among the three attributes, although there is a slight loss in accuracy.
In the second part, this paper is compared with other machine learning models, where both the BPNN model and LSTM use the gradient descent optimization algorithm and SVM uses the SMO optimization algorithm. From Table 9, it can be seen that the accuracy of the machine learning model is better than the BRB model, but because the four models in Part II are often black-box models, it is difficult to explain the decision-making process inside the model; in addition, the four models may not perform stably in the face of noisy data and missing data, resulting in fluctuations in performance. Therefore, in a comprehensive view, although the BRB model is slightly lower than the machine learning model in terms of accuracy, it is better than the other models in terms of interpretability and robustness, achieving a balance of the three attributes.

5.3.4. Analysis of Different Lithium-Ion Batteries

To illustrate the generalizability of the modeling approach proposed in this paper, a dataset of different lithium-ion batteries was used for the health evaluation in this section; specifically, data were used from a CS2-36 battery provided by the University of Maryland, which was operated at a constant current rate of 0.5C until the voltage reached 4.2 V and then continued at 4.2 V until the charge current dropped to less than 0.05 A, which was achieved by using an Arbin BT2000 battery test system to perform multiple charge/discharge tests at room temperature.
The analysis of the performance of the models is shown in Figure 11, and the results of the prediction accuracy of the different models for CS2-36 batteries are shown in Table 11. Good accuracy was demonstrated by the BRB0 model, indicating the relative reliability of the initial expert knowledge. Based on this, a very desirable prediction effect was achieved by the BRB-M model through optimization, and an excellent performance level was shown by the BRB-RI model, which is based on the improved optimization algorithm proposed in this paper.
In addition, in terms of disturbance resistance, Table 11 shows a comparison of the Lipshitz constants of the three models, in which the Lipshitz constant of the model based on expert knowledge is relatively low, which indicates that the expert knowledge is more reliable and has good disturbance resistance, which is the reason why the BRB-RI model was not significantly improved after optimization, the BRB-M model, because there are no robustness constraints, so the model loses some of its disturbance resistance. This also demonstrates that the improved optimization algorithm proposed in this paper can effectively improve the robustness of the model.
The reasonableness of the disturbance BRB modeling approach proposed in this paper is verified by combining the analysis of the health state assessment of B0006 and CS2-36 batteries, and the comparative analysis with other BRB models and machine learning models in this study verifies the effectiveness of the improved optimization algorithm proposed in this paper.

6. Conclusions

Li-ion batteries are sensitive to both internal and external environmental factors, which may cause disturbances in the data measured by researchers and fluctuations in the health of the batteries. To address this problem, a disturbance of the BRB evaluation model is proposed in this paper. This model considers the disturbance resistance of the model. The model introduces Lipschitz stability as a criterion for the disturbance resistance of the model and defines the conditions for the Lipschitz stability of the BRB model as well as the coefficients of the disturbance resistance indices for the four computational parts of the BRB model. Since the BRB model is highly affected by disturbances in the input transformations, an improved optimization algorithm is proposed in this paper. This algorithm preserves the robustness and interpretability of the model. Finally, using the lithium-ion battery dataset provided by the NASA Predictive Center of Excellence as a case study, we compared the disturbed BRB model with other models to prove the effectiveness of the disturbed BRB model in terms of health evaluation and disturbance analysis and verified the reasonableness of the improved optimization algorithm.
However, the disturbances in lithium-ion batteries are often unknown, and it is difficult to accurately measure the disturbances in the model proposed in this paper. In practice, this may require a combination of multiple factors and may require the use of more advanced mathematical modeling and data analysis techniques to deal with complex battery behavior. In addition, due to the subjectivity of expert knowledge, the improved optimization algorithm proposed in this paper is based on the premise that expert knowledge is reliable, and further research is needed on how to optimize the model according to unreliable or inaccurate expert knowledge. For instance, probabilistic models or fuzzy logic techniques can be used to model the uncertainty of expert knowledge in future research. This would enable a better understanding of the scope and likelihood of expert knowledge, thus allowing the optimization algorithm to be more flexible and adaptable to different situations.

Author Contributions

Conceptualization, A.G. and X.Z.; methodology, A.G. and X.Z.; investigation, A.G., X.Z., W.H., H.H. and Y.C.; writing—original draft preparation, A.G. and X.Z.; writing—review and editing, W.H., H.H. and Y.C. All authors have read and agreed to the published version of the manuscript.

Funding

This research was funded in part by the Teaching reform project of higher education in Heilongjiang Province under grant no. SJGY20210456, in part by the Social Science Foundation of Heilongjiang Province under grant no. 21GLC189, in part by the Foreign Expert Projects in Heilongjiang Province under grant no. GZ20220131, in part by the Shandong Provincial Natural Science Foundation under grant no. ZR2023QF010, in part by the Social Science Planning Foundation of Liaoning Province under grant no. L23BTQ005, and in part by the Scientific Research Project of Liaoning Provincial Education Department under grant no. JYTMS20230555.

Data Availability Statement

The research data in this article were obtained in part from the NASA Diagnostic Centre of Excellence. For the source URL of the lithium-ion battery dataset in the Baidu AI Studio platform, please visit: https://aistudio.baidu.com/datasetdetail/171099 (accessed on 9 April 2024). One part was from the University of Maryland public dataset. For the URL of the lithium-ion battery dataset in the University of Maryland, please visit: https://calce.umd.edu/ (accessed on 9 April 2024). battery-data.

Conflicts of Interest

The authors declare no conflicts of interest.

References

  1. Zhao, Y.L.; Zhu, Y.P.; Lin, J.Z.; Han, Q.K.; Liu, Y. Fault Features Uncertainty Quantification with Parameters Uncertainties of Data-Driven Models and Its Application in Rotor Systems Condition Assessment. IEEE Trans. Instrum. Meas. 2024, 73, 3503311. [Google Scholar] [CrossRef]
  2. Hu, Z.T.; Wang, L.F.; Chen, Y.Q.; Liu, Y.S.; Li, R.H.; Zhao, M.; Lu, X.Y.; Jiang, Z.J. Dynamically retrieving knowledge via query generation for informative dialogue generation. Neurocomputing 2024, 569, 127036. [Google Scholar] [CrossRef]
  3. Liu, S.; Liu, Y.N.; Zhu, X.D.; Zhang, S.Q. Data-knowledge driven: A new learning strategy for iris recognition. Multimed. Tools Appl. 2023, 83, 27995–28025. [Google Scholar] [CrossRef]
  4. Qian, X.N.; Yoon, B.J.; Arróyave, R.; Qian, X.F.; Dougherty, E.R. Knowledge-driven learning, optimization, and experimental design under uncertainty for materials discovery. Patterns 2023, 4, 100863. [Google Scholar] [CrossRef] [PubMed]
  5. Yang, J.; Li, P.; Zhang, Y.; Hui, Y.C.; Xu, L.H.; Damil, N.; Hu, H. Unified functional based data-model-coupling computing for composite materials and structures. Compos. Struct. 2023, 312, 116840. [Google Scholar] [CrossRef]
  6. Liu, K.X.; Wu, J.C.; He, Z.H.; Cao, L.C. 4K-DMDNet: Diffraction model-driven network for 4K computer-generated holography. Opto-Electron. Adv. 2023, 6, 14. [Google Scholar] [CrossRef]
  7. Yang, J.B.; Liu, J.; Wang, J.; Sii, H.S.; Wang, H.W. Belief rule-base inference methodology using the evidential reasoning approach—RIMER. IEEE Trans. Syst. Man Cybern. Part A-Syst. Hum. 2006, 36, 266–285. [Google Scholar] [CrossRef]
  8. Han, P.; Zhao, B.Y.; He, W.; Kong, L.K.; Li, Y.M.; Zhou, G.H.; Feng, J.C. An interpretable BRB model with interval optimization strategy for lithium battery capacity prediction. Energy Sci. Eng. 2023, 11, 1945–1959. [Google Scholar] [CrossRef]
  9. Han, P.; He, W.; Cao, Y.; Li, Y.; Mu, Q.; Wang, Y. Lithium-ion battery health assessment method based on belief rule base with interpretability. Appl. Soft Comput. 2023, 138, 110160. [Google Scholar] [CrossRef]
  10. Tang, S.W.; Zhou, Z.J.; Hu, C.H.; Yang, J.B.; Cao, Y. Perturbation Analysis of Evidential Reasoning Rule. Ieee Trans. Syst. Man Cybern. -Syst. 2021, 51, 4895–4910. [Google Scholar] [CrossRef]
  11. Lian, Z.; Zhou, Z.J.; Hu, C.H.; Ming, Z.C.; Wang, J.; Zhao, Y. A Belief Rule-Based Performance Evaluation Model for Complex Systems Considering Sensors Disturbance. IEEE Trans. Reliab. 2023, 1–13. [Google Scholar] [CrossRef]
  12. Feng, Z.C.; Yang, R.H.; Zhou, Z.J.; Hu, C.H. Trustworthy Fault Diagnosis Method Based on Belief Rule Base with Multi-source Uncertain Information for Vehicle. IEEE Trans. Ind. Electron. 2023, 1–10. [Google Scholar] [CrossRef]
  13. Cao, Y.; Zhou, Z.J.; Tang, S.W.; Ning, P.Y.; Chen, M.L. On the Robustness of Belief-Rule-Based Expert Systems. Ieee Trans. Syst. Man Cybern. -Syst. 2023, 53, 6043–6055. [Google Scholar] [CrossRef]
  14. Edge, J.S.; O’Kane, S.; Prosser, R.; Kirkaldy, N.D.; Patel, A.N.; Hales, A.; Ghosh, A.; Ai, W.; Chen, J.; Yang, J.; et al. Lithium ion battery degradation: What you need to know. Phys. Chem. Chem. Phys. 2021, 23, 8200–8221. [Google Scholar] [CrossRef] [PubMed]
  15. Chen, Y.C.; Woolsey, C.A. A Structure-Inspired Disturbance Observer for Finite-Dimensional Mechanical Systems. IEEE Trans. Control Syst. Technol. 2023, 32, 440–455. [Google Scholar] [CrossRef]
  16. Grumbach, F.; Müller, A.; Reusch, P.; Trojahn, S. Robustness Prediction in Dynamic Production Processes-A New Surrogate Measure Based on Regression Machine Learning. Processes 2023, 11, 1267. [Google Scholar] [CrossRef]
  17. Shang, Y.Z.; Xu, D.; Bin, D.; Zong, Z.L.; Nie, L.Q.; Yan, Y. Lipschitz Continuity Retained Binary Neural Network. In Proceedings of the 17th European Conference on Computer Vision (ECCV), Tel Aviv, Israel, 23–27 October 2022; pp. 603–619. [Google Scholar]
  18. Zhang, W.H.; Wang, Z.H.; Raissi, T.; Shen, Y. Ellipsoid-Based Interval Estimation for Lipschitz Nonlinear Systems. IEEE Trans. Autom. Control 2022, 67, 6802–6809. [Google Scholar] [CrossRef]
  19. Zhang, X.M.; Xu, S.Y.; Hu, J.; Xie, Z.Y.; IEEE. Optimized L2 Norm Loss for Adversarial Robustness. In Proceedings of the IEEE 2nd International Conference on Computer Communication and Artificial Intelligence (CCAI), Beijing, China, 6–8 May 2022; pp. 8–16. [Google Scholar]
  20. Chen, Y.; Zhou, Z.J.; Yang, L.H.; Hu, G.Y.; Han, X.X.; Tang, S.W. A novel structural safety assessment method of large liquid tank based on the belief rule base and finite element method. Proc. Inst. Mech. Eng. Part O-J. Risk Reliab. 2022, 236, 458–476. [Google Scholar] [CrossRef]
  21. Cheng, M.; Li, S.M.; Wang, Y.H.; Zhou, G.H.; Han, P.; Zhao, Y. A New Model for Network Security Situation Assessment of the Industrial Internet. CMC-Comput. Mater. Contin. 2023, 75, 2527–2555. [Google Scholar] [CrossRef]
  22. Hu, G.Y.; Zhou, Z.J.; Hu, C.H.; Zhang, B.C.; Zhou, Z.G.; Zhang, Y.; Wang, G.Z. Hidden behavior prediction of complex system based on time-delay belief rule base forecasting model. Knowl.-Based Syst. 2020, 203, 106147. [Google Scholar] [CrossRef]
  23. Zhang, B.C.; Wang, J.D.; Zheng, Z.; Chen, D.X.; Yin, X.J. Fault Diagnosis for Body-in-White Welding Robot Based on Multi-Layer Belief Rule Base. Appl. Sci. 2023, 13, 4773. [Google Scholar] [CrossRef]
  24. Diao, H.Y.; Lu, Y.F.; Deng, A.S.; Zou, L.; Li, X.F.; Pedrycz, W. Convolutional rule inference network based on belief rule-based system using an evidential reasoning approach. Knowl.-Based Syst. 2022, 237, 107713. [Google Scholar] [CrossRef]
  25. Li, C.; Shen, Q.; Wang, L.X.; Qin, W.W.; Xie, M.M. A New Adaptive Interpretable Fault Diagnosis Model for Complex System Based on Belief Rule Base. IEEE Trans. Instrum. Meas. 2022, 71, 3529111. [Google Scholar] [CrossRef]
  26. Zhang, C.C.; Zhou, Z.J.; Ning, P.Y.; Ming, Z.C.; Zhang, C.L.; Fang, L.L. IBRNet: Interpretable Belief Rule Network modeling method for fault diagnosis of redundant inertial navigation systems. Control Eng. Pract. 2024, 144, 105822. [Google Scholar] [CrossRef]
Figure 1. A framework for analyzing the disturbance resistance of a model.
Batteries 10 00129 g001
Figure 2. Simulation of model operation state when lithium-ion battery disturbance occurs.
Batteries 10 00129 g002
Figure 3. Semantic value reference index for lithium-ion batteries.
Batteries 10 00129 g003
Figure 4. Variation in capacity of lithium-ion batteries.
Batteries 10 00129 g004
Figure 5. The rule distribution of the model.
Batteries 10 00129 g005
Figure 6. Belief degree distributions for the three models. (a) Belief degree distribution of BRB0; (b) belief degree distribution of BRB-M; (c) belief degree distribution of BRB-RI.
Batteries 10 00129 g006
Figure 7. Comparison of model accuracy.
Batteries 10 00129 g007
Figure 8. Analysis of the model under different disturbance factors. (a) Disturbance results of BRB0 with different disturbance factors; (b) disturbance results of BRB-M with different disturbance factors; (c) disturbance results of BRB-RI with different disturbance factors.
Batteries 10 00129 g008
Figure 9. Disturbance data with different disturbance factors.
Batteries 10 00129 g009
Figure 10. Change in Lipschitz constant (non-maximum) for the model with 0.0025 disturbance factor. (a) Change in Lipschitz constant for BRB0 model with 0.0025 disturbance factor; (b) change in Lipschitz constant for BRB-RI model with 0.0025 disturbance factor.
Batteries 10 00129 g010
Figure 11. Evaluation analysis of CS2-36 batteries by different models.
Batteries 10 00129 g011
Table 1. Lithium-ion battery input attributes reference values.
Attribute δ i VLLNS
Time-CC10.930.720.480.22
Time-CV10.530.480.420.34
Table 2. Lithium-ion battery health status level.
CSSLBVB
Health status2.051.651.41.1
Table 3. Expert-knowledge-based BRB rule base.
No. θ l T i m e C C T i m e C V Health State Levels
11 V L V L {0.85, 0.15, 0, 0}
21 V L L {0.69, 0.19, 0.12, 0}
31 V L N {0.68, 0.22, 0.12, 0}
41 V L S {0.47, 0.33, 0.2, 0}
51 L V L {0.42, 0.25, 0.2, 0.13}
61 L L {0.33, 0.29, 0.24, 0.14}
71 L N {0.35, 0.3, 0.2, 0.15}
81 L S {0.41, 0.37, 0.11, 0.11}
91 N V L {0.1, 0.11, 0.39, 0.39}
101 N L {0.12, 0.18, 0.51, 0.19}
111 N N {0.13, 0.21, 0.37, 0.29}
121 N S {0.1, 0.14, 0.38, 0.38}
131 S V L {0.1, 0.1, 0.3, 0.4}
141 S L {0.05, 0.16, 0.29, 0.5}
151 S N {0.01, 0.03, 0.04, 0.92}
161 S S {0, 0.06, 0.15, 0.79}
Table 4. Comparison of attribute weights of models.
Models δ 1 δ 2
BRB011
BRB-RI0.99960.9725
BRB-M0.83830.6299
Table 5. MSE comparisons between models.
ModelsMSE
BRB00.0053
BRB-RI0.0018
BRB-M0.0013
Table 6. Values of Lipschitz constants for each stage of the model.
Models ϑ I T ϑ M D C ϑ M D N ϑ E R ϑ B R B
BRB0400.999610.847433.8837
BRB-RI30.32190.99811.05430.846126.9937
BRB-M404.24752.36230.8070323.8971
Table 7. Interval optimization range for reference values.
VLLNS
Time-CC[0.93–0.96][0.7–0.725][0.46–0.485][0.195–0.21]
Adopted value0.940.71240.4850.21
Time-CV[0.53–0.56][0.475–0.482][0.416–0.42][0.31–0.33]
Adopted value0.5590.4820.4160.31
Table 8. Lipschitz constant for model input information transformation.
Models ϑ I T 1 ϑ I T 2
BRB09.523840
BRB-RI8.794430.3219
BRB-M9.523840
Table 9. Performance comparison between different BRBs and other models.
PartModelsMSE
Part ⅠBRB00.0053
BRB-RI0.0018
BRB-M0.0013
BRB-I0.0016
WOA-BRB0.0012
Part ⅡBPNN0.0011
RBF0.0012
SVM0.0015
LSTM0.0013
Table 10. Comparison of Lipschitz constants of BRB-I and BRB-RI models.
Models ϑ I T ϑ M D C ϑ M D N ϑ E R ϑ B R B
BRB-RI30.32190.99811.05430.846126.9937
BRB-I501.70650.98240.862772.3150
Table 11. Comparison of model accuracy and robustness.
ModelsMSELipschitz Constant
BRB00.002016.5445
BRB-RI2.3203 × 10−416.1432
BRB-M1.3926 × 10−441.1222
Disclaimer/Publisher’s Note: The statements, opinions and data contained in all publications are solely those of the individual author(s) and contributor(s) and not of MDPI and/or the editor(s). MDPI and/or the editor(s) disclaim responsibility for any injury to people or property resulting from any ideas, methods, instructions or products referred to in the content.

