Article

Experimental Study on Thermal Runaway Characteristics of High-Nickel Ternary Lithium-Ion Batteries under Normal and Low Pressures

by
Ye Jin
,
Di Meng
,
Chen-Xi Zhao
,
Jia-Ling Yu
,
Xue-Hui Wang
* and
Jian Wang
*
State Key Laboratory of Fire Science, University of Science and Technology of China, Hefei 230026, China
*
Authors to whom correspondence should be addressed.
Batteries 2024, 10(8), 287; https://doi.org/10.3390/batteries10080287
Submission received: 1 July 2024 / Revised: 1 August 2024 / Accepted: 9 August 2024 / Published: 12 August 2024
(This article belongs to the Special Issue Advances in Lithium-Ion Battery Safety and Fire)

Abstract

:
High-nickel (Ni) ternary lithium-ion batteries (LIBs) are widely used in low-pressure environments such as in the aviation industry, but their attribute of high energy density poses significant fire hazards, especially under low pressure where thermal runaway behavior is complex, thus requiring relevant experiments. This study investigates the thermal runaway characteristics of LiNi0.8Mn0.1Co0.1O2 (NCM811) 18650 LIBs at different states of charge (SOCs) (75%, 100%) under various ambient pressures (101 kPa, 80 kPa, 60 kPa, 40 kPa). The results show that, as the pressure is decreased from 101 kPa to 40 kPa, the onset time of thermal runaway is extended by 28.2 s for 75% SOC and by 40.8 s for 100% SOC; accordingly, the onset temperature of thermal runaway increases by 19.3 °C for 75% SOC and by 33.5 °C for 100% SOC; the maximum surface temperature decreases by 70.8 °C for 75% SOC and by 68.2 °C for 100% SOC. The cell mass loss and loss rate slightly decrease with reduced pressure. However, ambient pressure has little impact on the time and temperature of venting as well as the voltage drop time. SEM/EDS analysis verifies that electrolyte evaporates faster under low pressure. Furthermore, the oxygen concentration is lower under low pressure, which consequently leads to a delay in thermal runaway. This study contributes to understanding thermal runaway characteristics of high-Ni ternary LIBs and provides guidance for their safe application in low-pressure aviation environments.

1. Introduction

With steady growth in global energy consumption, the intermittent nature of most renewable energies, and the increasing demand for electricity from consumers and industries, the latest developments and opportunities in energy storage have emerged. Compared to other secondary batteries, LIBs offer higher energy density, higher open-circuit voltage, greater output power, lower self-discharge rate, no memory effect, a wide operating temperature range, and a fast charge and discharge speed. Thus, LIBs are widely used in consumer electronics products, military products, and aviation products [1]. In particular, LIBs with high-Ni cathodes, compared to other cathode materials, achieve higher specific capacity and lower cost, making them highly promising. A large number of LIBs and devices containing LIBs are increasingly transported or used in low-pressure environments such as aviation. High-Ni LIBs are being integrated into aviation electronics, including communication systems, flight control systems, and emergency power supplies. They are also transported by air for use in power tools, portable electronic devices, and other applications, either as standalone units or as components of systems. However, Ni does increase the energy density of the cathode and participate in charge–discharge reactions; in the meantime, it introduces safety issues due to (i) thermal phase transitions in the cathode releasing oxygen and (ii) exothermic thermal reactions between the released oxygen species and electrolyte producing significant heat; this accelerates the phase transitions and promotes thermal runaway [2,3]. This has led to numerous fire incidents, causing significant casualties and property damage. According to the U.S. Federal Aviation Administration, from 3 March 2006 to 27 November 2023, there have been as many as 498 fire incidents caused by lithium batteries brought onto aircraft as cargo or luggage [4]. Therefore, it is crucial to address the thermal safety of high-Ni ternary LIBs under low pressure.
Previous research mainly focused on thermal runaway behavior characteristics and propagation characteristics under low ambient pressure. The study of thermal runaway behavior under low pressure primarily revolves around experimental techniques. Chen et al. [5,6] conducted several thermal runaway experiments on LIBs under low pressure: LiCoO2 18650 LIBs were tested in Hefei and Lhasa, the difference in pressure resulted in the venting temperature, the average burning rate, and the effective combustion heat in Hefei being larger than those in Lhasa. The influence of the pressure on heat release was greater than on mass loss; 18650 LIBs with different cathode materials (LiFePO4, LiCoO2) and SOC were tested in Hefei and Lhasa, finding that total mass loss, total heat release, and the growth rate of unit combustion heat between the two pressures increased with SOC, and total heat release was higher at higher pressure. Xie et al. [7,8,9,10] conducted a series of experimental studies on LIBs under low pressure: NCM523 18650 LIBs with different aging cycles were tested under different pressures, the results showed that the onset time and temperature of thermal runaway, as well as the heat release rate, decreased with an increase in cycle number or a decrease in pressure. Thermal runaway was more likely at low pressure because the rupture disk was more easily to open; NCM523 18650 LIBs at different charge–discharge rates were tested under 20 kPa and 95 kPa, and the results showed that higher charge–discharge rates and lower pressures both caused earlier and less intense thermal runaway. The difference in thermal runaway times for cells at different charge–discharge rates at 20 kPa was greater than that at 95 kPa; NCM523 18650 LIBs at different SOC were heated by an electric coil under low pressure, it was found that the decrease in pressure resulted in a delay in voltage drop time, reduced thermal runaway intensity and temperature, and a U-shaped change in thermal runaway time; NCM523 pouch LIBs with different overcharge cycles were tested at 30 kPa and 95 kPa, the results showed that, due to the differential pressure for the release of combustibles, the thermal runaway jet intensity at 30 kPa was stronger. The thermal runaway intensity and heat release at 30 kPa were weaker because of the lower oxygen content. Liu et al. [11] conducted tests on normal ternary 18650 LIBs at 96 kPa and 61 kPa, showing that the thermal runaway onset time and temperature were higher at 61 kPa, while the explosion pressure and TNT equivalent were lower at 61 kPa. Zhang et al. [12] performed experiments on NCM111 LIBs from 101 kPa to 30 kPa, it was found that, as the pressure decreased, the thermal runaway onset time was earlier, CO2 production was reduced, unsaturated hydrocarbons increased, and the range of the explosion limits of thermal runaway gases increased. Chen et al. [13] conducted thermal runaway tests from 95 kPa to 20 kPa, revealing that the heat release rate, total heat release, surface temperature, CO2 peak concentration, and mass loss all decreased with lower pressure or heating power, while hydrocarbon (CHx) and CO peaks increased with decreasing pressure. Previous researchers mainly paid attention to the thermal runaway characteristics of ternary LIBs with cathode materials of normal Ni content under low pressure, lacking experimental studies on high-Ni ternary LIBs, and almost none measured the voltage parameter, which respond faster than the surface temperature.
This paper aims to narrow the research gap between high-Ni ternary LIBs and other LIBs under low pressure by conducting thermal runaway experiments on NCM811 18650 LIBs under different ambient pressures. By measuring and discussing key parameters such as the characteristic temperature, voltage, and mass loss, this paper provides insights into thermal runaway characteristics of high-Ni ternary LIBs under low pressure and guides their safe application in such environments, and encourages further research in this area.

2. Materials and Methods

2.1. Battery Samples

The commercial cylindrical graphite/NCM811 LIBs from a battery manufacturer were tested in this study. The basic information of the batteries is shown in Table 1.
Before the experiments, the batteries underwent the following operations: (i) discharged at a constant current of 1 C-rate (C-rate is defined as the ratio of the charge or discharge current to the battery’s nominal capacity.) to 2.75 V; (ii) charged at a constant current and constant voltage mode of 0.5 C-rate until the current dropped to 52 mA, then charged to 4.2 V, and then discharged at 1 C-rate to 2.75 V, with these steps cycled three times; (iii) charged at 0.5 C-rate to the specified SOC. After these procedures, the batteries were left to rest for 24 h to return to electrochemical and thermal equilibrium. All batteries used in this study were from the same batch to minimize differences between them.

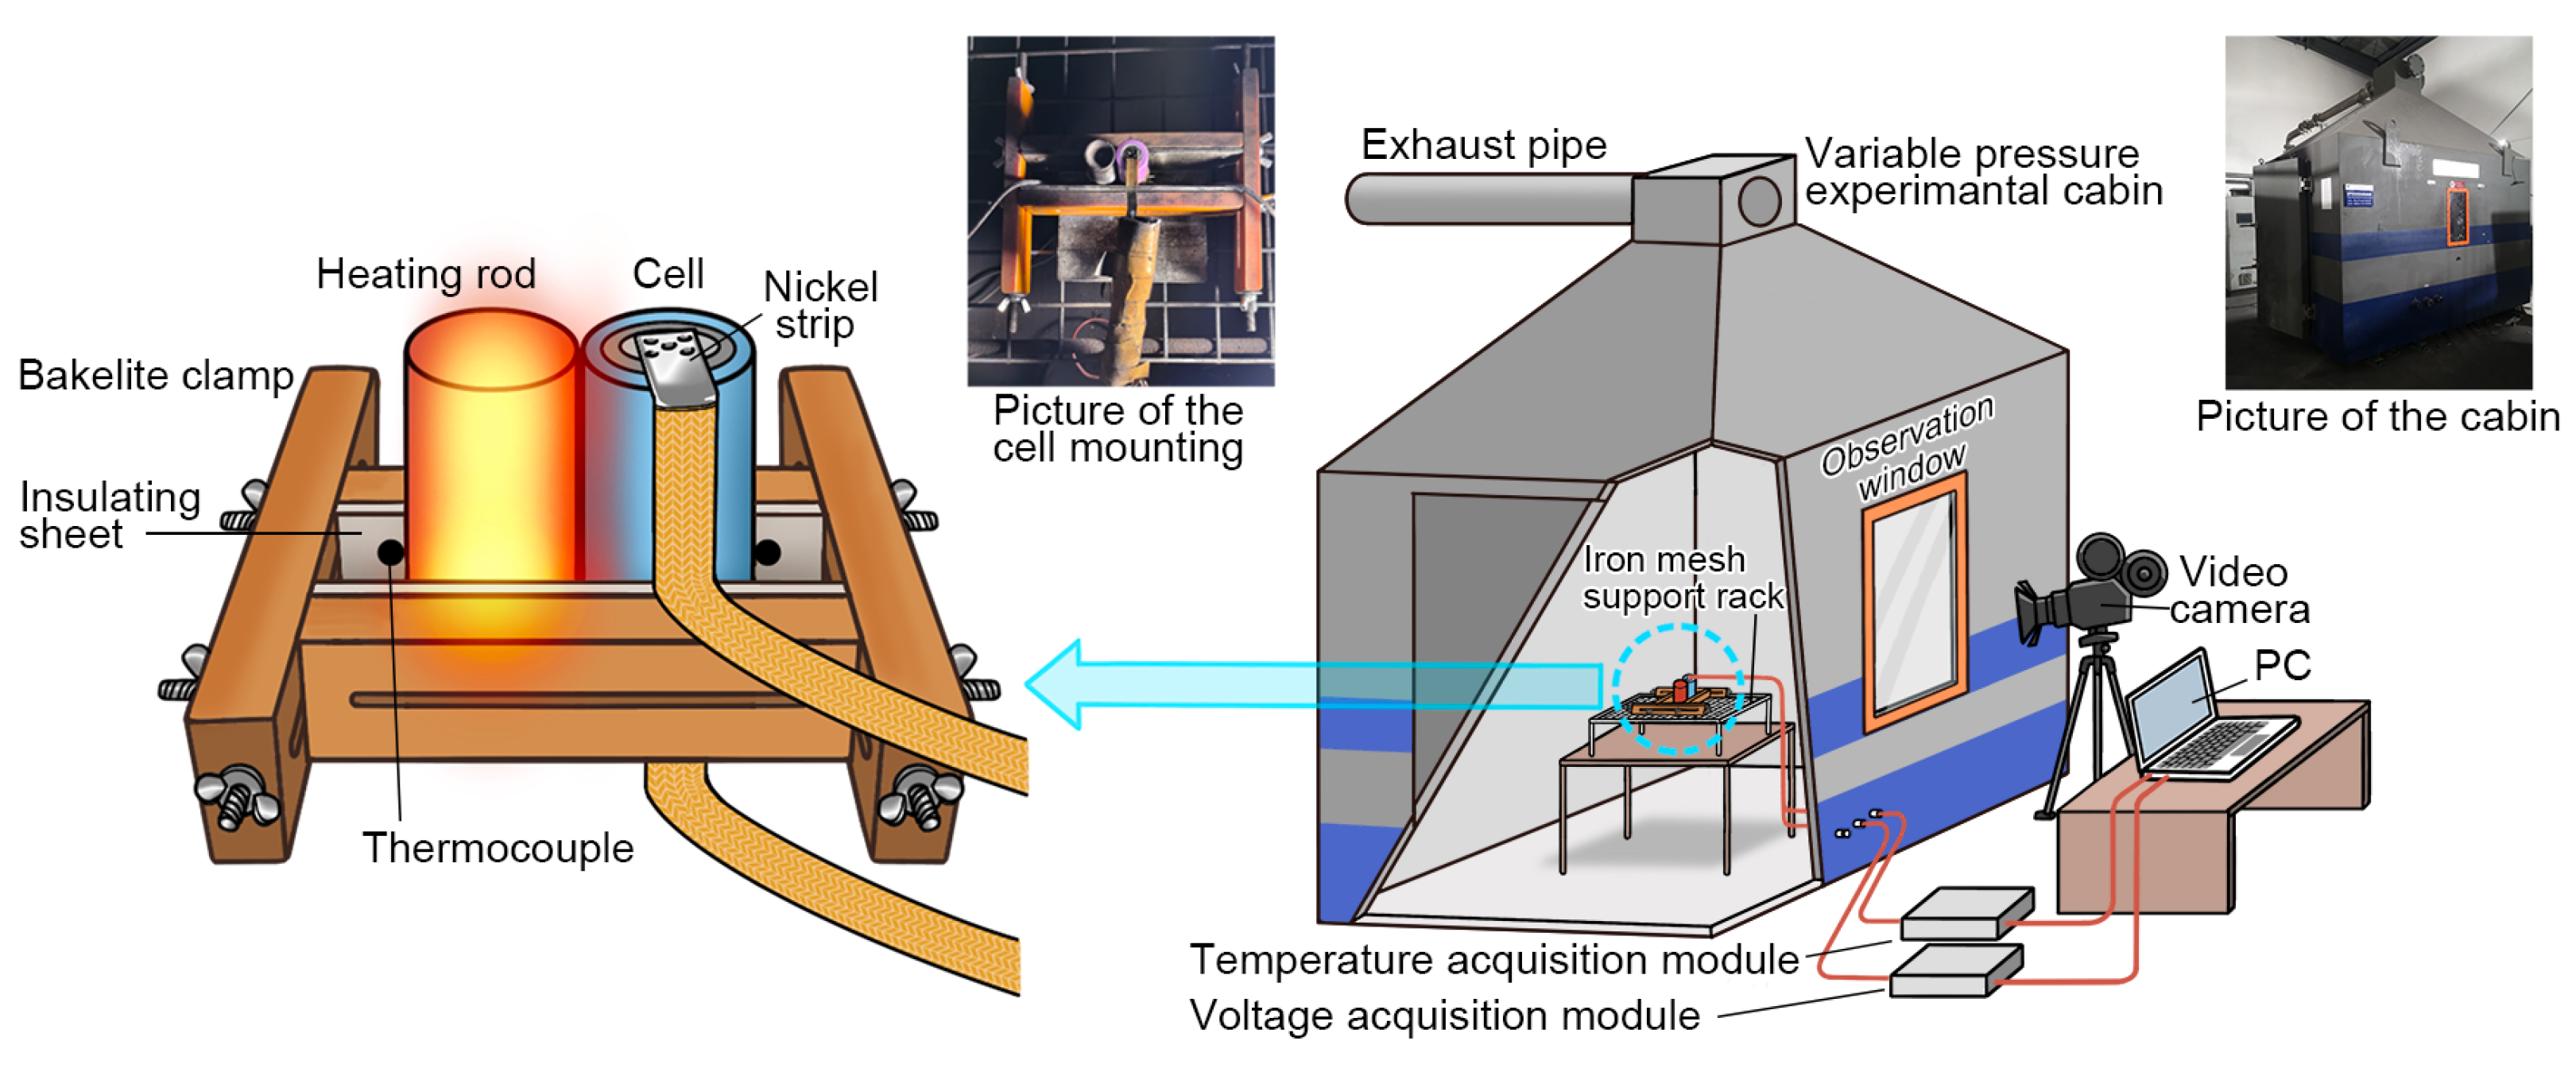
2.2. Experimental Setup

Figure 1 shows a schematic of the experimental setup. The experiments were conducted in a variable-pressure experimental cabin measuring 3 m in length, 2 m in width, and 2 m in height, providing an ambient pressure range of 20–101 kPa. Once the chamber reaches the set pressure environment by dynamically adjusting the inlet and outlet airflow, the vacuum pump is turned off. After the pressure stabilizes, the experiment is conducted. Due to good sealing, the pressure fluctuation inside the chamber does not exceed 1 kPa by the end of the experiment, which is within the acceptable system error. Inside the chamber, the experimental samples were fixed in a bakelite clamp embedded with insulating sheets. A 150 W heating rod with an appearance similar to the battery sample was used to simulate an overheated cell and trigger thermal runaway in the adjacent cell (the gap between the heating rod and the cell is 0 mm). The cells were placed on thermal insulation wool supported by an iron mesh rack, which was set on a stable table. Two K-type exposed thermocouple beads, each with a 1 mm diameter, were individually affixed to the side surfaces of the heating rod and the cell by high-temperature-resistant Teflon tape to measure the surface temperature, and the data were collected by a temperature-acquisition module (NI 9213). The Ni strip with a thickness of 0.12 mm and a width of 6 mm was spot-welded to the positive electrode of the cell, and the Ni strip was connected to a voltage-acquisition module (CT-4008-5V6A-S1, NEWARE Battery Testing System) to measure the open-circuit voltage. The cell was weighed before and after the experiment by an electronic balance. Thermal runaway processes and fire phenomena were recorded by a video camera (SONY FDR-AX100E). The heating rod was turned off immediately after the cell entered thermal runaway. The conditions of the experiments are shown in Table 2. Each condition was repeated at least three times to reduce random errors.
Following the thermal runaway experiments, all burnt cells were collected and stored in sealed bags. Scanning electron microscopy (SEM)–energy-dispersive X-ray spectroscopy (EDS) analysis was performed on the electrodes of the burnt cells using ZEISS GeminiSEM 450 (Carl Zeiss Microscopy GmbH, Jena, Germany) equipped with AZtecLive EDS software version [4.3] (Oxford Instruments, Abingdon, UK). The information of microscopic morphology and elemental composition was obtained to characterize the internal reactions.

3. Results and Discussion

In this section, the criteria for thermal runaway and venting, which are important events during the experiment, are introduced first. Based on these criteria, the characteristics of thermal runaway are then discussed in detail.

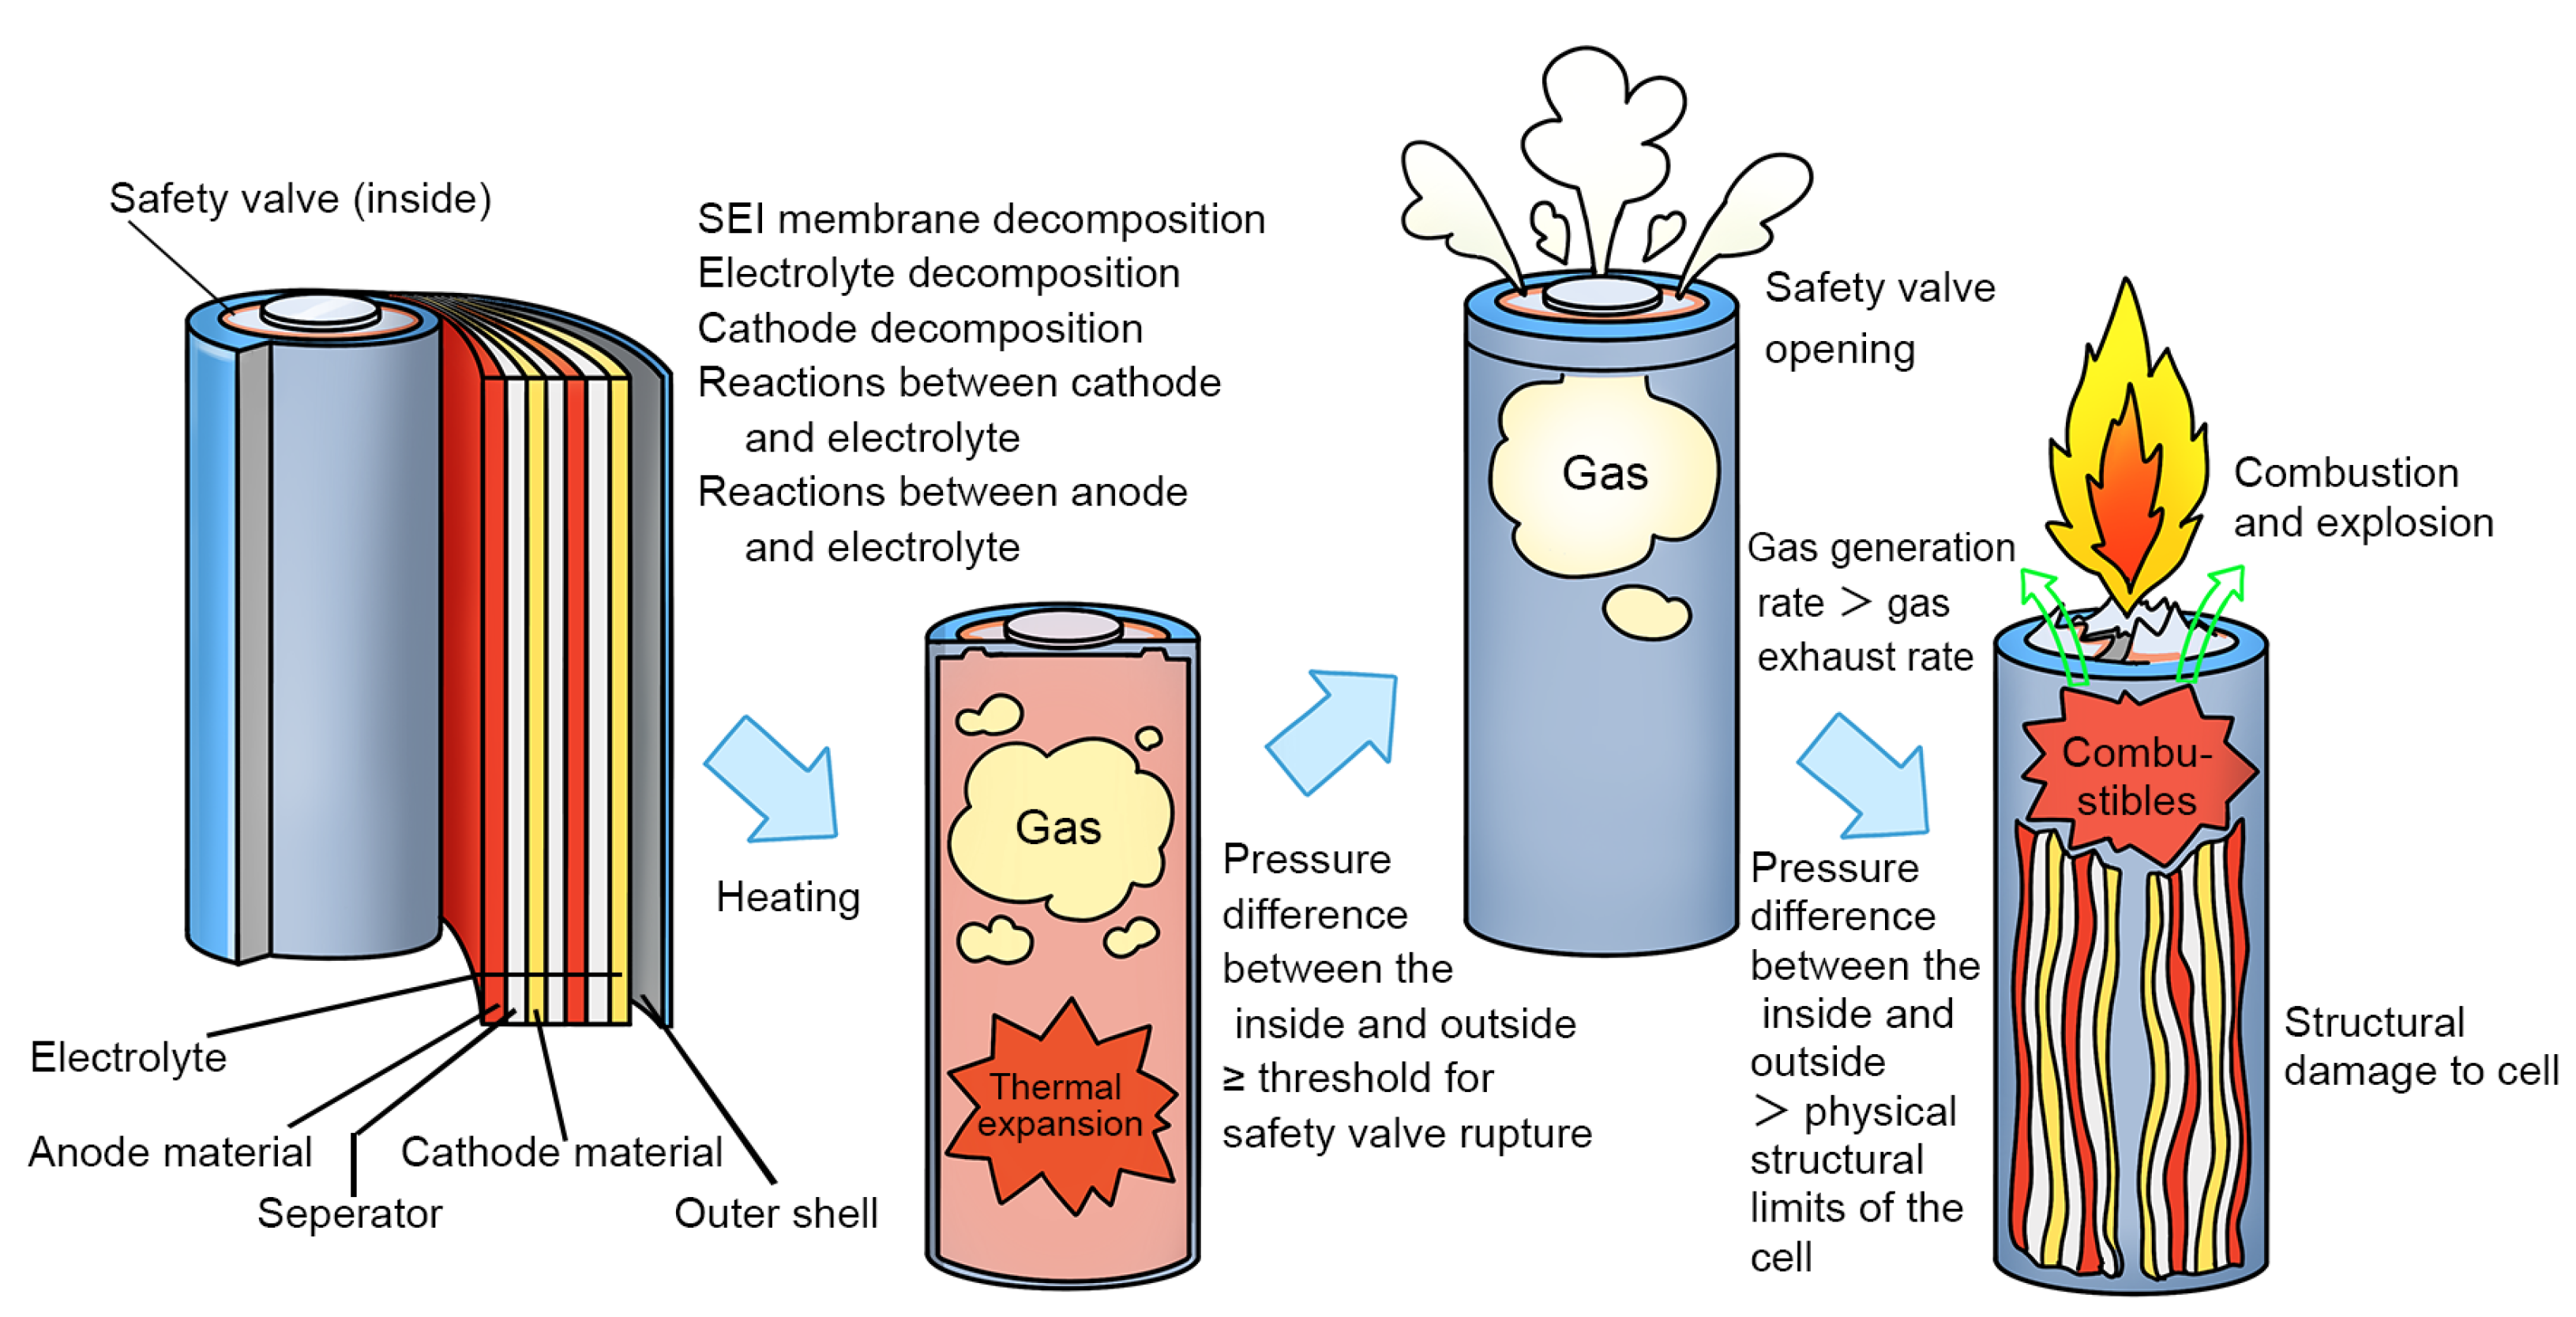
3.1. Criteria for Thermal Runaway and Venting

The criteria for thermal runaway in previous works have often been based on an empirical value of temperature rise rate combined with fire phenomena, given experimental conditions [9,14,15]. In this study, the criteria for thermal runaway and venting were determined based on the second derivative of the cell’s surface temperature, independent of specific platforms. That is
Λ : = | d 2 T B d t 2 | > Δ
where T B is the temperature of the battery and Δ is the systematic error.
The proof of this criterion is presented below. Firstly, let us consider the heating rod’s temperature rise process. The temperature rise rate of the heating rod in the experiment can be approximated as that of an isolated heating rod [16]:
d T H d t = k P α ( T H T 0 ) ,
where k = 1 / ( c · m ) , c is the specific heat capacity, m is the mass of the heating rod, P is the power of the heating rod, α is the reduced heat transfer coefficient of the heating rod, and T 0 is the ambient temperature. Solving the differential equation gives:
T H = T 0 + k P α ( 1 e α t )
Next, we focus on the cell’s temperature rise process, which is influenced primarily by three factors: heat transfer from the heating rod, heat dissipation to the air, and heat released from internal chemical reactions. This analysis leads to the following differential Equation [16]:
d T B d t = β ( T H T B ) α ( T B T 0 ) + γ ,
where β is the reduced heat transfer coefficient from the heating rod to the battery, α is the reduced heat transfer coefficient from the battery to the air, and γ represents the contribution from internal chemical reactions. Note that the contribution of γ before thermal runaway is negligible due to its imperceptibility within the precision of our measurements, its quantification requiring devices, such as a micro-calorimeter [17], a differential scanning calorimeter [2], etc. Therefore, the equation simplifies to:
d T B d t β ( T H T B ) α ( T B T 0 )
The second derivative of the temperature of the battery is
d 2 T B d t 2 = β d T H d t ( α + β ) d T B d t β d T H d t = β k P e α t β k P
In this experiment, it can be estimated that
β 10 2 10 1 k P 10 2 10 1
Therefore, in the absence of venting events and thermal runaway events, we obtain
Λ = d 2 T B d t 2 β k P 10 2
Due to the systematic error, the measured second derivative is constrained by
Λ Δ = 0.1
When a thermal runaway event occurs, Λ 1 , and during a venting event, Λ > 0.3 in this experiment. Therefore, Λ > Δ indicates the occurrence of such events. During the temperature rise process before thermal runaway, Λ is smaller than the experimental systematic error, whereas during thermal runaway, Λ significantly exceeds the experimental systematic error. This suggests a criterion for thermal runaway independent of specific platforms, while the criterion for venting events may still vary depending on the specific platform.

3.2. Thermal Runaway Behavior

Figure 2 shows the thermal runaway phenomena of the cells under different pressures. This process can be divided into four stages: (1) The heating stage (not clearly visible in the video): the cell was heated by the heating rod. When a certain temperature was reached, the safety valve of the cell broke, and an unusual sound could be heard at this moment. (2) The jet fire stage: when thermal runaway occurred, the cell first ejected a large amount of high-temperature metal particles upward, immediately triggering combustion or explosion. Once the rapid explosion occurred, it was accompanied by the ejection of the jelly roll. This stage lasted no more than 5 s. (3) The electrolyte combustion stage: after the ejection ended, a sustained flame appeared above the battery due to the burning of the flammable electrolyte. (4) The extinguishing stage: subsequently, as the electrolyte was completely consumed, the flame gradually diminished until it went out.
This indicates that, as the ambient pressure gradually decreased, the duration of the electrolyte combustion stage shortened. The duration of electrolyte combustion decreased from 71 s at 80 kPa to 23 s at 40 kPa for 75% SOC. Furthermore, the duration decreased from 37 s at 80 kPa to 0 s at 40 kPa for 100% SOC. This is because the electrolyte evaporates more easily at lower pressures, leaving less residual electrolytes. The duration of electrolyte combustion for the cell at 100% SOC was significantly shorter than that for the cell at 75% SOC. This is because a cell with a higher SOC stores more energy and has a higher amount of lithium intercalation in the anode [18], so it contains more active substances, undergoes more thorough and intense chemical reactions, and generates more heat. Consequently, more electrolyte is consumed during the chemical reactions and more evaporates [19].
To further understand thermal runaway behavior, the temperature evolution curves of cells at 75% SOC under 80 kPa and under 40 kPa during the experiments were displayed by Figure 3. The thermal runaway process of the cell consists of three stages:
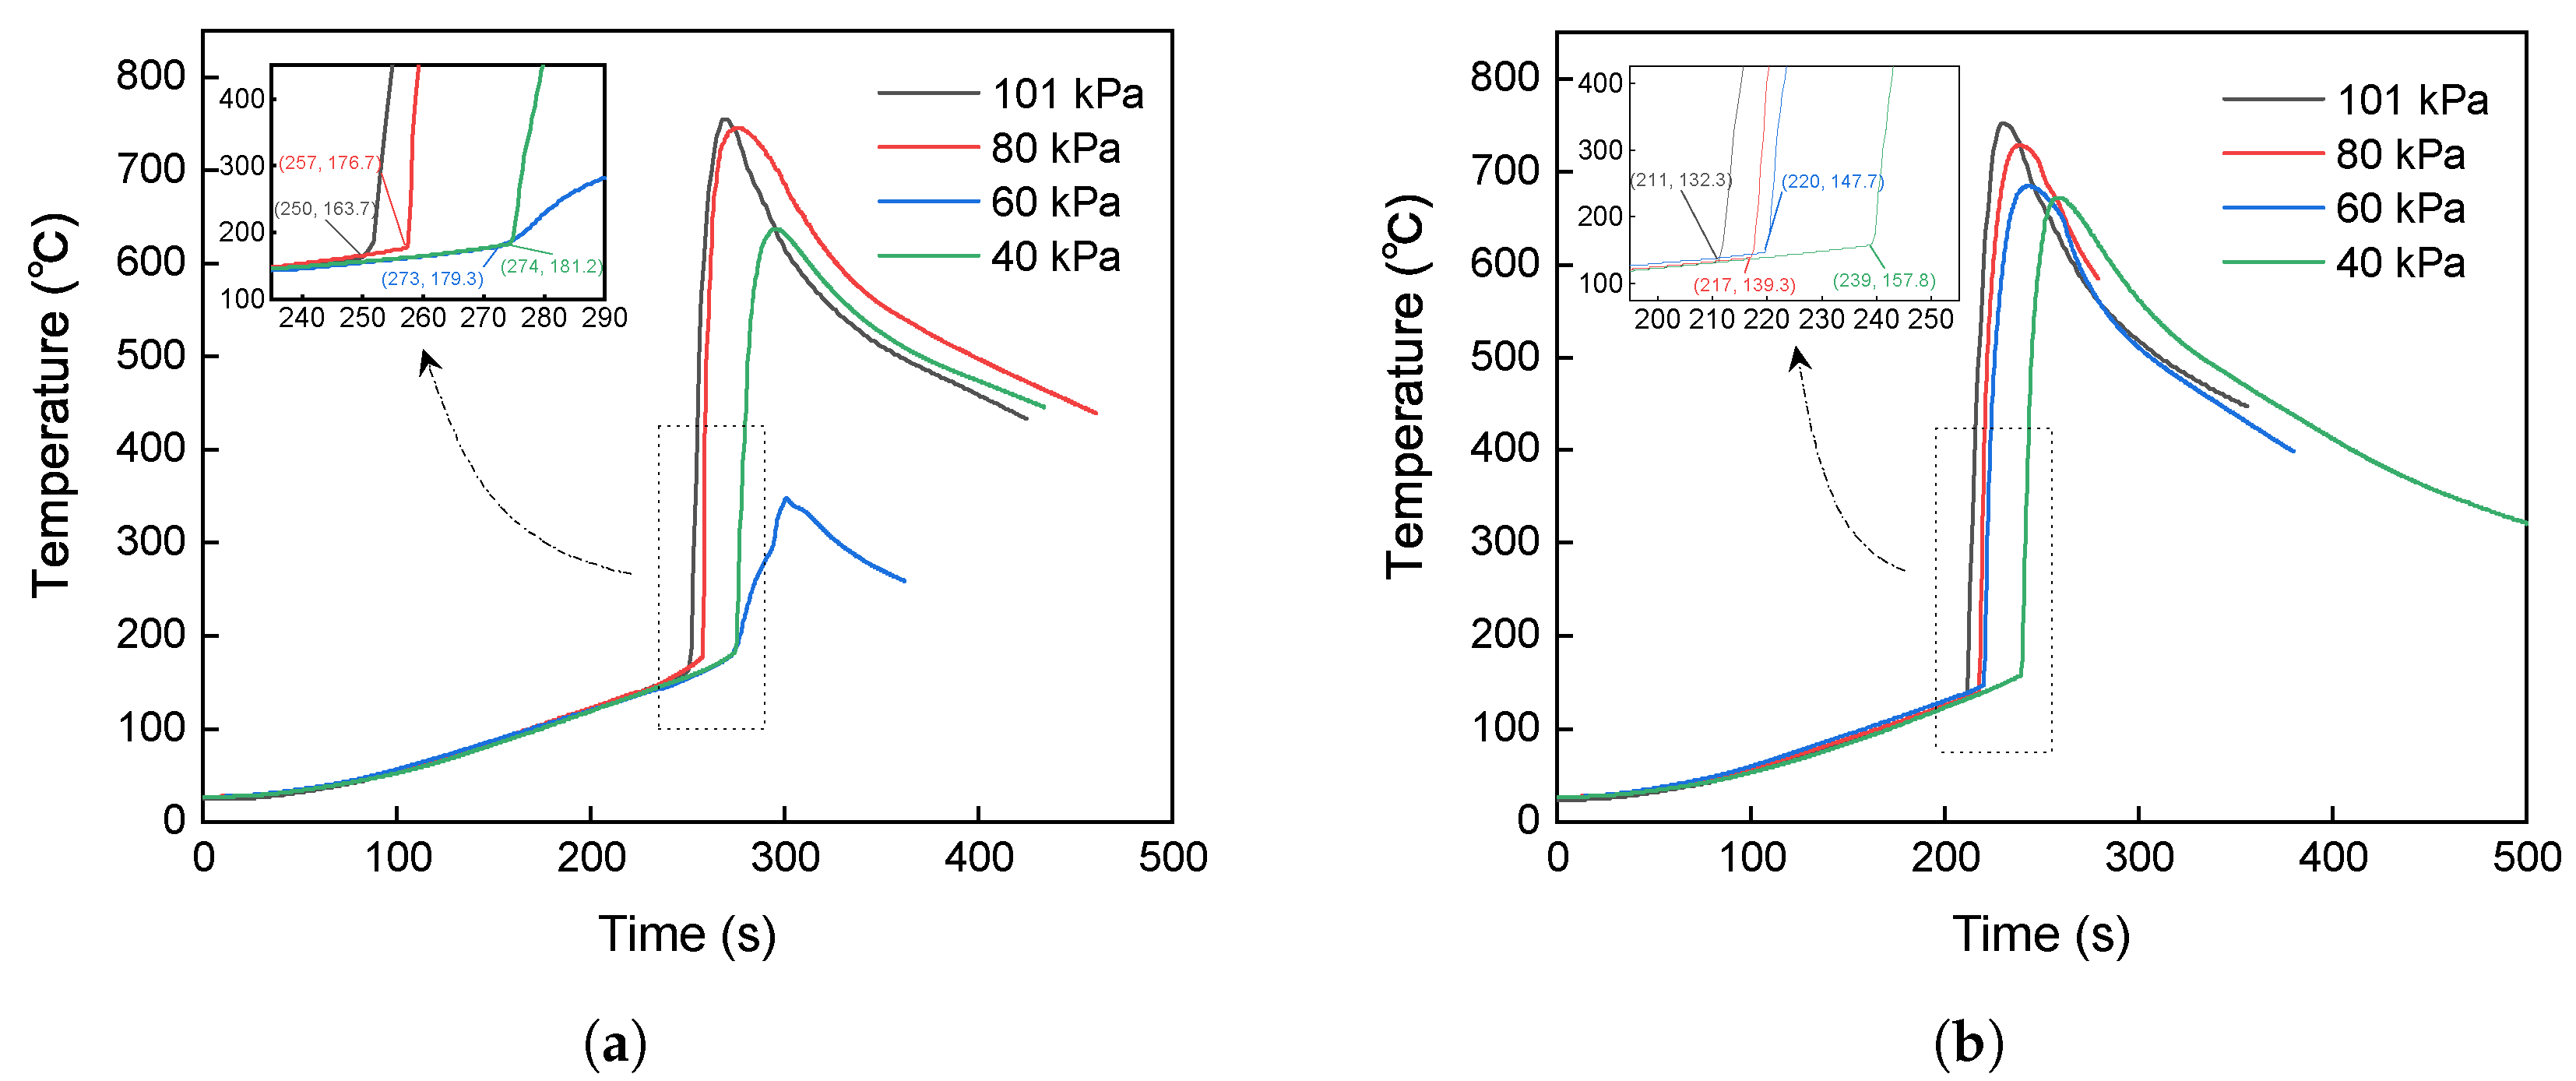
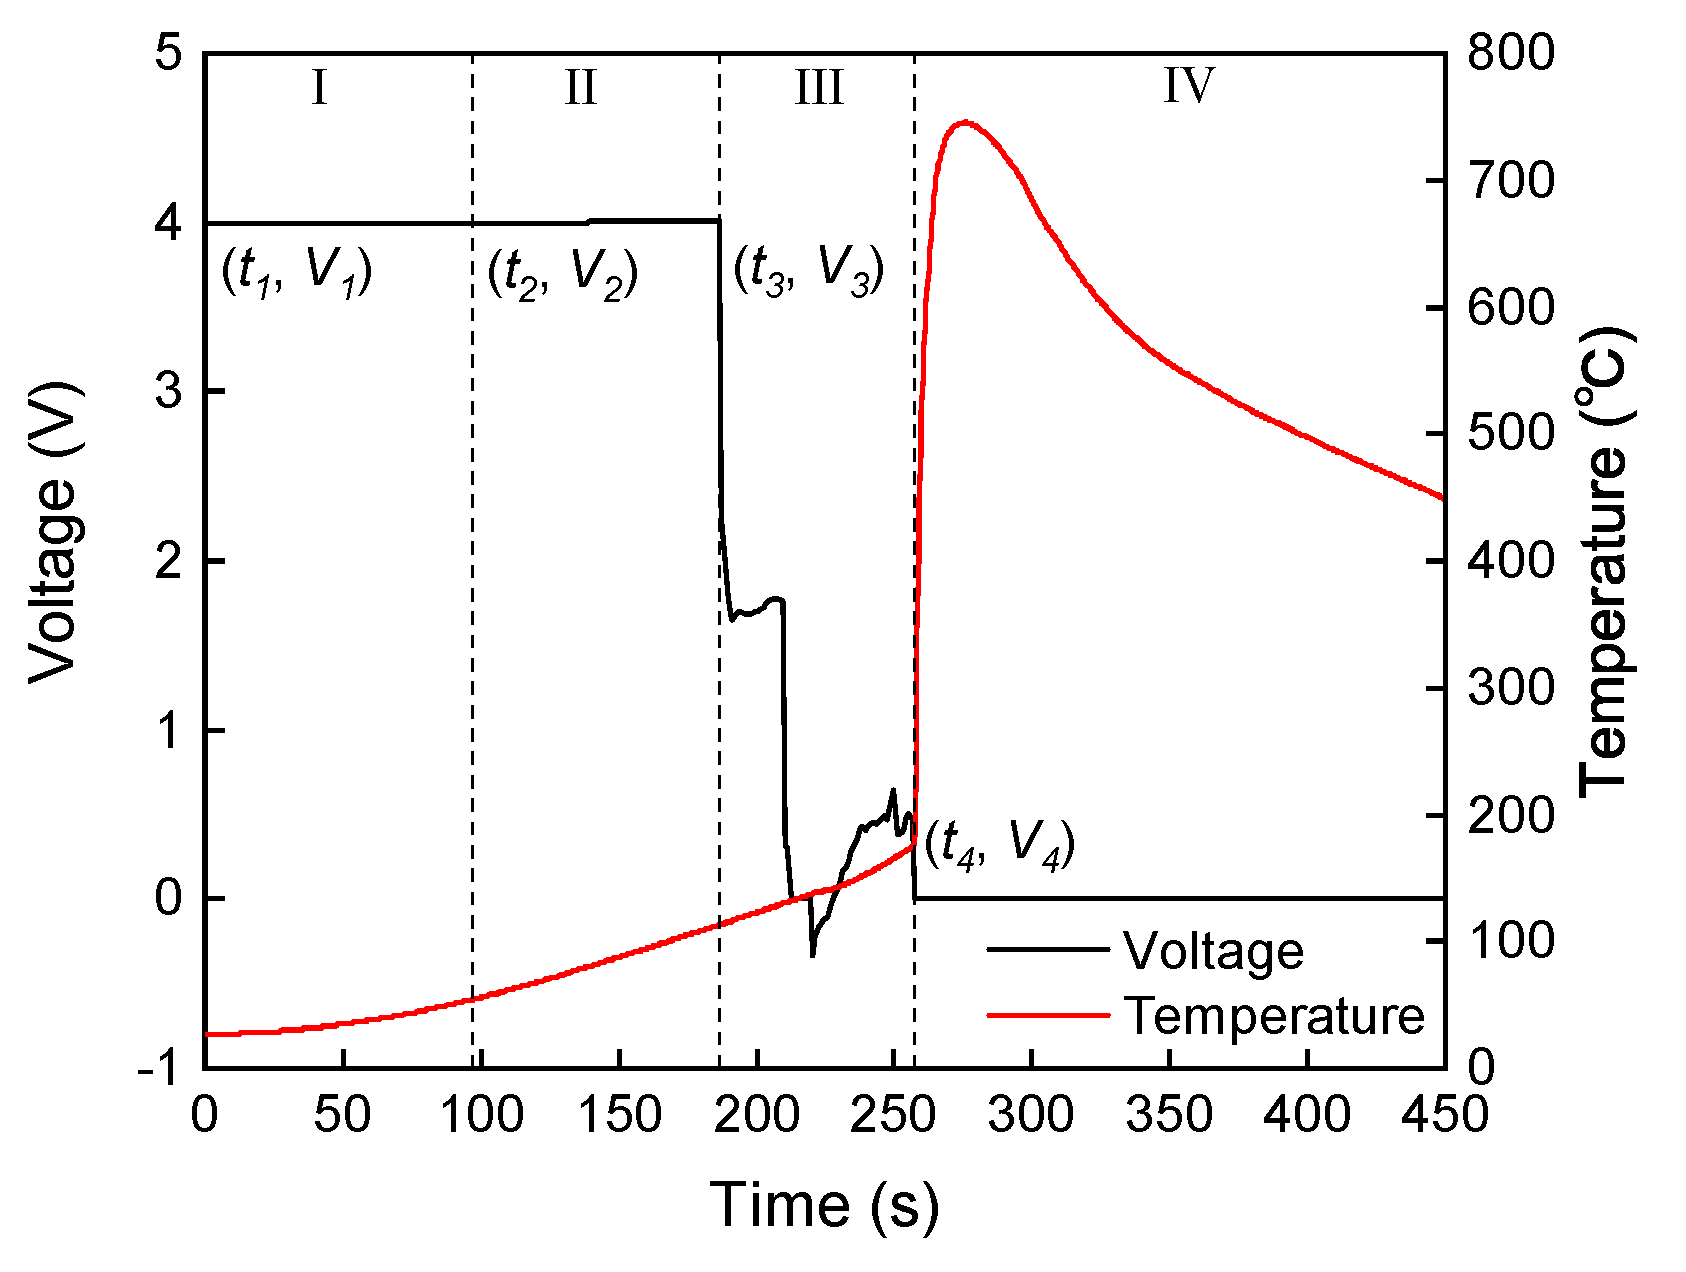
  • Stage I (Heating stage): The cell is heated, and the temperature increases with an average temperature rise rate of 0.50 °C/s at 80 kPa and of 0.49 °C/s at 40 kPa. Unstable chemical reactions occur inside the cell, gradually raising the surface temperature while the voltage drops sharply.
  • Stage II (Venting stage): When internal reactions accelerate and internal temperature rises to a certain level, the safety valve of the cell breaks, entering stage II, which is marked by a decrease in the temperature rise rate. It should be noted that venting does not always lead to a decrease in temperature [15,20,21,22,23]. A more accurate description is a decrease in the temperature rise rate, which will be further discussed below. The surface temperature of the cell rises relatively quickly during this stage, with an average temperature rise rate of 1.05 °C/s at 80 kPa and of 0.87 °C/s at 40 kPa. This stage is very brief, typically lasting within 1 min.
  • Stage III (Thermal runaway occurrence stage): The inside of the cell is entirely out of control, with surface temperature rising rapidly to a maximum rate of 235.44 °C/s at 80 kPa and of 72.88 °C/s at 40 kPa, releasing significant energy, finally causing fire or explosion.
Here, a discussion on the indicator of venting being a decrease in the temperature rise rate is provided. The temperature T can be expressed as a function of enthalpy H and pressure p [24]:
T = T ( H , p )
So, the contribution of venting to temperature change can be expressed as:
d T venting = T H p d H venting + T p H d p venting = 1 C p d H venting + μ J T d p venting
where μ J T is the Joule–Thomson coefficient [24]. Venting is an exothermic process because the internal gas temperature is higher than the external ambient temperature, so d H venting < 0 . Previous research show that the vented gases are primarily composed of CO, CO2, H2, CH4, C2H4, C2H2, C3H6, and HF, with H2 constituting a small proportion [3,25,26,27,28]. Except H2, μ J T > 0 [24], and d p venting < 0 ; thus, d T venting < 0 .
The temperature rise during stage I is contributed by the heating rod and internal chemical reactions:
d T stage I = d T heater + d T reactions
The temperature rise when venting occurs during stage II is contributed by the heating rod, internal chemical reactions, and venting:
d T stage II , venting = d T heater + d T reactions + d T venting
Since d T venting < 0 , thus d T stage II , venting < d T stage I , making the venting marked by a decrease in the temperature rise rate.
To enhance the fundamentals of this study, Figure 4 illustrates the mechanism of thermal runaway process of NCM811 LIBs. The battery consists of cathode material, anode material, separators, electrolyte, and outer shell. Additionally, there is a safety valve near the positive electrode. As the battery heats up, internal thermal expansion occurs, leading to a continuous increase in internal pressure. When the pressure difference between the inside and outside reaches the threshold for safety valve rupture, the safety valve breaks.
Previous studies indicate that NCM811 LIBs undergo various complex chemical reactions during the thermal runaway tests, including solid electrolyte interface (SEI) membrane decomposition, electrolyte decomposition, cathode decomposition, and reactions between cathode and electrolyte, etc. [29,30]. When the temperature is high enough, chemically adsorbed oxygen species at the cathode transform into physically adsorbed oxygen species, leading to the further release of oxygen from the surface, depicted by the following reaction equation:
Li x MO 2 LiMO 2 + MO x + O 2
The reaction of oxygen species (O2, O, O22−, etc.) released from the cathode with the electrolyte is considered the triggering reaction for thermal runaway. Highly reactive oxygen species immediately react with the electrolyte, releasing a significant amount of heat:
O n + C 3 H 4 O 3 C O 2 + 2 H 2 O
This process accelerates the phase transition in the cathode and the release of oxygen, creating a positive feedback loop. In the meantime, there are gas-producing and exothermic reactions of other materials, leading to the accumulation of a large amount of gas and energy, which ultimately cause burning [2]. Moreover, if the internal pressure is high and the vent outlet is blocked, resulting in slow gas venting, and if the pressure difference between the inside and outside exceeds the physical structural limits of the cell, the high-pressure battery may explode [31,32].

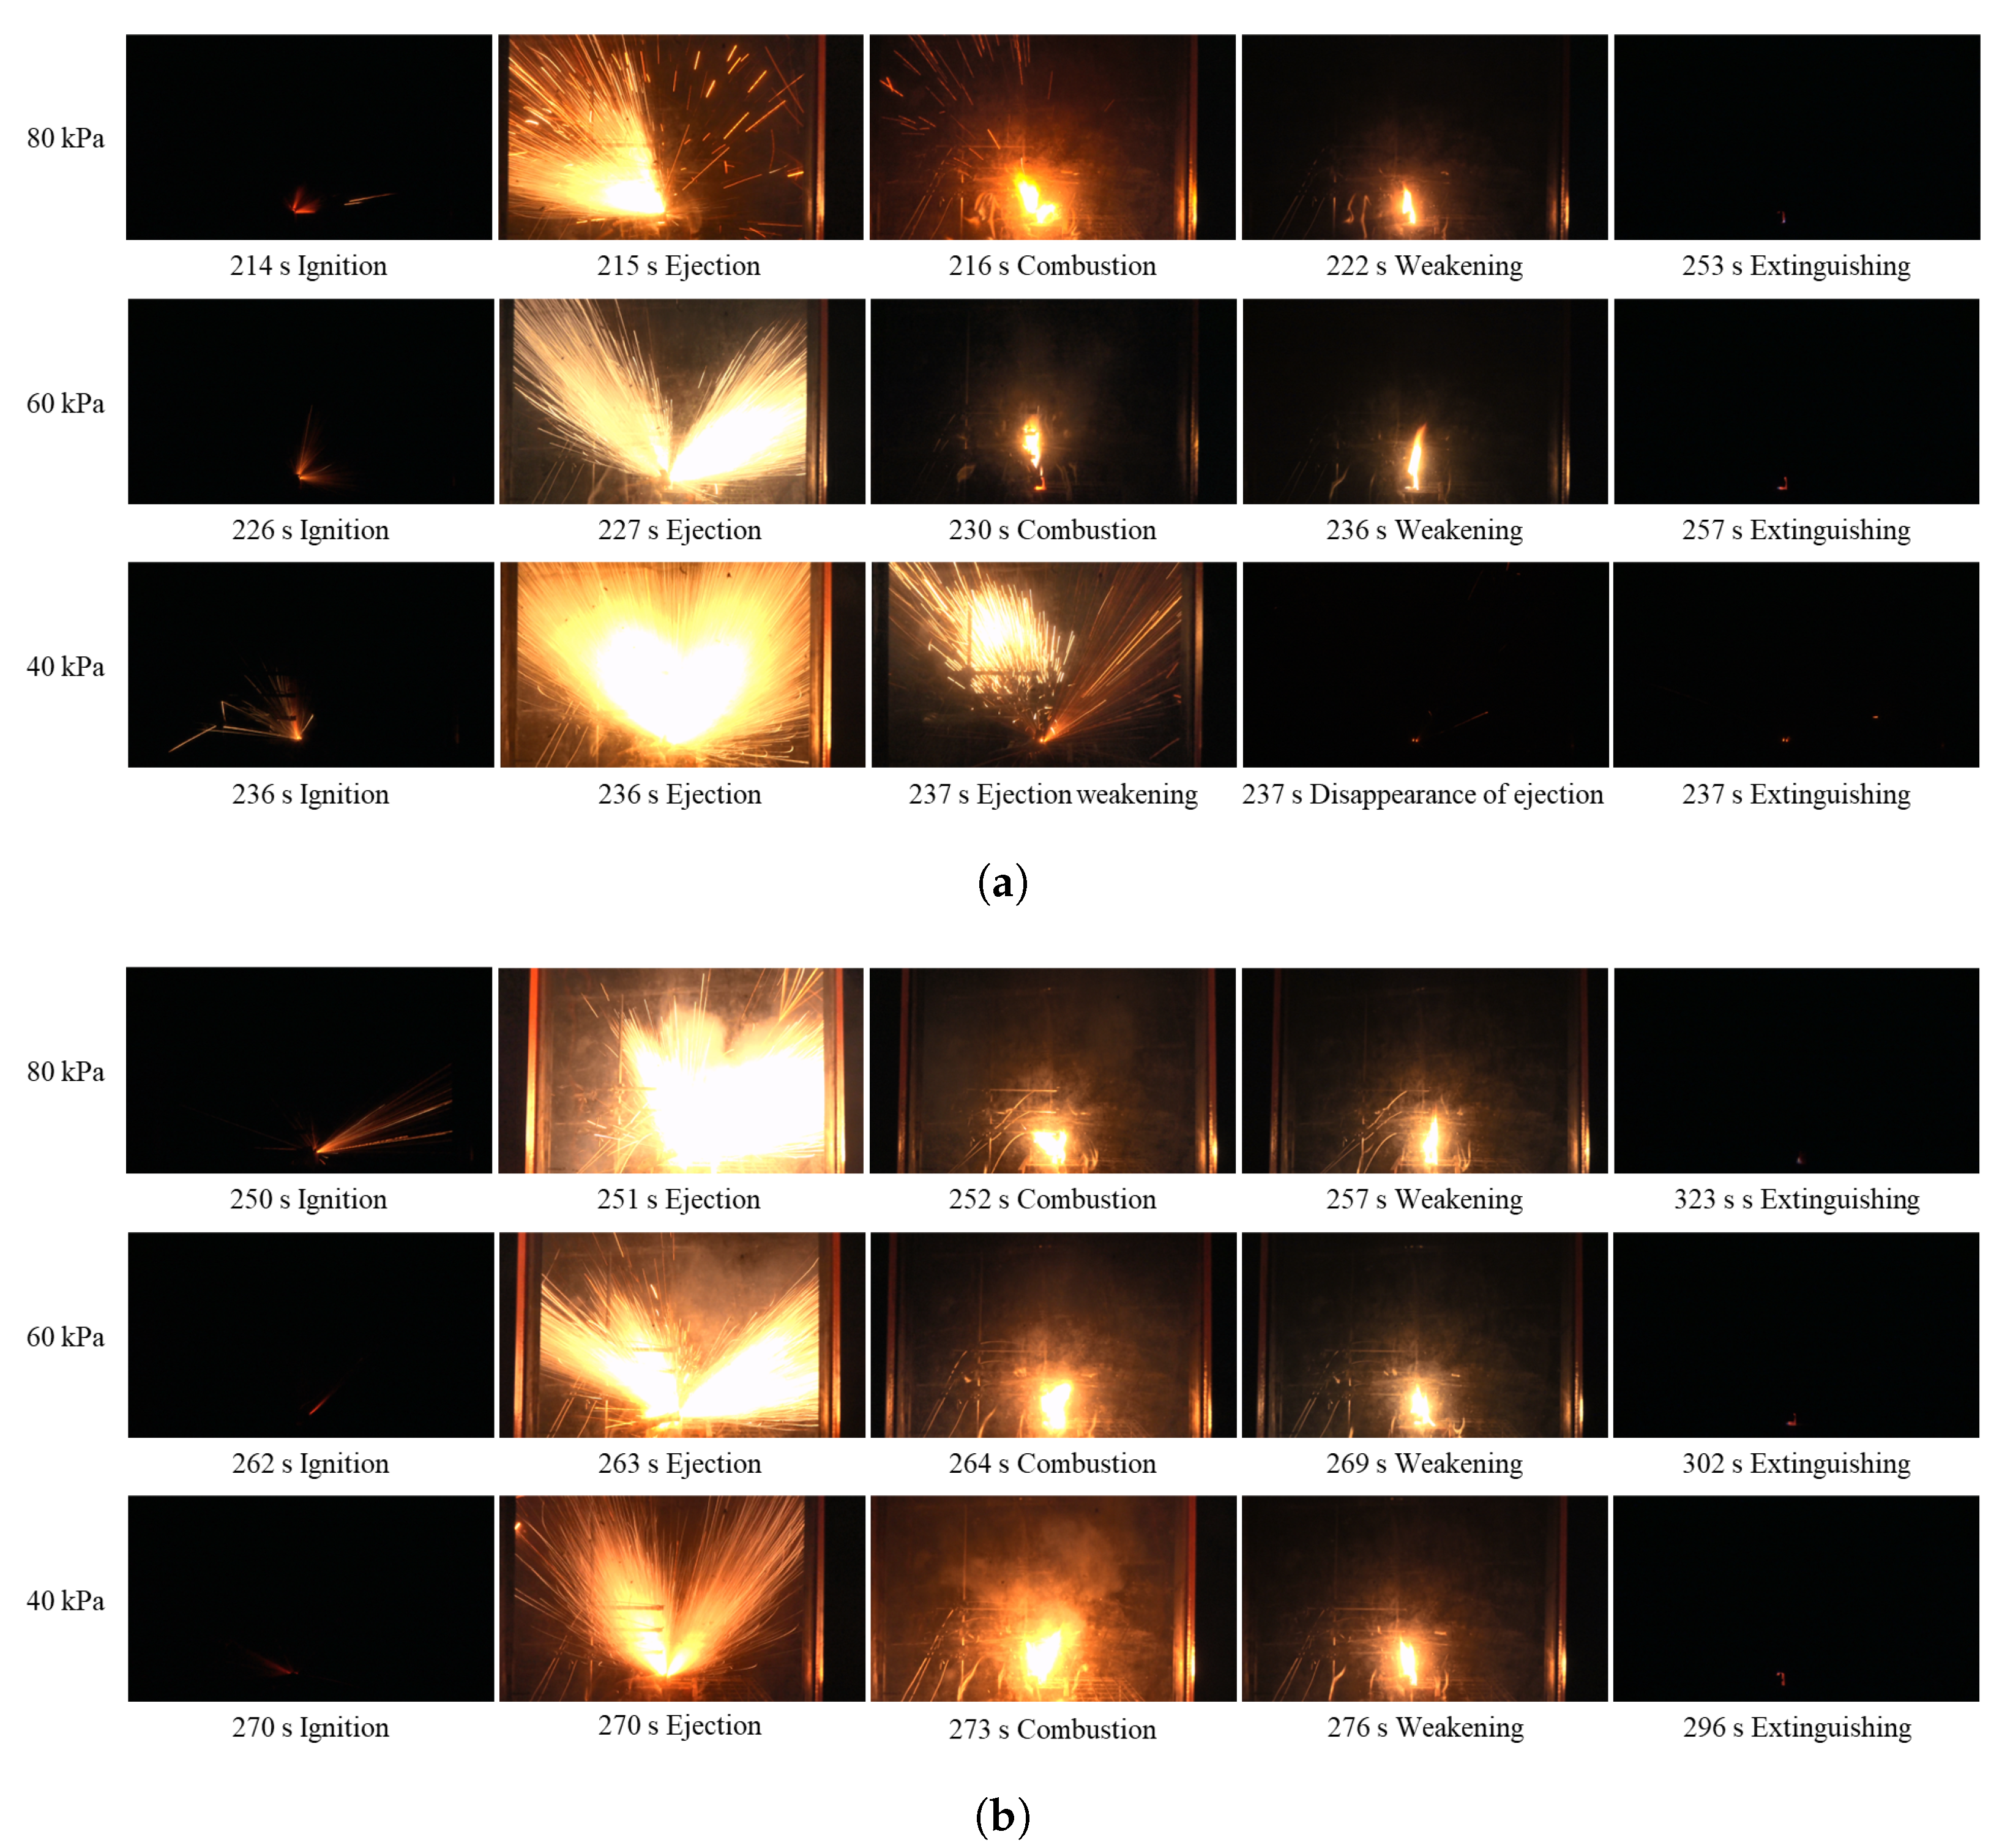
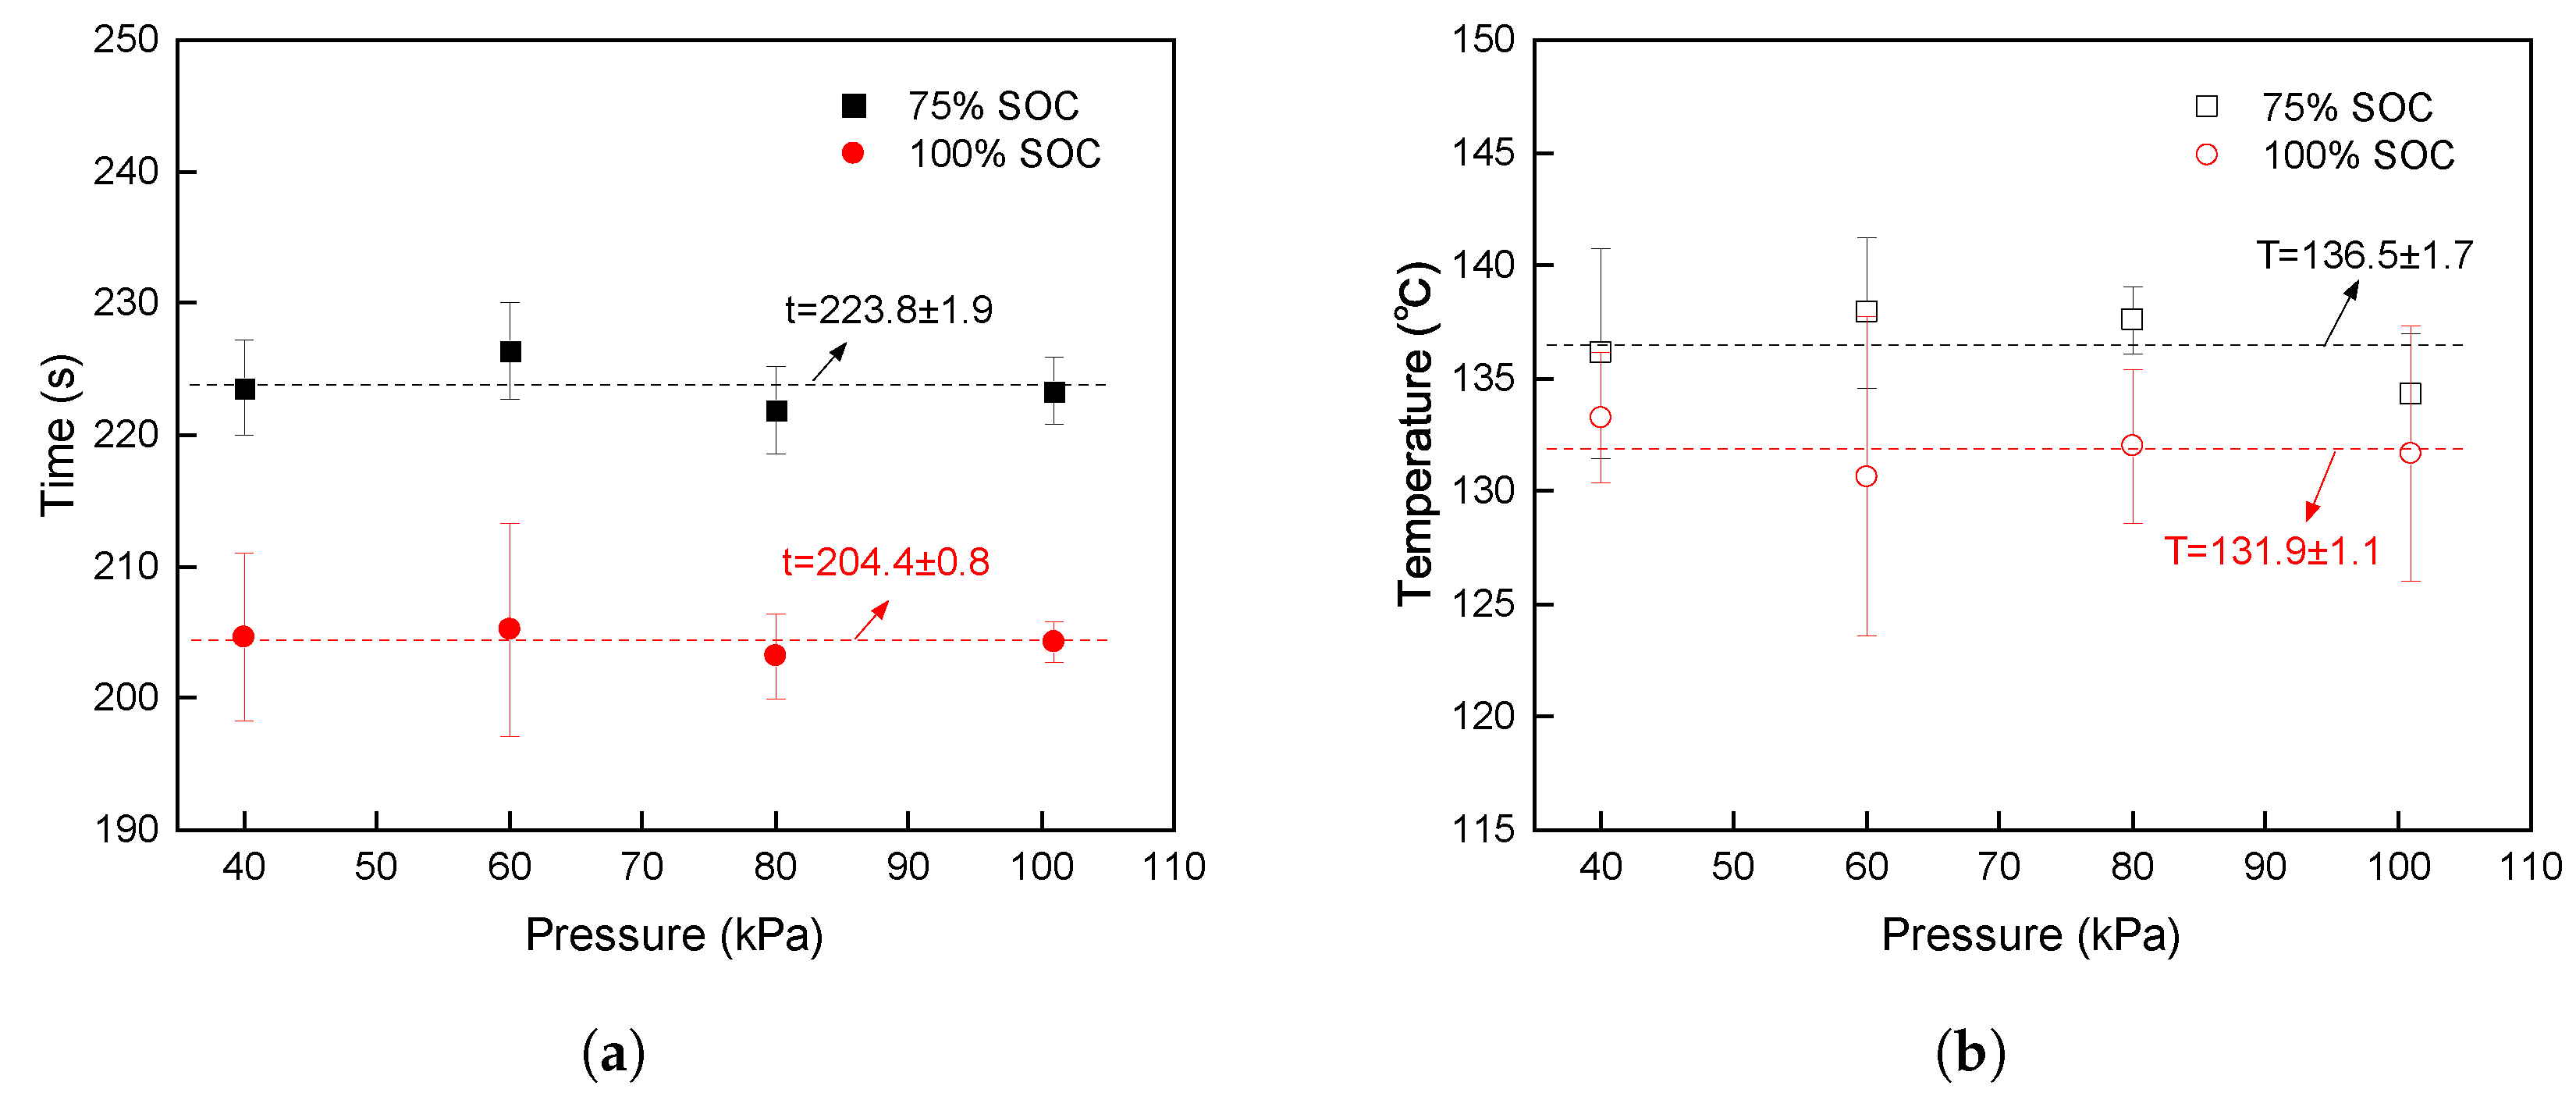
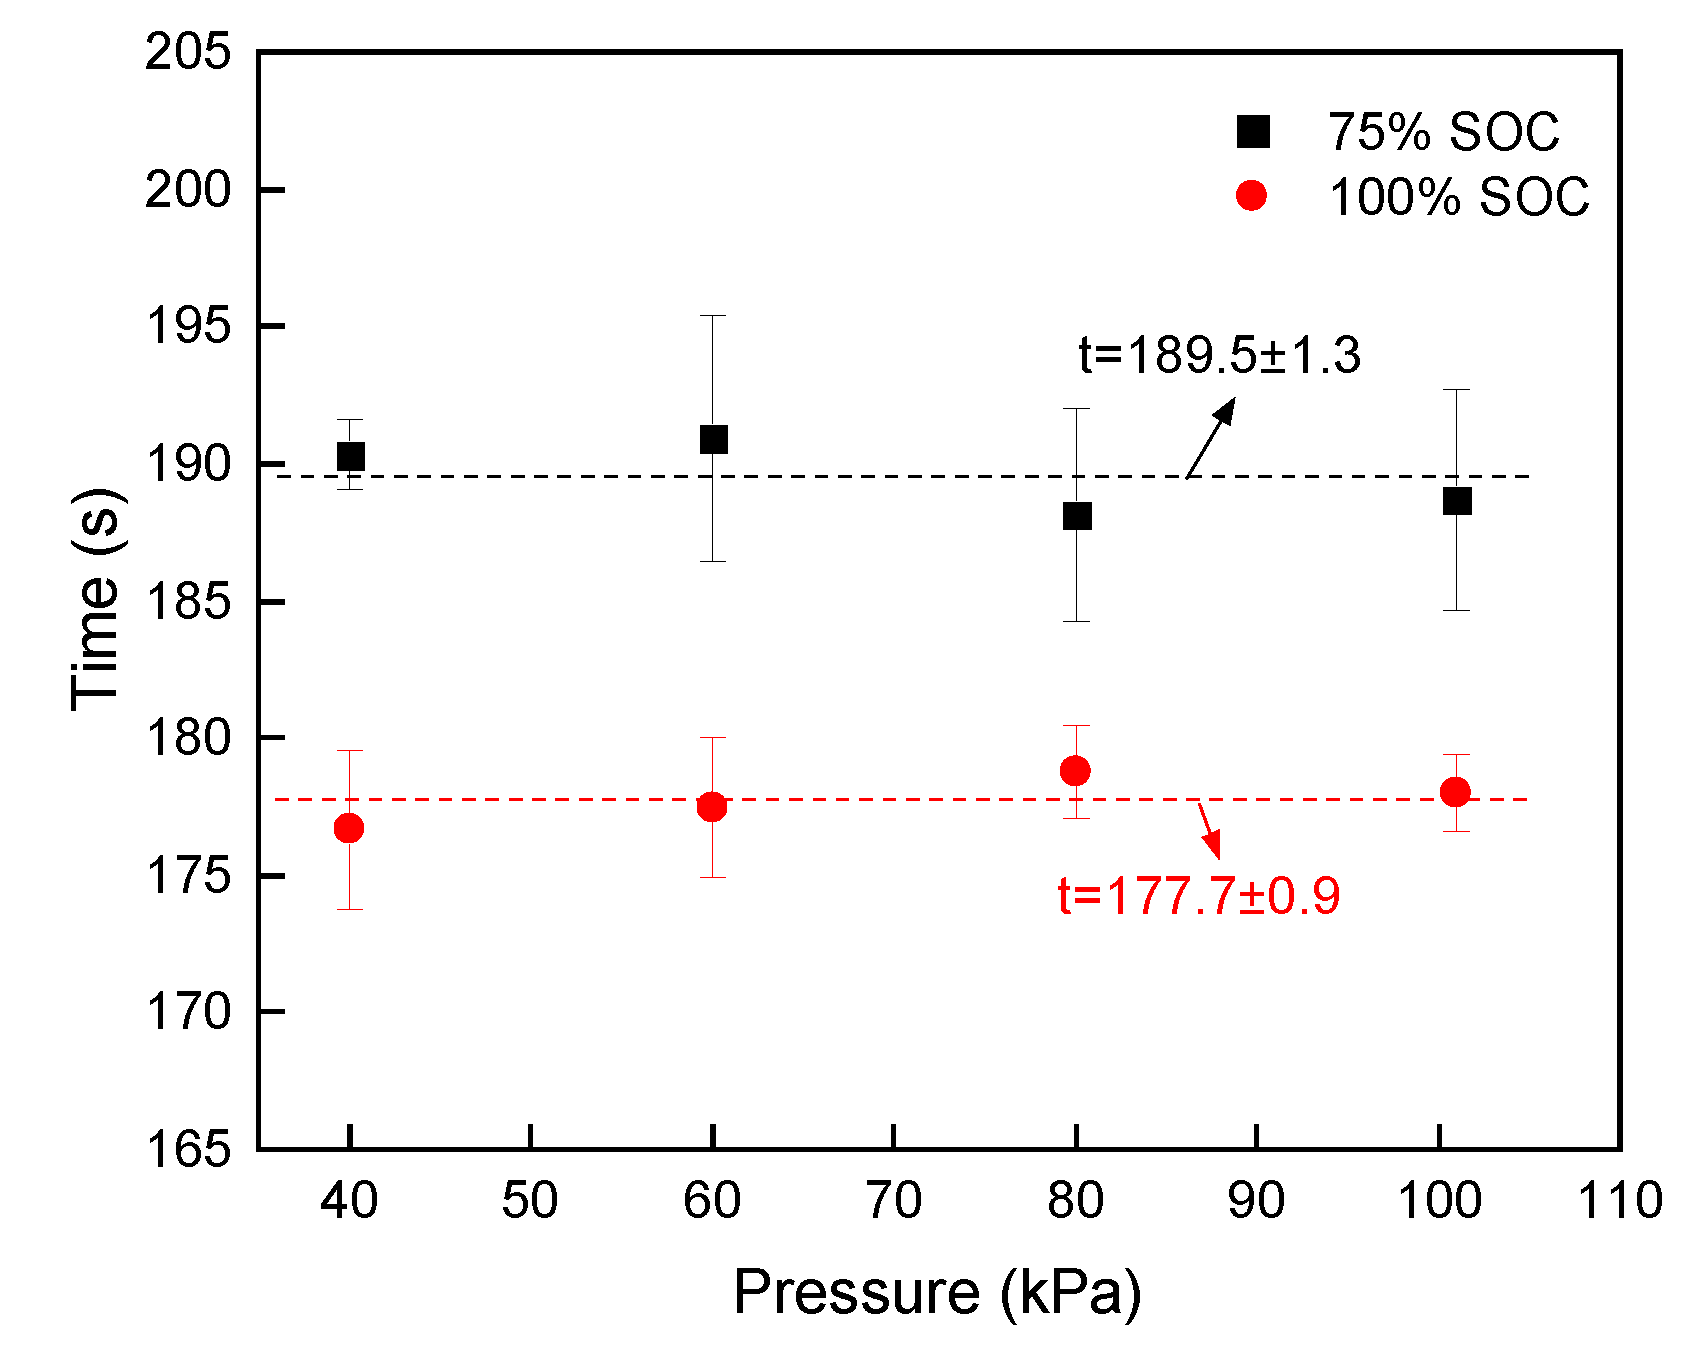
3.3. Venting and Thermal Runaway Events

Venting and thermal runaway events are critical and crucial in building a deep understanding of the thermal runaway characteristics of NCM811 LIBs. To facilitate analysis, the temperature evolution curves of cells at 75% SOC and at 100% SOC under different ambient pressures are depicted in Figure 5. For the cells at 75% SOC, under 101 kPa, 80 kPa, 60 kPa, and 40 kPa, thermal runaway triggering occurred at 250 s, 257 s, 273 s, and 274 s, respectively. Correspondingly, triggering temperatures of thermal runaway were 163.9 °C, 176.7 °C, 179.3 °C, and 181.3 °C, respectively. Furthermore, maximum surface temperatures after thermal runaway were 755.2 °C, 745.8 °C, 347.7 °C, and 637.4 °C, respectively. The increased gas generation and potential clogging of the vent outlet of the higher-energy-density cell resulted in an explosion at 60 kPa [2,31,33]. The jelly roll was ejected from the cell, carrying away a significant amount of heat, which caused the maximum surface temperature of the cell to differ from that when combustion alone occurred. For the cells at 100% SOC, under 101 kPa, 80 kPa, 60 kPa, and 40 kPa, thermal runaway triggering occurred at 212 s, 217 s, 220 s, and 239 s, respectively, and triggering temperatures of thermal runaway were 132.3 °C, 139.4 °C, 147.7 °C, and 157.8 °C, respectively, and maximum surface temperatures were 751.9 °C, 728.0 °C, 684.5 °C, and 672.0 °C, respectively. It is observed that onset times and temperatures of thermal runaway for both SOC conditions exhibit a negative correlation with pressures, whereas max surface temperatures show a positive correlation with pressures. This pattern is similar to that reported in the previous articles [15,34].
Venting is a sign for thermal failure of LIBs. Figure 6 shows characteristic times and temperatures of venting under different ambient pressures. The average time and temperature of venting for 75% SOC are 223.8 s and 136.5 °C, respectively, while for 100% SOC, the average time and temperature of venting are 204.4 s and 131.9 °C, respectively. It can be observed that pressure has almost no impact on the time and temperature of venting, but both decrease with an increase in SOC. The pressure difference between inside and outside the cell is given by
Δ p = p in p out p in = Δ p + p out
When Δ p p threshold , the safety valve breaks. At low pressure, p out is smaller; thus, the p in when the safety valve breaks is theoretically smaller. However, the threshold for safety valve rupture is on the order of MPa [35,36], and the pressure decrement (0.02 MPa) is too small with respect to the threshold. The cells at 100% SOC have anodes with a higher amount of lithium intercalation [18], resulting in more gas and heat released from chemical reactions. Therefore, venting is more dependent on the increase in p in caused by chemical reactions, electrolyte evaporation, and thermal expansion, making the influence of ambient pressure negligible.
The onset time and temperature of thermal runaway are important parameters for evaluating the thermal stability of LIBs and critical indicators for assessing thermal hazards. It is suggested to increase them to enhance battery safety and to serve as principles for battery design improvements. Figure 7 shows the characteristic onset times and temperatures for thermal runaway under different ambient pressures. It is conveyed that they decrease with increasing pressure or SOC.
For cells at 75% SOC, the average onset time of thermal runaway decreases from 274.9 s at 40 kPa to 246.7 s at 101 kPa, a reduction of 28.2 s. Correspondingly, the average onset temperature of thermal runaway decreases from 184.7 °C at 40 kPa to 165.4 °C at 101 kPa, a decrease of 19.3 °C. For cells at 100% SOC, the average onset time decreases from 245.9 s at 40 kPa to 205.1 s at 101 kPa, a reduction of 40.8 s. Similarly, the average onset temperature decreases from 162.1 °C at 40 kPa to 128.6 °C at 101 kPa, a decrease of 33.5 °C.
On the one hand, after venting, the jet flow immediately expands downstream of the nozzle to equilibrate with the ambient pressure, then pressure inside the cell stabilizes at a value close to the ambient pressure [31]. At lower pressures, electrolyte evaporates faster [19], resulting in reduced electrolyte involved in exothermic reactions and slower accumulation of combustible gases and heat. On the other hand, the oxygen concentration decreases as the ambient pressure is decreased, resulting in the reduction of the oxygen participating in the chemical reactions. Therefore, the onset time and temperature of thermal runaway increase at lower pressures.
Cells at 100% SOC have higher active material content than cells of 75% SOC do, allowing them to accumulate combustible gases and heat more quickly, resulting in lower onset time and temperature of thermal runaway. However, the effect of ambient pressure on the onset time and temperature of thermal runaway is more pronounced for 100% SOC. With increasing ambient pressure, the thermal stability of cells at 100% SOC diminishes more significantly than that of cells at 75% SOC. At 101 kPa, the onset temperature of thermal runaway of 100% SOC is even 36.8 °C lower than that of 75% SOC.
While decreasing ambient pressure increases the onset time and temperature of thermal runaway, the lowest ambient pressure explored in this study, down to 40 kPa, is still unable to prevent thermal runaway. Therefore, the thermal safety issues of NCM811 LIBs at low pressures should not be overlooked. Furthermore, compared with previous experimental data on thermal runaway under low pressures [15,34,37], the extent to which the thermal runaway onset time and temperature of NCM811 LIBs increase as the ambient pressure is decreased is smaller in this study. This is because NCM811 LIBs can release more oxygen at lower temperatures [38,39], making them less sensitive to the reduction in oxygen concentration caused by the decrease in pressure compared to LIBs with normal Ni content, such as LiFePO4 LIBs or LiCoO2 LIBs, etc.
The maximum surface temperature after thermal runaway reflects the intensity of the combustion reaction and can assess the hazard caused by thermal runaway to the surrounding environment. Figure 8 summarizes the maximum surface temperatures of cells after thermal runaway under different ambient pressures. The maximum surface temperature increases with increasing pressure; in particular, as the pressure is raised from 40 kPa to 60 kPa, the maximum surface temperature significantly rises from 667.0 °C to 716.1 °C for 75% SOC, and from 687.2 °C to 729.1 °C for 100% SOC, an increase of 49.1 °C for 75% SOC and of 41.9 °C for 100% SOC. This is because oxygen concentration is higher under higher pressures, increasing the reactant concentration in combustion reactions and heat released by them, thereby the maximum surface temperature is higher under higher pressures. This implies that thermal runaway at higher ambient pressures is more hazardous and destructive. However, the maximum surface temperature after thermal runaway remains high at 80 kPa and 60 kPa, and only when the pressure is reduced to 40 kPa is the hazard of thermal runaway somewhat controlled.

3.4. Open Circuit Voltage

The open circuit voltage reflects the progress of internal chemical reactions within the cell while the surface temperature is a more delayed indicator. Figure 9 illustrates the voltage evolution during thermal runaway process of the cell. As shown in the figure, the voltage can be divided into four stages:
  • Stage I (Voltage stabilization stage): This stage spans from a surface temperature of 28 °C to 55 °C. Before thermal runaway, there is a period during which the voltage remains stable. During this stage, the voltage may exhibit slight fluctuations due to minor heat accumulation, but these changes are not significant. The voltage slightly increases from V 1 (3.9973 V) to V 2 (3.9998 V).
  • Stage II (Voltage rise stage): This stage spans from a surface temperature of 55 °C to 113 °C. During the accelerated heating phase, the voltage rises above its initial value, reaching a peak at V 3 (4.0042 V). This may be attributed to the enhanced ionic conductivity of the electrolyte and reduced internal resistance as the temperature increases [40], resulting in a temporary voltage rise.
  • Stage III (Voltage decline stage): This stage spans from a surface temperature of 113 °C to 177 °C. After reaching the peak voltage, the voltage begins to sharply decline as severe chemical and structural degradation occurs within the cell. Internal short circuits are caused by the collapse of the separator [41,42]. This sharp voltage drop is an advanced characteristic indicator that the cell is approaching thermal runaway in contrast to the sharp surface temperature rise.
  • Stage IV (Voltage collapse stage): At the onset of thermal runaway, the voltage collapses to an extremely low level, reaching V 4 (−0.0006 V). This indicates that the internal chemical reactions are almost entirely out of control and the internal structure of the battery is completely destroyed.
Figure 10 shows the voltage drop times of cells at 75% SOC and 100% SOC under different ambient pressures. The impact of pressure on the voltage drop times of both SOC is slight. The average voltage drop time for 75% SOC is 189.5 s, while for 100% SOC, it is 177.7 s. The voltage drop occurs before the safety valve breaks, during which the cell is a closed system. The collapse of the separator is the direct cause of the sharp voltage drop, and the heat required for the separator to collapse mainly depends on the heat released by internal chemical reactions. Therefore, the voltage drop times are nearly identical under different pressures. Furthermore, the cells at 100% SOC undergo the sharp voltage drop 11.8 s earlier than the cells at 75% SOC do.

3.5. Comparison of Characteristic Parameters

To identify the intervals between the events mentioned above and the potential for early warning, Figure 11 summarizes characteristic times of voltage drop, venting, and thermal runaway of cells at 75% SOC and 100% SOC under different ambient pressures. The differences between characteristic times for 75% SOC are significantly larger compared to those for 100% SOC. The average voltage drop time is 34.3 s earlier than the average venting time for 75% SOC, while for 100% SOC, the average voltage drop time is 26.7 s earlier than the average venting time. As the pressure is decreased from 101 kPa to 40 kPa, the difference between the average voltage drop time and the thermal runaway onset time, as well as the difference between the average venting time and the thermal runaway onset time, increases. This indicates that voltage drop and venting can provide earlier warnings of thermal runaway under lower pressures. Therefore, paying attention to voltage drop and venting events under low pressures is of significant importance. It is noteworthy that venting and thermal runaway events are very close for 100% SOC at 101 kPa, differing by just 0.5 s. It shows that cells at higher SOC exhibit more intense internal chemical reactions under higher pressures, and the accumulated combustible gases and heat after venting, plus oxygen, immediately satisfy the conditions required for the battery to ignite. Therefore, only the voltage signal can provide an early warning for the cell at 100% SOC under 101 kPa.

3.6. Mass Loss

To compare changes in cell mass after thermal runaway. Figure 12 shows the mass loss and mass loss fraction of cells. As the ambient pressure is increased from 40 kPa to 101 kPa, the average mass loss for 75% SOC increases from 14.72 g to 17.41 g, with the average loss fraction increasing from 33.6% to 39.7%. For 100% SOC, the average mass loss increases from 18.74 g to 20.87 g, with the average loss fraction increasing from 42.8% to 47.6%. Additionally, the average mass loss and average mass loss fraction for 100% SOC are higher than those for 75% SOC. Mass loss and loss fraction slightly decrease with lower ambient pressures and SOC. It indicates that the intensity of internal chemical reactions is weaker at lower pressures and SOC; this is consistent with the changes in the onset time and temperature of thermal runaway and the maximum surface temperature after thermal runaway discussed above.

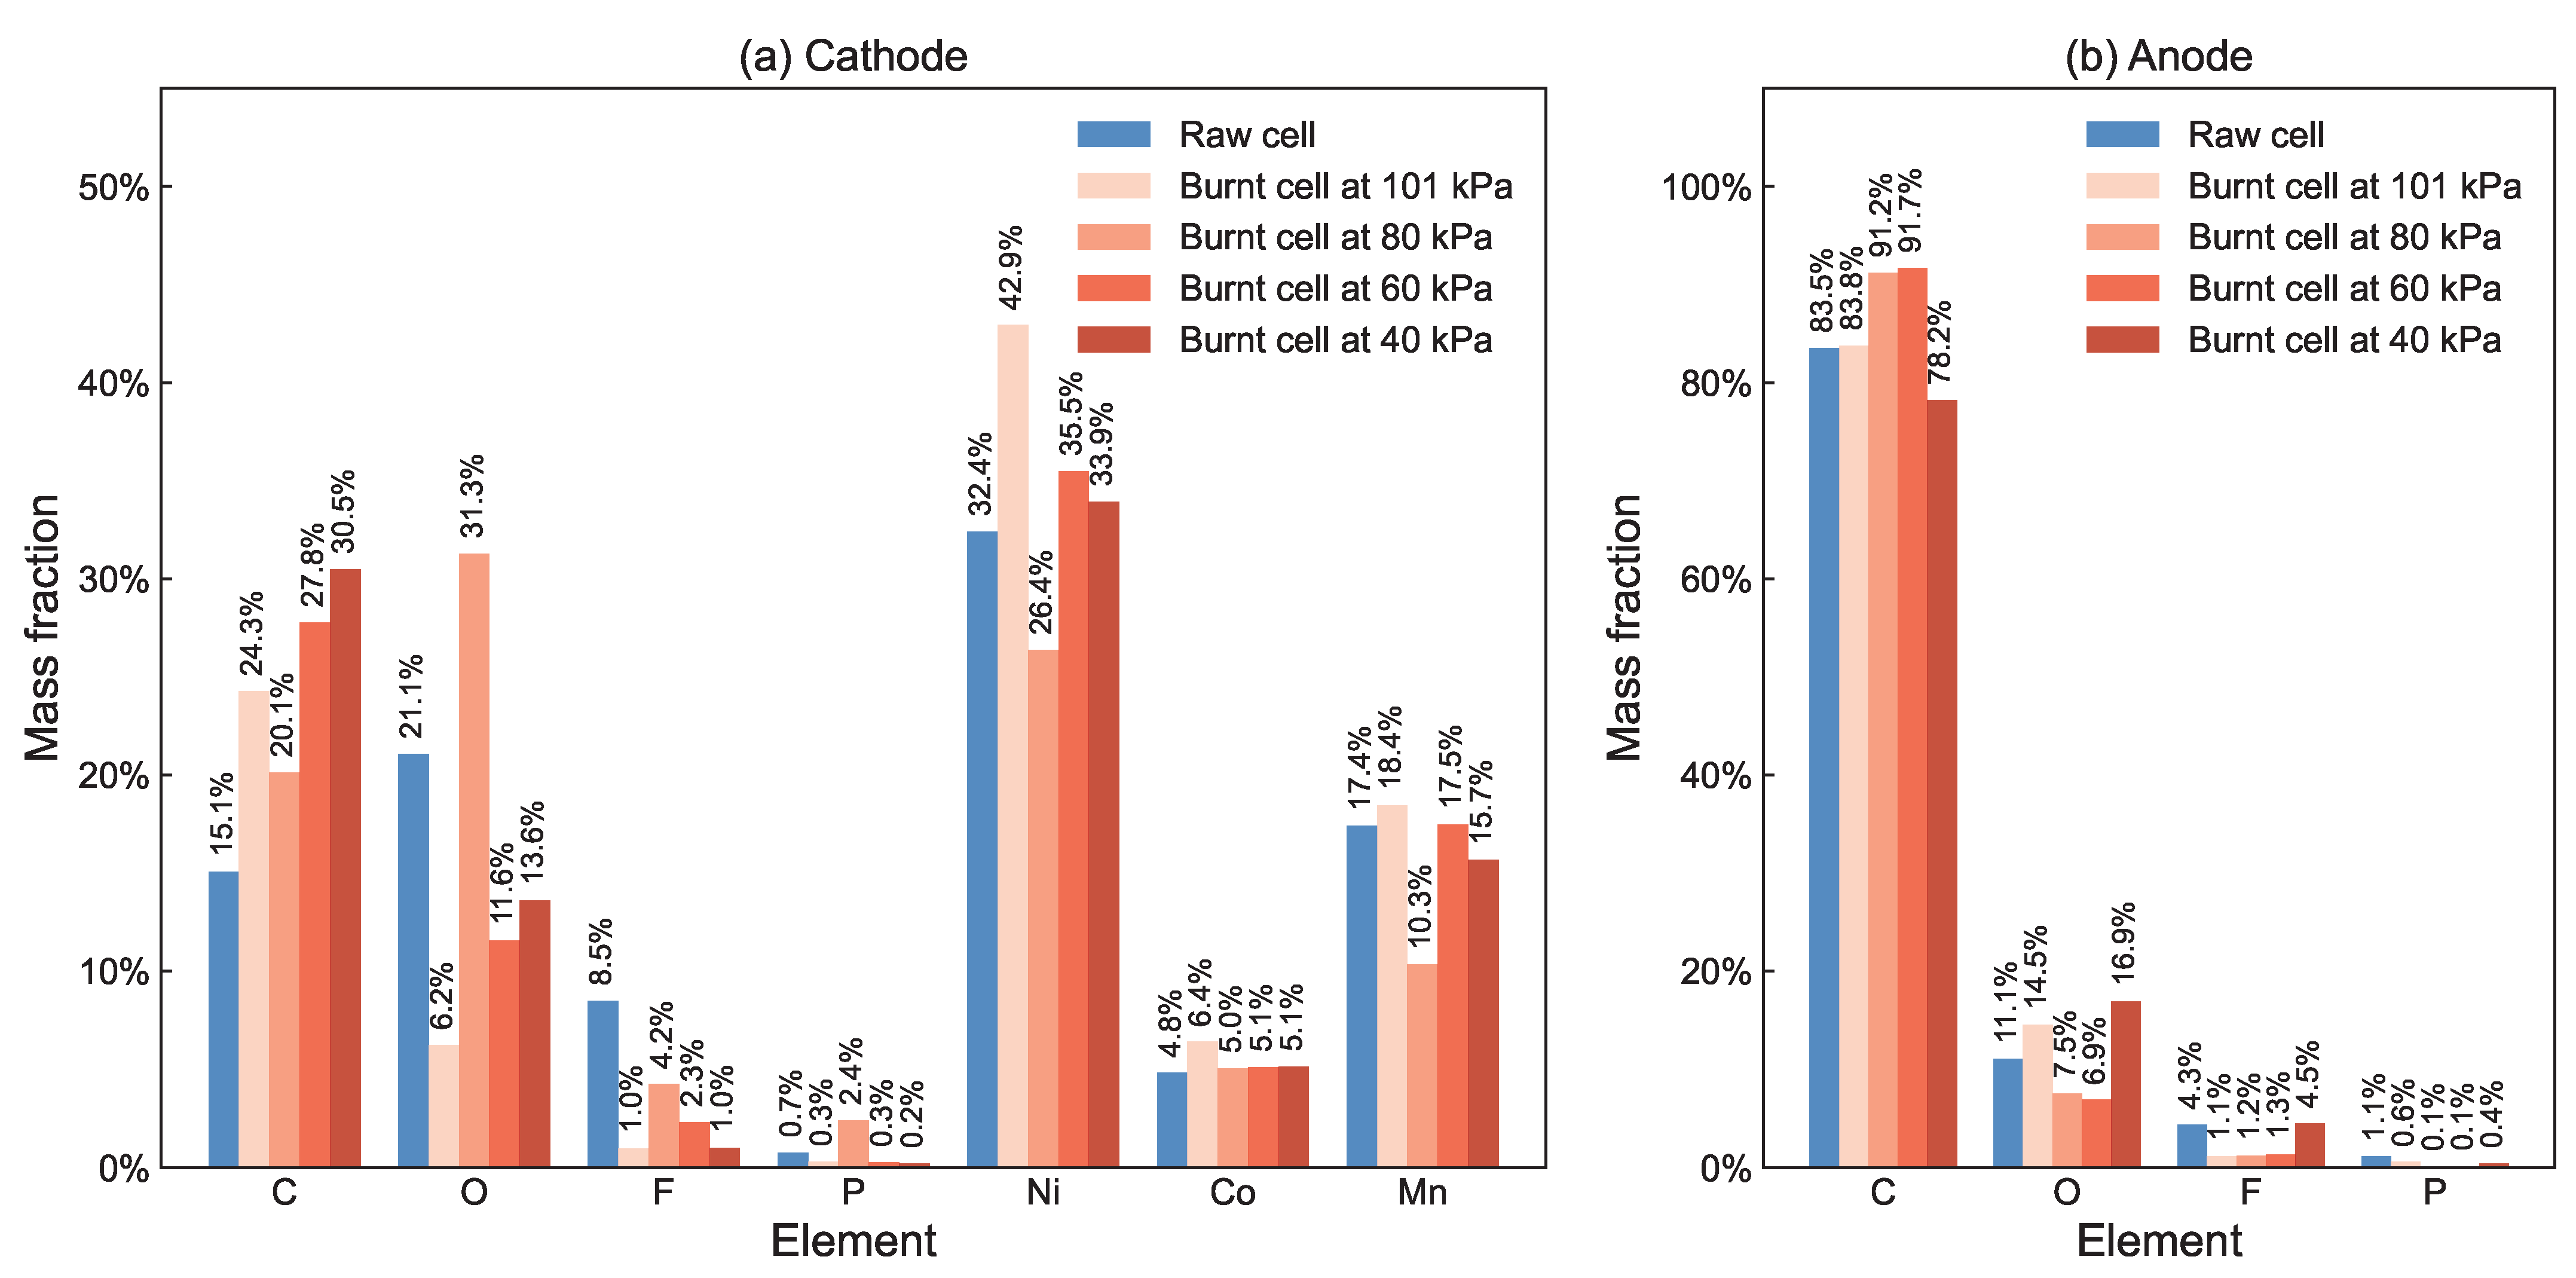
3.7. Post Testing Analysis

Post-testing SEM/EDS analysis was performed to characterize chemical reactions occurring within the electrodes of the cell. SEM/EDS analysis is a mature technical approach used for analyzing battery remnants after thermal runaway [43,44].
As shown in Figure 13, it can be found that particles of the anode and the cathode for the raw cell are both intact, with smooth and clean surfaces. However, after thermal runaway, the integrity of the cell particles is destroyed. The anode surface develops cracks. The deformation of the cathode surface is more severe than that of the anode surface, and there are many pores formed. It suggests that exothermic reactions occurring within the cathode have more pronounced intensity, as the previous research [2] has found that reactions between cathode and electrolyte release tremendous heat.
As shown in Figure 14, the decrease in the element F at the cathode is significant. At 101 kPa, the F element content is the lowest, indicating the last remaining electrolyte; that is, the chemical reactions within the cathode are the most intense. From 80 kPa to 40 kPa, the F element content gradually decreases, but the internal chemical reactions do not become intense accordingly, suggesting more electrolyte evaporates at lower pressures. As for the anode, there is also a certain decrease in the F element. From 40 kPa to 101 kPa, the F element content gradually decreases, indicating that the chemical reactions within the anode become intense as the ambient pressure increases.

3.8. Heat Transfer Analysis

To further analyze the impact of ambient pressure on thermal runaway behavior of the cell, a simplified heat transfer model is presented. In this study, the heat sources of the cell include thermal conduction from the heating rod and heat generation from chemical reactions within the cell. The heat sinks of the cell mainly consist of convective and radiative heat dissipation to the surrounding environment. Therefore, the energy balance equation of the cell can be expressed as:
c m d T B d t = q ˙ cond + q ˙ reac q ˙ conv q ˙ rad
where c is the specific heat capacity of the cell, m is the mass of the cell, T B is the temperature of the cell, q ˙ cond is the conduction heat from the heating rod to the cell, q ˙ reac is the heat released by reactions, q ˙ conv is the convective heat from the cell to the ambient air, and q ˙ rad is the radiative heat out to the ambient air.
The conduction heat from the heating rod to the cell can be obtained by
q ˙ cond = 1 R ( T H T B )
where R is the thermal contact resistance, T H is the temperature of the heating rod.
The convective heat out to the ambient air is calculated as:
q ˙ conv = h A T B T amb
where h is the convective heat transfer coefficient, A is the effective heat dissipation area, T amb is the temperature of the ambient air.
Furthermore, radiative heat out to the ambient air is calculated as:
q ˙ rad = ϵ σ A ( T B 4 T amb 4 )
where ϵ is the emissivity of the cell surface, σ is the Stefan–Boltzmann constant.
As for the self-heating from chemical reactions, it can be estimated by the following equation:
q ˙ reac = i Δ H i M i n i K i exp E a , i R T B
where Δ H is the heat release rate of the reaction, M is the initial mass of reactants, n is the reaction order, K is the pre-exponential factor, E a is the activation energy for the reaction, and R is the universal gas constant. After venting, the internal pressure of the cell quickly reaches equilibrium with the external pressure. Oxygen from the ambient environment enters the cell and is likely to participate in related reactions. According to previous studies [34,45], the lower oxygen concentration under low pressure reduces the rate of internal chemical reactions, as does the faster evaporation of the electrolyte under low pressure discussed above. Therefore, q ˙ reac is smaller under lower pressure, which leads to an increase in the onset time and temperature of thermal runaway as the pressure is decreased.

4. Conclusions

This paper systematically studies the thermal runaway behavior of NCM811 LIBs at two highly hazardous SOC (75% and 100%) under different aviation ambient pressures (101 kPa, 80 kPa, 60 kPa, and 40 kPa). Venting and thermal runaway events are two key events in the cell thermal runaway process. Criteria for thermal runaway and venting based on the second derivative of the surface temperature of the cell are proposed. The pressure decrement is negligible relative to the safety valve rupture threshold (on the order of MPa). Therefore, times and surface temperatures of venting are almost the same under different pressures. SEM/EDS analysis and video records of electrolyte burning duration verifies that more electrolyte evaporates under lower pressures. Additionally, the oxygen concentration is lower under lower pressures, these two factors contribute to a reduction in the intensity of chemical reactions; thus, the onset time and temperature of thermal runaway increase under lower pressures. However, the lowest pressure of 40 kPa explored in this paper still cannot prevent the occurrence of thermal runaway. Moreover, compared to other previously studied LIBs, the oxygen release of NCM811 LIBs shifts to lower temperatures and with higher intensity, resulting in a smaller increase in the onset time and temperature of thermal runaway. This indicates that the thermal stability of NCM811 LIBs is relatively poor under low pressure.
Voltage can reflect the progress of internal chemical reactions and is an important parameter that can be observed earlier than the surface temperature to monitor battery status. As the ambient pressure is decreased, the gap between the voltage drop time and the thermal runaway onset time widens, highlighting the significant early warning role of the voltage signal under low pressure.
The thermal runaway behavior of cells at 100% SOC under 101 kPa is the most dangerous and harmful. The time interval between venting and thermal runaway is only 0.5 s, and only the voltage signal can provide an early warning. SEM/EDS analysis verifies that the intensity of internal chemical reactions is the greatest due to the highest amount of active materials and the highest ambient oxygen concentration. Once combustible gases are released, they quickly meet the ignition requirements.

Author Contributions

Conceptualization, Y.J.; methodology, Y.J. and D.M.; software, Y.J.; validation, Y.J., D.M. and X.-H.W.; formal analysis, Y.J.; investigation, Y.J., D.M. and C.-X.Z.; resources, Y.J., D.M., C.-X.Z., J.-L.Y., X.-H.W. and J.W.; data curation, Y.J.; writing—original draft preparation, Y.J.; writing—review and editing, Y.J., D.M., X.-H.W. and J.W.; visualization, Y.J.; supervision, Y.J., D.M., X.-H.W. and J.W.; project administration, Y.J., D.M., C.-X.Z., X.-H.W. and J.W.; funding acquisition, X.-H.W. and J.W. All authors have read and agreed to the published version of the manuscript.

Funding

This work is supported by the Guangdong Basic and Applied Basic Research Foundation (2021B1515130008) and the Science and Technology Program of Fire and Rescue Department Ministry of Emergency Management of China (2022XFZD12).

Data Availability Statement

The data presented in this work will be available on request.

Conflicts of Interest

The authors declare no conflicts of interest.

References

  1. Zubi, G.; Dufo-López, R.; Carvalho, M.; Pasaoglu, G. The Lithium-Ion Battery: State of the Art and Future Perspectives. Renew. Sustain. Energy Rev. 2018, 89, 292–308. [Google Scholar] [CrossRef]
  2. Li, Y.; Liu, X.; Wang, L.; Feng, X.; Ren, D.; Wu, Y.; Xu, G.; Lu, L.; Hou, J.; Zhang, W.; et al. Thermal Runaway Mechanism of Lithium-Ion Battery with LiNi0.8Mn0.1Co0.1O2 Cathode Materials. Nano Energy 2021, 85, 105878. [Google Scholar] [CrossRef]
  3. Cui, Z.; Manthiram, A. Thermal Stability and Outgassing Behaviors of High-nickel Cathodes in Lithium-ion Batteries. Angew. Chem. Int. Ed. 2023, 62, e202307243. [Google Scholar] [CrossRef]
  4. Federal Aviation Administration (FAA). Lithium Battery Air Incidents Involving Smoke, Fire, or Extreme Heat. 2024. Available online: https://www.faa.gov/hazmat/resources/lithium_batteries/incidents (accessed on 29 January 2024).
  5. Chen, M.; Liu, J.; Ouyang, D.; Wang, J. Experimental Investigation on the Effect of Ambient Pressure on Thermal Runaway and Fire Behaviors of Lithium-ion Batteries. Int. J. Energy Res. 2019, 43, 4898–4911. [Google Scholar] [CrossRef]
  6. Chen, M.; Ouyang, D.; Weng, J.; Liu, J.; Wang, J. Environmental Pressure Effects on Thermal Runaway and Fire Behaviors of Lithium-Ion Battery with Different Cathodes and State of Charge. Process Saf. Environ. Prot. 2019, 130, 250–256. [Google Scholar] [CrossRef]
  7. Xie, S.; Ren, L.; Yang, X.; Wang, H.; Sun, Q.; Chen, X.; He, Y. Influence of Cycling Aging and Ambient Pressure on the Thermal Safety Features of Lithium-Ion Battery. J. Power Sources 2020, 448, 227425. [Google Scholar] [CrossRef]
  8. Xie, S.; Ren, L.; Gong, Y.; Li, M.; Chen, X. Effect of Charging/Discharging Rate on the Thermal Runaway Characteristics of Lithium-Ion Batteries in Low Pressure. J. Electrochem. Soc. 2020, 167, 140503. [Google Scholar] [CrossRef]
  9. Xie, S.; Sun, J.; Chen, X.; He, Y. Thermal Runaway Behavior of Lithium-ion Batteries in Different Charging States under Low Pressure. Int. J. Energy Res. 2021, 45, 5795–5805. [Google Scholar] [CrossRef]
  10. Xie, S.; Gong, Y.; Li, G.; Ping, X. Effect of Low-Pressure Environment on Thermal Runaway Behavior of NCM523/Graphite Pouch Cells with Different Overcharge Cycles. J. Energy Storage 2022, 55, 105444. [Google Scholar] [CrossRef]
  11. Liu, Q.; Zhu, Q.; Zhu, W.; Yi, X.; Han, X. Thermal Runaway Characteristics of 18650 NCM Lithium-ion Batteries under the Different Initial Pressures. Electrochemistry 2022, 90, 087004. [Google Scholar] [CrossRef]
  12. Zhang, Q.; Bao, F.; Niu, J. Risk analysis method of thermal runaway gas explosion in lithium-ion batteries. Energy Storage Sci. Technol. 2023, 12, 2263. [Google Scholar]
  13. Chen, X.; Zhang, X.; Wang, H.; Jia, J.; Xie, S.; Zhi, M.; Fu, J.; Sun, Q. Influence of Ambient Pressure and Heating Power on the Thermal Runaway Features of Lithium-Ion Battery. J. Electrochem. Energy Convers. Storage 2021, 18, 021014. [Google Scholar] [CrossRef]
  14. Fang, J.; Cai, J.; He, X. Experimental Study on the Vertical Thermal Runaway Propagation in Cylindrical Lithium-ion Batteries: Effects of Spacing and State of Charge. Appl. Therm. Eng. 2021, 197, 117399. [Google Scholar] [CrossRef]
  15. Liu, Y.; Niu, H.; Liu, J.; Huang, X. Layer-to-Layer Thermal Runaway Propagation of Open-Circuit Cylindrical Li-Ion Batteries: Effect of Ambient Pressure. J. Energy Storage 2022, 55, 105709. [Google Scholar] [CrossRef]
  16. Incropera, F.P.; DeWitt, D.P.; Bergman, T.L.; Lavine, A.S. Fundamentals of Heat and Mass Transfer; Wiley: New York, NY, USA, 1996; Volume 6. [Google Scholar]
  17. Ping, P. Lithium Ion Battery Thermal Runaway and Fire Risk Analysis and the Development on the Safer Battery System. Ph.D. Thesis, University of Science and Technology of China, Hefei, China, 2014. [Google Scholar]
  18. Sommer, L.W.; Raghavan, A.; Kiesel, P.; Saha, B.; Schwartz, J.; Lochbaum, A.; Ganguli, A.; Bae, C.J.; Alamgir, M. Monitoring of Intercalation Stages in Lithium-Ion Cells over Charge-Discharge Cycles with Fiber Optic Sensors. J. Electrochem. Soc. 2015, 162, A2664–A2669. [Google Scholar] [CrossRef]
  19. Kim, H.; Sung, N. The Effect of Ambient Pressure on the Evaporation of a Single Droplet and a Spray. Combust. Flame 2003, 135, 261–270. [Google Scholar] [CrossRef]
  20. Finegan, D.P.; Scheel, M.; Robinson, J.B.; Tjaden, B.; Hunt, I.; Mason, T.J.; Millichamp, J.; Di Michiel, M.; Offer, G.J.; Hinds, G.; et al. In-Operando High-Speed Tomography of Lithium-Ion Batteries during Thermal Runaway. Nat. Commun. 2015, 6, 6924. [Google Scholar] [CrossRef] [PubMed]
  21. Jindal, P.; Bhattacharya, J. Review—Understanding the Thermal Runaway Behavior of Li-Ion Batteries through Experimental Techniques. J. Electrochem. Soc. 2019, 166, A2165–A2193. [Google Scholar] [CrossRef]
  22. Mei, W.; Liu, Z.; Wang, C.; Wu, C.; Liu, Y.; Liu, P.; Xia, X.; Xue, X.; Han, X.; Sun, J.; et al. Operando Monitoring of Thermal Runaway in Commercial Lithium-Ion Cells via Advanced Lab-on-Fiber Technologies. Nat. Commun. 2023, 14, 5251. [Google Scholar] [CrossRef]
  23. Golubkov, A.W.; Fuchs, D.; Wagner, J.; Wiltsche, H.; Stangl, C.; Fauler, G.; Voitic, G.; Thaler, A.; Hacker, V. Thermal-Runaway Experiments on Consumer Li-ion Batteries with Metal-Oxide and Olivin-Type Cathodes. RSC Adv. 2014, 4, 3633–3642. [Google Scholar] [CrossRef]
  24. Cao, L.; Zhou, Z. Thermology Thermodynamics and Statistical Physics; Science Press: Beijing, China, 2015. [Google Scholar]
  25. Zou, K.; He, K.; Lu, S. Venting Composition and Rate of Large-Format LiNi0.8Co0.1Mn0.1O2 Pouch Power Battery during Thermal Runaway. Int. J. Heat Mass Transf. 2022, 195, 123133. [Google Scholar] [CrossRef]
  26. Wei, N.; Zhang, F.; Zhang, W.; Li, X. Comparative Study on the Thermal Runaway Characteristics of Li(NixCoyMnz)O2 Batteries. Heliyon 2024, 10, e31203. [Google Scholar] [CrossRef] [PubMed]
  27. Zhang, Q.; Niu, J.; Yang, J.; Liu, T.; Bao, F.; Wang, Q. In-Situ Explosion Limit Analysis and Hazards Research of Vent Gas from Lithium-Ion Battery Thermal Runaway. J. Energy Storage 2022, 56, 106146. [Google Scholar] [CrossRef]
  28. Wang, H.; Xu, H.; Zhang, Z.; Wang, Q.; Jin, C.; Wu, C.; Xu, C.; Hao, J.; Sun, L.; Du, Z.; et al. Fire and Explosion Characteristics of Vent Gas from Lithium-Ion Batteries after Thermal Runaway: A Comparative Study. eTransportation 2022, 13, 100190. [Google Scholar] [CrossRef]
  29. Spotnitz, R.; Franklin, J. Abuse Behavior of High-Power, Lithium-Ion Cells. J. Power Sources 2003, 113, 81–100. [Google Scholar] [CrossRef]
  30. Kim, G.H.; Pesaran, A.; Spotnitz, R. A Three-Dimensional Thermal Abuse Model for Lithium-Ion Cells. J. Power Sources 2007, 170, 476–489. [Google Scholar] [CrossRef]
  31. Mao, B.; Zhao, C.; Chen, H.; Wang, Q.; Sun, J. Experimental and Modeling Analysis of Jet Flow and Fire Dynamics of 18650-Type Lithium-Ion Battery. Appl. Energy 2021, 281, 116054. [Google Scholar] [CrossRef]
  32. Wang, Q.; Sun, J.; Chu, G. Lithium Ion Battery Fire Furthermore, Explosion. Fire Saf. Sci. 2005, 8, 375–382. [Google Scholar] [CrossRef]
  33. Finegan, D.P.; Darcy, E.; Keyser, M.; Tjaden, B.; Heenan, T.M.M.; Jervis, R.; Bailey, J.J.; Vo, N.T.; Magdysyuk, O.V.; Drakopoulos, M.; et al. Identifying the Cause of Rupture of Li-Ion Batteries during Thermal Runaway. Adv. Sci. 2018, 5, 1700369. [Google Scholar] [CrossRef]
  34. Fu, Y.; Lu, S.; Shi, L.; Cheng, X.; Zhang, H. Ignition and Combustion Characteristics of Lithium Ion Batteries under Low Atmospheric Pressure. Energy 2018, 161, 38–45. [Google Scholar] [CrossRef]
  35. Qin, P.; Sun, J.; Wang, Q. A New Method to Explore Thermal and Venting Behavior of Lithium-Ion Battery Thermal Runaway. J. Power Sources 2021, 486, 229357. [Google Scholar] [CrossRef]
  36. Mao, B.; Fear, C.; Chen, H.; Zhou, H.; Zhao, C.; Mukherjee, P.P.; Sun, J.; Wang, Q. Experimental and Modeling Investigation on the Gas Generation Dynamics of Lithium-Ion Batteries during Thermal Runaway. eTransportation 2023, 15, 100212. [Google Scholar] [CrossRef]
  37. Chen, M.; Liu, J.; He, Y.; Yuen, R.; Wang, J. Study of the Fire Hazards of Lithium-Ion Batteries at Different Pressures. Appl. Therm. Eng. 2017, 125, 1061–1074. [Google Scholar] [CrossRef]
  38. Bak, S.M.; Nam, K.W.; Chang, W.; Yu, X.; Hu, E.; Hwang, S.; Stach, E.A.; Kim, K.B.; Chung, K.Y.; Yang, X.Q. Correlating Structural Changes and Gas Evolution during the Thermal Decomposition of Charged LixNi0.8Co0.15Al0.05O2 Cathode Materials. Chem. Mater. 2013, 25, 337–351. [Google Scholar] [CrossRef]
  39. Bak, S.M.; Hu, E.; Zhou, Y.; Yu, X.; Senanayake, S.D.; Cho, S.J.; Kim, K.B.; Chung, K.Y.; Yang, X.Q.; Nam, K.W. Structural Changes and Thermal Stability of Charged LiNi xMnyCoz O2 Cathode Materials Studied by Combined In Situ Time-Resolved XRD and Mass Spectroscopy. ACS Appl. Mater. Interfaces 2014, 6, 22594–22601. [Google Scholar] [CrossRef] [PubMed]
  40. Hossain Ahmed, S.; Kang, X.; Bade Shrestha, S.O. Effects of Temperature on Internal Resistances of Lithium-Ion Batteries. J. Energy Resour. Technol. 2015, 137, 031901. [Google Scholar] [CrossRef]
  41. Venugopal, G. Characterization of Thermal Cut-off Mechanisms in Prismatic Lithium-Ion Batteries. J. Power Sources 2001, 101, 231–237. [Google Scholar] [CrossRef]
  42. Wang, Q.; Sun, J. Enhancing the Safety of Lithium Ion Batteries by 4-Isopropyl Phenyl Diphenyl Phosphate. Mater. Lett. 2007, 61, 3338–3340. [Google Scholar] [CrossRef]
  43. Li, W.; Lucht, B.L. Lithium-Ion Batteries: Thermal Reactions of Electrolyte with the Surface of Metal Oxide Cathode Particles. J. Electrochem. Soc. 2006, 153, A1617. [Google Scholar] [CrossRef]
  44. Saito, Y.; Rahman, M.K. Investigation of Positive Electrodes after Cycle Testing of High-Power Li-ion Battery Cells IV. J. Power Sources 2007, 174, 877–882. [Google Scholar] [CrossRef]
  45. Weng, J.; Ouyang, D.; Liu, Y.; Chen, M.; Li, Y.; Huang, X.; Wang, J. Alleviation on Battery Thermal Runaway Propagation: Effects of Oxygen Level and Dilution Gas. J. Power Sources 2021, 509, 230340. [Google Scholar] [CrossRef]
Figure 1. Schematic of the experimental setup.
Batteries 10 00287 g001
Figure 2. Thermal runaway phenomena of cells at (a) 75% SOC and (b) 100% SOC under different pressures.
Batteries 10 00287 g002
Figure 3. Temperature evolution curves of cells at 75% SOC under (a) 80 kPa and under (b) 40 kPa. Stage I, II, and III represent heating stage, venting stage, and thermal runaway occurrence stage, respectively.
Batteries 10 00287 g003
Figure 4. Mechanism diagram of the thermal runaway process of NCM811 LIBs.
Batteries 10 00287 g004
Figure 5. Temperature evolution curves of cells at (a) 75% SOC and (b) 100% SOC under different pressures.
Batteries 10 00287 g005
Figure 6. (a) Time of venting and (b) temperature of venting under different pressures.
Batteries 10 00287 g006
Figure 7. (a) Onset time of thermal runaway and (b) onset temperature of thermal runaway of cells at 75% SOC and 100% SOC under different pressures.
Batteries 10 00287 g007
Figure 8. Maximum temperature of cells at 75% SOC and 100% SOC under different pressures.
Batteries 10 00287 g008
Figure 9. Voltage and temperature evolution curves during the experiment. Stages I, II, III, and IV represent the voltage stabilization stage, voltage rise stage, voltage decline stage, and voltage collapse stage, respectively.
Batteries 10 00287 g009
Figure 10. Voltage drop time of cells at 75% SOC and 100% SOC under different pressures.
Batteries 10 00287 g010
Figure 11. Characteristic times of voltage drop, venting and thermal runaway of cells at (a) 75% SOC and (b) 100% SOC.
Batteries 10 00287 g011
Figure 12. Mass loss and loss rate of cells after thermal runaway under different pressures.
Batteries 10 00287 g012
Figure 13. SEM micrographs with a scale bar of 3 micrometers of the raw cell and burnt cells at 100% SOC under different pressures.
Batteries 10 00287 g013
Figure 14. EDS elemental composition diagrams based on SEM micrographs with a scale bar of 10 micrometers of the raw cell and burnt cells at 100% SOC under different pressures.
Batteries 10 00287 g014
Table 1. Basic information of LIBs in experiments.
ItemSpecification
Height65.05 ± 0.15 mm
Diameter18.35 ± 0.15 mm
Weight46 ± 2 g
Anode materialGraphite
Cathode materialLiNi0.8Co0.1Mn0.1O2
Nominal capacity2600 mAh
Nominal voltage3.6 V
Charge cut-off voltage4.2 V
Discharge cut-off voltage2.75 V
Charging cut-off current0.02 C (52 mA)
Table 2. Conditions of experiments.
Testing GroupTesting No.SOCAmbient Pressure (kPa)Heating Power (W)
11/2/3/475%101/80/60/40150
25/6/7/8100%101/80/60/40
Disclaimer/Publisher’s Note: The statements, opinions and data contained in all publications are solely those of the individual author(s) and contributor(s) and not of MDPI and/or the editor(s). MDPI and/or the editor(s) disclaim responsibility for any injury to people or property resulting from any ideas, methods, instructions or products referred to in the content.

