Abstract
The present work aims to develop the current CubeSats architecture. Starting from the framework of project ARAMIS (an Italian acronym for a highly modular architecture for satellite infrastructures), a new concept of smart tiles has been developed, employing multifunctional structures and lightweight, composite materials. This enables increased CubeSat mass efficiency and payload volume. An embedded battery tile has been designed, built, and tested from a vibration point of view. In the present work, the LiPo batteries selected for the prototype have been tested with the HPPC testing procedure, to extract their equivalent Randles circuit parameters. Thus, the thermal power dissipation from the batteries can be estimated. With these data, Thermal Desktop simulations of a representative ARAMIS CubeSat are performed, considering LEO orbit and hot/cold cases. Firstly, a parametric analysis was conducted to evaluate the thermal behaviors of various design alternatives. A suitable configuration for the CubeSat was then found, enabling the validation of the embedded battery tile from a thermal point of view. The final configuration includes heaters for the LiPo batteries, a commercial CubeSat skeleton made in aluminum alloy, and a top coating for smart tiles with proper solar absorptivity.
1. Introduction
CubeSats began as an educational project in the early 2000s [1] and became increasingly popular in space missions [2]. The basic architecture of a CubeSat has been described by Professors Puig-Suari and Twiggs ([1], p. 7):
“The basic design of the satellite is comprised of a cube structure with a stack of circuit boards inside. Each face of the satellite will be covered with solar cells. The center of the satellite will have two rechargeable batteries. The batteries split the functions of the satellite into two parts. One half of the satellite contains the satellite computer, communications electronics, and attitude control system. The other half is available for a payload.”
This architecture is still widely used today [3]. One possible development is to adopt multifunctional structures, that integrate various spacecraft bus functions in the structural subsystem, allowing for optimization of the spacecraft mass and volume. Multifunctional structures are already investigated in the automotive, marine, and aeronautical fields [4,5]. The ARAMIS CubeSat project [6] has the objective of introducing a new type of multifunctional structure for CubeSats. The external faces of the CubeSat structure that normally have the only function of secondary structures become a set of “smart tiles” that integrate spacecraft bus functions. The smart tiles allow for reductions in the design, assembly, and testing time and costs. These reductions are effective with interchangeable tiles that adopt Commercial Off-The-Shelf (COTS) components.
Within the ARAMIS project, the design of an embedded battery tile was introduced. Batteries are essential for the satellite Electrical Power System (EPS). To respect the low-cost requirement, a low degree of structural integration has been adopted ([7], pp. 3–4). For the first prototype, commercial Lithium Polymer (LiPo) batteries have been selected. For the structural function, Composite-Fiber-Reinforced Plastics (CFRP) commercial prepregs have been adopted. The prototype has been designed and produced and the vibration analysis and testing have been successfully conducted [8].
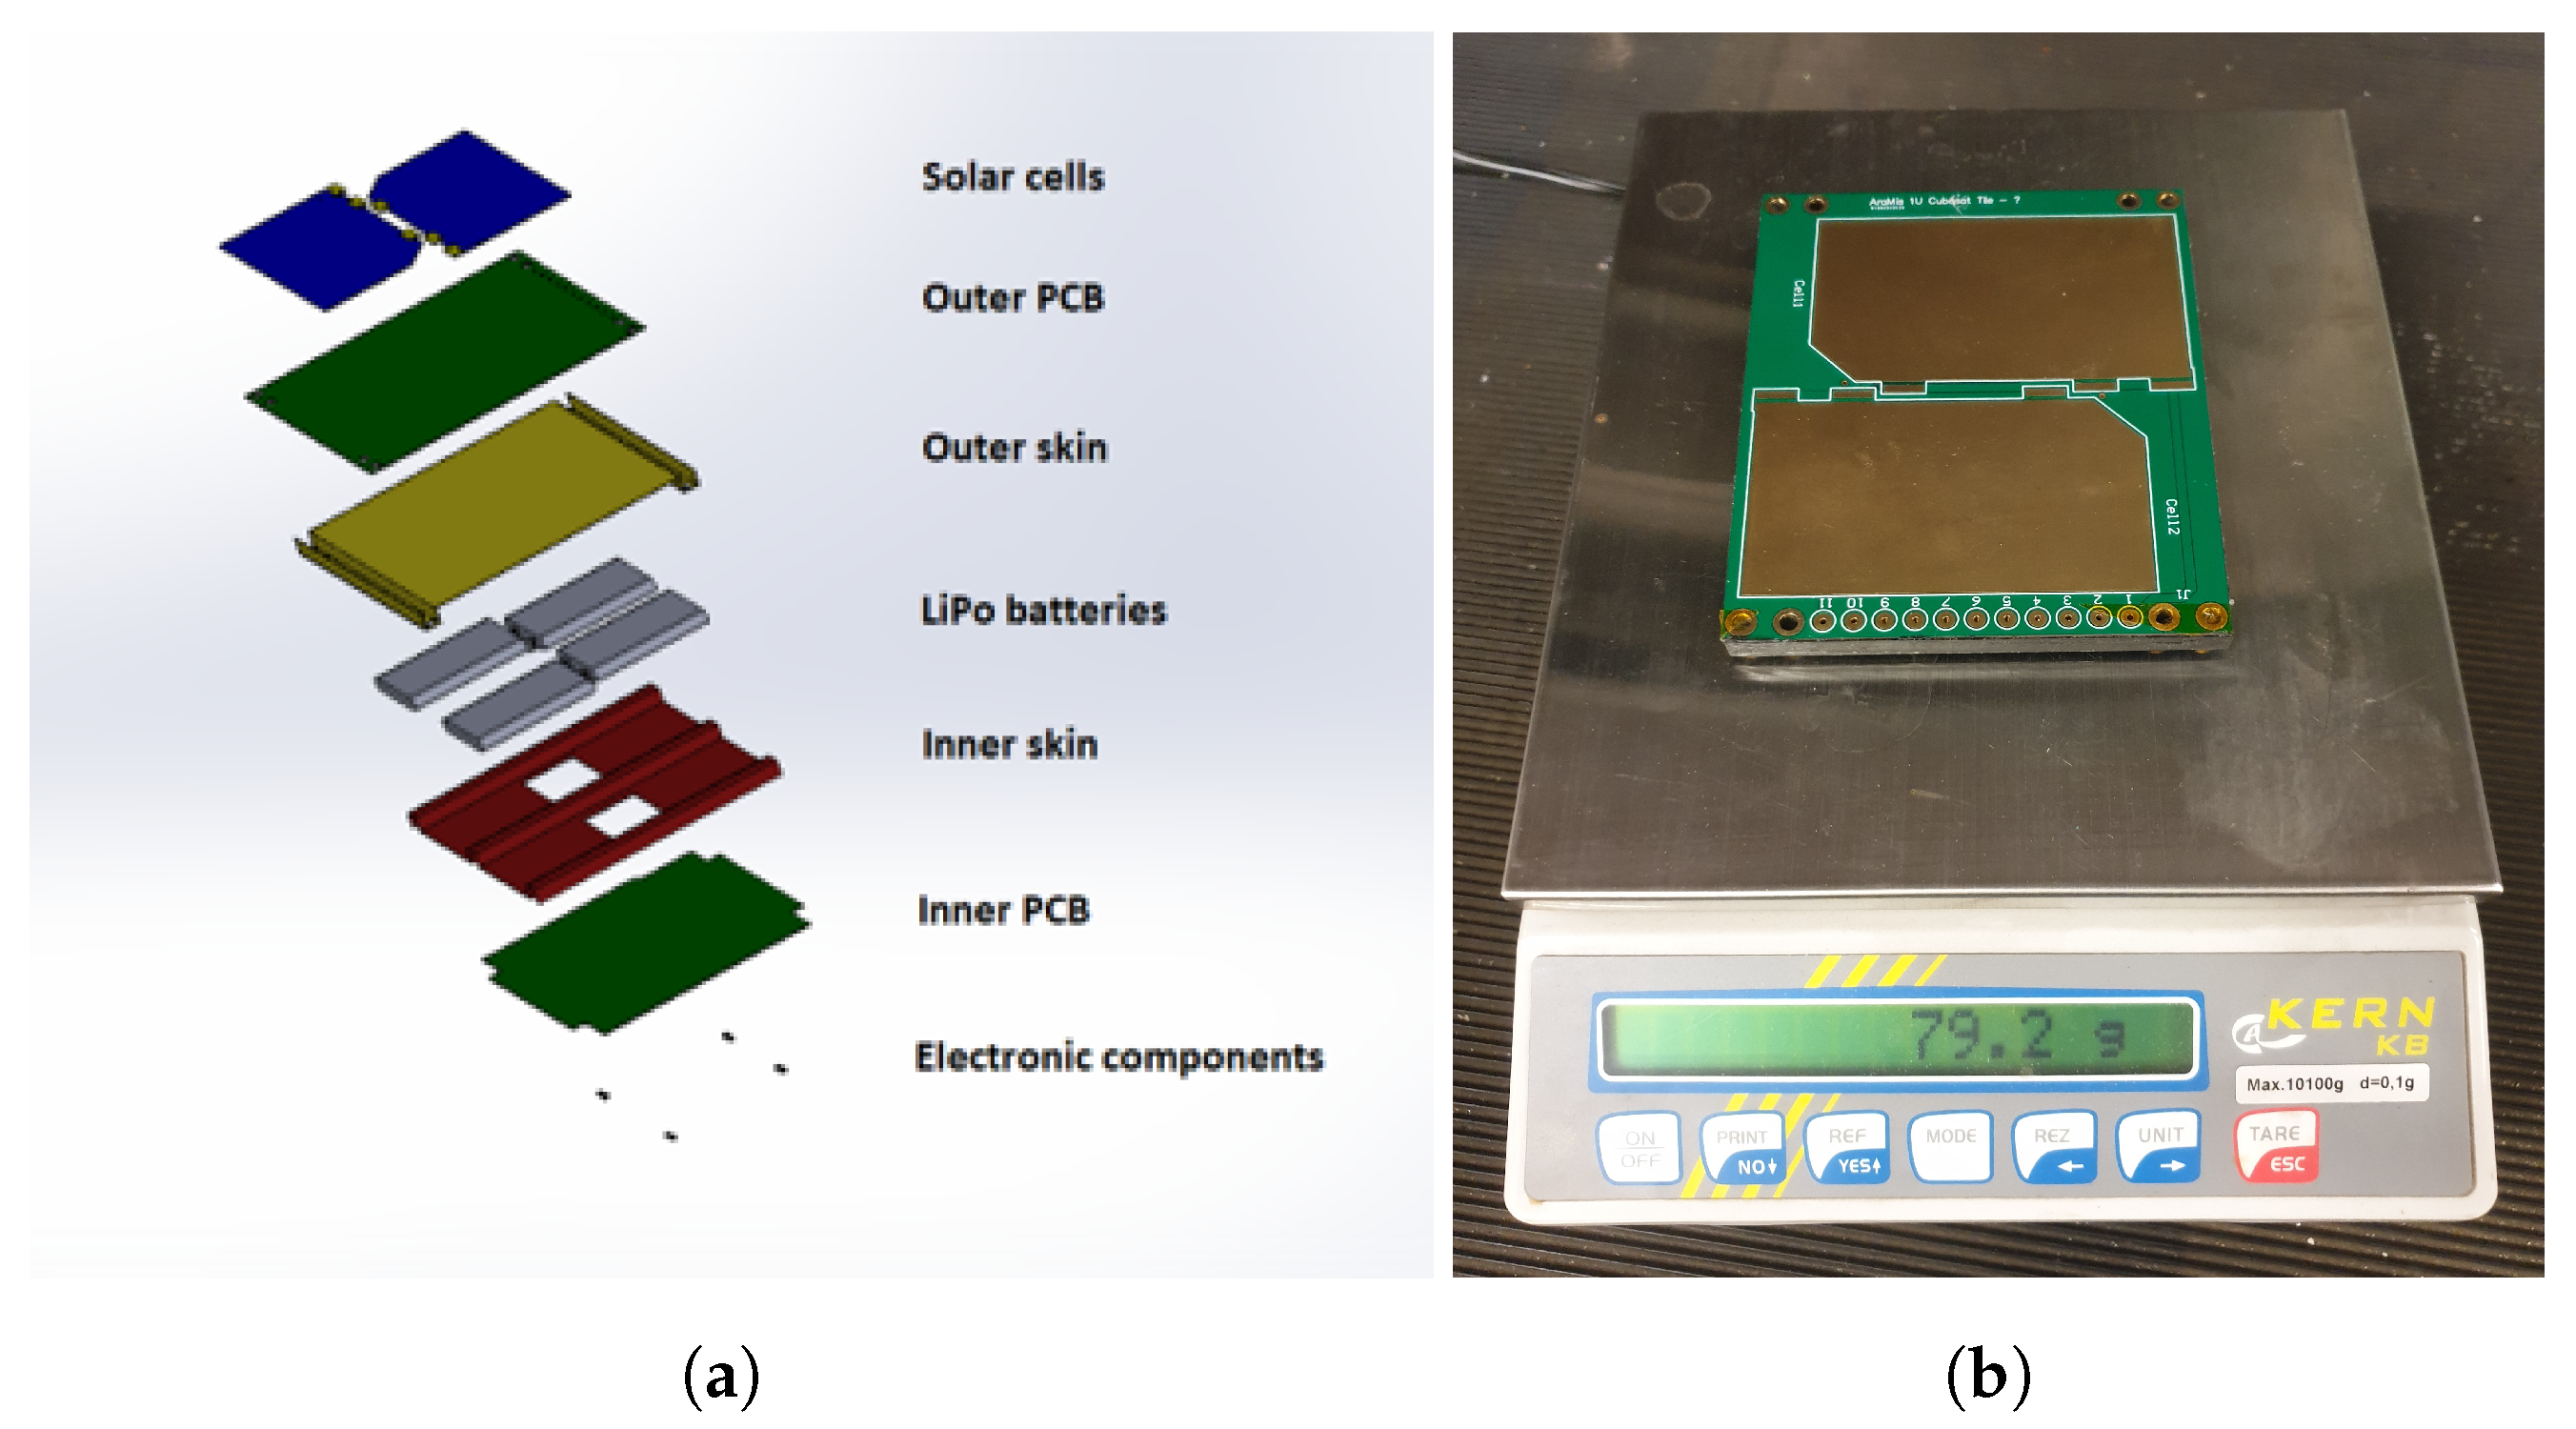
The prototype is shown in Figure 1. The four LiPo batteries are enclosed between the two CFRP skins (Figure 1a): the outer skin, shown in yellow in the figure, and the inner skin, shown in red in the figure. The outer PCB is mounted on the outer skin and hosts two solar cells. The inner PCB is mounted on the inner skin and hosts electronic components.
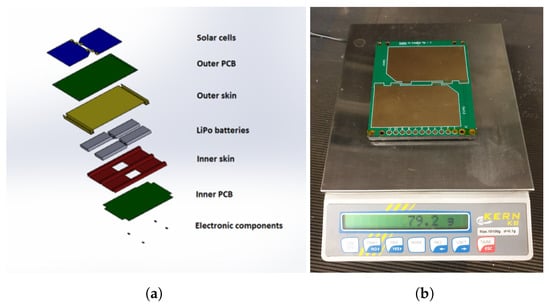
Figure 1.
Embedded battery tile prototype: (a) exploded view of the CAD model; (b) tile prototype built for vibration testing.
Previous work showed that an embedded battery tile with ultrathin components can be produced. An experimental procedure for the modal testing of ultralight tile components and the entire tile has been defined, showing that the modal behavior of the embedded battery tile is suitable for the Vega, the Ariane 6, the Falcon 9, and the Falcon Heavy launch vehicles [9,10,11].
Although the mechanical characterization is crucial for satellite secondary structures, other important aspects of the new design had to be verified. Thermal behavior aspects of the embedded battery tile are analyzed in the present study. The thermal load due to the electrical operation of the LiPo batteries is modeled and experimentally determined in Section 2. Then, an entire ARAMIS CubeSat configuration, including the battery tile, is modeled in Thermal Desktop in LEO orbit (Section 3) to verify the compliance of the design with the temperature limits of the CubeSat components.
The compatibility of an embedded battery is shown in the form of a smart tile prototype, with the thermal environment in LEO. This conclusion supports the validity of the smart tiles architecture as a spacecraft bus, enabling the reduction in design, assembly, and testing time and costs.
2. Electrical Model of the Embedded Battery Tile
The electrical operation of the batteries is modeled with equivalent Randles circuits. The main aspects of the equivalent Randles circuits and Hybrid Pulse Power Characterization (HPPC) testing for batteries are recalled in Section 2.1 and Section 2.2, respectively. The parameters of the Randles circuit have been determined experimentally for the selected LiPo batteries by HPPC testing (Section 2.3). The thermal loads determined with HPPC testing are an essential input for the orbital thermal simulation (Section 3).
2.1. Randles Circuits
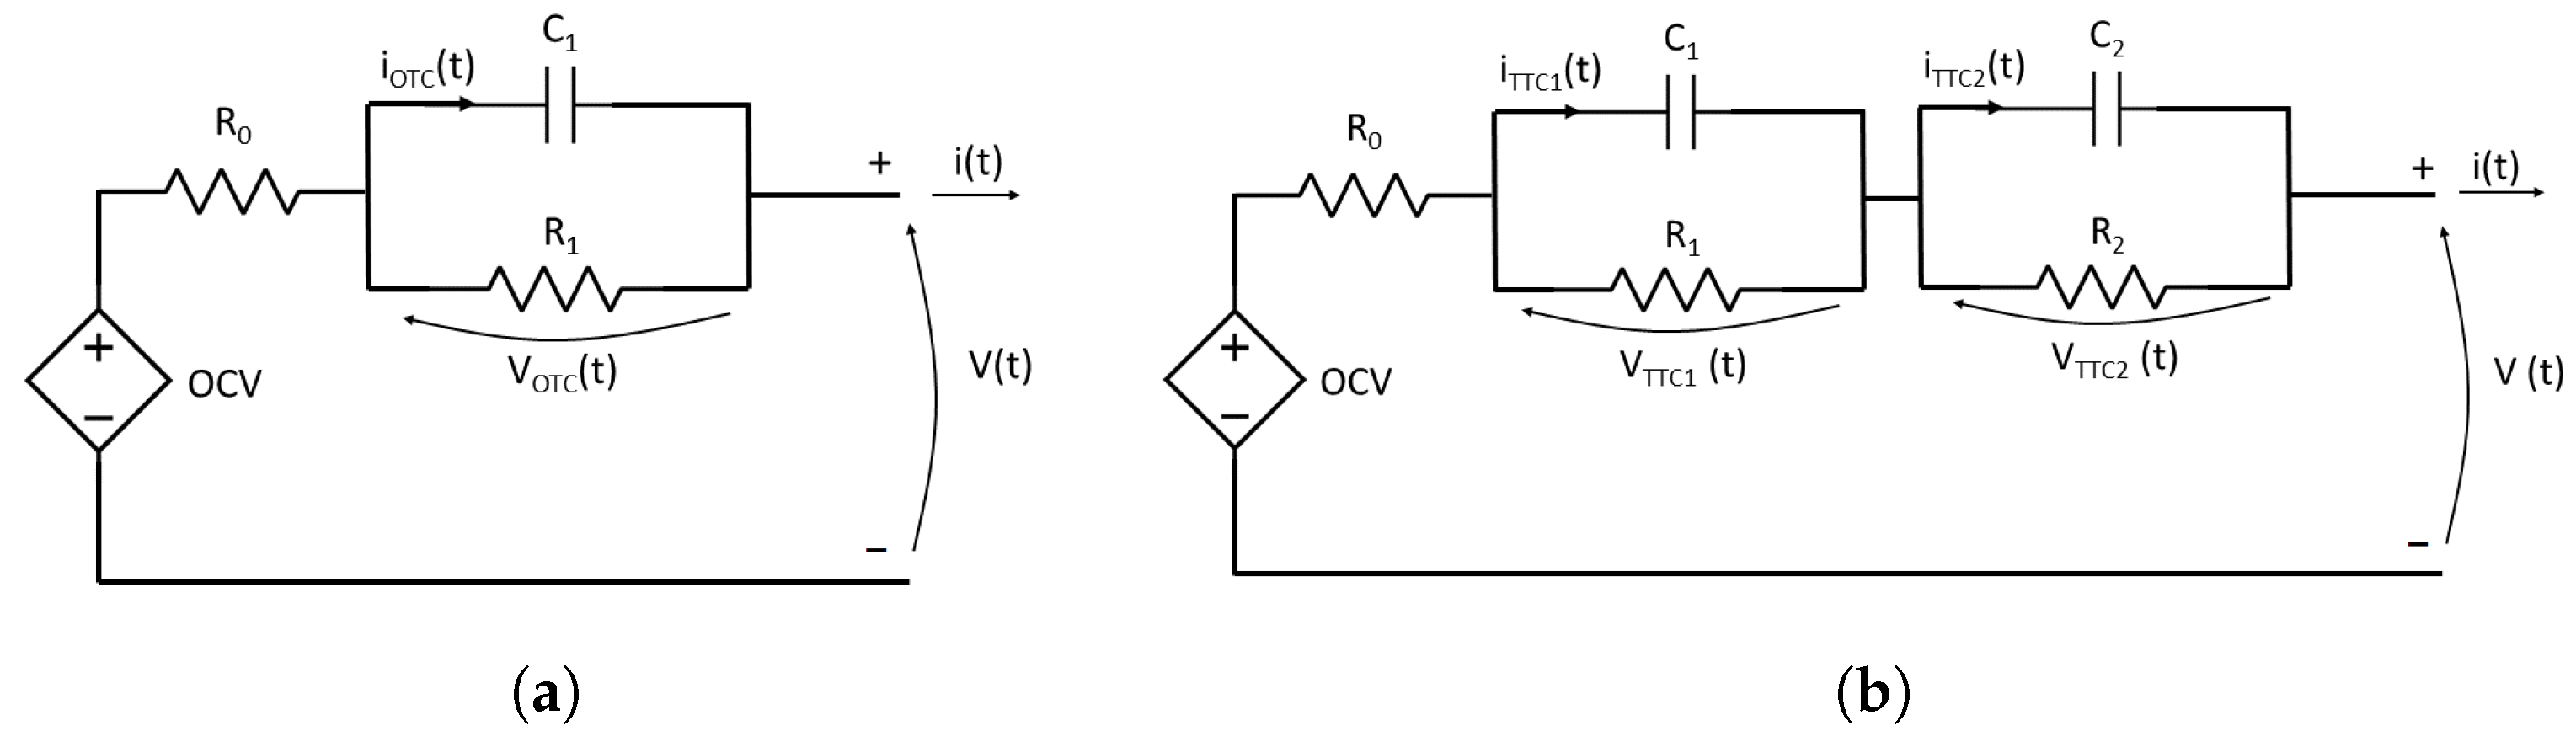
LiPo batteries can be represented, at low frequencies, with a class of equivalent circuits called Randles circuits [12,13,14] (Figure 2). Randles circuits are classified in orders, according to the number of resistor–capacitor (RC) loops they exhibit. As an example, a first-order Randles circuit (Figure 2a) has one RC loop and a second-order Randles circuit (Figure 2b) has two RC loops.
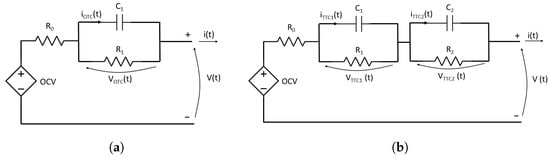
Figure 2.
Simplified Randles circuits: (a) first-order Randles circuit; (b) second-order Randles circuit.
In the figure, the positive and negative terminals of the battery are marked with the plus and minus sign, respectively. The signs of the output current and of the output voltage in the figure are considered positive and correspond to the battery discharging phase.
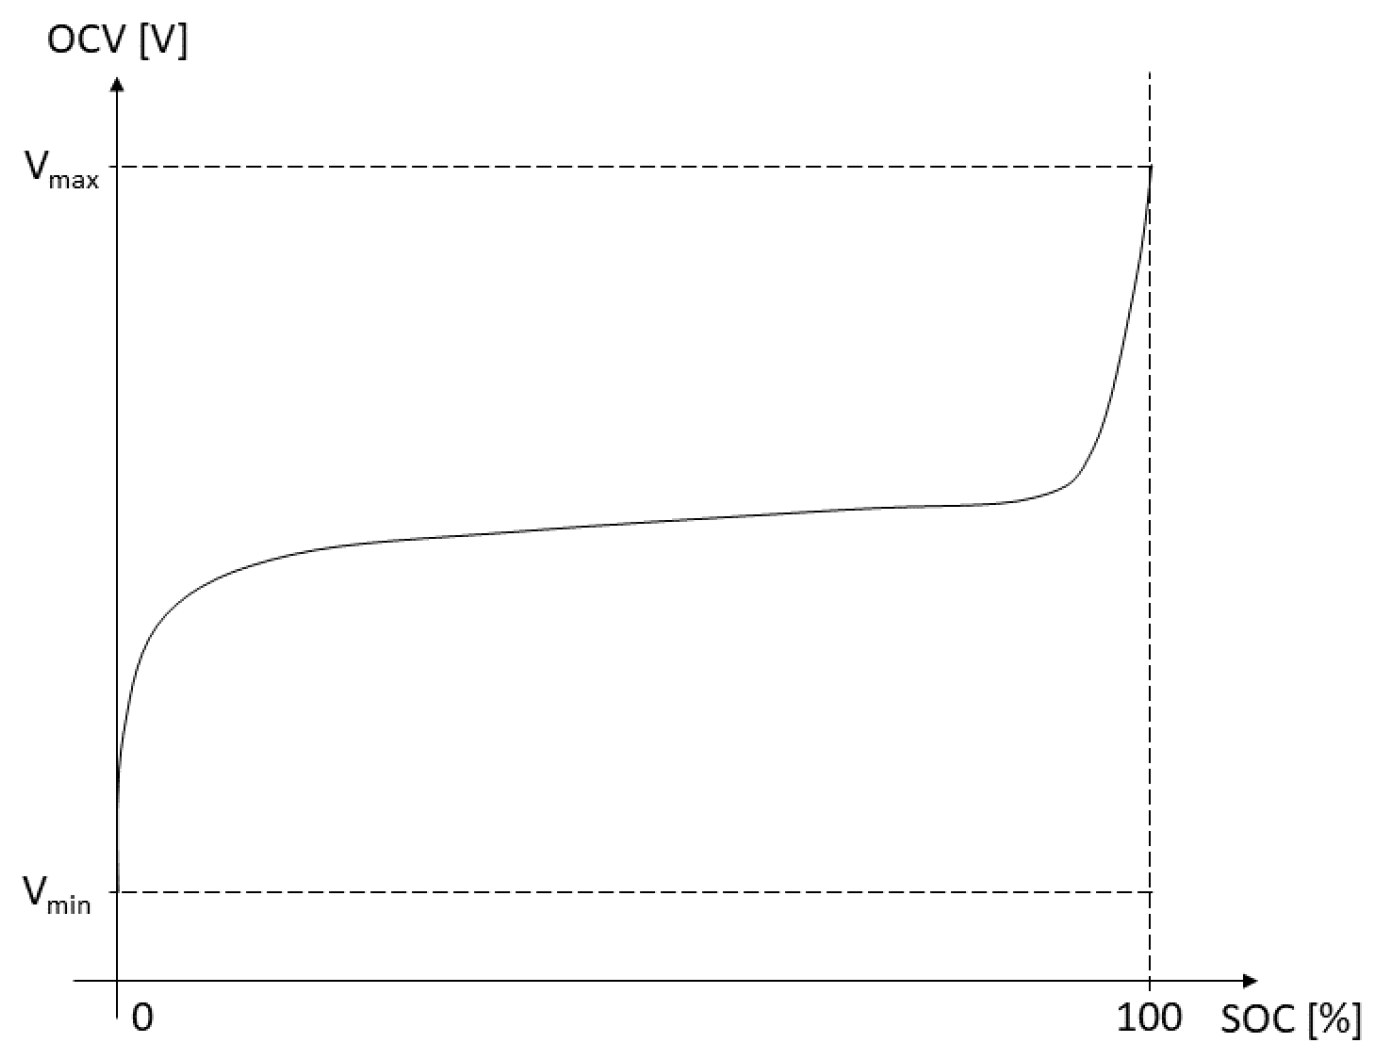
The leftmost bipole in Figure 2 is a controlled voltage generator that represents the battery open-circuit voltage (OCV). The open-circuit voltage is reached with no electrical loads on the battery and in a complete equilibrium state (i.e., in steady state conditions, neglecting hysteresis) and depends on the battery temperature and on its State Of Charge (SOC). For LiPo batteries at a given temperature, the relationship between open-circuit voltage and state of charge is usually not linear (Figure 3).

Figure 3.
Typical open-circuit voltage (OCV)–state of charge (SOC) curve for a LiPo battery, at a given temperature.
The relation between the output current and the state of charge is given by the simple ordinary differential equation:
where Q is the total capacity and is the Coulombic efficiency. The Coulombic efficiency takes into account the undesired electrochemical reactions that do not increase the cell SOC. For this reason, the Coulombic efficiency is minor or equal to 1 during the charging phase (i.e., when the current is negative) and equal to 1 in the discharging phase (i.e., when the current is positive).
The leftmost resistor in Figure 2, whose resistance is , represents the electrolyte resistance. The RC loops in the first- and second-order circuits (Figure 2) are different approximations of the Warburg impedance, that represents the diffusion of lithium ions in the electrodes. The difference between the two approximations lies in the accuracy of the simulations results: a greater accuracy is obtained with the second-order circuit, i.e., with two RC loops, with respect to the first-order circuit.
To have a correct representation of the electrical behavior of the cell, all the bipoles values in the first- and second-order circuit (Figure 2) must vary with the battery state of charge and temperature . Moreover, it has been observed that the bipoles parameters depend also on the direction of the output current , i.e., whether the battery is in the charging or discharging phase and also on the intensity of the input current.
For the first-order or one-time constant (OTC) circuit (Figure 2a), the governing equations can be obtained with elementary electronics:
Furthermore, for the second-order or two-time constant (TTC) circuit (Figure 2b), the governing Equations are:
2.2. Hybrid Pulse Power Characterization Tests
Hybrid Pulse Power Characterization (HPPC) testing is a common method for determining Randles circuit parameters (, , , , , and ) as a function of the SOC for a given battery. Since these parameters vary with the battery temperature, T, the results are valid if the temperature is kept within an acceptable tolerance in time and the temperature is homogeneous throughout the battery.
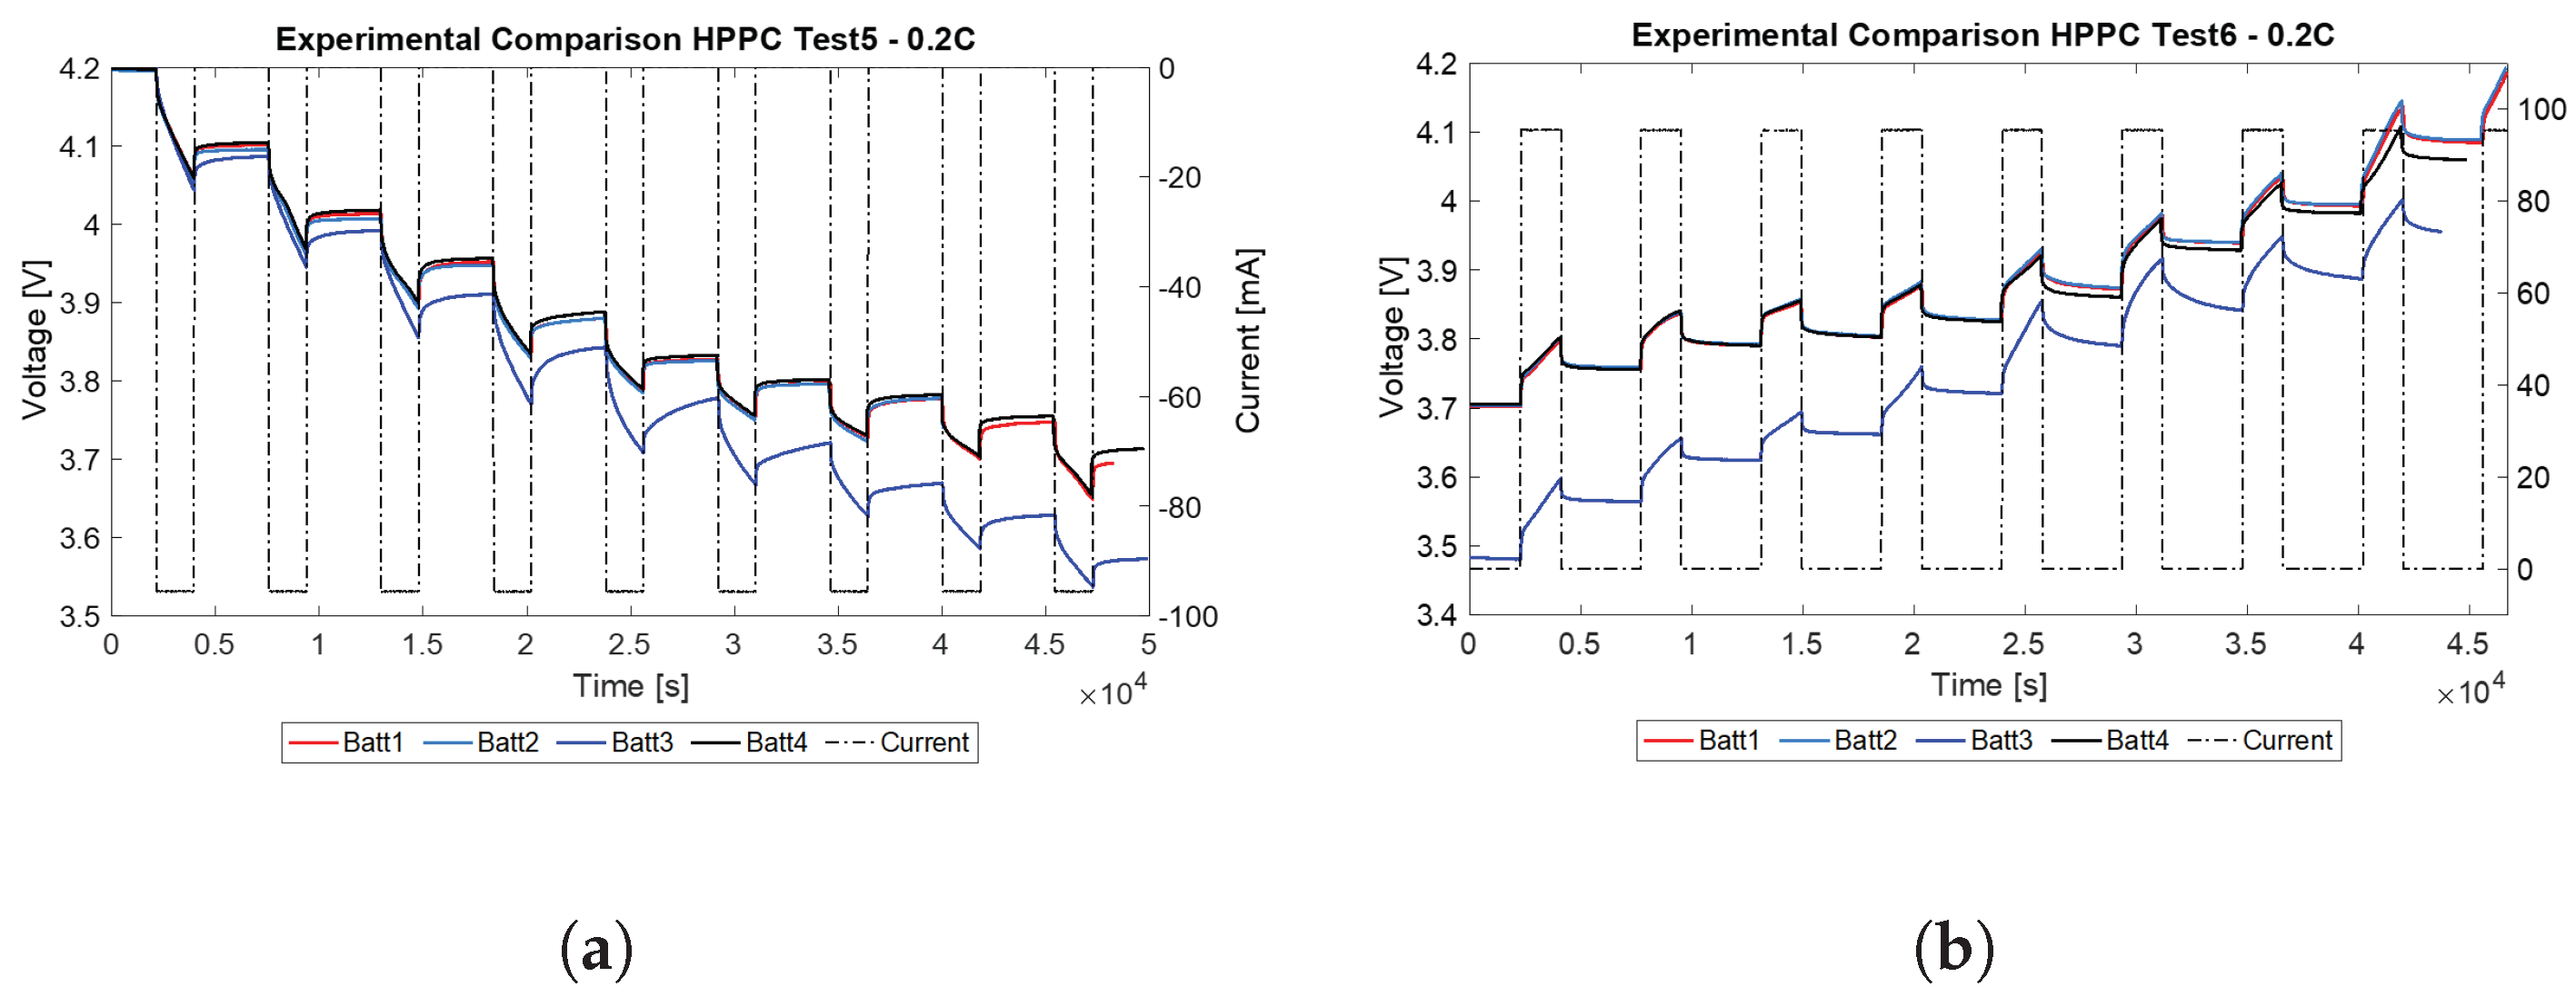
Examples of the HPPC test for four of the selected LiPo batteries are given in Figure 4. The following steps for the discharge test (Figure 4a) are implemented, while the imposed current and output voltage time histories (Figure 2) are recorded:
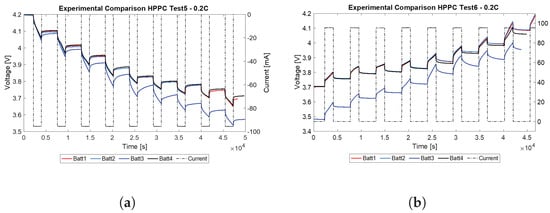
Figure 4.
HPPC tests input and output parameters time histories, during the discharge phase (a) and during the charge phase (b). The input current is plotted with the black dash–point line and the resulting output voltage is plotted with the solid lines, for four different LiPo batteries. Due to the battery analyzer setup, discharge currents are negative and charge currents are positive (the opposite of the sign convention for the rest of the paper).
- The procedure starts with a fully charged battery in equilibrium state, i.e., the initial output voltage (Figure 2) is equal to .
- A preselected value of discharge current (Figure 2) is imposed to the battery terminals, for a preselected period of time. The current time history is represented in Figure 4a with a black dash–point line. The amount of charge removed from the battery can be determined by multiplying the discharge current by its duration; thus, the SOC at the end of the application of the current is known. The output voltages of four batteries are plotted with solid lines in Figure 4a.
- Then, a rest period with zero current is imposed, until the battery reaches again the equilibrium state.
- The process is repeated until the moment the minimum voltage is reached. The test is then interrupted for safety reasons.
The output voltage for each battery is represented in Figure 4a with the solid lines. A numerical simulation of the Randles circuit can be made imposing the bipoles parameters (Equations (2)–(6)). The battery parameters can be identified by matching the recorded output voltage with the numerical output voltage, in an iterative process that explores the Randles parameters space to minimize the error with experimental data. The bipoles parameters can thus be estimated for the given SOC and battery temperature.
It is difficult to reach exactly 0% of the SOC, since the voltage at the terminals cannot go below the minimum equilibrium voltage at any given time for safety reasons (i.e., the SOC would be below 0%). In the dynamic conditions of the HPPC test, the voltage at the end of the discharge phase is inferior to the equilibrium voltage (Figure 4a); thus, the test is usually interrupted before 0% SOC is reached in equilibrium state. States of charge closer to 0% can be reached by reducing the amount of charge that is removed from the battery at each step, i.e., either the current or the current application time can be reduced. However, this may lead to excessive test times and unacceptable errors in the optimization phase.
A possible output of the HPPC test is the OCV-SOC curve (Figure 3), since, for each SOC step, the open-circuit voltage is determined.
Since the Randles parameters can vary with the direction and intensity of the input current, the test should be repeated at different current ratings and in charging and discharging modes.
An example of an HPPC test with charging currents is given in Figure 4b. The steps are symmetrical compared to the discharge case described above:
- The batteries are initially fully discharged and in equilibrium conditions, i.e., the initial output voltage (Figure 2) is equal to .
- A rest period at zero input current is imposed, until the battery reaches the equilibrium state.
- The process is repeated until the moment the maximum voltage is reached. The test is then interrupted for safety reasons.
The output voltage at the end of step 2 reaches values higher than the following equilibrium state of step 3. As a consequence, similarly to the discharging current test, it is not possible to reach a 100% state of charge, due to maximum equilibrium voltage limitations for safety reasons. Similarly to the discharge case, smaller charge steps can be adopted to reach higher states of charge, with the same disadvantages of excessive test times and unacceptable optimization errors.
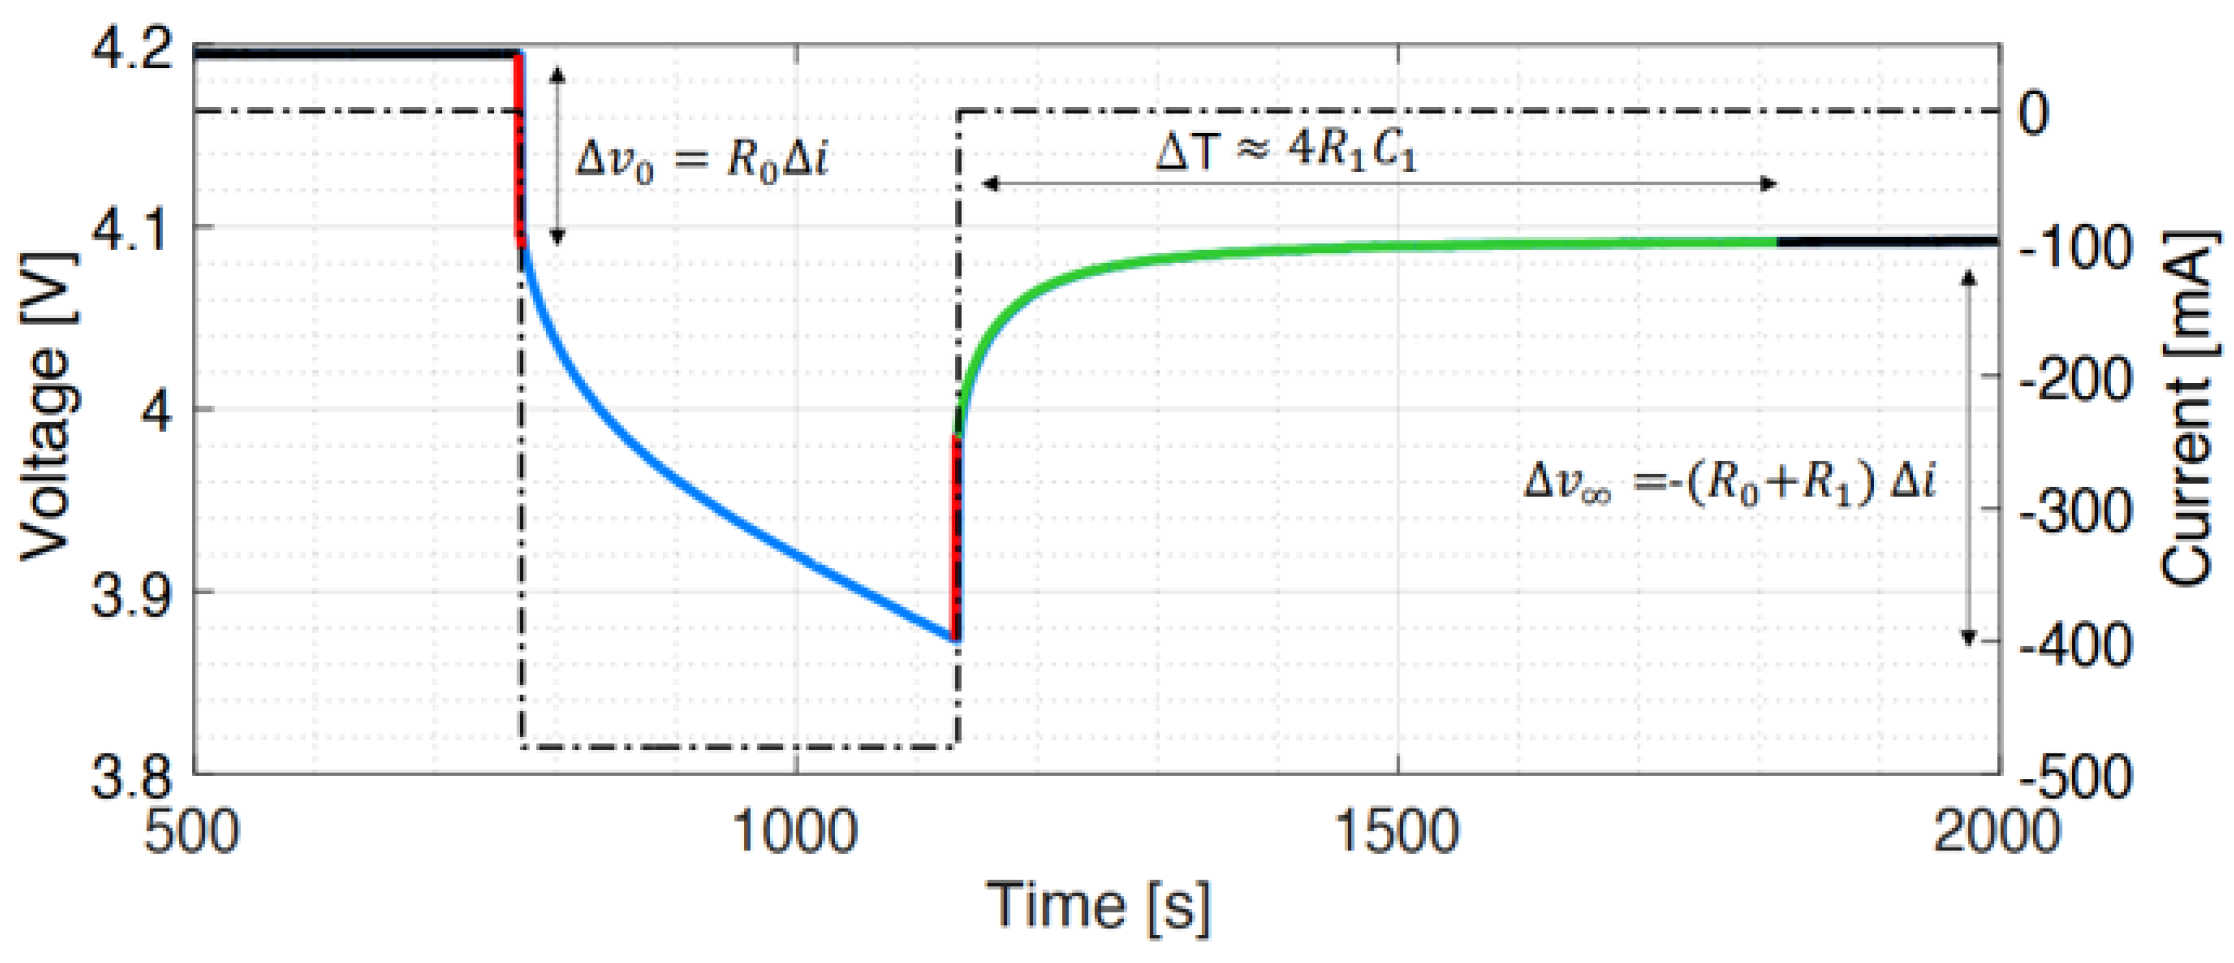
The optimization process described above needs to be initialized with accurate initial estimates, to arrive at the globally optimal solution and to avoid non-physical solutions ([12], p. 55). For this purpose, it is possible to make a preliminary evaluation for the parameters of a first-order Randles circuit (, and ) [12,14] with Equations (7)–(9). Their relation with the voltage time history for a single discharge and rest cycle is shown in Figure 5.
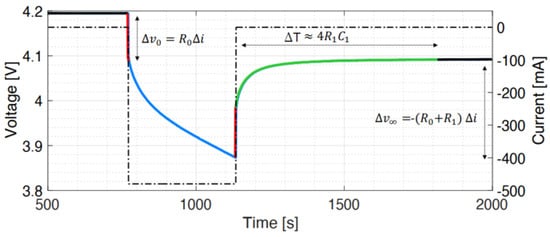
Figure 5.
Preliminary estimation of a first-order Randles circuit parameters.
Equation (7) is obtained applying the voltage balance (Equation (3)) to the leftmost red vertical segment in the figure. The instantaneous voltage drop at the cell terminals is due to the instantaneous current variation from zero to the imposed discharge current. The only possible instantaneous voltage change in the bipoles is given by the resistor and is equal to . The value of can be found considering the voltage variation between the the equilibrium value (the black segment) and the minimum of the voltage time history (at the intersection between the blue and the rightmost red segment). Considering the general voltage balance (Equation (3)), Equation (8) can be obtained. Finally, when the discharge current is removed (green segment), the equilibrium voltage is reached after an interval of about four time constants of the resistor–capacitor loop ([12], p. 39) (Equation (9)).
2.3. LiPo Batteries Characterization
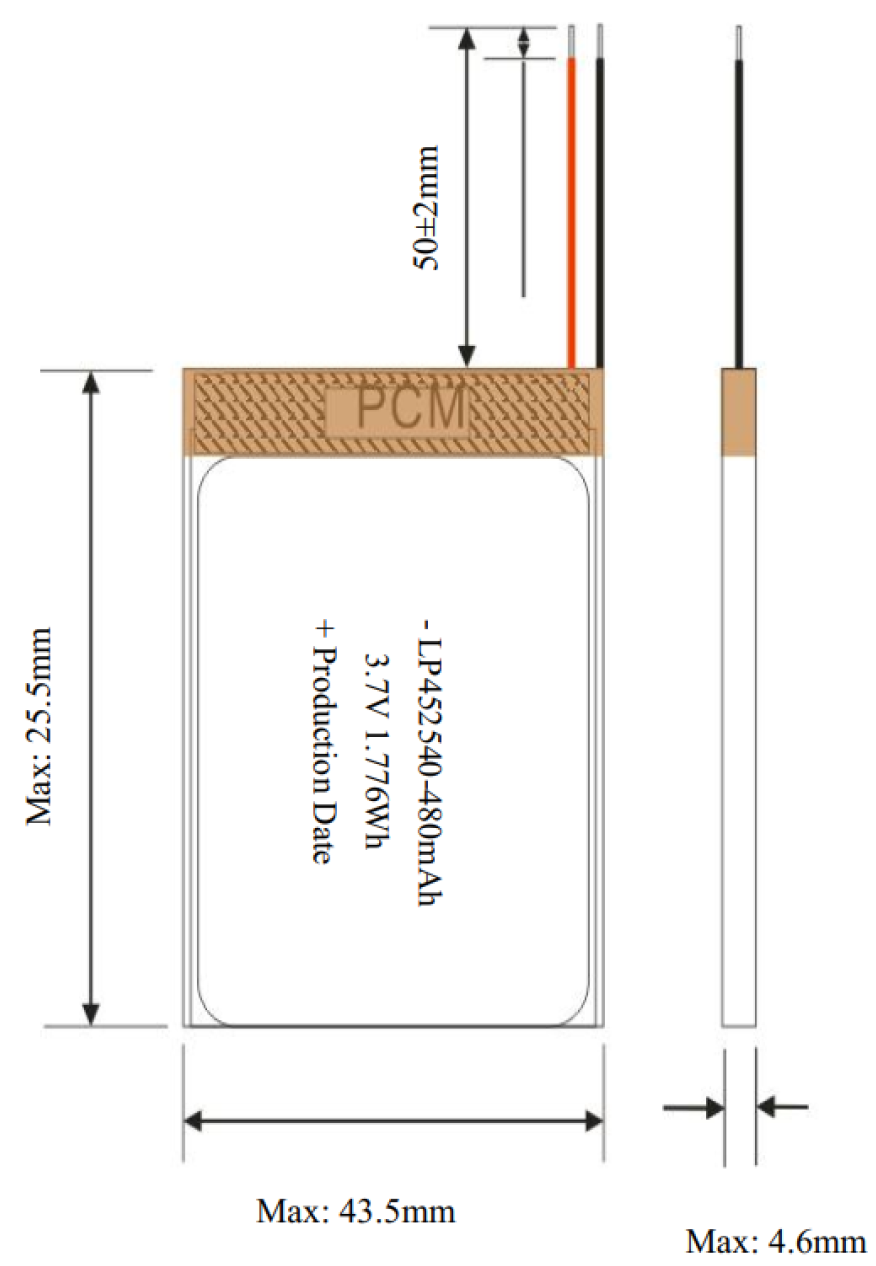
The experimental procedure for the HPPC tests described at Section 2.2 has been applied to test the embedded battery tile prototype LiPo batteries [15]. Their geometry is shown in Figure 6 and their main characteristics are listed in Table 1.
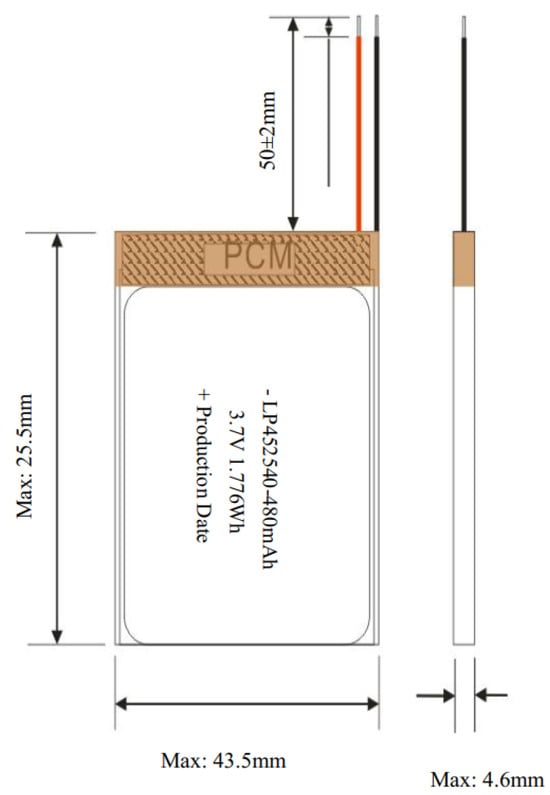
Figure 6.
LP452540 LiPo battery geometry [15].

Table 1.
LP452540 LiPo battery main parameters [15].
The reference temperature interval of 23 ± 2 °C is the temperature to which the typical capacity and the cut-off voltages are referred.
The batteries are sold with a protection circuit enclosed in the protection circuit module (PCM, shown in brown in Figure 6), that is a small printed circuit board (PCB) soldered to the battery terminals. The PCMs have been unsoldered from the batteries before the HPPC testing to record the real electrical behavior of the batteries.
The HPPC test setup and its results are discussed in the Experimental Setup and HPPC Testing Results Sections.
Experimental Setup and HPPC Testing Results
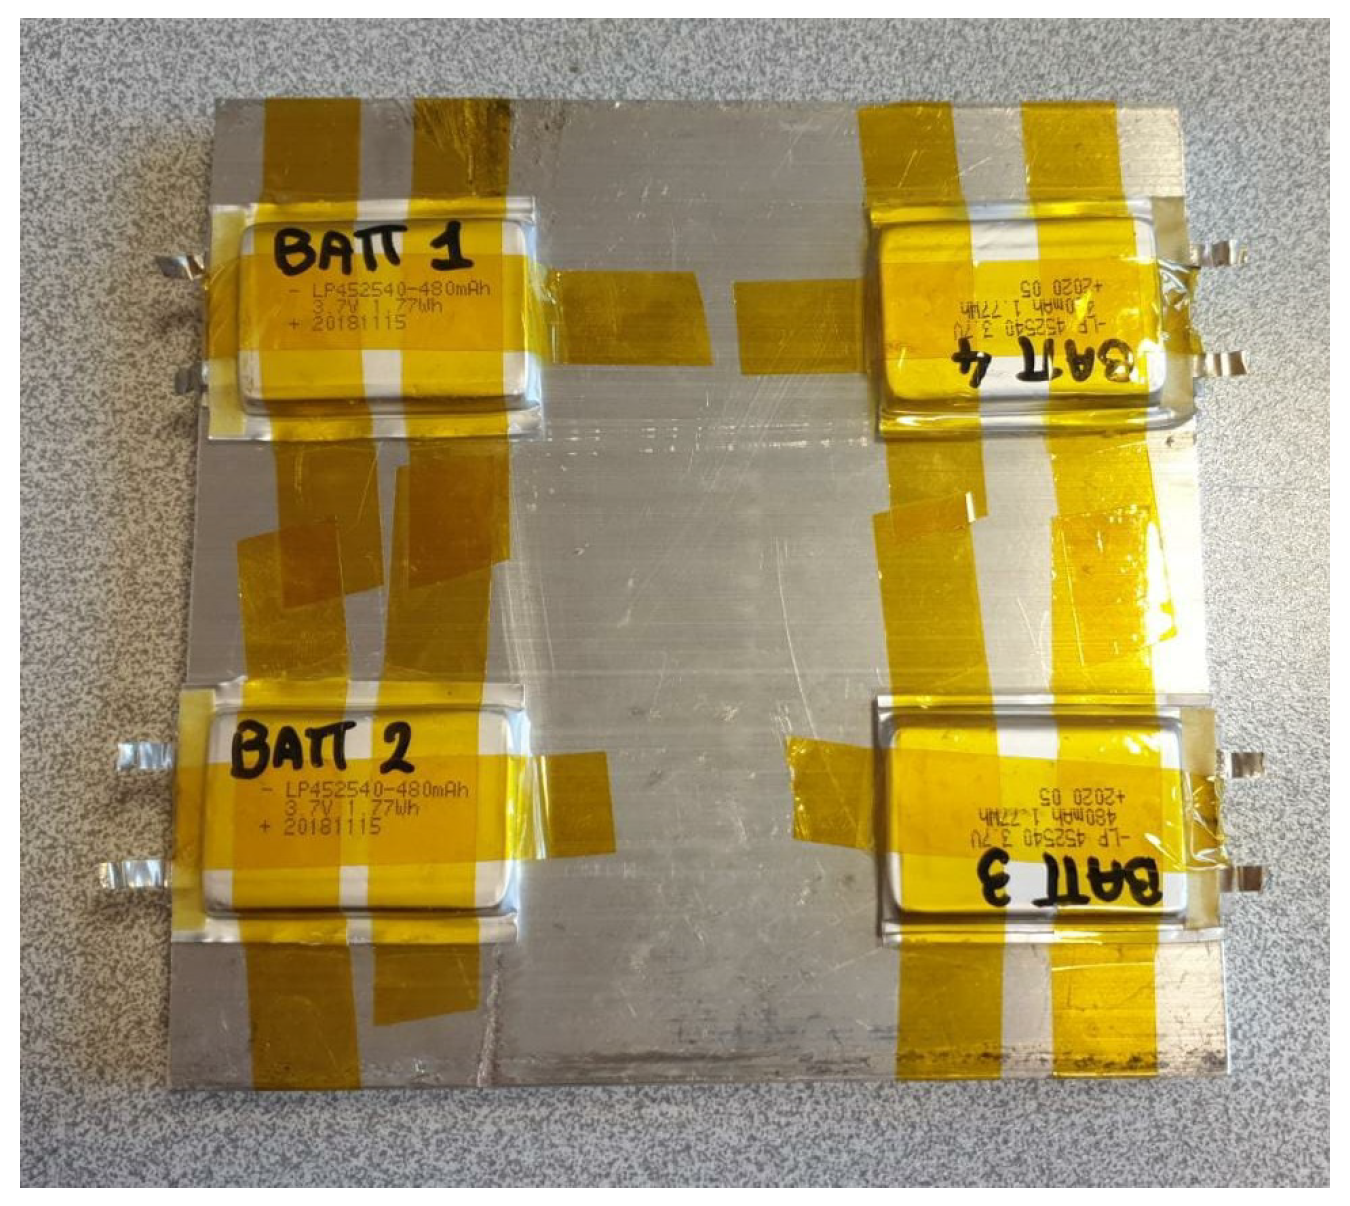
The batteries have been characterized with the HPPC testing procedure described above, for the room temperature of 23 °C and the maximum charging temperature of 45 °C. Four batteries have been tested to observe the individual variability of the batteries electrical properties. To have a temperature as uniform as possible throughout the batteries, they have been mounted on a 12 mm thick aluminum panel (shown in Figure 7), using the TermoPasty thermal conductive paste H. The batteries have been secured to the aluminum panel with Kapton adhesive tape, that can withstand high temperatures.

Figure 7.
Group of four batteries for the HPPC testing, mounted on the aluminum panel.
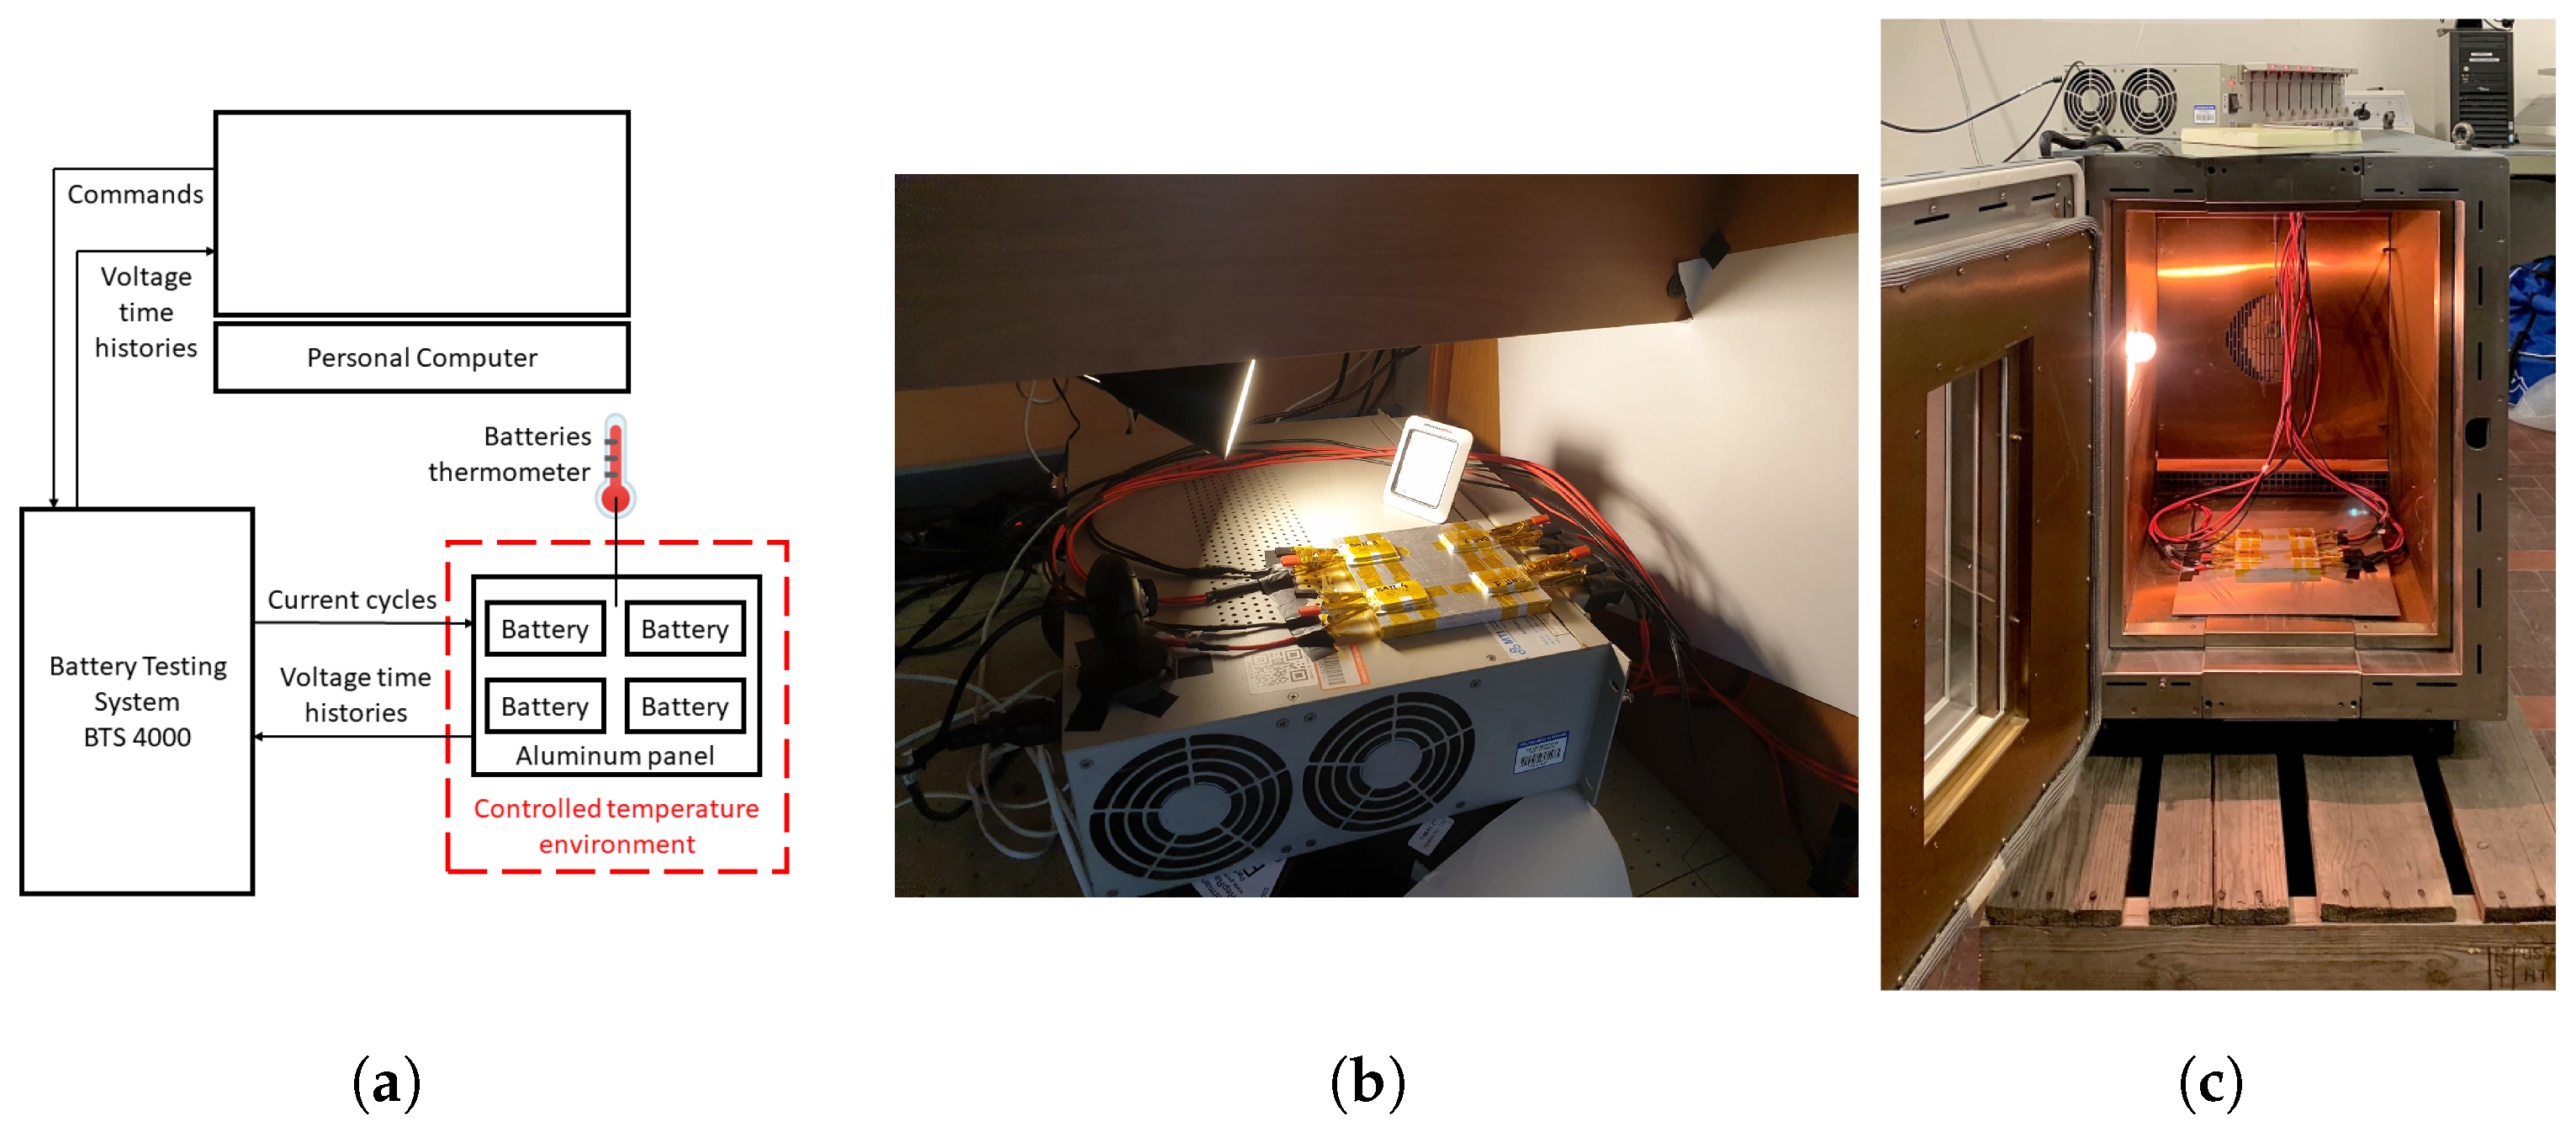
The experimental setup is shown in Figure 8a. A Neware BTS (Battery Testing System) 4000 [16] has been employed to apply the current cycles at the batteries terminals and to record the output voltages time histories. The BTS was connected to a personal computer to control the experimental runs and to recover the voltage recordings. A thermometer was used to manually check the batteries temperature as an additional precaution.
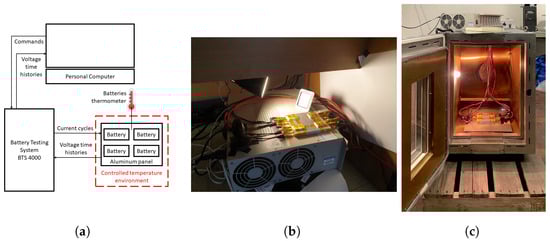
Figure 8.
HPPC test setup: (a) setup general configuration; (b) setup in the room with a thermostat; (c) setup in the Instron 3119-607 environmental chamber.
The batteries, mounted on the aluminum panel, were placed in a controlled temperature environment to keep their temperature uniform and constant in time. For the tests at 23 °C, a room with a thermostat was employed (Figure 8b), and for the test at 45 °C, an Instron 3119-607 environmental chamber was employed (Figure 8c). A MATLAB battery parameter estimator (https://it.mathworks.com/matlabcentral/fileexchange/36019-battery-modeling, accessed on 2 February 2025) has been adopted to optimize the Randles circuit parameters.
For the discharging tests, the batteries were preliminarily placed at the reference temperature for one hour, to obtain a uniform temperature and an electrical equilibrium state in the batteries. They were then fully charged with the recommended 0.2C (96 mA) charge rate up to 4.2 V (Table 1). For the reference temperature tests, the HPPC test was performed in the room with a thermostat. For the maximum-temperature tests (45 °C), the batteries were placed in the environmental chamber and left for an hour to obtain a uniform temperature. The HPPC tests could then take place. The adopted discharge currents are 96 mA (0.2C, the standard discharging condition) and 480 mA (1C, the maximum discharging condition, Table 1).
For the charging tests, the procedure is the same except for the initial, nominal temperature full discharge at the recommended current of 96 mA up to 3.0 V (Table 1). The charge currents for the HPPC tests are again 96 mA (0.2C) and 480 mA (1C).
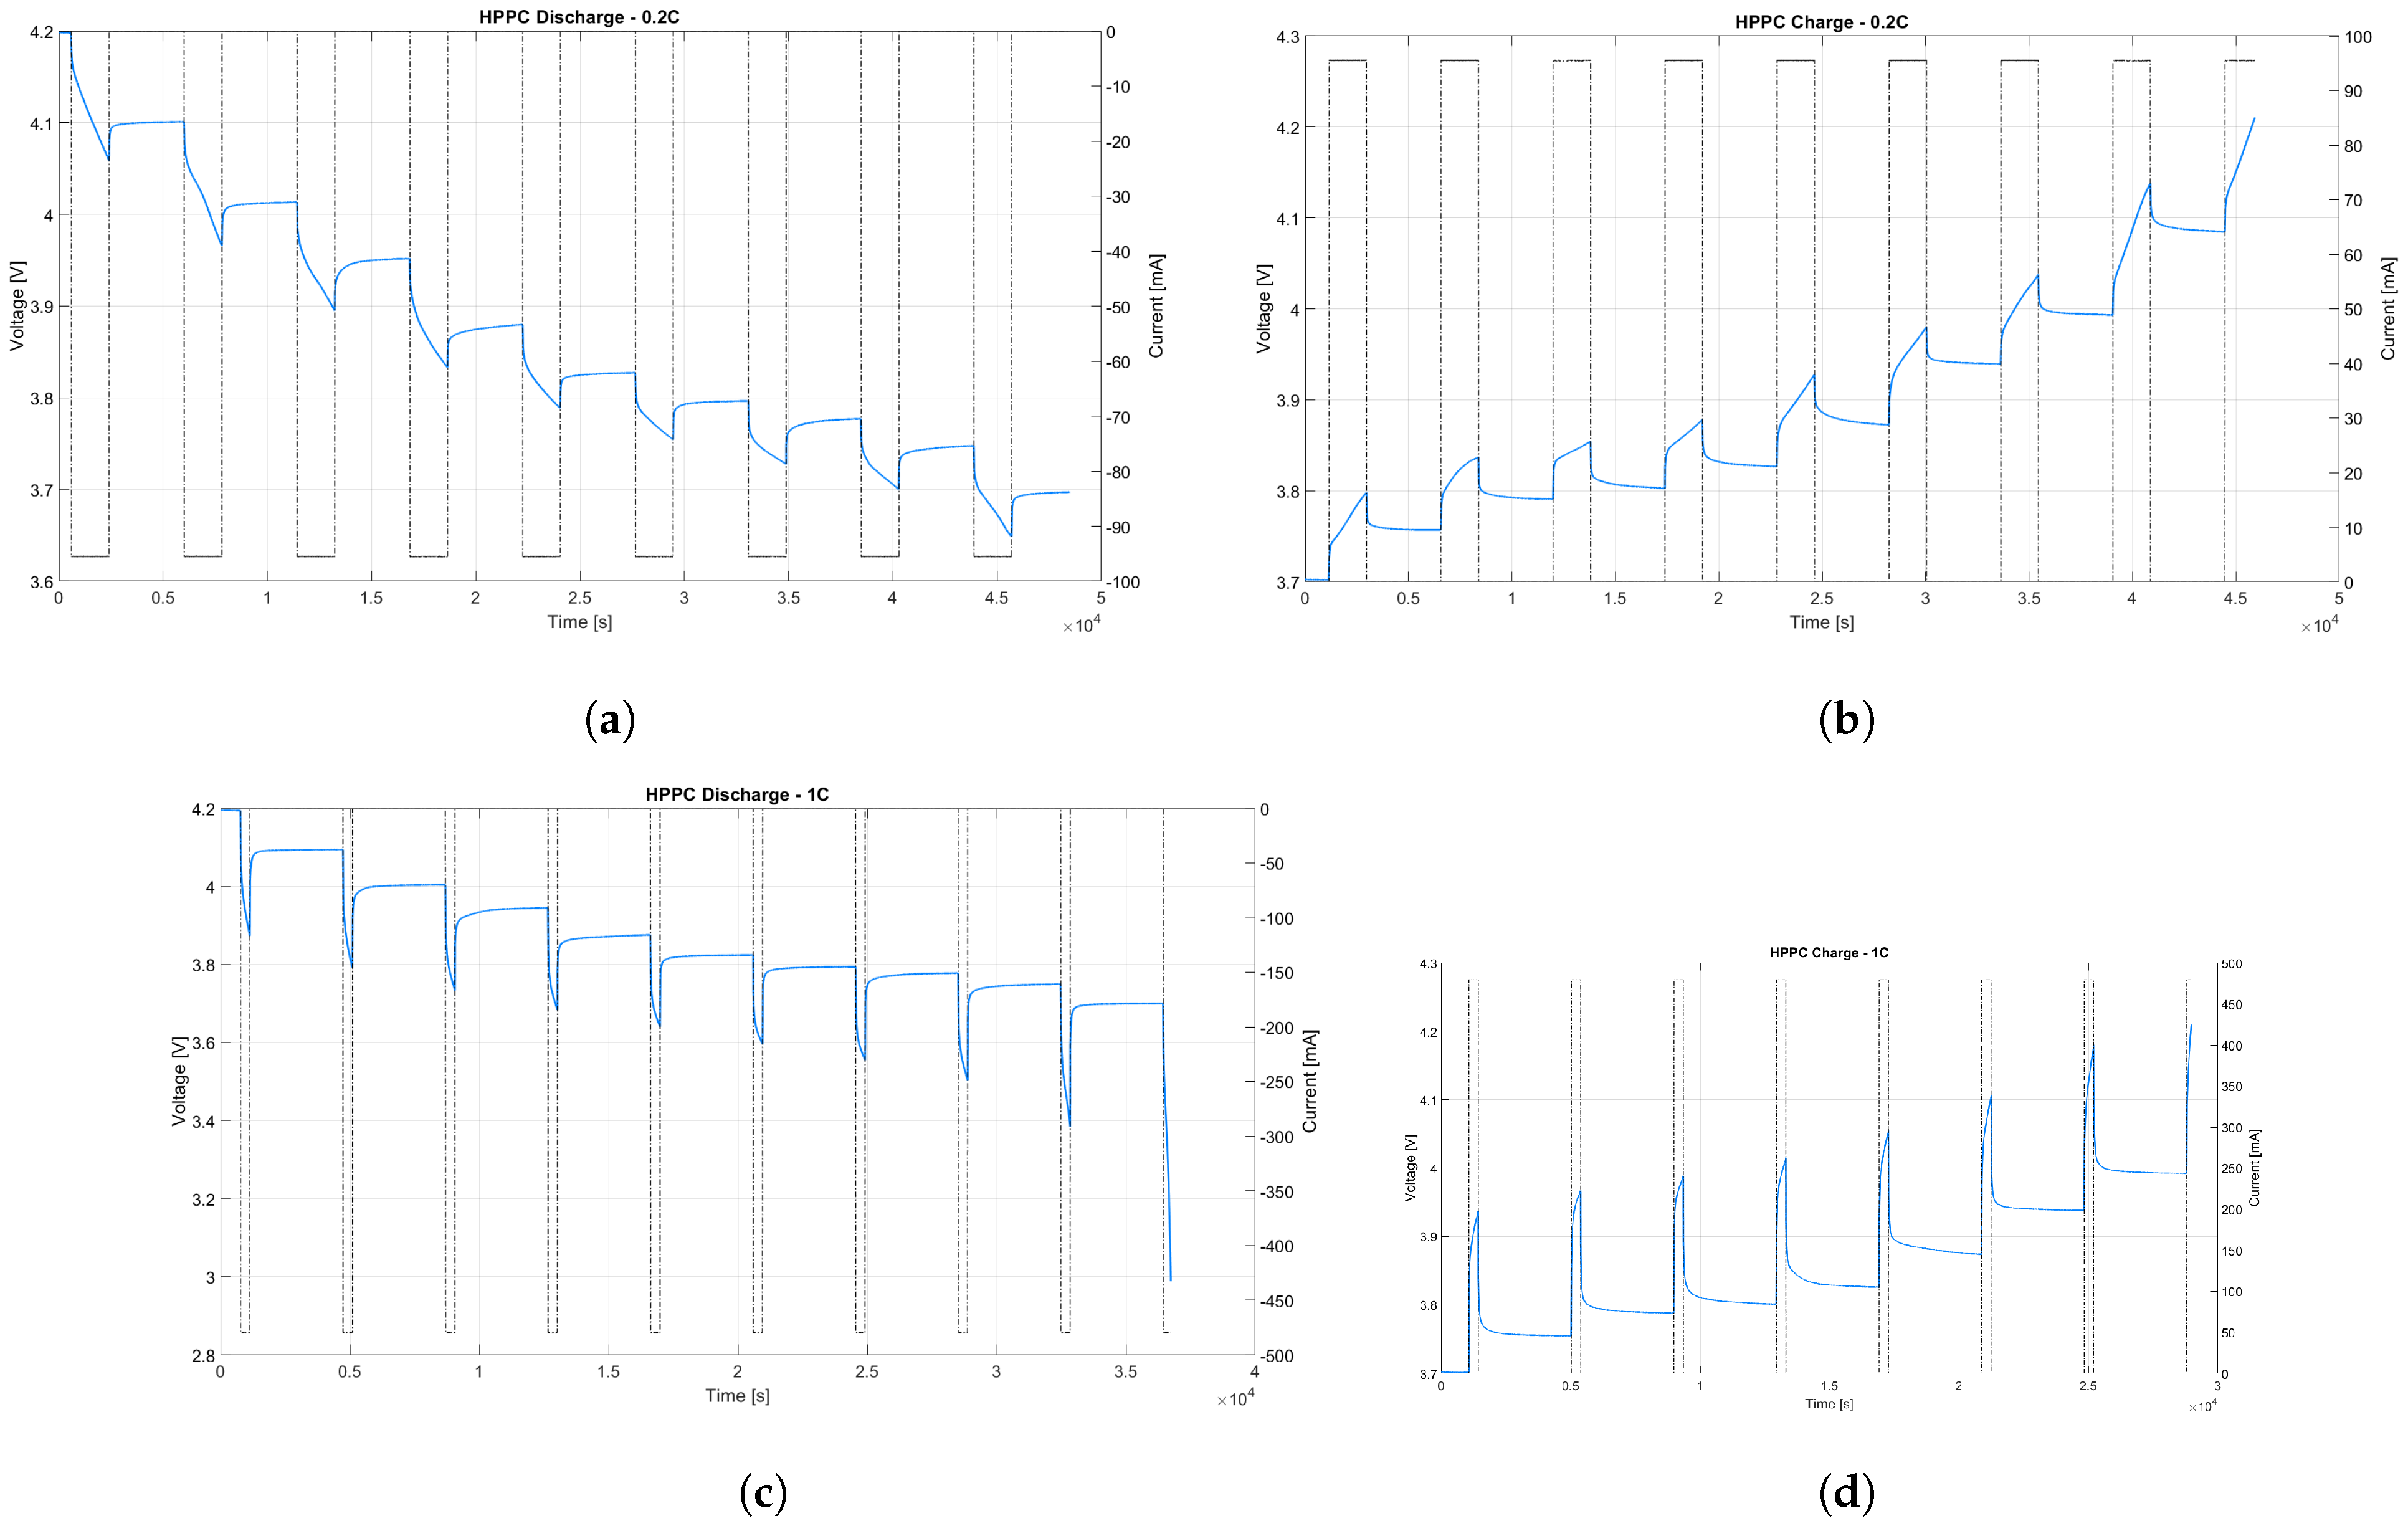
The current cycles for the HPPC tests are given in Table 2. The charge or discharge and rest phases are repeated until the limit maximum or minimum voltage is reached, respectively. During each active (i.e., charge or discharge) phase, the charge displaced (given to or taken from the battery, respectively) is 48 mAh which corresponds to the 10% of the total capacity. A rest period of 60 min was imposed, since it was observed that it was sufficient for the batteries to restore the electrochemical equilibrium. Example voltage and current time histories are represented in Figure 9.
Table 2.
HPPC tests steps. According to the adopted sign conventions, the currents i are positive for the discharge phase and negative for the charge phase.
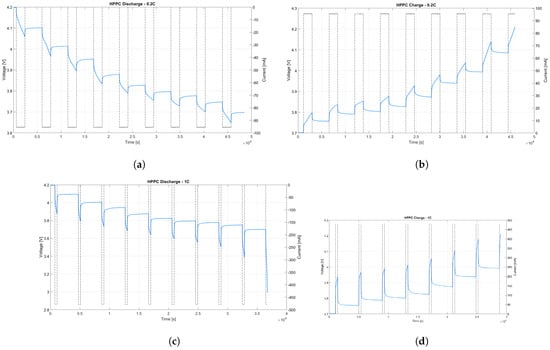
Figure 9.
Example HPPC tests voltage and current time histories: (a) discharge at 0.2C, (b) charge at 0.2C, (c) discharge at 1C, (d) charge at 1C.
With the available experimental data, the initial estimates for the Randles parameters could be computed and given to the battery parameter estimator. It was also necessary to establish whether the first or second-order Randles circuit was more suitable for the LiPo batteries. The first-order Randles circuit was chosen due to the optimal compromise between the computation time and the approximation error between experimental and numerical voltage time history. The choice of a first-order circuit is common in the literature ([17], p. 2).
Battery 3 (“BATT 3” in Figure 7) stopped giving a voltage signal before the maximum-temperature tests. It was observed that its voltage time histories during the nominal temperature tests differed significantly from the other three groups of signals. For these reasons, the results at nominal temperature for battery 3 were excluded from the analysis and the battery was replaced for the maximum-temperature tests.
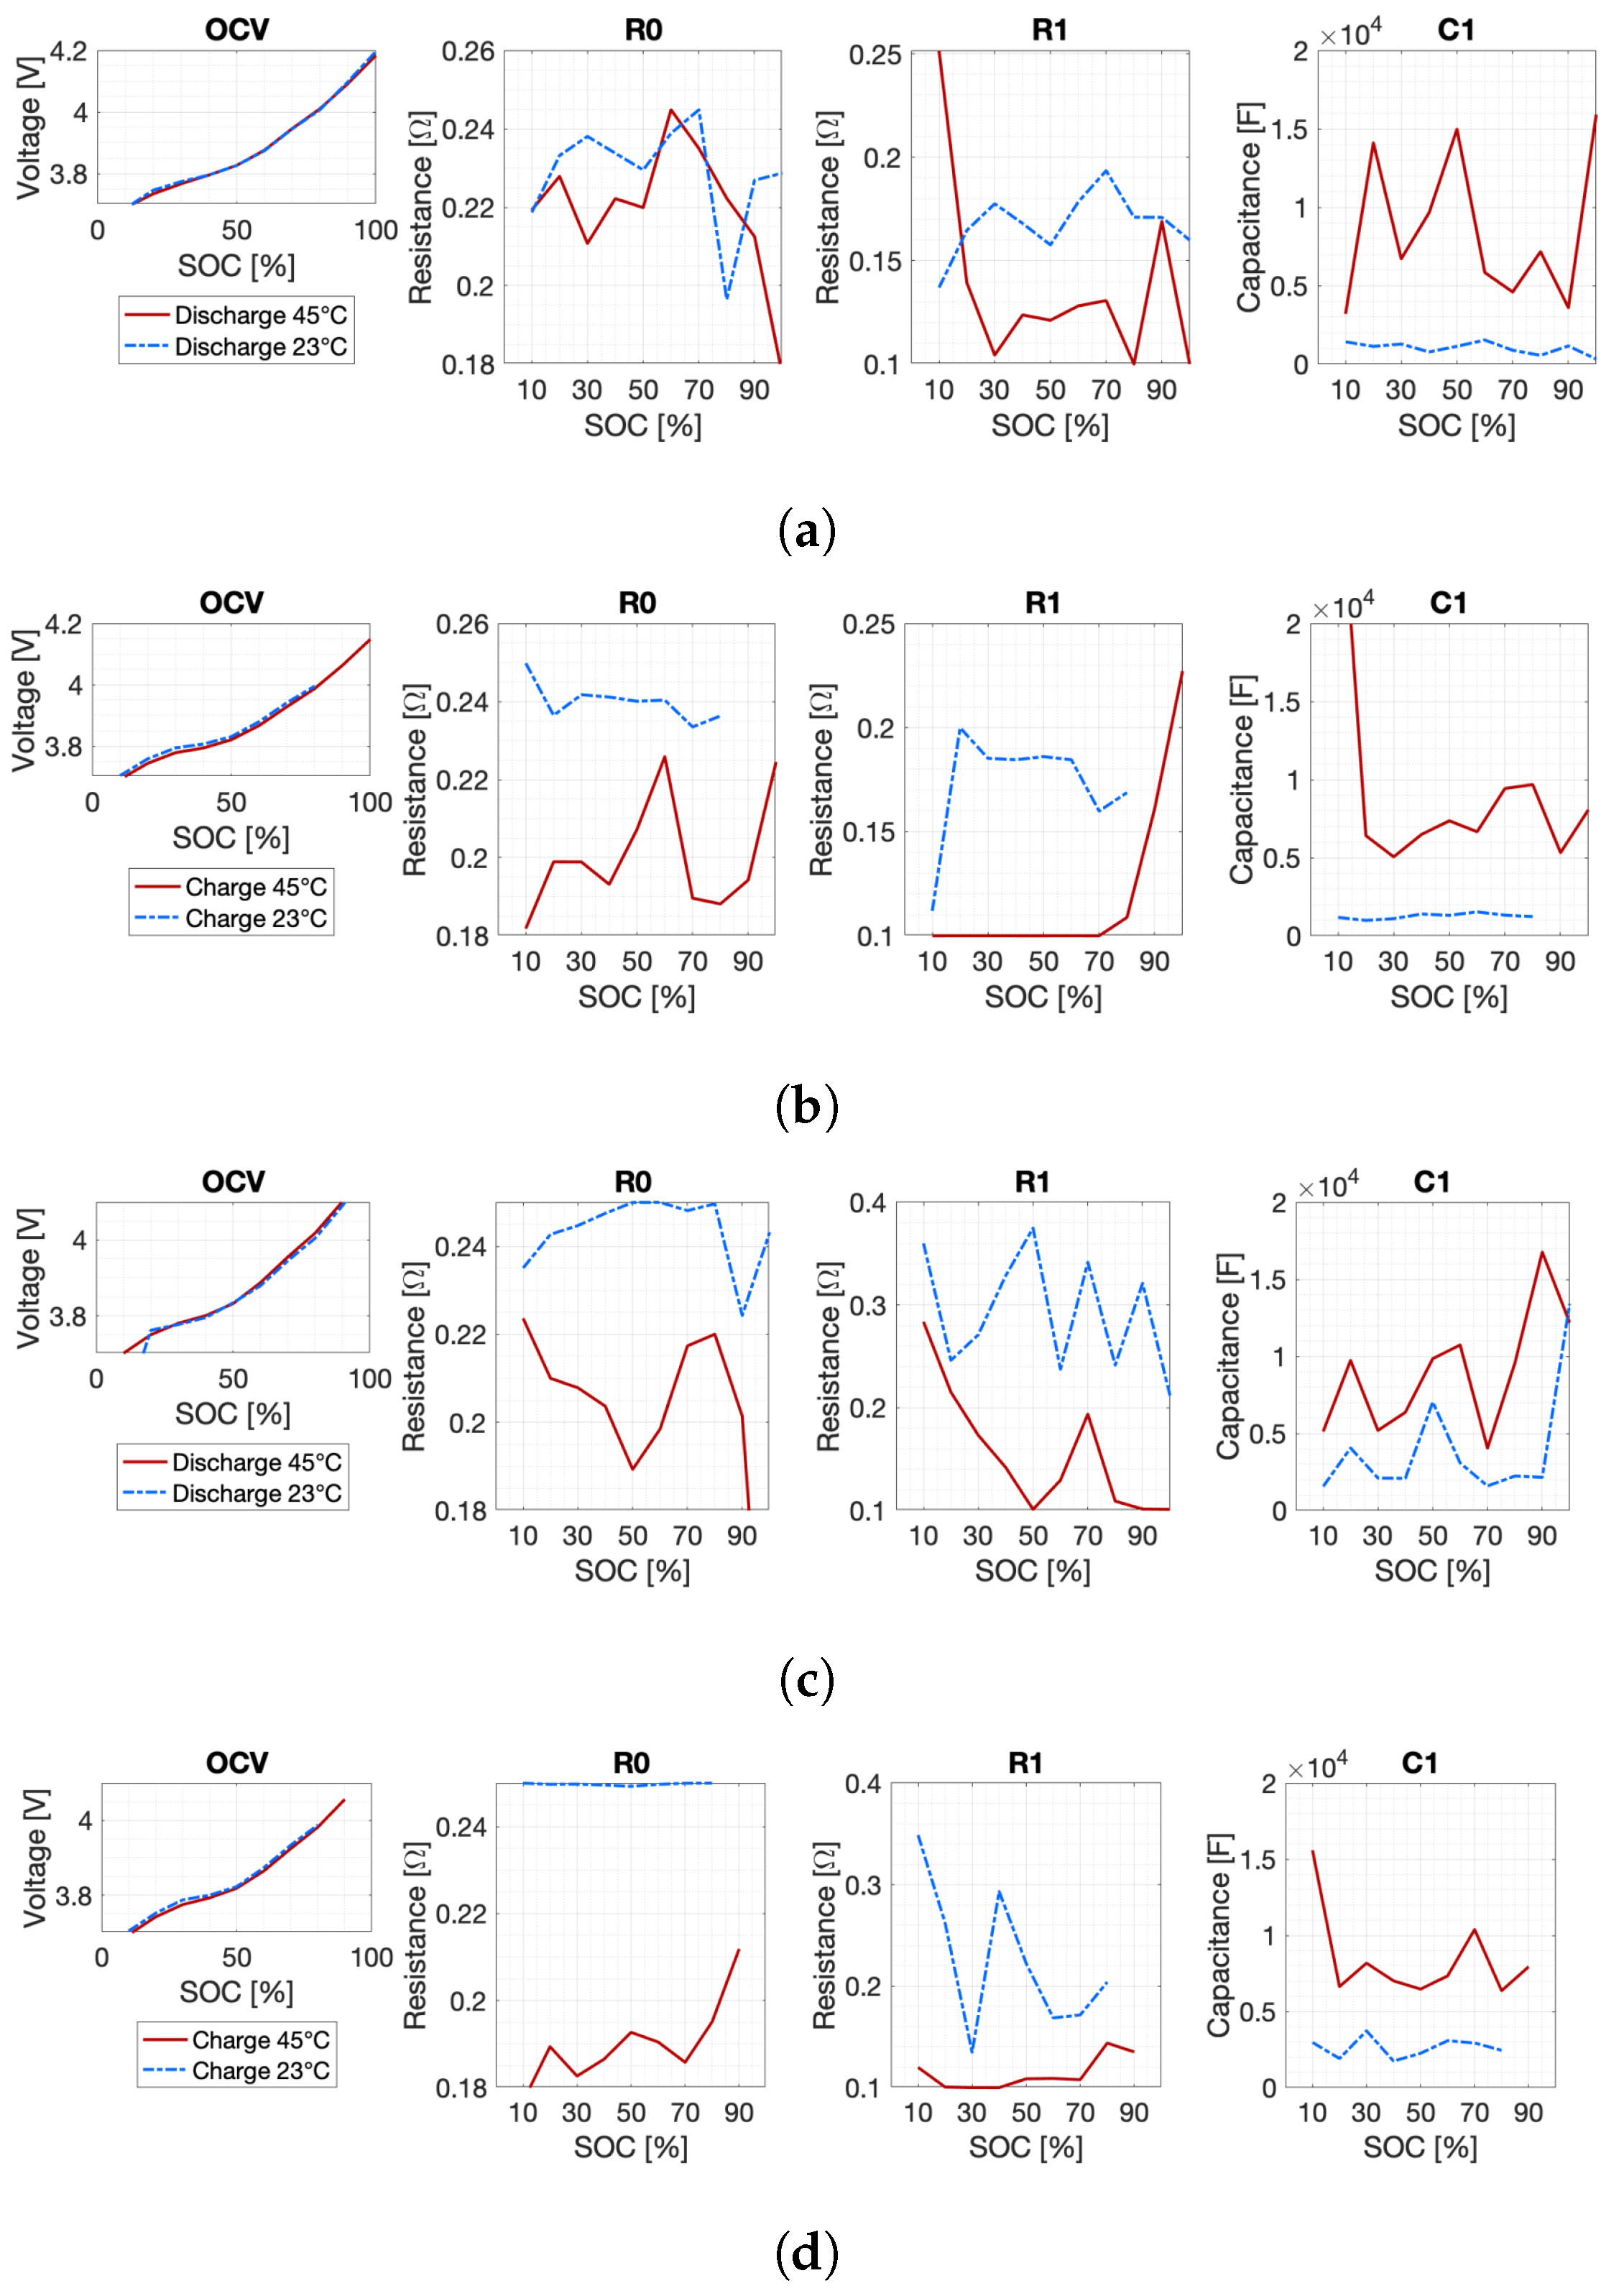
As a significant example, the results for battery 1 (“BATT 1” in Figure 7) are represented in Figure 10. The results are given as a function of the state of charge (SOC) and of the test temperature. The variation of the Randles circuit parameters with the SOC, the intensity and direction of the input current and the cell temperature can be observed. In particular, the tendency of the resistances and to decrease with increasing temperature is confirmed ([12], p. 58).
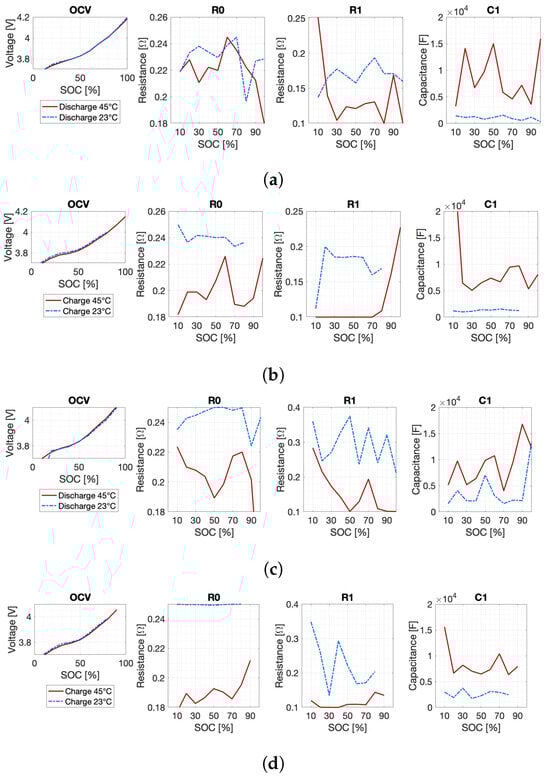
Figure 10.
HPPC tests results for battery 1 at reference temperature and maximum temperature at different C rates: (a) discharge at 0.2C, (b) charge at 0.2C, (c) discharge at 1C, and (d) charge at 1C. The results are given in function of the state of charge (SOC), and are, from left to right, the open-circuit voltage (OCV), the series resistance , and the parameters and of the resistor–capacitor loop.
3. Embedded Battery Tile Thermal Analysis
The embedded battery tile prototype has been shown to have adequate modal characteristics in previous work [8]. Another important aspect of the prototype validation is the compatibility of the tile with its typical operative thermal environment. Materials like carbon-fiber-reinforced polymers (CFRPs) have low thermal conductivity and may cause excessively high or low temperatures.
Thus, a series of thermal simulations have been performed with the Thermal Desktop software in a typical LEO (Low Earth Orbit) environment. The environment is defined in Section 3.1. A complete, modular 1U CubeSat has been simulated, with six smart tiles, one of which is an embedded battery tile. The configuration of the embedded battery tile prototype has been reproduced in the thermal model. The experimental data have been included in the analysis and the missing data have been found with the help of a bibliographic search. The model is described in Section 3.2.
Thermal analyses are described in Section 3.3. The thermal model has been employed for a series of parametric analyses, encompassing different materials, operating conditions, and orbits geometry (Section 3.3.1). Rather than evaluating the entire life cycle of the spacecraft, two key conditions are examined: the condition with the maximum heat load, called the hot case, and the condition with the minimum heat load, called the cold case. The parametric analyses are introduced to acquire a sensitivity on the effect of each parameter, especially materials properties, on the CubeSat temperature field. In particular, the entity of temperature variations is investigated, along with the scale of the temperature variation, i.e., whether the effect on the temperature field is local or global, affecting the whole satellite.
Considering the results of the parametric analysis, the final configuration is composed and analyzed in Section 3.3.2.
3.1. Orbital Environment
The assumption of a deployment from the International Space Station (ISS) is made. The CubeSat reaches the ISS orbit via a launch vehicle, it is then stored in the space station and it is finally deployed in its operative orbit. The thermal environment in these preliminary phases is controlled by ground operations, the launch vehicle and the ISS. The temperature extremes vary with the type of ground operations, the launch vehicle type, the storage and deployment phase and are compatible with the CubeSat thermal requirements.
Once in its operative orbit, it is assumed that the orbit of the CubeSat is the same of the ISS. This is a reasonable hypothesis if the CubeSat is deployed from the ISS with a small impulse, e.g., with a manual operation. Thus, the nominal orbit adopted in the thermal analysis has a perigee height of 414 km, an apogee height of 421 km and an inclination of 51.6 degrees.
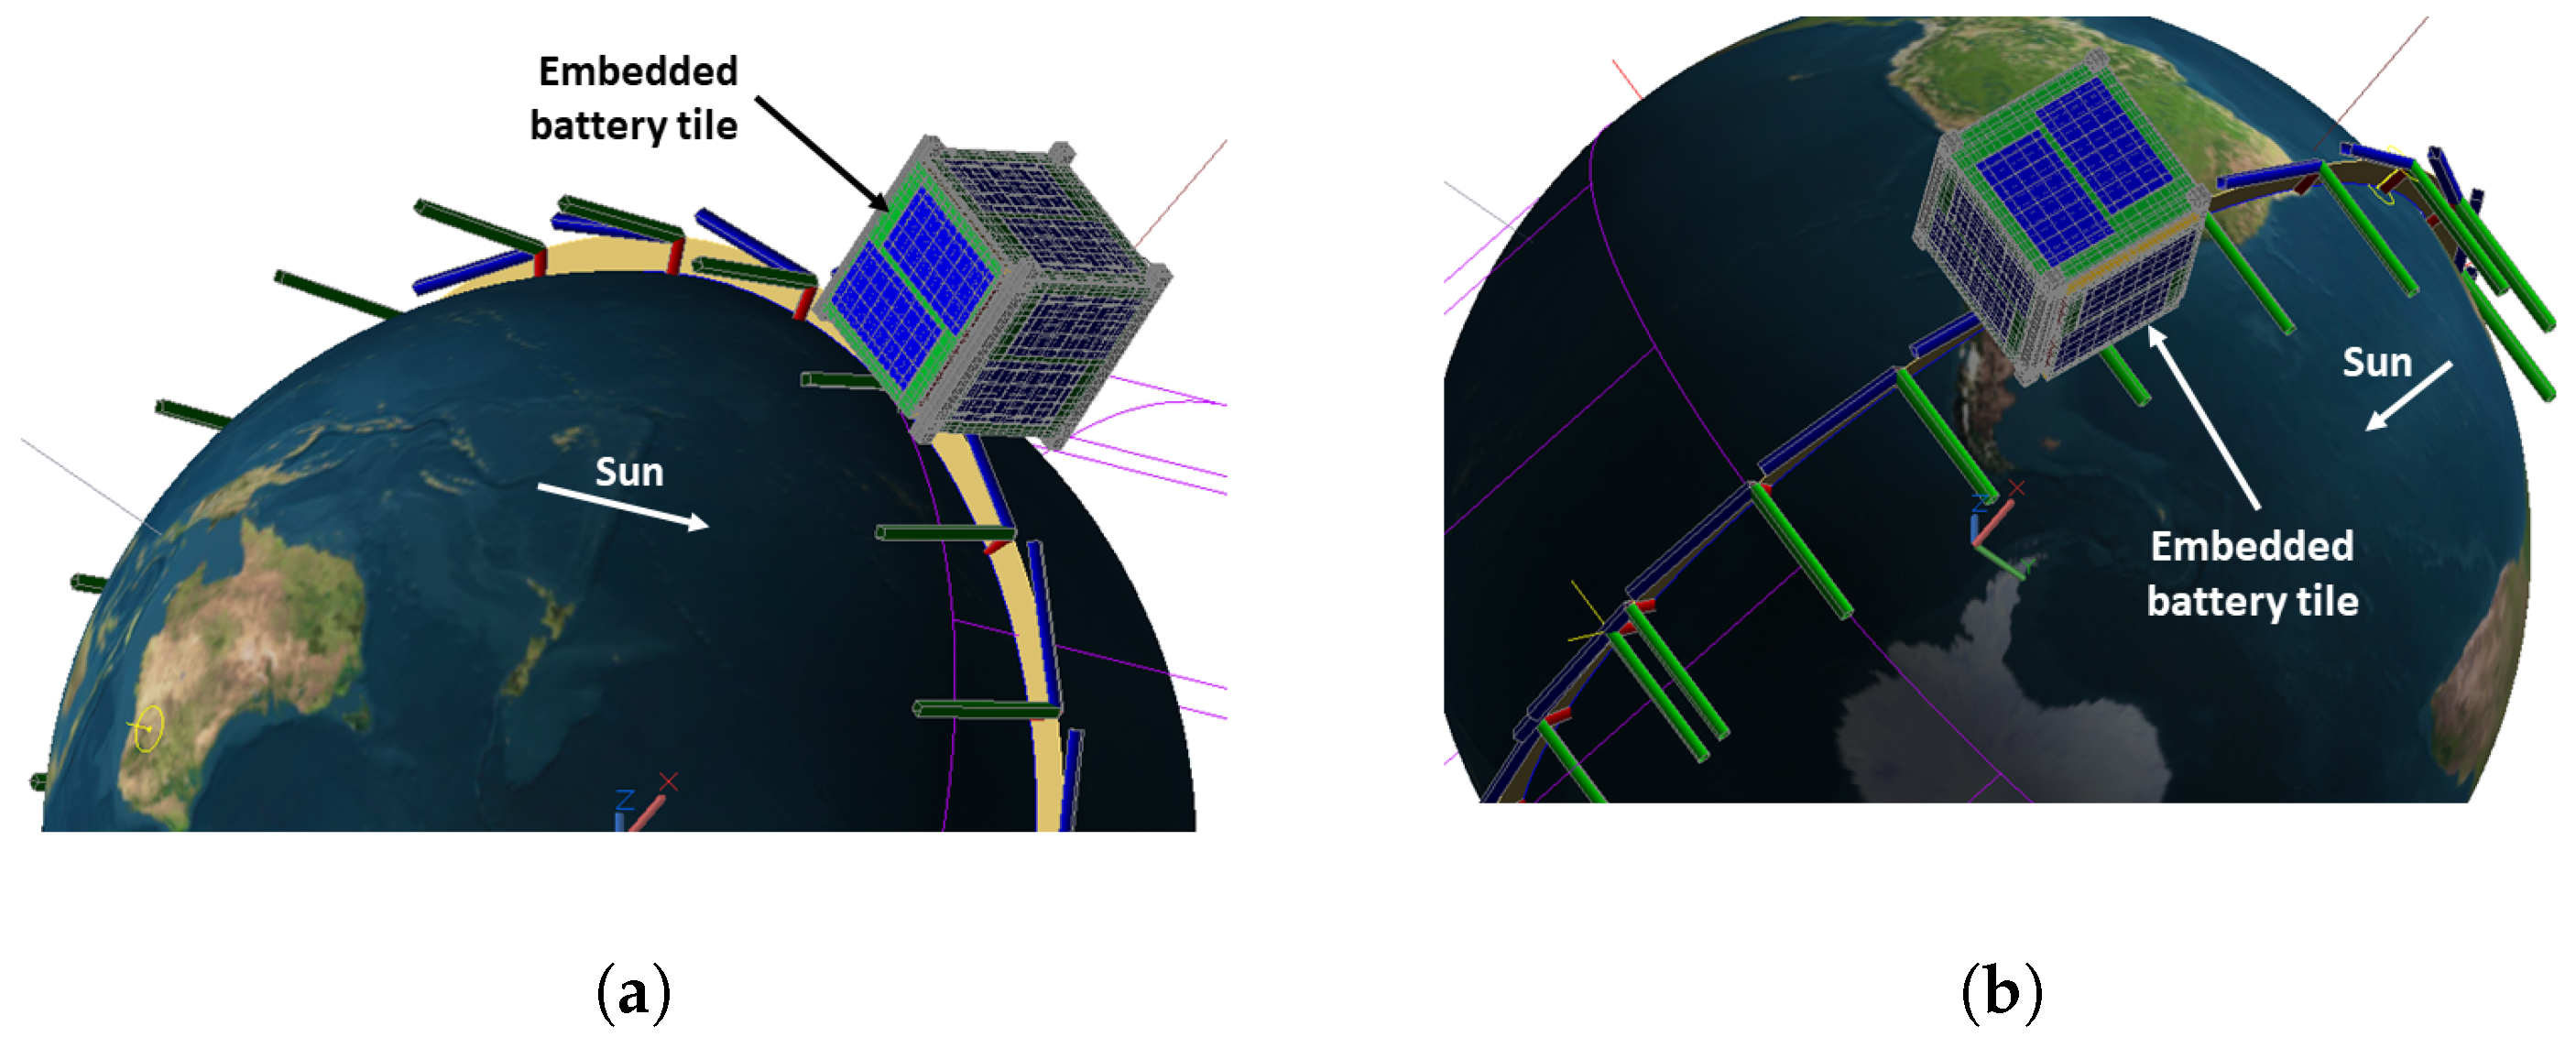
A relevant parameter for the thermal environment in orbit is the beta angle, ([18], p. 18), defined as the angle between the Sun vector and its projection on the orbital plane of the spacecraft. For LEO orbits similar to those described in the present case, the spacecraft eclipse period is minimum for the maximum absolute value of , and the eclipse period is maximum for the minimum absolute value of ([18], pp. 18–20). Since the maximum case has the maximum heat load from the Sun, it is considered in the hot case. The minimum case has the minimum heat load from the Sun, and thus is considered for the cold case. Beta angle variation in time is shown in Figure 11, where the origin of the time axis is the epoch of the initial orbital parameters. The minimum absolute value for beta is zero, and its maximum absolute value of 75.091° is reached 275.5 days after epoch time. The hot and cold cases orbits are shown in Figure 12a and Figure 12b, respectively.
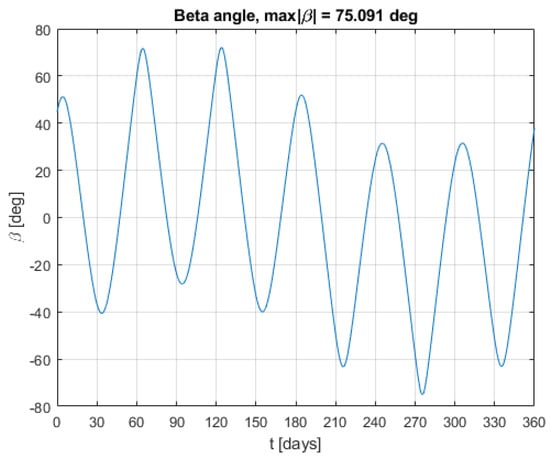
Figure 11.
Beta angle as a function of time for the nominal orbit.
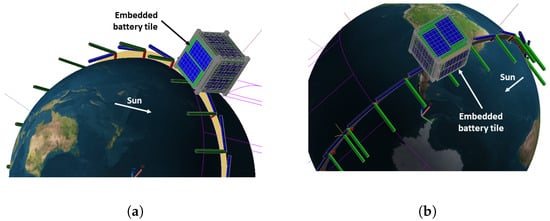
Figure 12.
CubeSat attitudes for the hot case (a) and the cold case (b).
To evaluate the thermal effects of orbital decay as well, an End Of Life (EOL) circular orbit with an altitude of 120 km has been considered. This orbital altitude is usually considered to represent the lowest stable circular orbit around the Earth, due to atmospheric drag. The other initial orbital parameters have been kept equal to the nominal orbit, except for the eccentricity which is zero. In these conditions, the maximum absolute value for the beta angle is 74.40° and the minimum absolute value is zero as for the nominal orbit.
3.2. ARAMIS Thermal Model
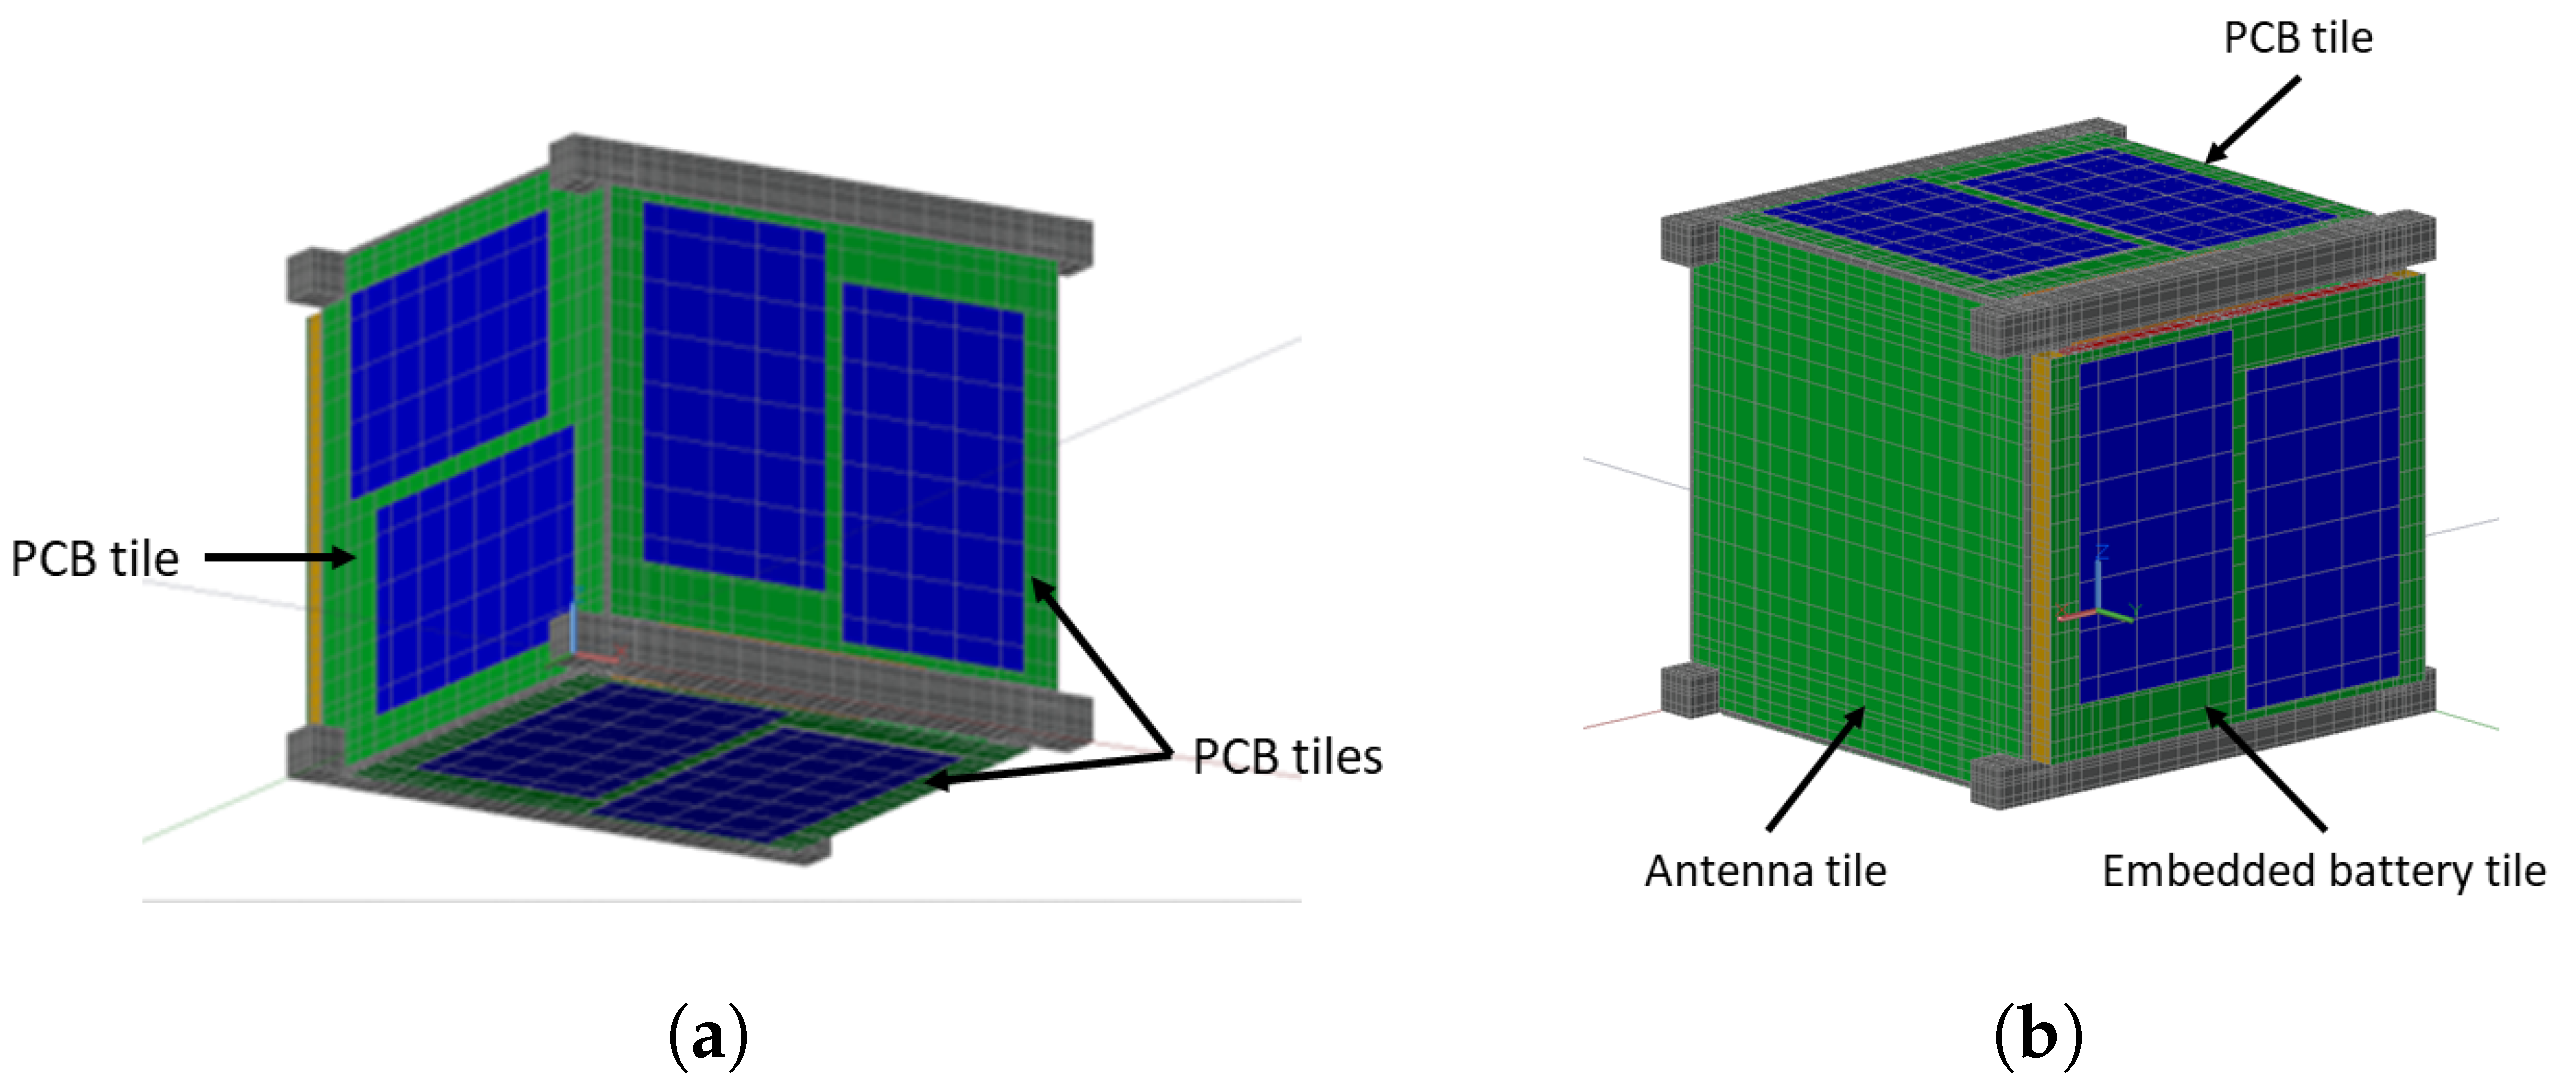
The CubeSat thermal model geometry has been derived from a SolidWorks model. The CubeSat tiles arrangement is shown in Figure 13. The set of six smart tiles includes the embedded battery tile (Figure 13b), an antenna tile (Figure 13b), and four PCB tiles (Figure 13a), that are composed of a PCB, two solar cells, and other electronic components that are neglected in this section.

Figure 13.
External views of the ARAMIS thermal model: (a) view with three PCB tiles, (b) view showing the tiles with the antenna tile (left), a PCB tile (top), and the embedded battery tile (right).
The geometry of the SolidWorks model has been inevitably simplified, similarly to what happens for FEM models. Planar objects are introduced in the model considering their midplanes. These include solar cells, PCBs, CFRP skins, and part of the CubeSat skeleton.
The CubeSat model consists of finite difference surfaces and solids. Although both finite difference and finite elements are supported in Thermal Desktop, the finite difference method has been chosen due to its flexibility: the spatial discretization and the geometry of the models are easier to vary with respect to the finite element method.
The boundary conditions are not given in terms of temperatures but are represented by Sun radiation, Earth albedo, and Earth planetshine. Atmospheric drag effects have been neglected.
The CubeSat components models are described in the following sections. Instead of using a specific payload, it has been schematized, to keep the analysis as general as possible (Section 3.2.2). The thermal properties of bonds, gluing, and mechanical joints adopted during the assembly procedure, for example, of the embedded battery tile (Section 3.2.4), are taken into account. A literature search has been performed for missing experimental values. Listing every thermal parameter in the model is beyond the scope of present work. These can be found in the complete report [19].
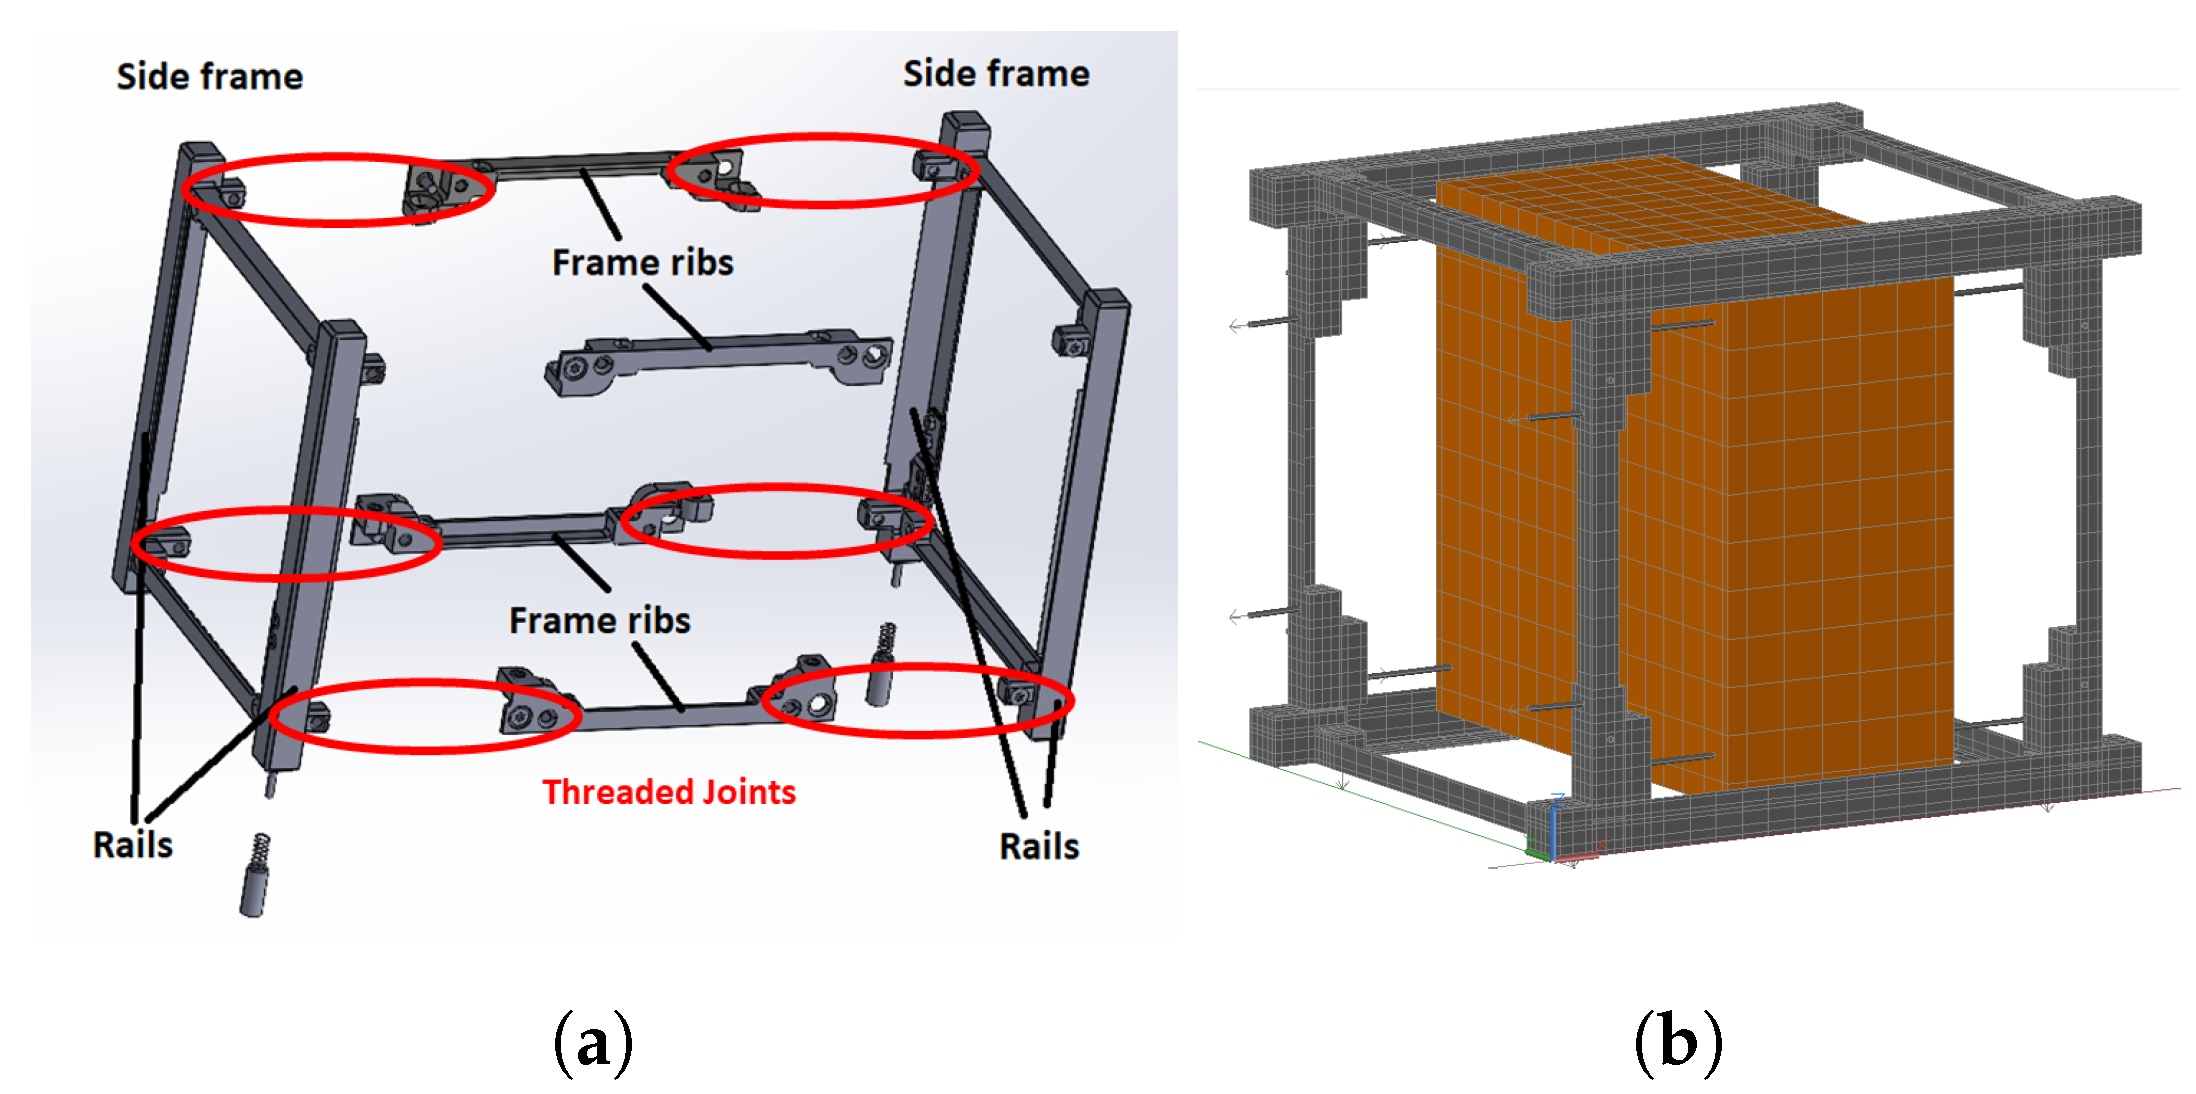
3.2.1. Skeleton
The skeleton is an ISISPACE commercial product and is an assembly composed of side frames and ribs, shown in Figure 14a. The ribs are connected to the side frames by threaded joints. The thermal conductance of these joints is complex to determine and goes beyond the scope of the present work. A conservative value is adopted from the literature ([20], p. 50), . This value has been imposed with a contactor at each rib–frame junction. Moreover, each tile is joined to the skeleton assembly with four HeliCoil joints. The value of their conductance is assumed to be equal to and is imposed with node-to-node conductors.

Figure 14.
Thermal model of the ARAMIS skeleton: (a) ISISPACE commercial structure exploded view. The threaded joints are circled in red, (b) CubeSat skeleton, shown in gray, and payload, shown in orange. The node-to-node conductors for the payload and the −X PCB tile are shown with gray cylinders.
The thermal model of the skeleton is shown in Figure 14b in gray. The thermophysical and thermo-optical properties for the skeleton aluminum alloy are given in Table 3. Two sets of thermo-optical properties are employed since the CubeSat mechanical requirement 3.2.16 ([21], p. 9) imposes a rule that the CubeSat rails should be hard-anodized.
Table 3.
Aluminum 6061 alloy thermophysical and thermo-optical properties.
A preliminary analysis for a CFRP skeleton has also been performed. Although CFRP has a strongly anisotropic thermal conductivity [23], for simplicity the in-plane thermal conductivity has been adopted (3.3 W/m/K), to consider the maximum thermal conductivity.
3.2.2. Payload
Instead of using a specific payload, a general, schematic payload has been adopted. The payload is introduced in the thermal model with a parallelepiped, shown in orange in Figure 14b. The dimensions of the payload section are taken according to the PC/104 standard [24]. The height of the parallelepiped is selected to respect the maximum mass of 1.33 kg dictated by the CubeSat specification (mechanical requirement 3.2.10 ([21], p. 9)).
The payload is mounted on the skeleton with four threaded rods. These rods are modeled with node-to-node conductors, with a thermal conductance of 2 W/K, as mentioned in Section 3.2.1. The conductors are shown in Figure 14b with gray cylinders.
The payload is composed of a mix of aluminum 6061 alloy (whose thermophysical properties are given in Table 3) and PCB laminate. The percentage of these two components and the resulting thermophysical properties are given in Table 4 and Table 5, respectively.
Table 4.
Payload compositions.
Table 5.
Payload thermophysical properties. The through-plane direction is parallel to the payload module height.
The thermo-optical properties of the payload are also varied in the parametric analysis. The properties of bare aluminum (Table 3) and of the PCB solder mask are considered.
The payload and the LiPo batteries in the embedded battery tile (Section 3.2.4) are sources of thermal power dissipation. Since the maximum CubeSat thermal power dissipation is 6 W for the hot case, with the maximum battery charging current, the payload thermal power is set to 5.77 W. For different batteries currents, the payload power is modified to obtain a total of 6 W. For the cold case, the payload thermal dissipation is zero.
3.2.3. PCB and Antenna Tiles
The layup and materials of the PCBs is shared by the PCB tiles and the embedded battery tile. The circuit boards are made of layers of FR4 and copper, their layup is described in Table 6. The coating towards the CubeSat payload is called solder mask and the external finish towards space is called top coat. The layup for the antenna tile is given in Table 7. The FR4 is replaced with rogers due to its better electromagnetic properties. The thermophysical properties are given in Table 8.
Table 6.
Lamination of the PCBs for the thermal analysis.
Table 7.
Lamination of the antenna PCB.
Table 8.
Thermophysical properties for PCB materials: FR4 and rogers.
The thermo-optical properties for the top coat and solder mask are given in Table 9. Three kinds of top coatings have been considered in the parametric analysis, to evaluate the effect of the coating’s solar absorptivity on the satellite temperatures.
Table 9.
Thermo-optical properties for the PCBs.
The solar cells are modeled as a laminate with one layer of gallium arsenide (GaAs, 300 μm thick) and one layer of glass (100 μm thick). If the solar cell does not produce current (OFF condition), then the basic properties of the solar cell are considered. If the solar cell is producing current, then its nominal absorptivity must take into account its efficiency , i.e., is the ratio between the power produced by the cell and the incident solar power ([31], p. 30). The absorptivity for a functioning solar cell is given by ([20], p. 51):
The efficiency considered for the previous equation is the maximum efficiency. This is a simplification, since the efficiency of the solar cell varies with the working condition ([31], p. 29). The IR emissivity remains constant for ON and OFF cases, equal to 0.85. The solar cells are mounted on the PCBs with low-outgassing siliconic adhesives, that have been taken into account in the thermal model.
Each tile is mounted on the skeleton with four HeliCoils, allowing a thermal conduction path through the joint itself that is modeled with node-to-node conductors. The conductance of these conductors is set to 2 W/K, as described in Section 3.2.1. An additional thermal conduction path has been introduced by filling the gap between the tiles and the skeleton with space-qualified thermal interface materials (TIMs), that has been modeled with face contactors.
3.2.4. Embedded Battery Tile
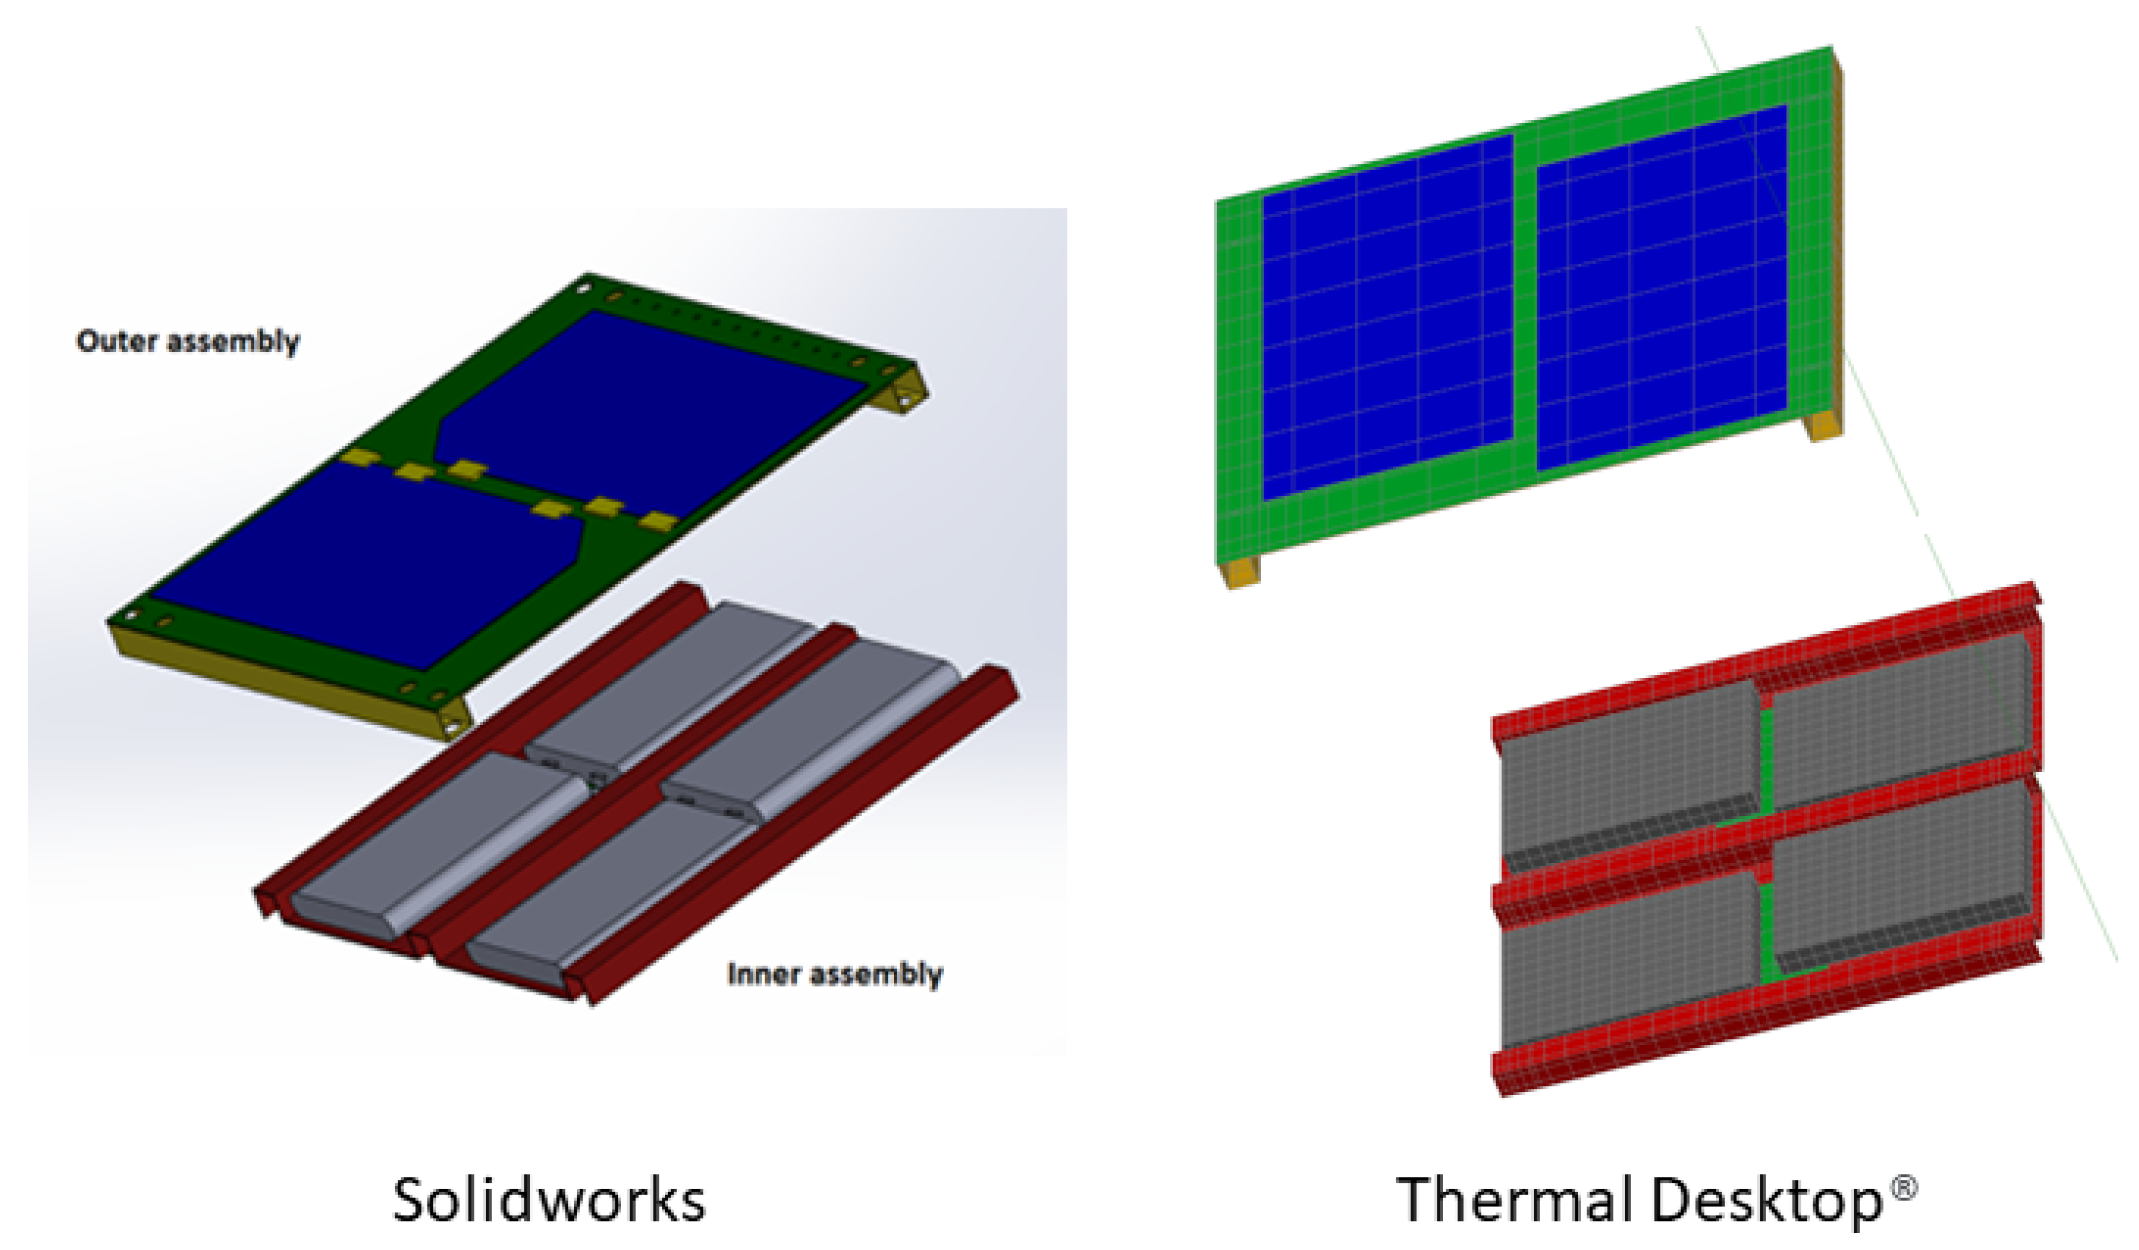
The thermal model of the embedded battery tile is shown in Figure 15. The SolidWorks 2016 model geometry on the left has been simplified in the passage to the Thermal Desktop model. The layup and the properties of the PCBs and solar cells have already been presented in Section 3.2.3.

Figure 15.
Embedded battery tile represented in the SolidWorks model (left) and in the Thermal Desktop simplified model (right). The inner CFRP skin is colored in red and the outer skin is represented in yellow.
The thermophysical and thermo-optical properties of CFRP are given in Table 10. The density has been evaluated during the experimental structural analysis [8]. With the layup given in Table 6, the in-plane conductivity of the PCB is 50.54 W/m/K and the through-plane conductivity is 0.32 W/m/K. A high thermal conductivity CFRP has also been introduced in the parametric analysis to allow a comparison with thermally performing materials.
Table 10.
CFRP thermophysical and thermo-optical properties for the thermal analysis.
The battery thermophysical and thermo-optical properties are given in Table 11.
Table 11.
LiPo battery thermophysical and thermo-optical properties.
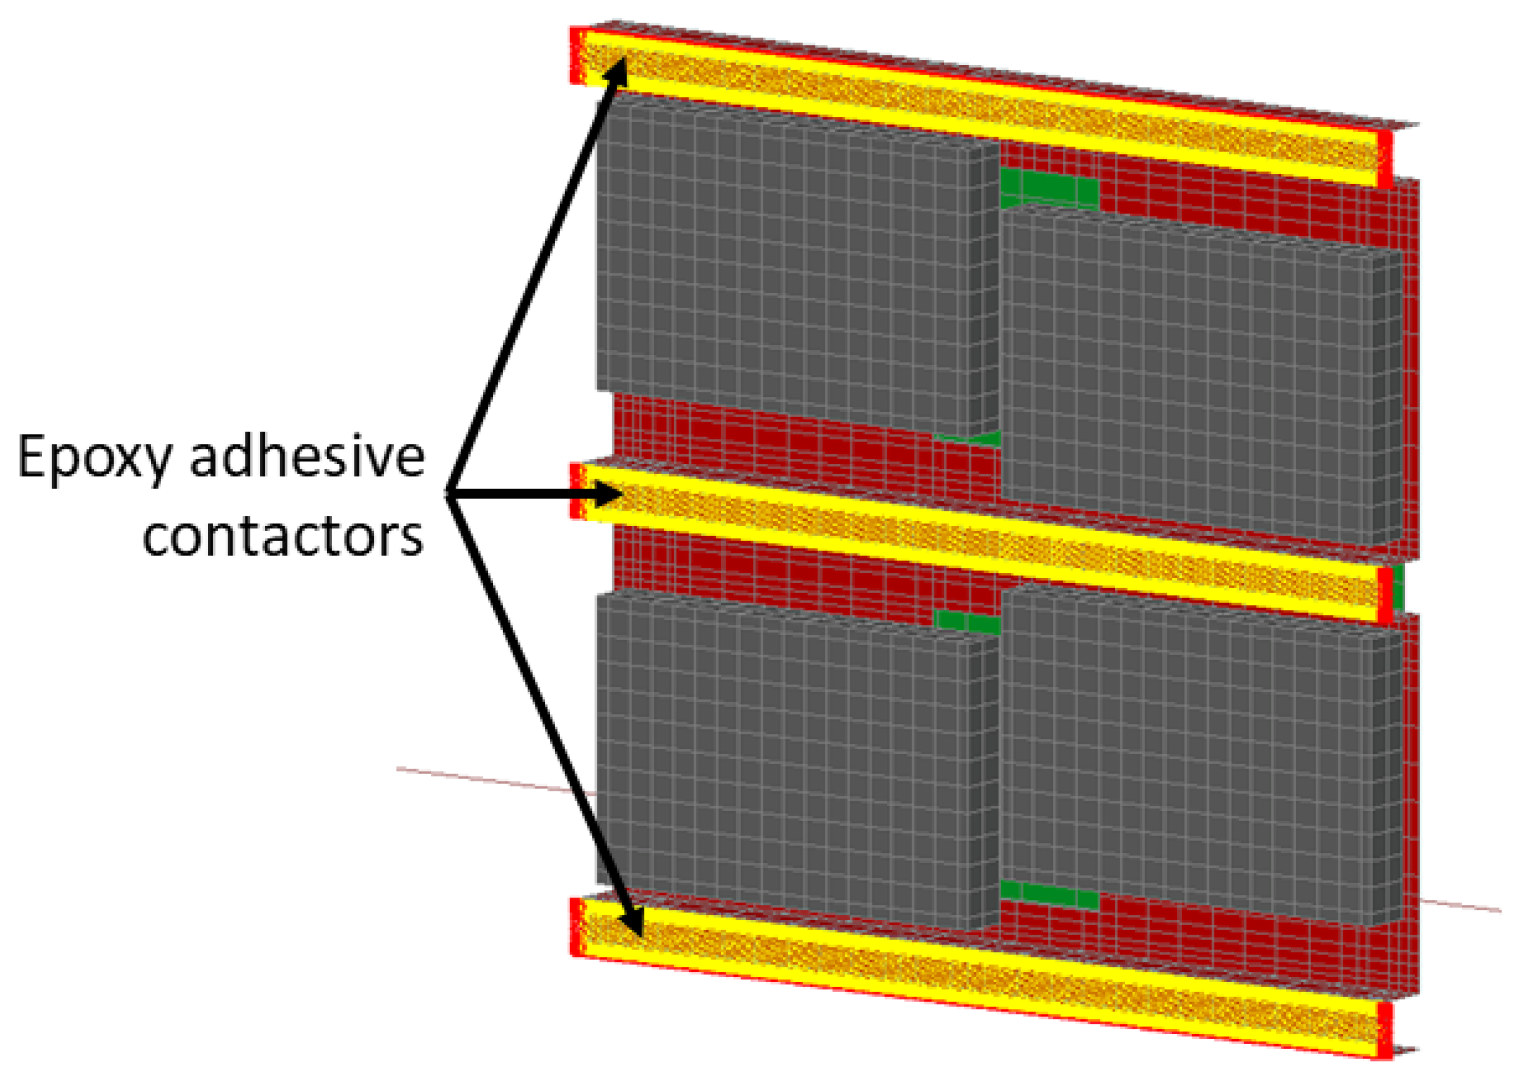
The assembly procedure [8] has been considered to model the junctions in the thermal model. Contactors have been employed to simulate the adhesives joining the battery tile components. Aerospace-grade epoxy adhesives have been employed to join the inner and the outer skin, the inner PCB and the inner skin, and the outer PCB and the outer skin. The face contactor between the two skins is shown in Figure 16. The yellow bars indicate a thermal contact and the red area indicates no thermal contact.
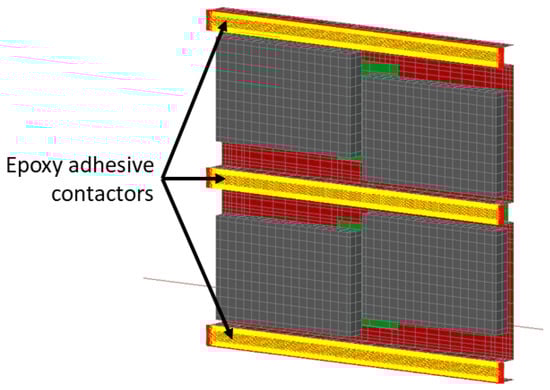
Figure 16.
Contactor between the inner skin and the outer skin. The outer assembly is removed for clarity.
The batteries are connected to the inner skin with the silicone adhesives used for the solar cells.
The thermal power dissipated by the batteries can be easily evaluated with the experimental investigation described in Section 2.3. As mentioned in Section 2.1, the battery internal resistance of the resistor varies with the battery temperature , the state of charge (SoC), and the working condition, i.e., charging or discharging mode, depending on the output current absolute value and on the intensity of the current. For simplicity, a conservative single resistance value of has been chosen, given the results of the Hybrid Pulse Power Characterization (HPPC) tests on the batteries (Figure 10):
Considering the output (input) current I given by (to) the battery, the thermal power dissipation can be estimated with Joule’s law:
The output and input currents considered in the thermal model are listed in Table 12, with the corresponding thermal powers. These values correspond to typical working points and are taken from the battery data sheet [15]. A further current level of 0.5C, within operating limits, has been considered as well.
Table 12.
Battery current levels and dissipated thermal powers considered for the thermal analyses.
The 0.2C current has been considered for the cold case, while the 0.5C and 1.0C cases are employed in the hot case.
3.3. Analysis and Results
The CubeSat thermal model is composed of an orbital environment (Section 3.1), and a spacecraft assembly (Section 3.2). For the CubeSat components a number of different materials and top coats have been considered. This allows for a parametric analysis with two objectives:
- To acquire a sensitivity about the effect of each parameter on the satellite temperature field (Section 3.3.1);
- To find the combinations of parameters that allow spacecraft components operation within the specified temperature limits (Section 3.3.2).
For the environmental conditions (Section 3.1), the hot case and the cold case have been examined. For the hot case, the maximum absolute value of the solar beta angle has been chosen, (Figure 11), that implies a null eclipse period. Moreover, the solar cells were considered to be turned off, to maximize their solar absorptance (Equations (10) and (11)), the embedded battery tile is always orthogonal to solar radiation and the total thermal dissipation of the CubeSat is 6 W. For the cold case, the beta angle is zero, resulting in the maximum solar eclipse period. The solar cells are considered as turned on, to minimize their solar absorptance (Equations (10) and (11)), the payload thermal dissipation is zero and the battery tile is kept orthogonal to the surface of the Earth and the Sun, ensuring the minimum incoming radiation. The batteries thermal dissipation corresponds to 0.2C current (Section 3.2.4).
The LiPo batteries are placed within the embedded battery tile that is mounted on the CubeSat skeleton (Figure 13b), while this solution allows for internal volume saving for the spacecraft payload [8], it may excessively expose the batteries to the extreme temperatures and heat loads of the orbital environment, with respect to more classical configurations where the batteries are stowed in the internal volume ([35], Figure 4). Thus, particular attention has been paid to batteries temperatures and the results showed that batteries temperatures were not in the allowed limits, in particular the minimum temperatures were excessively low. Thus, a heater has been added to the tile, to keep the batteries in the correct temperature interval.
To find a temperature field that represents a condition of dynamic thermal equilibrium, a cyclic solution has been imposed. With this solution, the known initial temperature, that depends on the ISS deployment, can be disregarded and the temperatures time history in stationary conditions can de found.
3.3.1. Parametric Analysis
The effect of different materials and properties on the temperature field has been evaluated in a comparative way. Analyses have been made varying one parameter at a time, leaving the remaining parameters constant, both in the hot and cold cases. The results are summarized in the following paragraphs.
Orbital Decay
As mentioned in Section 3.1, and End Of Life (EOL) orbital altitude of 120 km has been considered. The results have been compared with the nominal orbit altitude cases. Both the hot case and the cold cases have been taken into consideration. Table 13 lists the temperature range differences for each component, in the hot case and in the cold case. It can be observed that the nominal altitude is the most critical case between the two, since the EOL orbital altitude has higher temperatures in the cold case and lower temperatures in the hot case, with respect to the nominal altitude. As a consequence, the nominal altitude cases only have been considered in further analyses.
Table 13.
Temperature ranges differences between the nominal and EOL orbit cases.
Skeleton
The CubeSat skeleton properties have been varied. The properties of aluminum alloy 6061 and CFRP have been considered (Table 3). For the cold cases results, the minimum temperatures for the aluminum alloy skeleton case are below the allowed range, except for the skeleton, the inner skin, and the outer skin (although with a reduced temperature margin of approximately 5 °C). This is due to the use of low conductivity adhesives and thermal interface materials. The introduction of the CFRP skeleton further lowered the minimum temperatures, leaving just the payload temperature range within the allowable limits, with a narrow margin of 3.2 °C for the minimum temperature.
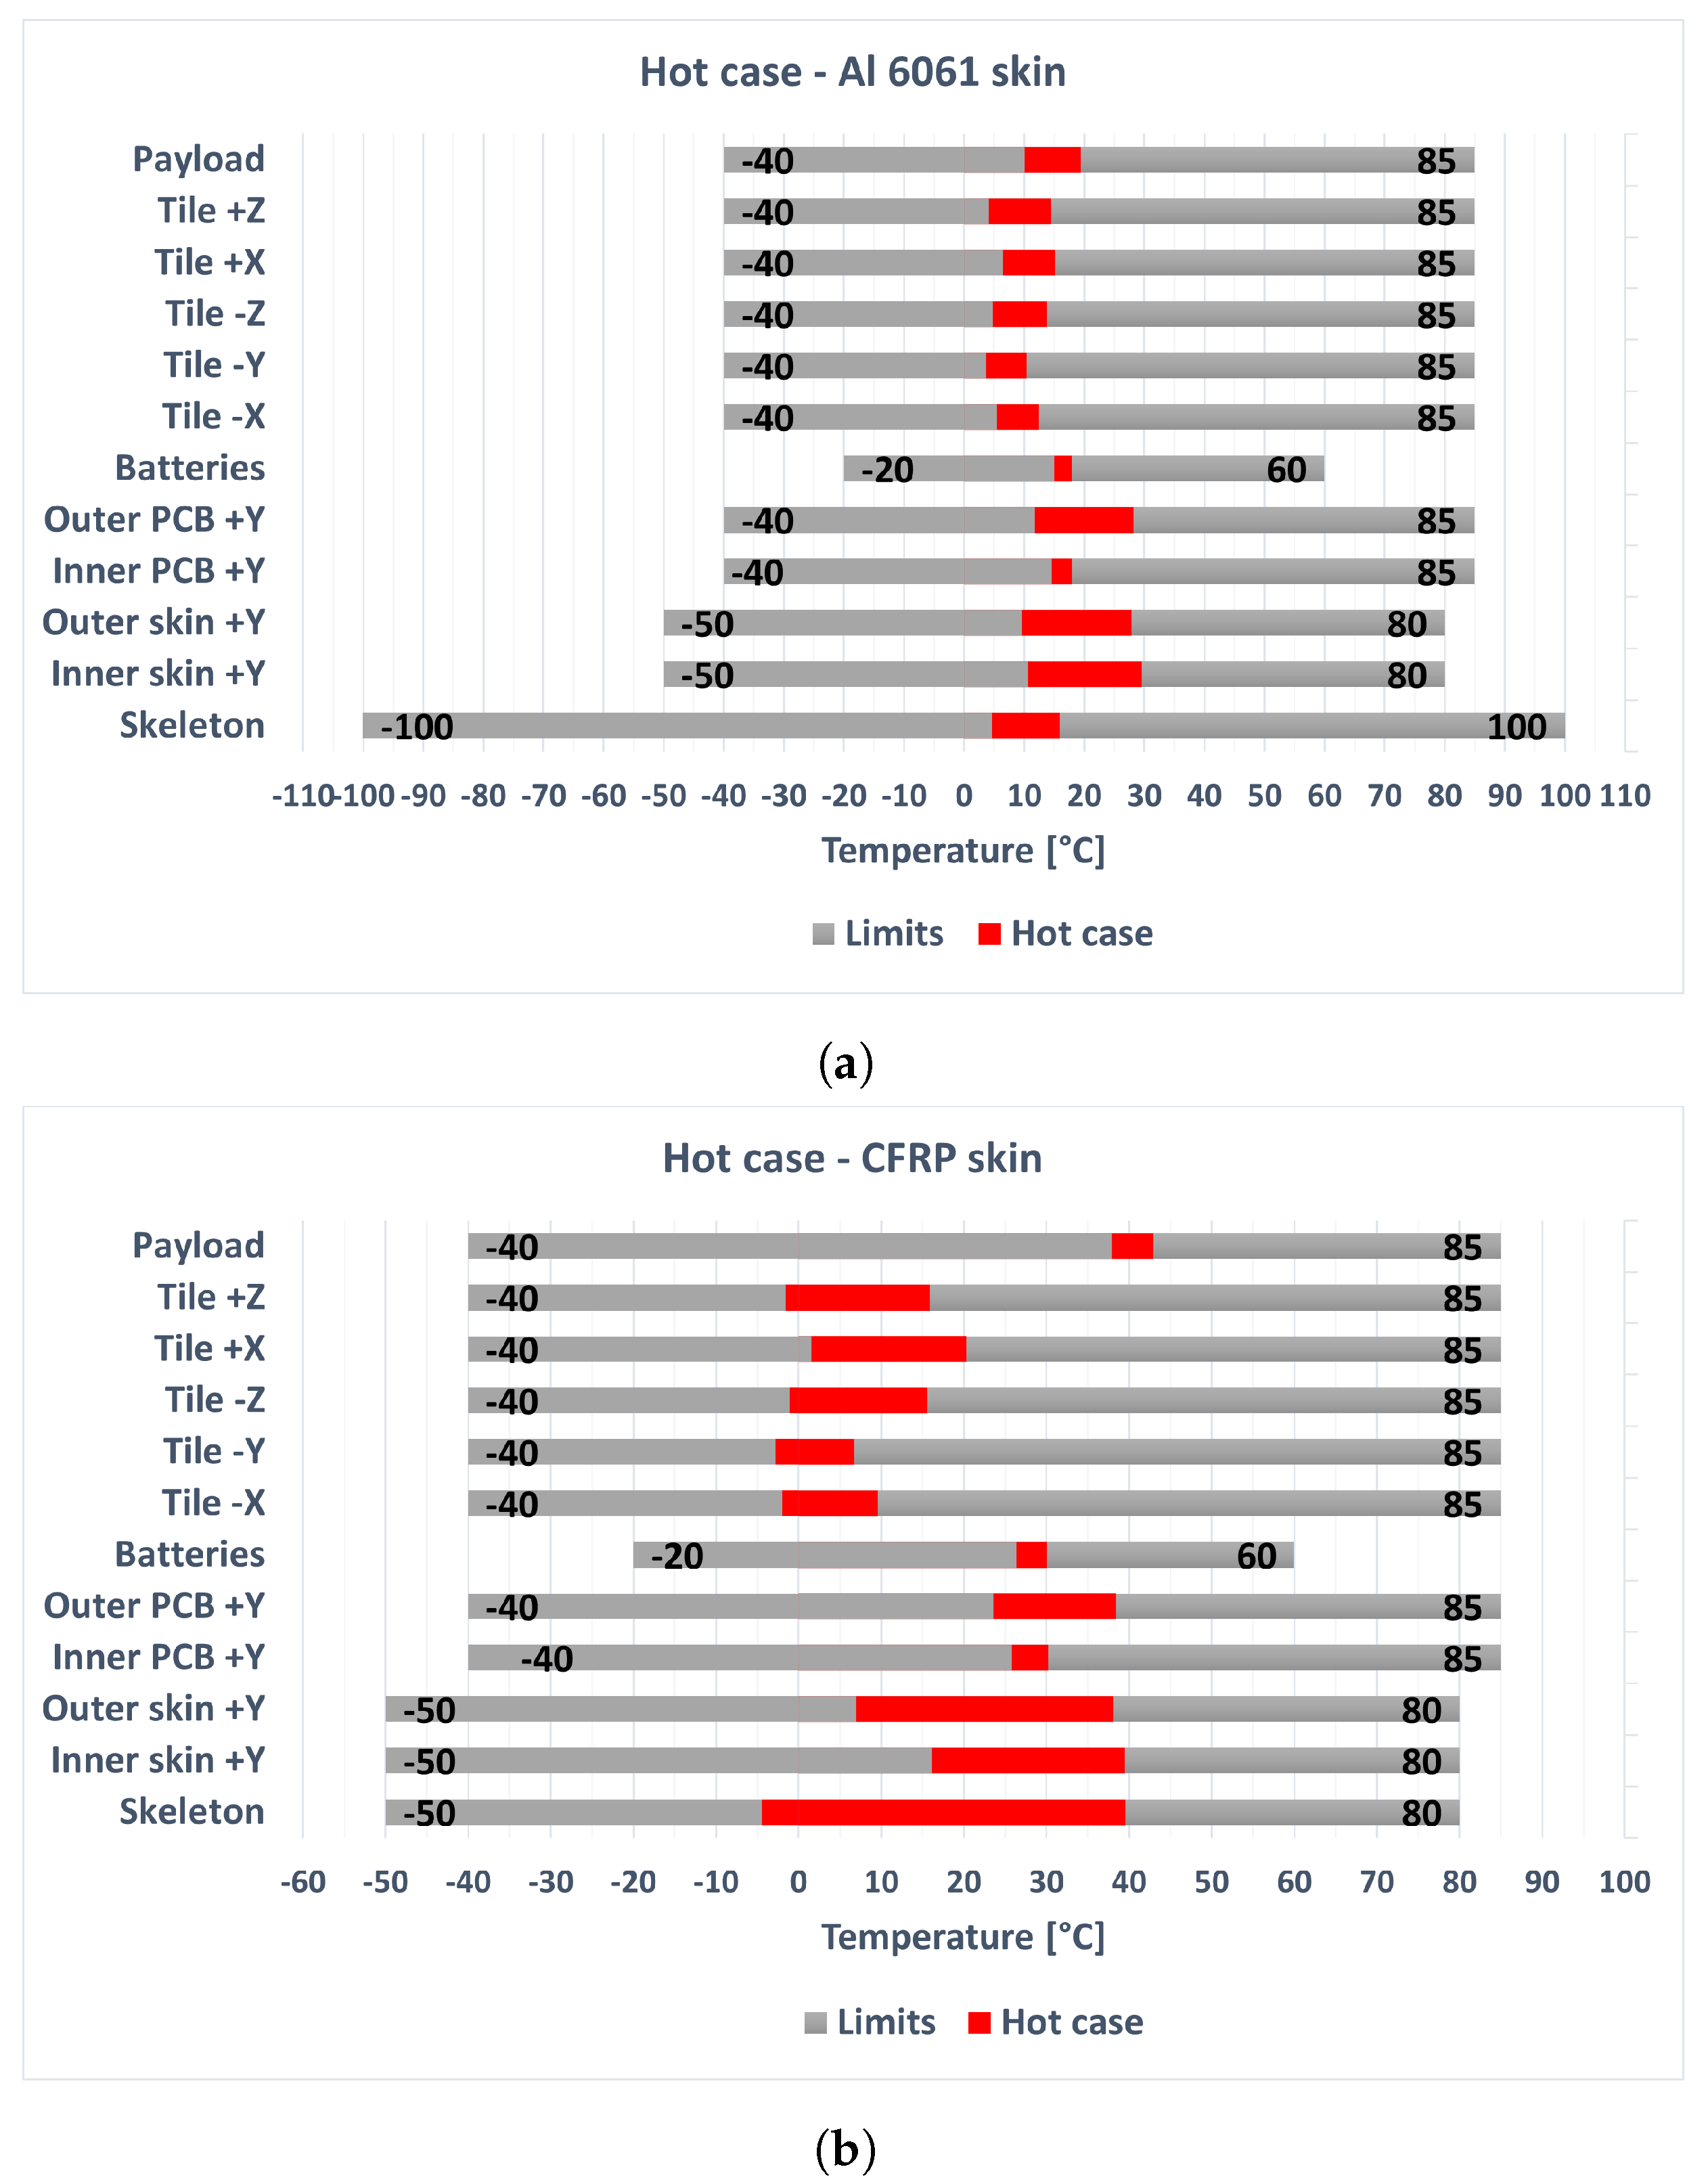
The temperature ranges for the hot cases are plotted in Figure 17, along with the allowable temperatures in gray. For the CFRP skeleton, there is an evident temperature gradient between the temperatures of the embedded battery tile components and the other tiles, with respect to the aluminum alloy skeleton case. This temperature difference is caused by the inferior thermal conductivity of CFRP, which tends to isolate the embedded battery tile, which is always facing the Sun in the hot case, from the other tiles. The maximum temperatures of the battery tile components are major than the aluminum alloy skeleton case, but remain within the allowed limits. In the CFRP case, the skeleton temperature range is considerably wider and the payload temperatures are higher.
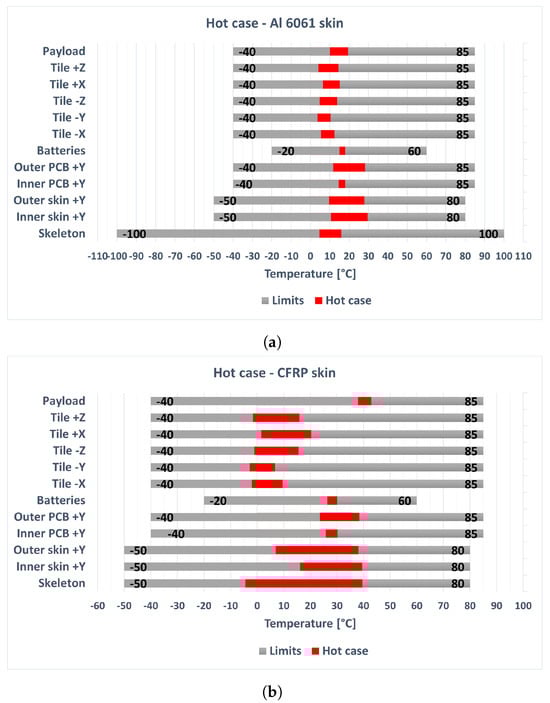
Figure 17.
Temperature ranges in the hot case (red bars) with an Al 6061 skeleton (a) and a CFRP skeleton (b). The temperatures limits are shown with gray bars. For the batteries, the discharging temperature limits are plotted.
Since the CFRP skeleton introduces strong temperature gradients in the hot case and lowered minimum temperatures in the cold case, the aluminum alloy skeleton solution is preferred, although it involves a higher structural mass.
Payload
The thermophysical and thermo-optical properties of the payload have been varied. For the thermo-optical properties, FR4 solder mask and bare aluminum have been considered (Table 3 and Table 9, respectively). Considering the differences between the temperature ranges in the two cases, bare aluminum and FR4 solder mask, it can be observed that the temperature differences are below 0.5 °C in all the components, except for the single case of the payload, where the difference for the maximum temperature in the hot case is 1.2 °C.
For the thermophysical properties, three different payload compositions are considered (Table 4), with varying percentages of aluminum 6061 (Table 3) and PCB, whose thermophysical properties are given in Table 8 and lamination is given in Table 6. The resulting temperature ranges, for hot and cold cases, have been evaluated. The temperature differences with respect to the case of 50% aluminum–50% PCB have been computed. The temperature differences are greater than in the thermo-optical properties variation case, with a maximum temperature difference of ±3.1 °C for the payload maximum temperature in the hot case.
Embedded Battery Tile Skins
The use of a high thermal conductivity CFRP for the embedded battery tile skins has been considered. The thermophysical and thermo-optical properties of the ordinary CFRP are given in Table 10. The properties of the high conductivity CFRP have been given in a private communication.
The differences in temperature ranges between the ordinary and high conductivity CFRP are listed in Table 14. It can be noticed that the effect of high conductivity CFRP significantly affects the entire temperature field, but the local effect on the inner and outer skins and the outer PCB is particularly remarkable. In particular, these components experience reduced maximum temperatures in the hot case, which is a beneficial effect. However, this beneficial effect can be obtained on the whole satellite temperature field, and not just locally on the embedded battery tile, with the application of the proper top coating on the tiles (described in the following section). Moreover, this approach avoids the employment of a particular type of CFRP that has high costs. For these reasons the use of the high conductivity CFRP in the embedded battery tile is abandoned.
Table 14.
Temperature ranges differences between the high conductivity (K) and ordinary CFRP skins cases.
Tiles Top Coating
Finally, the effect of the top coating applied to all the six tiles is investigated. The thermo-optical properties of all the top coatings are given in Table 9. In particular, two coatings are considered, one with a lower solar absorptivity (), the AZ Technology AZW-LAII, and one with a higher solar absorptivity (), the Chemglaze A276. The two coatings’ IR emissivities have a relative difference of 3.4%; thus, emissivity has a minor effect on the resulting temperature field.
The temperature ranges differences for the hot and the cold cases are indicated in Table 15. The temperature differences are between 3.7 and 9.4 °C in absolute value and all the components are significantly affected by the top coating properties. For this reason, the top coating is considered as primarily important for the passive thermal control system of the CubeSat.
Table 15.
Temperature ranges differences between the low and high solar absorptivity () top coating cases.
3.3.2. Final Configuration
With the sensitivity gained after the parametric analysis (Section 3.3.1), the adequate CubeSat final configuration can be chosen with confidence. The choice of the materials examined in the parametric analysis is made to respect the temperature limits, in the hot case and cold case.
Besides the description of the thermal model given in Section 3.2, the final CubeSat configuration is completed as follows:
- Payload: The payload is usually imposed by the mission goals and its thermal properties have an influence on the temperature field which is not negligible but not decisive either (see Section Payload). The thermophysical properties of a 50-50 payload have been chosen, that correspond to a payload made of 50% aluminum 6061 alloy and 50% PCB (Table 5). The thermo-optical properties of the PCB solder mask have been selected (Table 9).
- Skeleton: The aluminum alloy 6061 has been chosen for the skeleton (Table 3), to avoid excessive temperature gradients of the CFRP skeleton (see Section Skeleton).
- CFRP skins for the embedded battery tile: Since the high thermal conductivity CFRP has only local thermal effects and high costs (see Section Embedded Battery Tile Skins), the ordinary CFRP is selected (Table 10).
- Top coat: The tiles’ top coat is of primary importance for the passive thermal control of the whole satellite (see Section Tiles Top Coating). The AZ Technology AMJ-750-LSBU (Table 9) top coat has been chosen to achieve the suitable thermal behavior of the satellite.
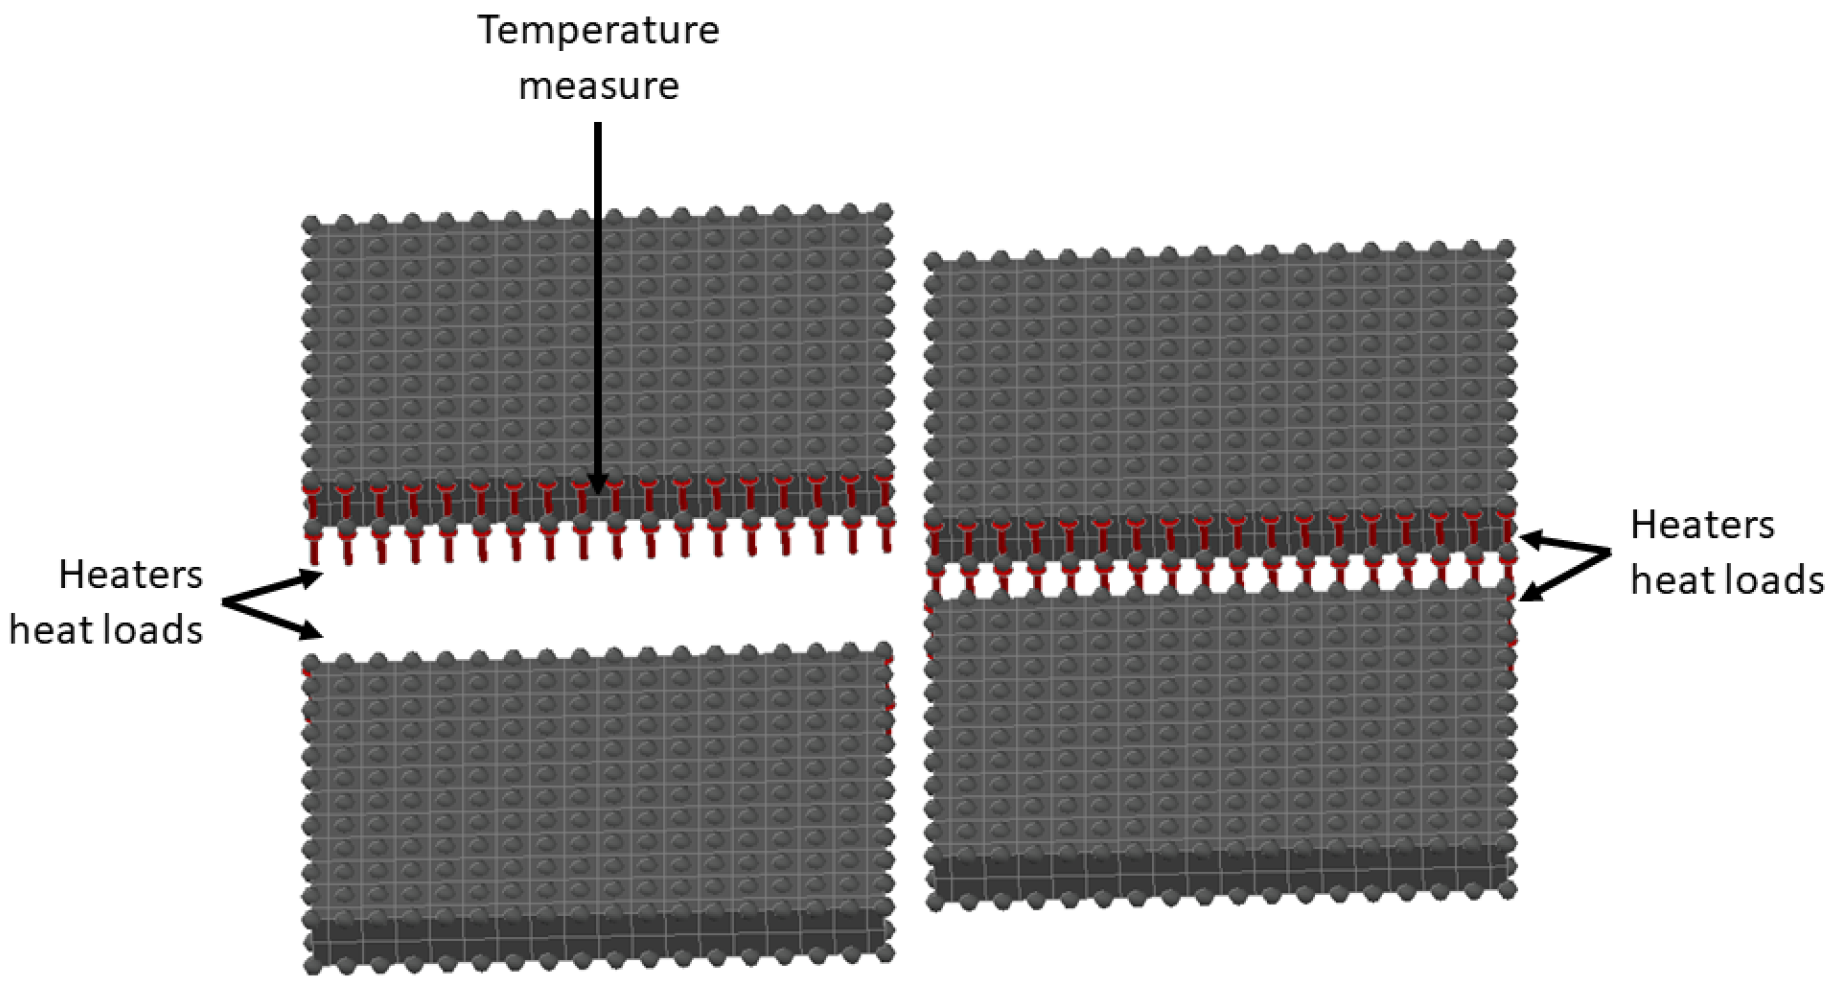
To respect the batteries temperature limits in the cold case, a heater has been placed on the sides of the batteries, as is shown in Figure 18. A bang–bang control law with a power of 3 W, applied on the nodes, has been chosen. The heater power has been chosen as the minimum thermal power needed to comply with the components allowed temperature ranges. The ON and OFF temperatures are, respectively, 10 °C and 22 °C. For simplicity, a unique temperature measure has been placed on one battery, in the geometrical center of the side interested by the heater. The heater was active for the whole duration of the orbit.

Figure 18.
Batteries’ heaters: the heat loads are represented with the red arrows.
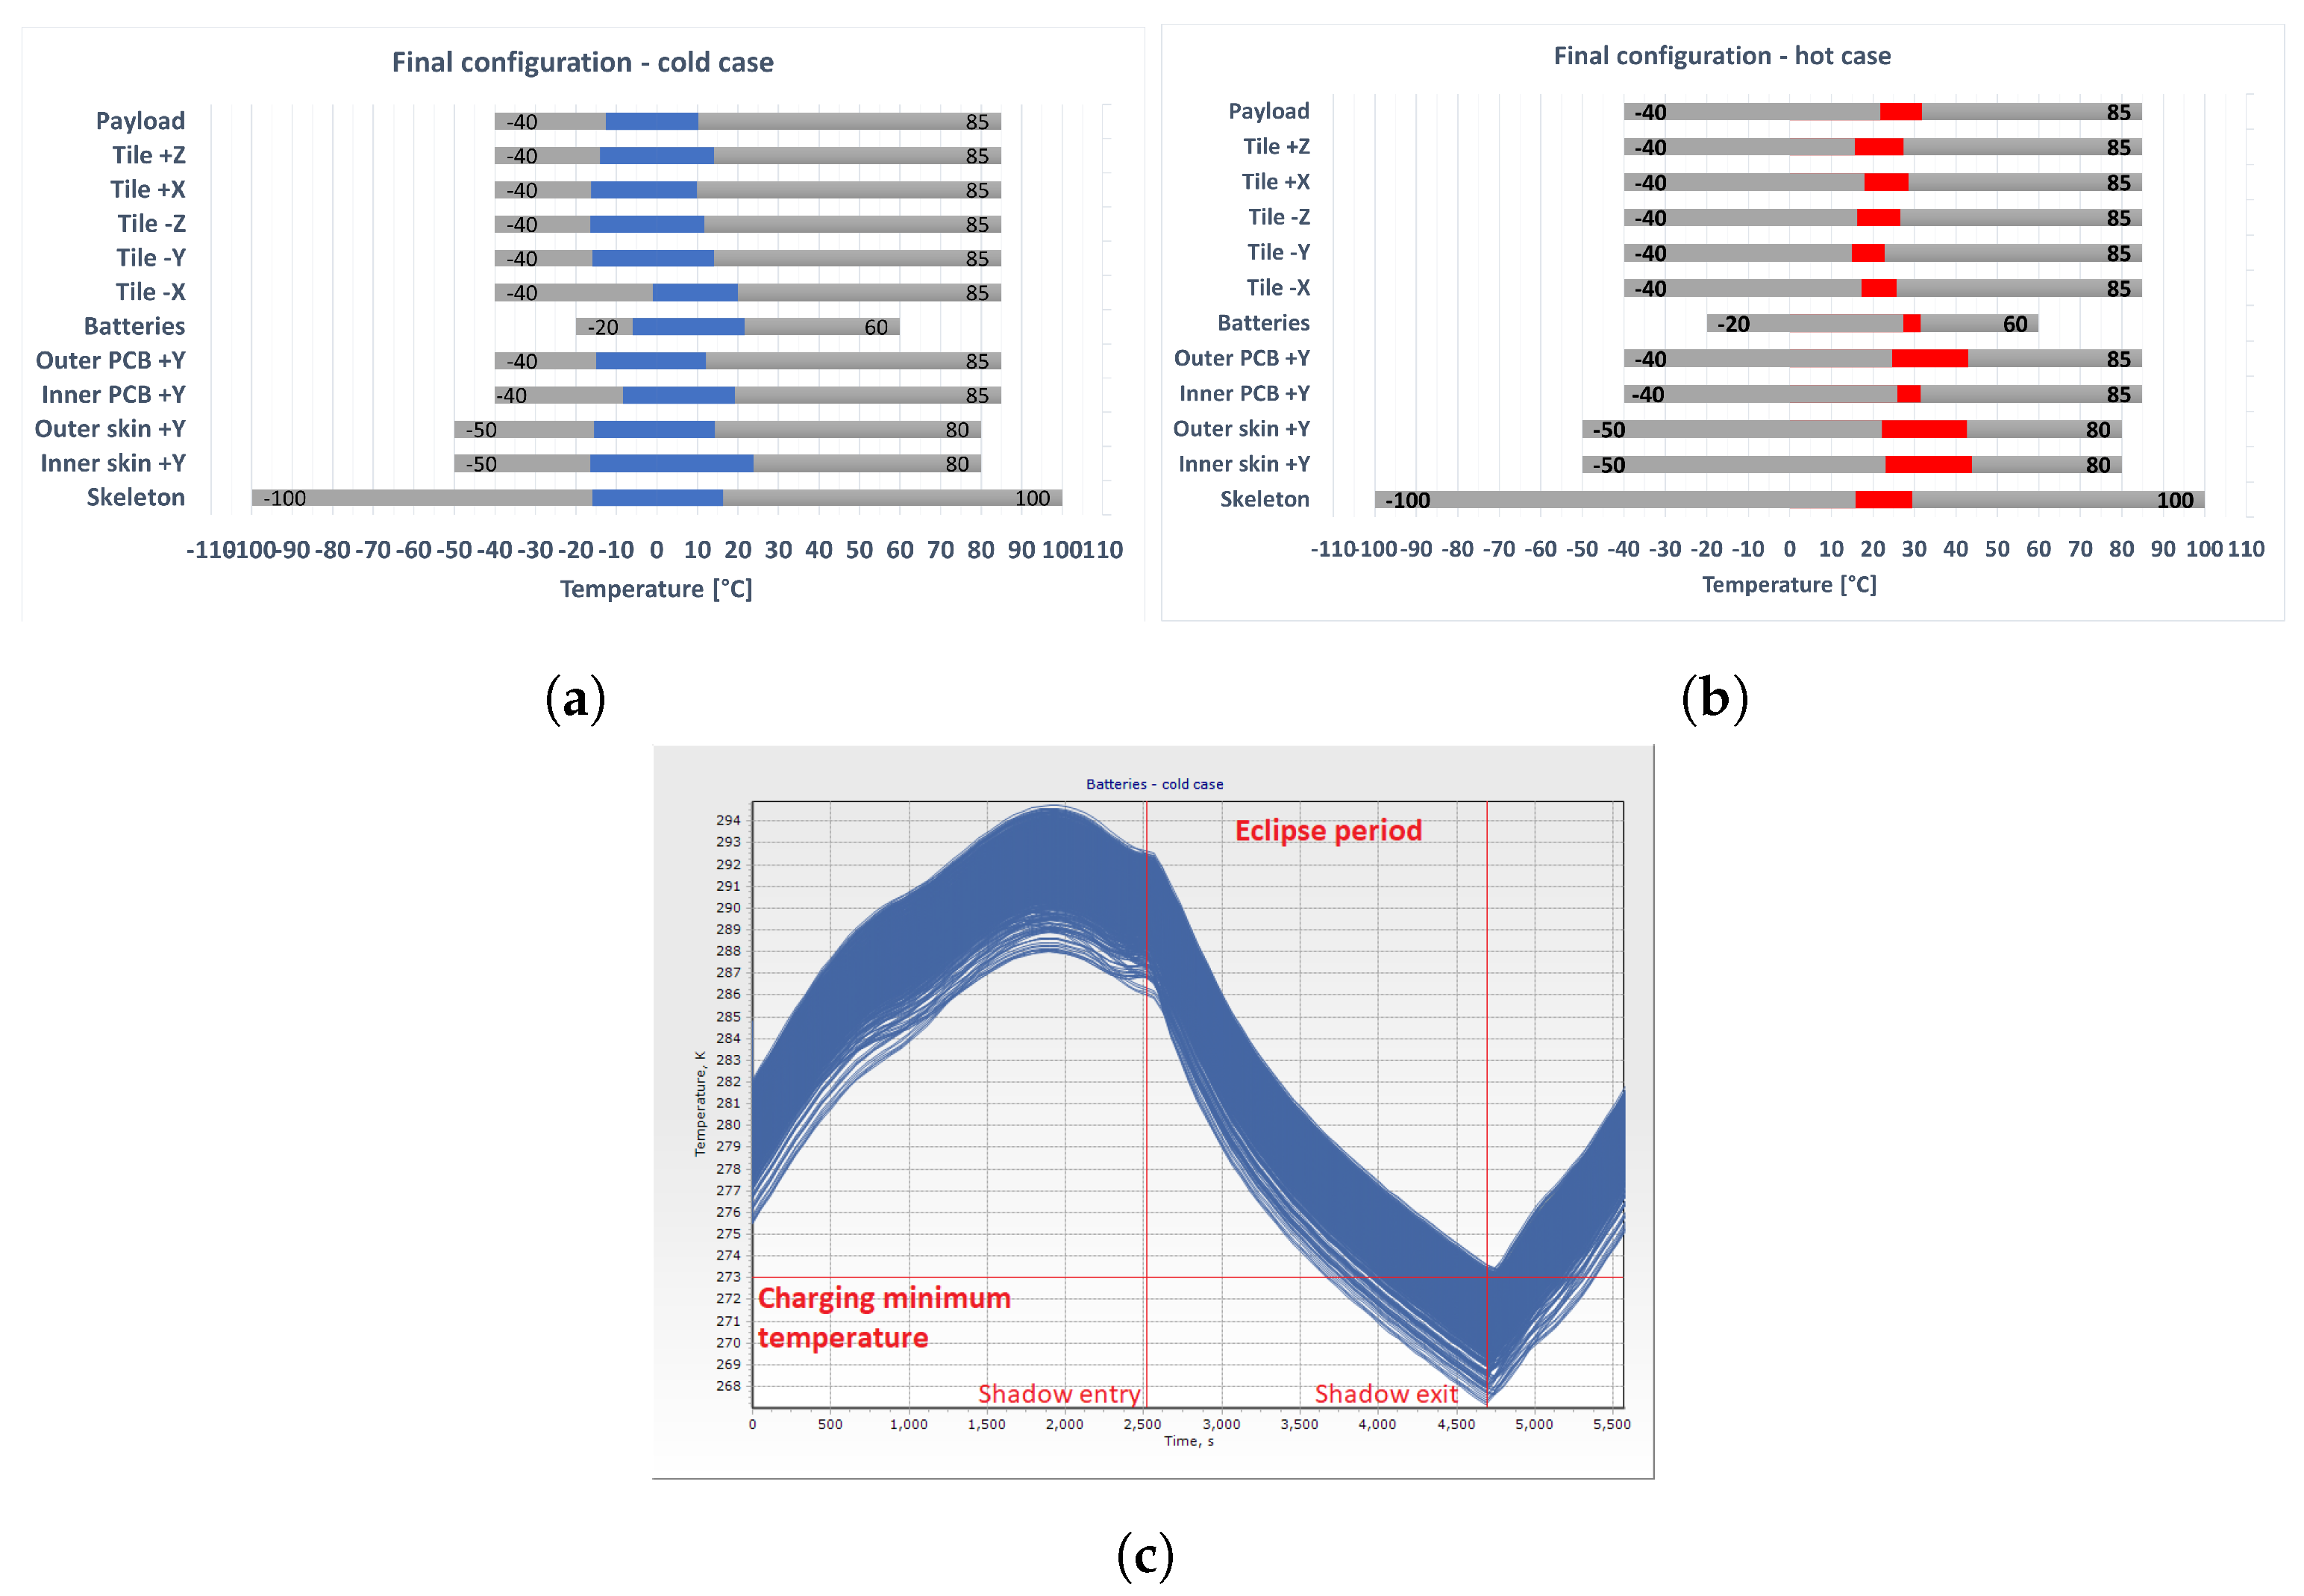
The results for the hot and the cold cases are given in Table 16. The temperature ranges for the cold case are given in Figure 19a. Figure 19c shows the batteries’ temperatures time histories. The envelope of the batteries’ temperature fields has been represented. It can be observed that the batteries’ discharging temperature limits are respected (−20 °C to 60 °C) and, when the satellite is illuminated, the batteries’ charging temperature limits are respected (0 °C to 45 °C), except for a transient moment after the orbital shadow exit, the duration of which is 708 s (i.e., 12.7% of the orbital period).
Table 16.
Temperature ranges for the final CubeSat configuration.

Figure 19.
Temperature ranges for the final configuration, with temperature limits shown in gray: (a) cold case (blue bars, batteries temperature limits are the relative to the discharging case); (b) hot case (red bars, batteries temperature limits are the relative to the discharging case); (c) envelope of the temperature time history of the batteries in the cold case. The orbital eclipse period is shown with red vertical lines. The red horizontal line shows the minimum temperature for the batteries’ charging.
The results for the hot case are shown in Figure 19b and Table 16. Since the batteries’ minimum temperature was 27.4 °C, the heater did not intervene during the orbit. The batteries could charge for the whole orbit, since their temperature range was inside the charging temperature interval of 0–45 °C.
4. Conclusions
The present work expands the previous work for ARAMIS on concentrated parameters thermal models [36]. The Thermal Desktop model introduces distributed thermal parameters, the real Low Earth Orbit (LEO) thermal environment and thermal loads and includes the thermal loads due to the batteries, supported by HPPC testing.
The thermal analyses showed that a modular tile made with CFRP and embedded batteries is feasible from the thermal point of view, since the temperature limits can be respected. The batteries are not placed in the internal bay of the CubeSat as usual; rather, they are placed on an external face. Thus, a need for heaters in the cold case has emerged. Thus, a passive thermal control system is needed, of which the most important component is the tiles top coat. Also, an active thermal control system is required, which is represented by the batteries’ heaters. Further work can be carried out on the configuration of the heater, for example, in the optimization of the temperature measure location and in the optimization of the heater power.
In conclusion, the embedded battery tile prototype has been shown to be adequate from a vibration analysis point of view [8] and from a thermal analysis point of view for LEO orbits. This represents a necessary step in supporting the validity of smart tile architectures. Validation of the simulation results with thermo-vacuum testing is considered to be another important step that will be addressed with future work.
The functionalization of structural components has been implemented with embedded spacecraft bus components. A possible research line is to investigate other multifunctional structures with lightweight, composite materials, possibly with a higher degree of integration between the structural and the functional components. These concepts can be employed to optimize the current embedded battery tile design and to conceive new kinds of smart tiles covering other CubeSat bus functions, within the ARAMIS framework.
Besides the ARAMIS project, multifunctional structures can be employed in the design of new pico- and nanosatellites, including CubeSats, and in the design of innovative, multifunctional aeronautical structures [37].
Author Contributions
Conceptualization, E.C., G.C. and L.R.; methodology, E.C., G.C. and L.R.; software, F.V., G.C. and L.R.; validation, E.C. and L.R.; formal analysis, E.C., F.V., G.C. and L.R.; investigation, E.C., F.V., G.C. and L.R.; resources, E.C. and L.R.; data curation, E.C., F.V., G.C. and L.R.; writing—original draft preparation, G.C.; writing—review and editing, E.C. and G.C.; visualization, E.C., F.V., G.C. and L.R.; supervision, E.C. and L.R.; project administration, E.C. and L.R. All authors have read and agreed to the published version of the manuscript.
Funding
This research received no external funding.
Data Availability Statement
The raw data supporting the conclusions of this article will be made available by the authors on request.
Acknowledgments
The authors would like to thank Giulio Romeo for his support and advice.
Conflicts of Interest
The authors declare no conflicts of interest.
References
- Heidt, H.; Puig-Suari, J.; Moore, A.; Nakasuka, S.; Twiggs, R. CubeSat: A new Generation of Picosatellite for Education and Industry Low-Cost Space Experimentation. In Proceedings of the 14th Annual/USU Conference on Small Satellites, Logan, UT, USA, 21–24 August 2000. [Google Scholar]
- Nanosats Database. Available online: https://www.nanosats.eu/ (accessed on 10 July 2024).
- Areda, E.; Cordova-Alarcon, J.; Masui, H.; Cho, M. Development of Innovative CubeSat Platform for Mass Production. Aerospace 2022, 12, 9087. [Google Scholar] [CrossRef]
- Asp, L.E.; Johansson, M.; Lindbergh, G.; Xu, J.; Zenkert, D. Structural battery composites: A review. Funct. Compos. Struct. 2019, 1, 042001. [Google Scholar] [CrossRef]
- Thomas, J.P.; Qidway, M.A.; Pogue, W.R., III; Rohatgi, A. Multifunctional structure-battery composites for marine systems. J. Compos. Mater. 2013, 47, 5–26. [Google Scholar] [CrossRef]
- Speretta, S.; Reyneri, L.M.; Sansoé, C.; Tranchero, M.; Passerone, C.; Del Corso, D. Modular architecture for satellites. In Proceedings of the 58th International Astronautical Congress, Hyderabad, India, 24–28 September 2007. [Google Scholar]
- Adam, T.J.; Liao, G.; Petersen, J.; Geier, S.; Finke, B.; Wierach, P.; Kwade, A.; Wiedemann, M. Multifunctional composites for future energy storage in aerospace structures. Energies 2018, 11, 335. [Google Scholar] [CrossRef]
- Capovilla, G.; Cestino, E.; Reyneri, L. Modular Multifunctional Composite Structure for CubeSat Applications: Embedded Battery Prototype Modal Analysis. Aerospace 2023, 10, 1009. [Google Scholar] [CrossRef]
- Arianespace. Vega User’s Manual, Issue 4 Revision 0. 2014. Available online: https://newspaceeconomy.ca/wp-content/uploads/2022/06/vega-users-manual_issue-04_april-2014.pdf (accessed on 2 February 2025).
- Arianespace. Ariane 6 User’s Manual, Issue 2 Revision 0. 2021. Available online: https://www.arianespace.com/wp-content/uploads/2021/03/Mua-6_Issue-2_Revision-0_March-2021.pdf (accessed on 5 November 2023).
- SpaceX. Falcon User’s Guide. 2021. Available online: https://www.spacex.com/media/falcon-users-guide-2021-09.pdf (accessed on 5 November 2023).
- Plett, G.L. Battery Modeling, 1st ed.; Volume 1: Battery Management Systems; Artech House: Boston, MA, USA, 2015. [Google Scholar]
- ECE4710/5710: Modeling, Simulation, and Identification of Battery Dynamics Course Notes by G. L. Plett. Available online: http://mocha-java.uccs.edu/ECE5710/index.html (accessed on 9 August 2024).
- Rahmoun, A.; Biechl, H. Modeling of Li-ion batteries using equivalent circuit diagrams. Prz. Elektrotech. 2012, 88, 152–156. [Google Scholar]
- LiPol. LP452540 Battery Datasheet. June 2019. Available online: https://www.lipolbattery.it/ (accessed on 2 February 2025).
- Neware Technology Limited. Battery Testing System User Manual, Version 1.0. 2013. Available online: https://newarebattery.com/wp-content/uploads/2019/05/BTS4000-User-Manual.pdf (accessed on 21 November 2024).
- Bateau-Meyer, S.; L’Eplattenier, P.; Deng, J.; Zhu, M.; Bae, C.; Miller, T. Randles Circuit Parameters Set Up for Battery Simulations in LS-DYNA®. In Proceedings of the 15th International LS-DYNA® Users Conference, Detroit, MI, USA, 10–12 June 2018. [Google Scholar]
- Ortiz Longo, C.R.; Rickman, S.L. Method for the Calculation of Spacecraft Umbra and Penumbra Shadow Terminator Points. NASA Technical Paper 3547, April 1995. Available online: https://ntrs.nasa.gov/citations/19950023025 (accessed on 3 December 2024).
- Capovilla, G. Development of Next Generation Multifunctional Composite Structures for CubeSats, Pico- and Nanosatellites. Ph.D. Thesis, Politecnico di Torino, Torino, Italy, September 2022. [Google Scholar]
- Kearney, M.-A. A Thermal Simulation Tool for CubeSats for Dynamic in-Orbit Scenarios, Verified with Flight Data from the nSight-1 Mission. Master Thesis, Stellenbosch University, Stellenbosch, South Africa, March 2020. Available online: https://scholar.sun.ac.za/bitstream/handle/10019.1/108309/kearney_thermal_2020.pdf?sequence=2&isAllowed=y (accessed on 25 December 2024).
- The CubeSat Program. CubeSat Design Specification Rev. 13. California Polytechnic State University, February 2014, San Luis Obispo. Available online: https://static1.squarespace.com/static/5418c831e4b0fa4ecac1bacd/t/56e9b62337013b6c063a655a/1458157095454/cds_rev13_final2.pdf (accessed on 25 December 2024).
- Çengel, Y.A. Termodinamica e Trasmissione Del Calore, 3rd ed.; McGraw-Hill: Milan, Italy, 2009; ISBN 978-88-38-66514-1. [Google Scholar]
- Joven, R.; Das, R.; Ahmed, A.; Roozbehjavan, P.; Minaie, B. Thermal properties of carbon fiber/epoxy composites with different fabric weaves. In Proceedings of the SAMPE International Symposium Proceedings, Charleston, SC, USA, 22–25 October 2012. [Google Scholar]
- PC/104 Embedded Consortium. PC/104 Specification Version 2.6. Published Online, October 2008. Available online: https://pc104.org/wp-content/uploads/2015/02/PC104_Spec_v2_6.pdf (accessed on 25 December 2022).
- Azar, K.; Graebner, J.E. Experimental Determination of Thermal Conductivity of Printed Wiring Boards. In Proceedings of the Twelfth IEEE SEMI-THERM Symposium, Austin, TX, USA, 5–7 March 1996; pp. 169–182. [Google Scholar] [CrossRef]
- Northwest Engineering. FR4 Thermal Properties to Consider During Design. Available online: https://www.nwengineeringllc.com/article/fr4-thermal-properties-to-consider-during-design.php (accessed on 2 February 2025).
- Rogers Corporation. RO3000 Series Circuit Materials. Available online: https://www.rogerscorp.cn/-/media/project/rogerscorp/documents/advanced-electronics-solutions/english/data-sheets/ro3000-laminate-data-sheet-ro3003----ro3006----ro3010----ro3035.pdf (accessed on 2 February 2025).
- Anvari, A.; Farhani, F.; Niaki, K.S. Comparative Study on Space Qualified Paints Used for Thermal Control of a Small Satellite. Iran. J. Chem. Eng. 2009, 6, 50–62. [Google Scholar]
- AZ Technology. Summary of AZ Technology Paints. Available online: https://www.aztechnology.com/products/paints.html (accessed on 2 February 2025).
- Campanudo Carvalhais, D. Thermal Modelling and Experiments for Small Satellites. Master’s Thesis, Universidade de Beira Interior, Covilhã, Portugal, December 2019. [Google Scholar]
- Rodrı’guez Gallegos, C.D.; Alvarez Alvarado, M.S. Analysis of the Stationary and Transient Behavior of a Photovoltaic Solar Array: Modeling and Simulation. Int. J. Comput. Appl. Technol. 2015, 127, 26–33. [Google Scholar]
- Redmond, M.; Mastropietro, A.J. Thermophysical and Optical Properties of Materials Considered for use on the LDSD Test Vehicle. In Proceedings of the 45th International Conference on Environmental Systems ICES-2015-24, Bellevue, WA, USA, 12–16 July 2015. [Google Scholar]
- Maleki, H.; Wang, H.; Porter, W.; Hallmark, J. Li-Ion polymer cells thermal property changes as a function of cycle-life. J. Power Sources 2014, 263, 223–230. [Google Scholar] [CrossRef]
- Mathewson, S. Experimental Measurements of LiFePO4 Battery Thermal Characteristics. Master’s Thesis, University of Waterloo, Waterloo, ON, Canada, 2014. [Google Scholar]
- Janson, S.W.; Welle, R.P.; Rose, T.S.; Rowen, D.W.; Hinkley, D.A.; Hardy, B.S.; La Lumondiere, S.D.; Maul, G.A.; Werner, N.I. The NASA Optical Communication and Sensors Demonstration program: Preflight up-date. In Proceedings of the 29th AIAA Conference on Small Satellites, Logan, UT, USA, 8–13 August 2015. [Google Scholar]
- Ali, A.; Ullah, K.; Ur Rehman, H.; Bari, I.; Reyneri, L.M. Thermal characterisation analysis and modelling techniques for CubeSat-sized spacecrafts. Aeronaut. J. 2017, 121, 1858–1878. [Google Scholar] [CrossRef]
- Correa, G.; Santarelli, M.; Borello, F.; Cestino, E.; Romeo, G. Flight test validation of the dynamic model of a fuel cell system for ultra-light aircraft. Proc. Inst. Mech. Eng. G J. Aerosp. Eng. 2014, 229, 917–932. [Google Scholar] [CrossRef]

Disclaimer/Publisher’s Note: The statements, opinions and data contained in all publications are solely those of the individual author(s) and contributor(s) and not of MDPI and/or the editor(s). MDPI and/or the editor(s) disclaim responsibility for any injury to people or property resulting from any ideas, methods, instructions or products referred to in the content. |
© 2025 by the authors. Licensee MDPI, Basel, Switzerland. This article is an open access article distributed under the terms and conditions of the Creative Commons Attribution (CC BY) license (https://creativecommons.org/licenses/by/4.0/).