Abstract
The proliferation of electronic goods manufacturing and the subsequent rise in electronic waste (e-waste) generation necessitate the establishment of efficient Waste of Electrical and Electronic Equipment (WEEE) reverse logistics systems, fostering collaborative efforts among manufacturers, retailers, and government agencies. Given its importance, this theme has received considerable attention in recent literature. This study focused on investigating the relationships between socio-spatial characteristics and the distribution of WEEE collection points in the city of São Paulo, Brazil. To this end, data mining (DM) techniques were applied to generate rules representing knowledge that explains the relationship among the considered variables. The results achieved (accuracy 81.25% and Kappa statistic 74.71%), indicating consistent patterns, demonstrate the potential of the proposed approach to aid WEEE reverse chain management. From a practical point of view, the knowledge produced is an important support for decision-making on the installation of new collection points, considering the socio-spatial characteristics of the target locations. In addition, this research contributes to the responsible management of solid waste recommended by the Brazilian National Solid Waste Policy (NSWP), as well as to the advancement of the United Nations’ Sustainable Development Goals (UN SDGs), particularly SDG 11 (Sustainable Cities and Communities) and SDG 12 (Responsible Consumption and Production), by fostering sustainable practices in waste management and resource utilization within urban contexts.
1. Introduction
The accelerated pace of technological development has been accompanied by the proliferation of electronic devices of various kinds. Computers, mobile phones, household appliances, entertainment devices, and other innovations have become indispensable in people’s lives, elevating the production and consumption of electronic goods to unprecedented levels and exponentially increasing the volume of waste electrical and electronic equipment (WEEE) [1].
Oliveira Neto et al. [2] concluded that the accumulation of WEEE represents one of the greatest environmental and health challenges of our time. Unlike other solid waste, electronic waste contains a vast array of potentially hazardous materials, including heavy metals such as lead, mercury, and cadmium, which can contaminate soil and water resources. Moreover, the improper decomposition of electronic components releases toxic substances into the environment, affecting the health of local populations and contributing to environmental degradation.
Gaur et al. [3] further warn of the urgent need for effective management of these wastes, considering the negative impact of toxic substances and heavy metals. Oliveira Neto et al. [4] mention that many of these devices contain valuable materials, such as gold, silver, copper, and platinum, which could be recovered and reinserted into the production chain through appropriate recycling processes. In this sense, effective management of WEEE emerges not only as a matter of environmental protection but also as a significant economic opportunity within the framework of the circular economy.
In this context, reverse logistics—which seeks to enable the return of waste to the production cycle for reuse, recycling, or proper disposal—has become a fundamental tool in the search for solutions to the electronic waste crisis. However, the implementation of reverse logistics systems faces a series of challenges, especially in densely populated metropolitan regions characterized by socio-spatial inequalities. These disparities hinder adequate access to WEEE collection services, particularly in the most vulnerable regions [5].
In Brazil, where the phenomenon of rapid and uneven urban growth is evident, cities like São Paulo provide a complex and revealing setting for study. With over 12 million inhabitants, São Paulo is characterized by significant economic and social diversity, which directly influences the organization of urban space and the challenges related to waste management. The city features a complex urban landscape in which high-income neighborhoods with well-established infrastructure coexist with densely populated and underserved areas that face limited access to basic services, including solid waste collection and environmental initiatives. This heterogeneity raises important socio-spatial patterns that may influence the availability and accessibility of WEEE collection points. Furthermore, the availability of public data for the city of São Paulo, combined with its strategic importance as Brazil’s largest economic hub, provides favorable conditions for in-depth, data-driven analyses that can inform the development of both local and national public policies. These characteristics reinforce São Paulo’s suitability as a case study for investigating how socio-spatial variables affect the implementation of electronic waste reverse logistics systems.
The National Solid Waste Policy (PNRS), established in Brazil in 2010, sets a regulatory framework aimed at promoting integrated management and environmentally appropriate handling of solid waste, including WEEE. Despite the advances promoted by legislation, such as the creation of ecopoints and selective collection systems, it is not known for sure whether the geographic distribution of WEEE collection points in the city of São Paulo is influenced by the economic and social conditions of the regions served. Widanapathirana et al. [6] mention that large metropolises, central regions, and higher-income areas tend to concentrate a more robust collection and recycling infrastructure, while peripheral areas, which often house more vulnerable populations, lack adequate access to these services.
Therefore, a more detailed examination of the socio-spatial dynamics influencing WEEE collection infrastructure is both necessary and enriching for the development of equitable and effective reverse logistics systems.
Published articles on the subject generally address the optimization of the reverse logistics network for Waste Electrical and Electronic Equipment (WEEE), but they do not apply computational techniques to investigate the influence of socio-spatial characteristics on the distribution of WEEE collection points. In this context, some studies have applied mixed-integer linear programming for the optimization of the collection network [7,8,9,10,11,12,13,14,15,16]. Some works have used multi-criteria linear programming to identify the optimal location for installing waste recycling facilities [17,18,19]. There are also studies that have utilized discrete event simulation to optimize the WEEE transport network [20,21], works that have applied linear and nonlinear optimization methods to minimize the total cost of the WEEE recycling network [22], and studies that have employed stochastic programming to minimize demand uncertainties for WEEE recycling by third-party recyclers to maximize profit [23]. Finally, research applying metaheuristic methods and machine learning in reverse logistics optimization tasks for WEEE can also be cited, as in the works [4,24,25,26,27,28].
As can be observed, there is a lack of studies aiming to investigate the relationships between socio-spatial characteristics and the distribution of WEEE collection points, which is important for several reasons. Understanding how these characteristics influence the location of WEEE collection points in a megacity like São Paulo can help identify areas with higher waste generation and, consequently, direct efforts to implement more effective collection policies in these regions. Moreover, analyzing these relationships allows the identification of spatial patterns that may indicate socioeconomic or environmental inequalities in the distribution of WEEE collection points, which is essential for promoting environmental and social justice. Finally, comprehending these relationships can support the planning of recycling companies, aiming at developing more sustainable and equitable strategies for electronic waste management in the city of São Paulo and other locations.
Based on the above, this study aims to answer the following research questions: What patterns can be identified in the relationships between socioeconomic variables, such as income and education level, and the availability of WEEE collection points? Are there inequalities in access to WEEE collection points in different regions of the city, especially in areas of greater social vulnerability? How can the generated knowledge be used to optimize the installation of new WEEE collection points?
The present study aims to investigate the relationships between the socio-spatial characteristics of the city of São Paulo, Brazil, and the distribution of WEEE collection points, with the intent of generating scientific knowledge that allows us to answer the research questions and align with the United Nations’ Sustainable Development Goals (UN SDGs). To this end, data mining (DM) techniques were employed to analyze a set of public data about the city of São Paulo, including locations of WEEE collection points; locations of other solid waste collection points (ecopoints), such as for small volumes of rubble, pruning waste, used furniture, and recyclable materials such as paper, plastic, glass, and metal; population data; and human development indices related to education and income. Specifically, machine learning algorithms such as decision trees (DT) and the Apriori algorithm were utilized to generate association rules representing patterns that help explain the relationships between socio-spatial variables and the city’s WEEE collection infrastructure.
2. Systematic Literature Review
The literature highlights the importance of collaboration among government, the private sector, and consumers for effective e-waste management. Studies such as those by Oliveira Neto et al. [4] and Jaiswal and Mukti [1] emphasize the need for integrated policies involving different social actors, aiming to optimize reverse logistics and achieve more efficient electronic waste management. The latter study underscores the critical role of involving multiple stakeholders to overcome challenges associated with disposal and recovery of valuable materials. Similarly, studies by Gaur et al. [3] reinforce the relevance of sustainable management practices as part of a broader approach to achieve the UN SDGs, noting that isolated actions are insufficient to mitigate the environmental impact of electronic waste. In this regard, Liao et al. [29] proposed a collaborative network for reverse logistics focusing on carbon neutrality, highlighting logistical efficiency and environmental sustainability. Additionally, Nikou and Sardianou [5] address the need for collaboration in implementing policies that promote equity in access to WEEE collection points and e-waste recycling, especially in vulnerable urban areas. These contributions demonstrate how collaborative approaches and robust regulations are essential for structuring an effective reverse logistics system [30,31].
The application of modeling, artificial intelligence (AI), and data analysis has been widely discussed as a central strategy to optimize e-waste reverse logistics. Oliveira Neto et al. [4] demonstrate the potential of AI in simulating scenarios and optimizing transportation routes and allocation of WEEE collection points, enhancing the operational efficiency of the waste collection system. This use of AI allows for pattern identification and demand forecasting, facilitating more strategic resource management. Other studies, such as those by Weng et al. [32] and Koshta et al. [33], explore spatiotemporal modeling and allocation methods to improve electronic waste collection, offering valuable insights on how to optimize reverse logistics. Moreover, Correia [34] and Doan et al. [35] present network optimization approaches that are effective in high-density urban scenarios, where transportation and collection efficiency is crucial. Additionally, Shevchenko et al. [36] propose an intelligent e-waste system, integrating the supply chain with real-time data to manage and predict electronic waste flows more efficiently. The use of these technologies enables precise data analysis and more effective planning for e-waste collection and recycling systems [37].
Public awareness and consumer behavior play a decisive role in the success of e-waste collection initiatives. Nowakowski et al. [38] and Mohamad et al. [39] discuss how the accessibility of WEEE collection points and social behavior directly influence recycling participation rates. These studies suggest that environmental education campaigns, coupled with financial incentives, can increase public engagement, promoting more effective e-waste collection and recycling. Other works, such as those by Shi et al. [40] and Gautam and Bolia [41], corroborate the idea that financial incentives can be decisive in engaging the population, especially in areas where e-waste collection is still limited. Additionally, Liu et al. [42] and Jangre et al. [43] address the socioeconomic barriers that affect consumer behavior, highlighting the importance of planning that takes into account inequalities in access to these services in vulnerable regions. The study by Oliveira Neto et al. [4], by quantifying and characterizing WEEE disposal in a middle-class region in Brazil, offers insights into consumption and disposal habits, revealing that obsolescence and failures are the main reasons for disposal, which emphasizes the need for an integrated approach to the collection and recycling of these materials.
The transition to a circular economy is often cited as a solution for e-waste management. Studies such as those by Ghisellini et al. [44] suggest that incorporating circular economy practices into electronic waste management significantly contributes to reducing its environmental impact by promoting the extension of product life cycles. Remanufacturing and refurbishing of electronic components are highlighted by Brito et al. [45] and Guo and Zhong [46] as fundamental strategies to reduce waste volume and preserve resources. Additionally, Wang and Li [47] explore the optimization of reverse logistics network design for the e-waste value chain, emphasizing the importance of sustainable and efficient configurations. Safdar et al. [48] and Duman and Kongar [49] suggest that integrating Environmental, Social, and Governance (ESG) practices is essential to strengthen the value chain and ensure the sustainability of waste management.
Despite the significant contributions of the reviewed studies to understanding the challenges and solutions in electronic waste management, especially regarding multisectoral collaboration, the use of AI, and the promotion of circular economy practices, these works do not address the distribution of WEEE collection points in a large metropolis like São Paulo. The reviewed literature, although it broadly discusses the need for reverse chain optimization and consumer behavior, lacks analyses that detail the relationships between socio-spatial variables and the electronic waste collection infrastructure using methodologies such as data mining. Thus, the use of techniques like decision trees and the Apriori algorithm for rule generation represents an original methodological contribution, proposing a structured and interpretable way to explain how socioeconomic and geographical variables impact the distribution of WEEE collection points. By employing these advanced data analysis techniques to explore specific patterns in the city of São Paulo, the present study offers insights that go beyond the conventional analyses presented in the literature. In this sense, the study aims to provide a comprehensive view of the factors that influence the distribution of WEEE collection infrastructure in densely populated and socially diverse urban areas like São Paulo, bringing valuable contributions to the development of public policies and urban planning strategies focused on sustainability and socio-spatial equity.
3. Materials and Methods
This study builds a systematic literature review to frame the investigated field and support the development and findings of our approach. Thus, in this section we first present the procedures used to conduct the literature review. Next, we present the characterization of the city of São Paulo, which represents the spatial scope of this study. Finally, we present the procedures for data collection and analysis.
3.1. Procedures for Conducting the Literature Review
The literature review was conducted based on the PRISMA (Preferred Reporting Items for Systematic Reviews and Meta-Analyses) methodology developed by Moher et al. [50]. This approach encompasses four main stages—identification, screening, eligibility, and inclusion—structured through a diagram that ensures a rigorous analysis of bibliographic sources, with clearly defined inclusion and exclusion criteria.
The adoption of the PRISMA methodology in this study reinforces the rigor, transparency, and replicability of the systematic literature review, ensuring that the 26 selected articles were filtered based on methodological quality and relevance to the research focus on the addressed issue. Recognized internationally for its structured and comprehensive approach, PRISMA offers advantages over other methods—such as Cochrane or Scoping Reviews—by minimizing bias, enhancing reproducibility, and aligning well with studies that analyze complex, multidimensional data [50].
A search string was formulated from a set of keywords, as shown in Table 1. The search was performed within the titles, abstracts, and keywords of the following databases: Scopus, Compendex, and Web of Science. These databases provide access to the latest scientific and technological innovations, identify key academic references, and ensure that the research is supported by accurate, complete, and high-quality data, aligning with the state of the art in the topic investigated in this work.

Table 1.
Set of keywords and search string used to conduct the literature review.
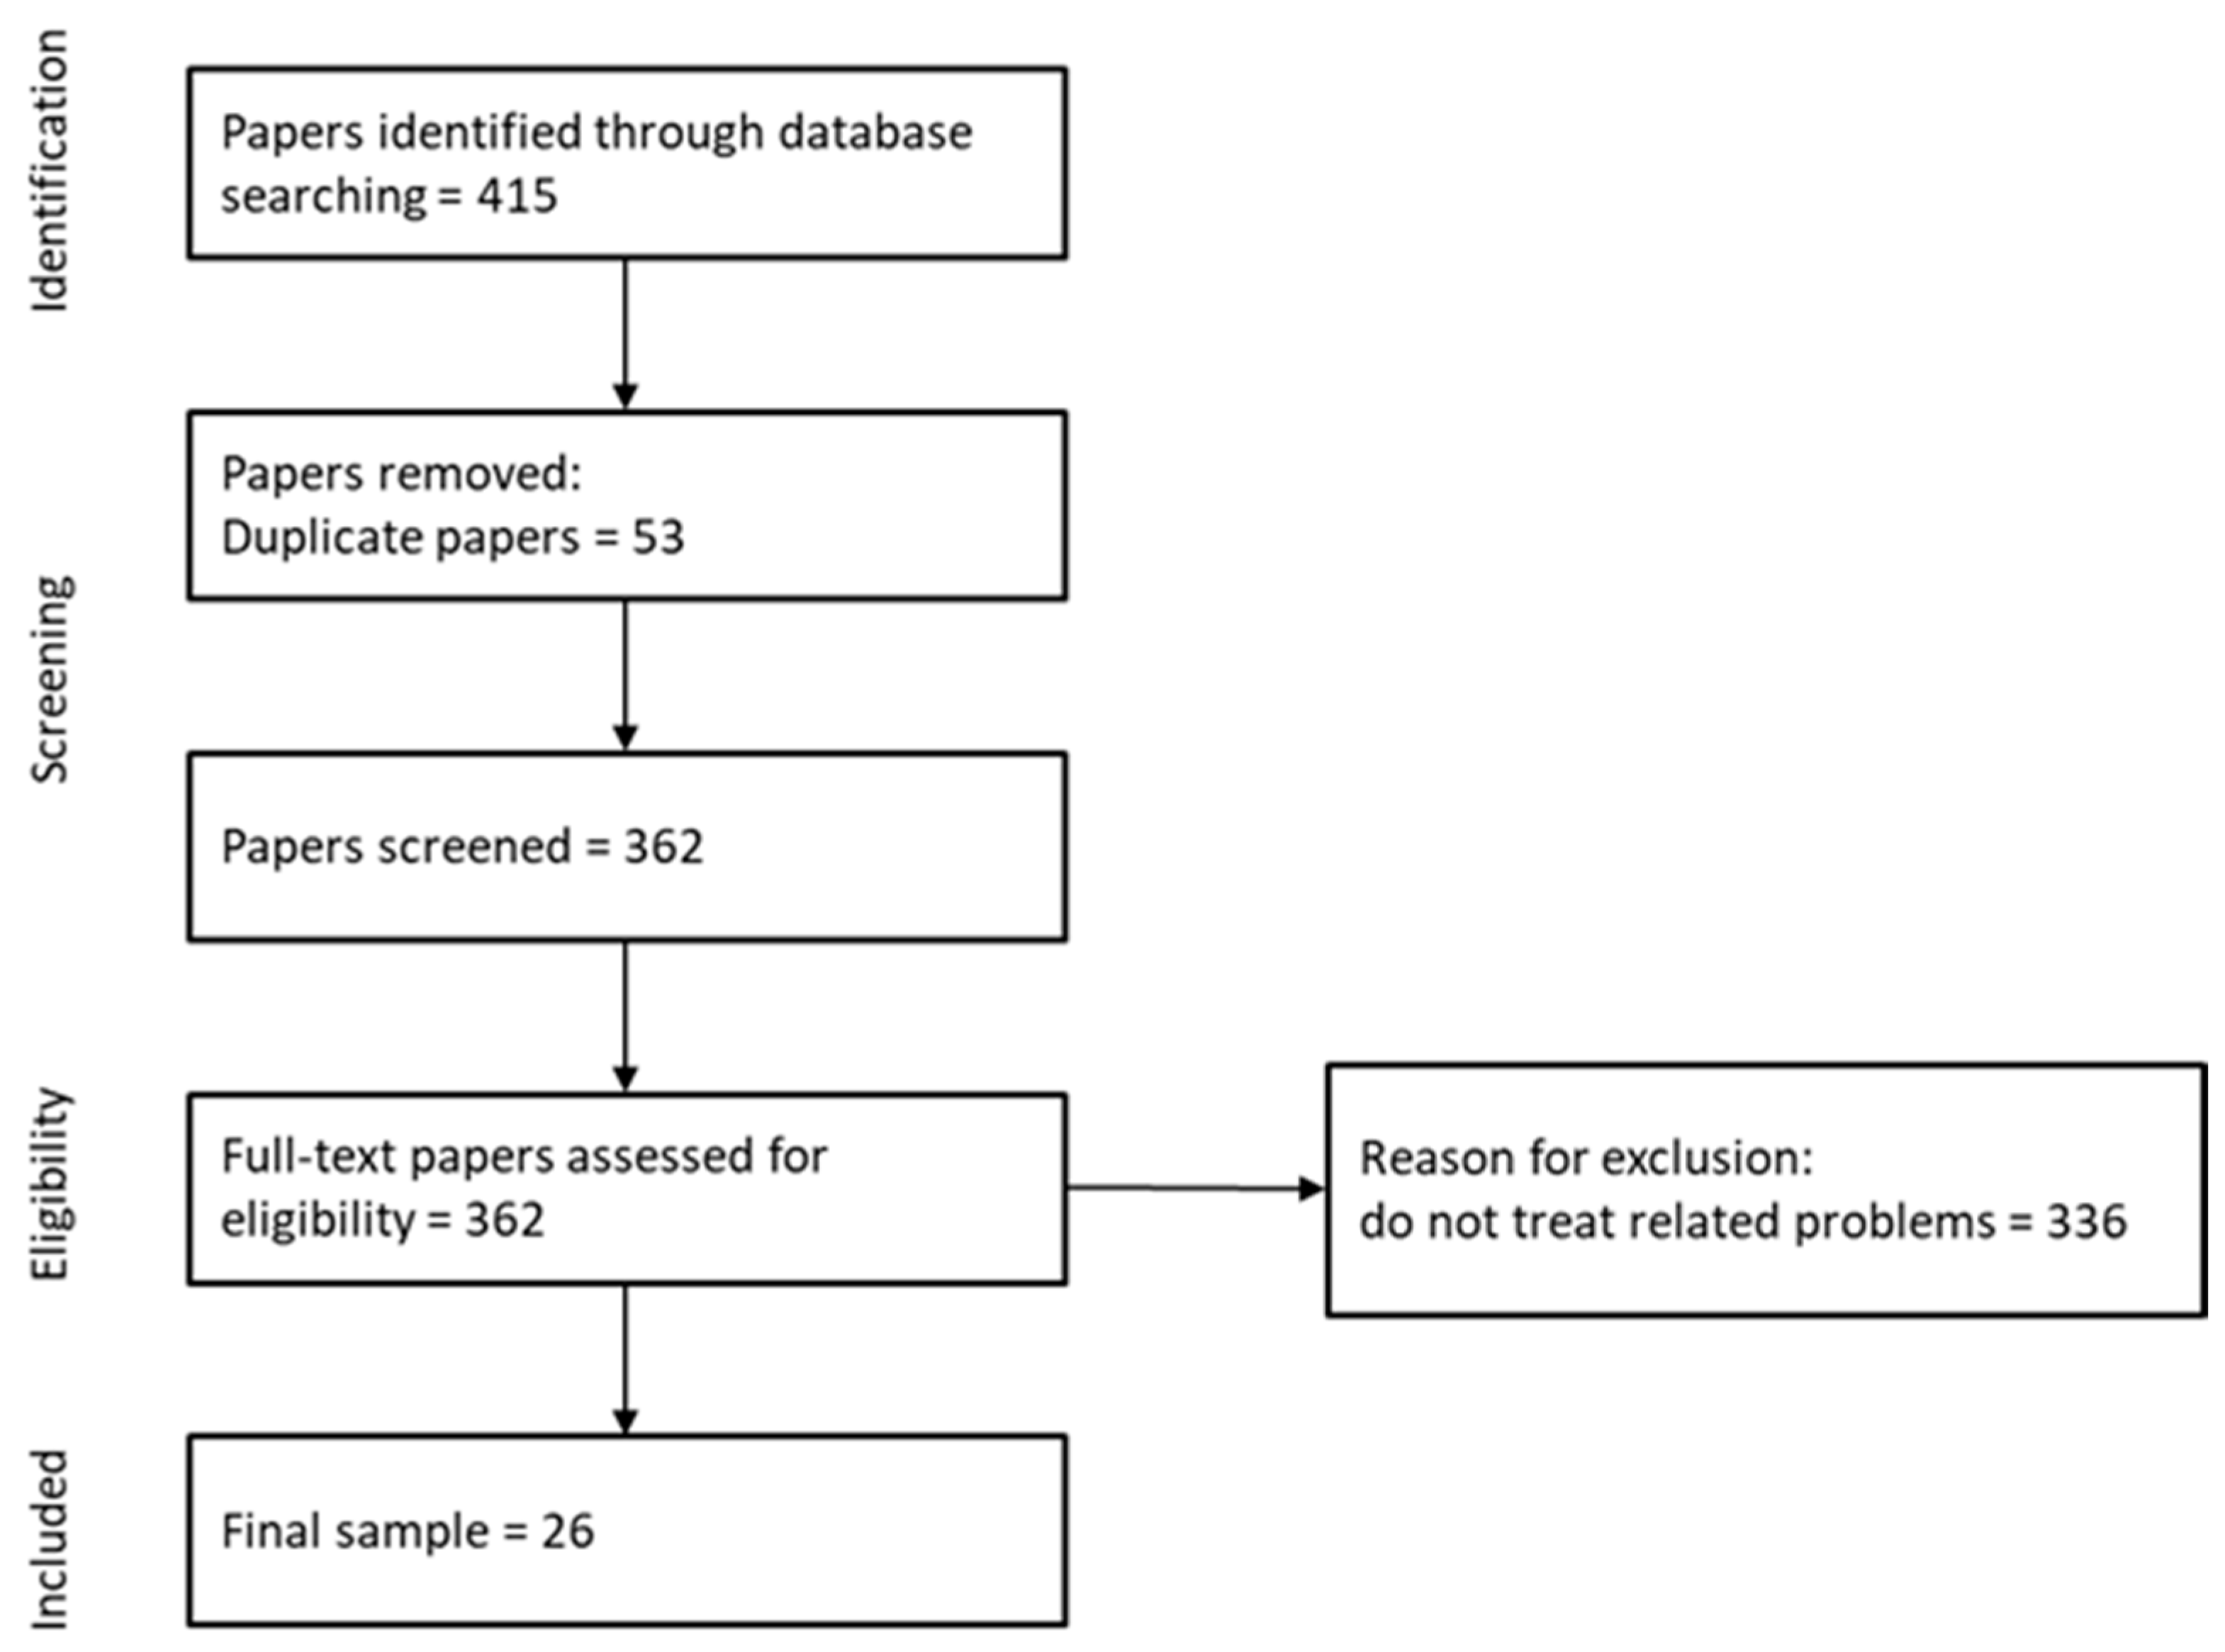
The search in the databases resulted in 415 articles published in journals. Duplicate articles and studies that did not address the application of computational techniques to solve WEEE-related problems were excluded. This resulted in twenty-six articles whose selection was based on inclusion and exclusion criteria that prioritized the degree of alignment between the objectives of the studies and the focus of this research. Figure 1 presents a diagram based on the PRISMA method, indicating the four phases for conducting the literature review, as well as the number of articles assigned to each stage.

Figure 1.
Steps for applying PRISMA in the literature review conducted in this study.
The reason for considering only the last 5 years in the literature review is related to the recent evolution of public policies, environmental guidelines, and technological advances aimed at the management of electronic waste and reverse logistics. In addition, the growing availability of geospatial data and the improvement of socio-spatial analysis methods have led to more updated and relevant approaches during this period.
3.2. Socio-Spatial Characterization of the City of São Paulo (Study Area)
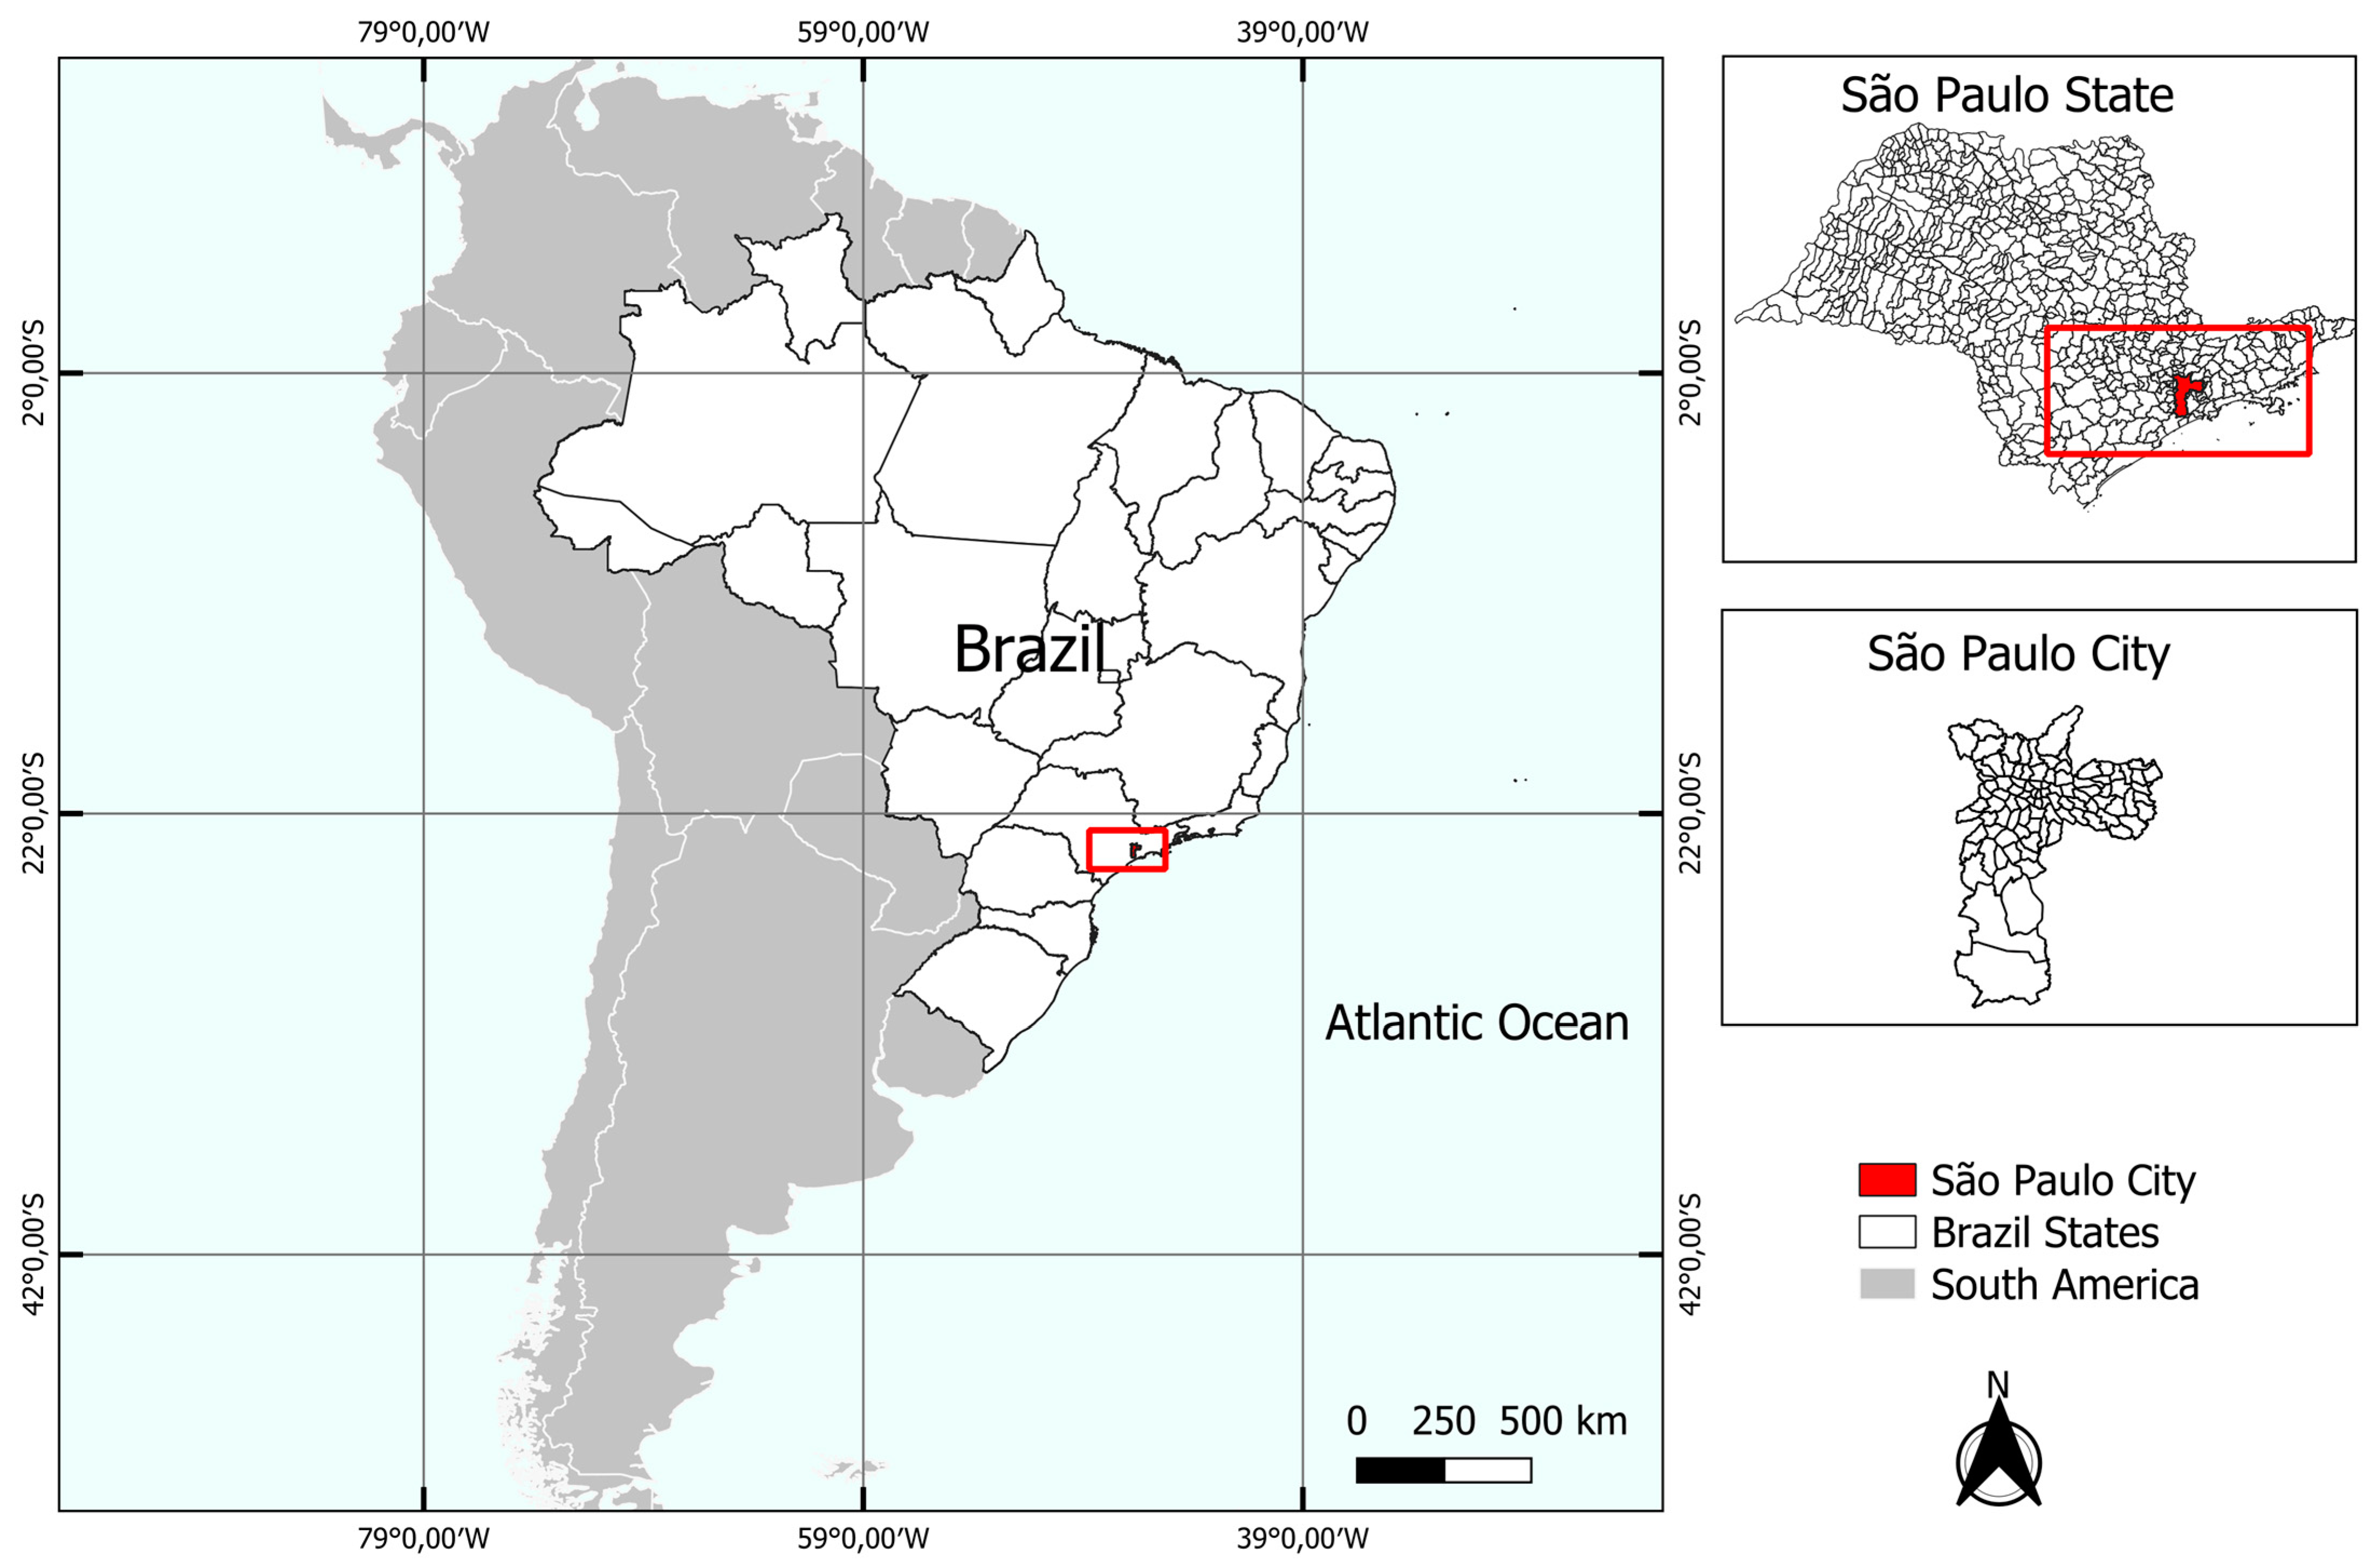
The city of São Paulo, whose location is depicted on the map in Figure 2, has a population of over 12 million inhabitants. It is one of the most important metropolises not only in Brazil but also worldwide, playing a central role in economic, cultural, political, and social spheres. São Paulo is a true convergence center of different ethnicities, cultures, and ways of life [51]. Its economic relevance is evidenced by the presence of a wide variety of industries, multinational companies, and financial institutions, significantly contributing to the country’s development. However, São Paulo also faces socio-spatial challenges, such as social inequality, urban segregation, lack of adequate housing, and insufficient infrastructure. The coexistence of high-standard areas and deprived peripheral regions reflects the socioeconomic disparities present in the city [52].
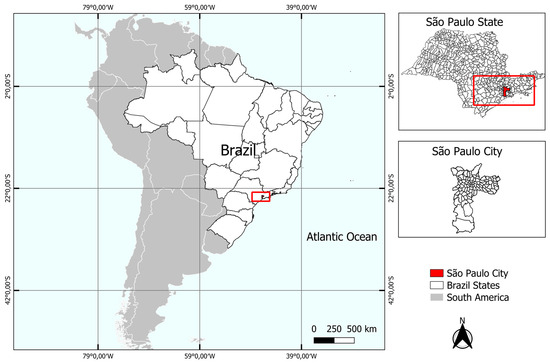
Figure 2.
Spatial location of the city of São Paulo, Brazil.
The city is divided into 96 districts distributed across 5 zones, as illustrated in Figure 3. The Central Zone is the pulsating heart of the metropolis, incorporating a series of socio-spatial characteristics that reflect its historical, cultural, economic, and political importance [53]. This region is marked by architectural diversity, blending historical buildings with modern skyscrapers and business complexes, and by an intense concentration of commercial, financial, administrative, and cultural activities, making it a reference point for both residents and visitors [51]. However, the Central Zone also faces socioeconomic and urban challenges, such as the presence of populations in situations of social vulnerability and a concentration of residents in precarious housing conditions [54].
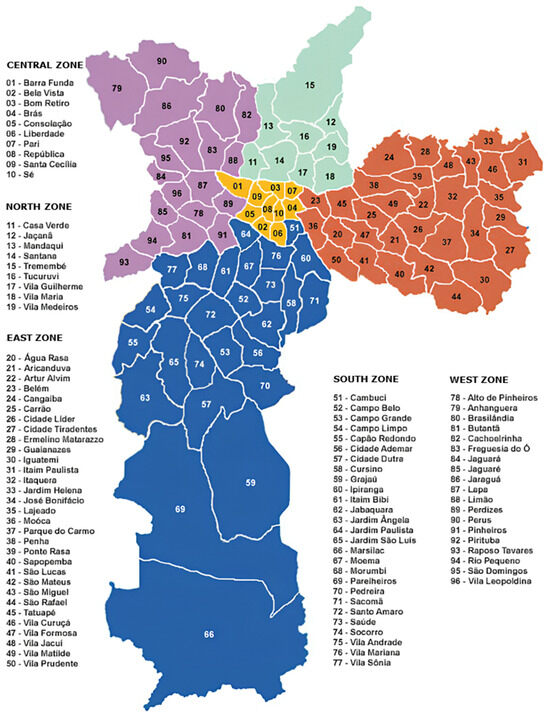
Figure 3.
Districts of the city of São Paulo.
The North Zone is a region marked by great socio-spatial diversity, encompassing traditional and consolidated districts as well as peripheral districts undergoing urbanization [53]. Districts like Santana, Tucuruvi, and Vila Guilherme have well-developed urban infrastructure and are often associated with the city’s middle and upper middle classes [55]. However, in the more deprived peripheral districts, such as Brasilândia, Cachoeirinha, and Jaçanã, urbanization is less consolidated, with precarious infrastructure, a deficit in public services like health and education, and social problems such as unemployment and violence [56].
The South Zone, while hosting affluent districts like Morumbi, Itaim Bibi, and Moema—known for their quality of life, developed urban infrastructure, and presence of green areas [55]—also faces challenges related to social inequality and lack of infrastructure in some of its peripheral regions [51]. Districts such as Capão Redondo, Jardim Ângela, and Grajaú have been facing problems like lack of basic services, urban violence, and difficulties in accessing employment and education [56].
The East Zone features older and consolidated districts like Tatuapé, Mooca, and Belém, which have well-developed urban infrastructure and are often associated with the city’s middle and upper middle classes [55]. However, in the more deprived peripheral districts such as Itaim Paulista, Cidade Tiradentes, and Lajeado, urbanization is less consolidated, with precarious infrastructure, a deficit in public services like health and education, and issues of violence and lack of security [54,56].
The West Zone is a region that presents great socio-spatial heterogeneity, encompassing affluent and valued areas such as the districts of Pinheiros and Perdizes, as well as peripheral neighborhoods undergoing urbanization like Rio Pequeno, Jaguaré, and Raposo Tavares [51,53]. This diversity is reflected both in the urban infrastructure and in the socioeconomic and cultural conditions of its inhabitants [56].
3.3. Data Collection
The data used in this study were extracted from the GeoSampa [57] platform, ensuring comprehensiveness and relevance for analyzing the socio-spatial characteristics of the city of São Paulo. Further details on the data are provided in Appendix A.
A database was compiled for the districts of São Paulo, encompassing explanatory (dependent) variables, including area (Area_km2), population (Pop), population density (Pop_Dens), number of ecopoints (Num_Eco), and Human Development Indices related to education (HDI_E) and Human Development Indices related to income (HDI_I), as well as the number of WEEE collection points (Num_CPs). This latter variable represents the response (independent) variable and was obtained from Oliveira Neto et al. [2]. Table 2 provides summary descriptions of the variables.
Table 2.
Explanatory and response variables.
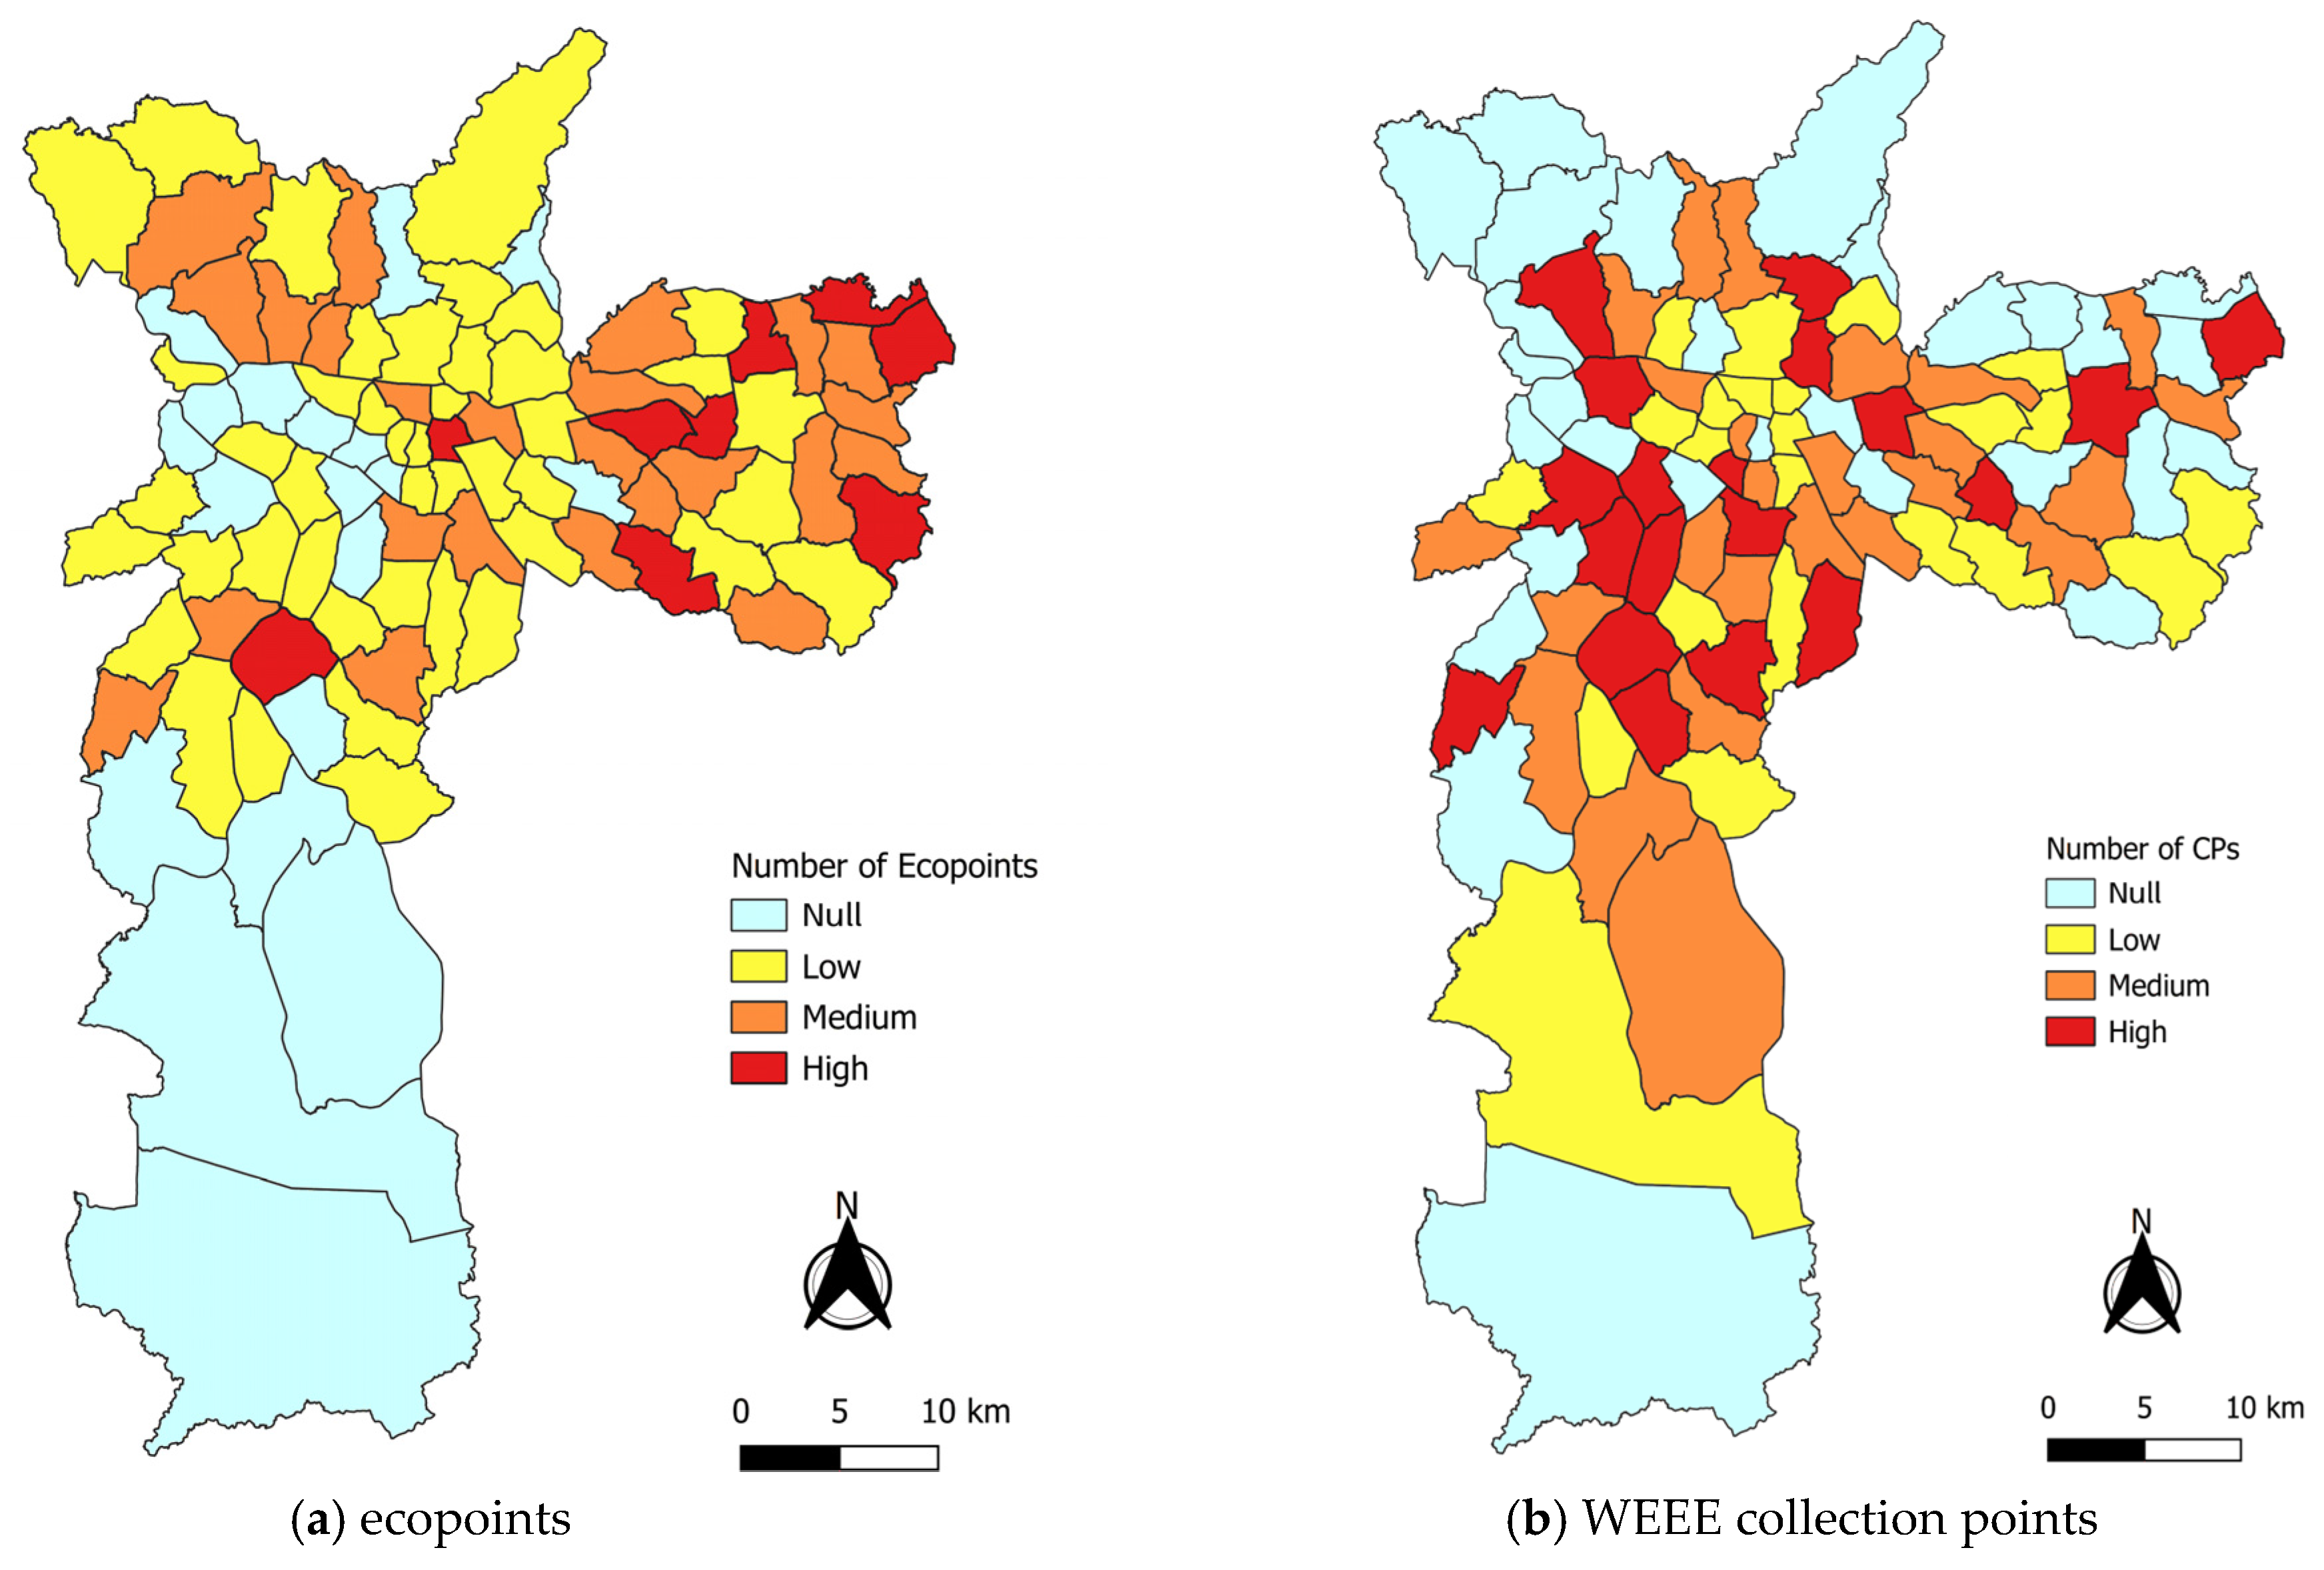
In the city of São Paulo, ecopoints and WEEE Collection Points (CPs) are distinct structures aimed at the correct disposal of waste, but with different purposes. Ecopoints, managed by city governments, are intended for the free disposal of small volumes of rubble, pruning waste, used furniture, and recyclable materials such as paper, plastic, glass, and metal. WEEE CPs, on the other hand, are exclusively for the collection of electronic waste, such as cell phones, chargers, computers, and small appliances, promoting the environmentally appropriate disposal of these materials. Both are important for environmental preservation, but they serve specific types of waste. The spatial distributions of ecopoints and WEEE collection points in the municipality of São Paulo are presented in Figure 4.

Figure 4.
Spatial distributions of ecopoints and WEEE collection points in São Paulo city.
After downloading the data files, the information was consolidated into a single spreadsheet and subjected to a preprocessing step that included standardization, organization, and consistency checks to ensure data quality for analysis. Records containing missing values or outliers were excluded. A portion of the resulting dataset is presented in Table 3.
Table 3.
Samples of data from districts.
3.4. Data Processing and Analysis
This study employed the decision tree (DT) and the Apriori algorithm to explore and model the relationship between explanatory and response variables. Continuous-valued attributes were categorized following the methodology proposed in de Araujo et al. [58], with classes defined based on the frequency histogram of values. For example, the variable representing the number of WEEE collection points (Num_CPs) was categorized into the following classes: “Null”, “Low”, “Medium”, and “High”. The distribution of Num_CPs data across their respective classes is shown in Figure 5.
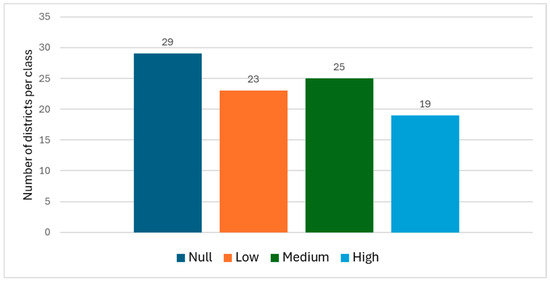
Figure 5.
Data distribution for the variable Num_CPs.
Table 4 presents the same data from Table 3 after normalization and categorization. Table 5 shows the value intervals used to define the classes associated with the variables. The variables Area_km2 and Pop were grouped into three classes (“Small”, “Medium”, and “Big”). The variables Pop_Dens, HDI_E, and HDI_I were also categorized into three classes, but with the labels “Low”, “Medium”, and “High”. Finally, the variables Num_Eco and Num_CPs were categorized into four classes (“Null”, “Low”, “Medium”, and “High”), with the “Null” class representing the absence of WEEE collection points.
Table 4.
Samples of categorized data from districts.
Table 5.
Value intervals used to define the classes associated with the variables.
The DT algorithm used in the computational experiments for data analysis was C4.5, implemented as J48 in the WEKA software (https://ml.cms.waikato.ac.nz/weka, accessed on 10 January 2025), which was utilized in this study. The objective was to investigate how explanatory variables influence the number of WEEE collection points and to identify patterns in the data. The DT was constructed using the preprocessed, normalized, and categorized data comprising the training set, exemplified in Table 4.
The C4.5 algorithm was configured as follows: minimum number of instances per node equal to 2 and minimum confidence factor for pruning set to 0.25. The information gain measure was used as a criterion for defining the importance of the attributes in the construction of the tree. Pruning helps to simplify the model, reducing the risk of overfitting and improving the generalization capacity on unknown data. Regarding the Apriori algorithm, only the association rules with a confidence factor of at least 50% were considered in our study.
The adopted methodology enabled the exploration of complex relationships within the analyzed data, generating valuable knowledge into the factors influencing the location of collection points in São Paulo. These insights can inform decision-making in urban planning and public policy.
Additionally, the Apriori algorithm was employed to generate association rules between explanatory and response variables, based on a confidence factor of 50%, a straightforward measure of a rule’s precision. Both the rules generated by DT and Apriori represent patterns discovered from the analyzed data.
The interpretation of results produced by DT and Apriori is based on “IF...THEN” rules. These rules were analyzed and, when possible, grouped to derive generalized, easily readable patterns. DT-derived patterns were evaluated primarily for accuracy and the Kappa index, while association rules were assessed based on confidence factor. Higher values for these measures indicate greater consistency of the patterns described by the rules. This approach facilitated the identification of patterns and insights that enhance the understanding of how explanatory variables influence the distribution of WEEE collection points in São Paulo.
A schematic diagram of the data mining approach proposed in our study is illustrated in Figure 6.
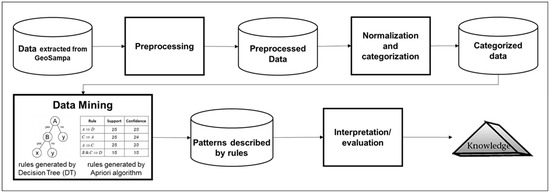
Figure 6.
Schematic diagram of the proposed data mining approach.
4. Results
This section presents the results of pattern discovery using decision trees (Section 4.1) and the Apriori algorithm (Section 4.2).
4.1. Pattern Discovery Using Decision Trees (DTs)
According to Mitchell [59], among machine learning algorithms, decision trees (DTs) can be considered simple yet effective for describing patterns. This is because each branch of the tree produced during data classification represents a rule of the type IF...THEN. For this reason, DT algorithms have been widely employed in classification tasks to predict classes based on the values of attributes representing training examples.
In this study, a DT model was constructed to investigate how the socio-spatial characteristics of São Paulo impact the number of WEEE collection points. The model construction was based on the classification of the training set exemplified in Table 4, which synthesizes the socio-spatial attribute values for the 96 districts of São Paulo.
The tree generated by the C4.5 algorithm resulted in 27 leaves and a total size of 53 nodes, as illustrated in Figure 7.
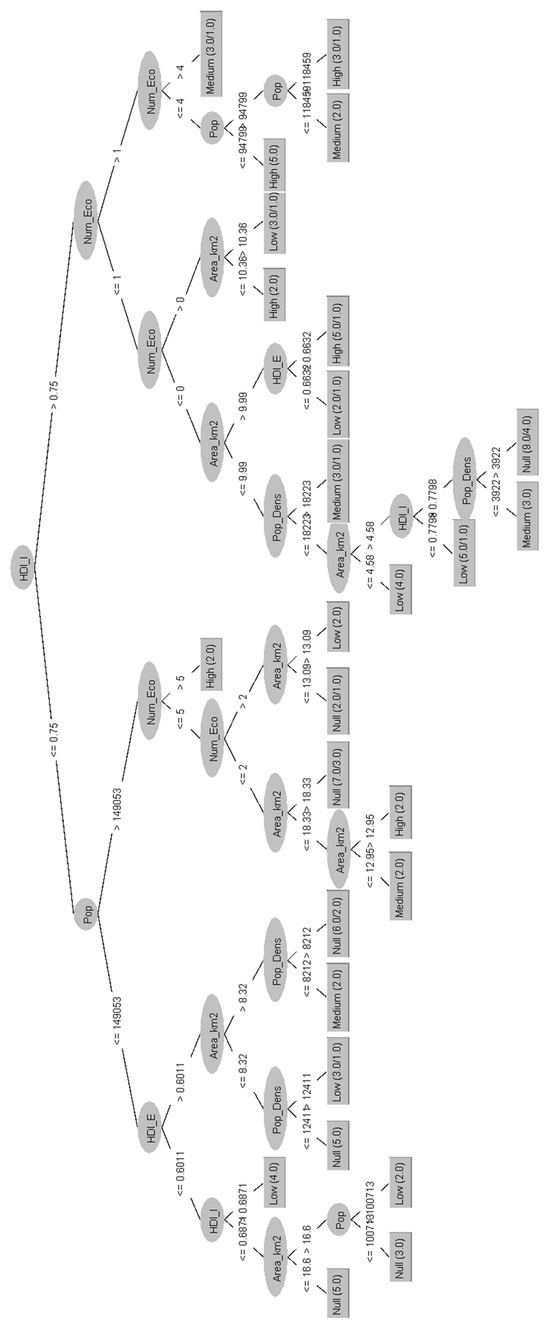
Figure 7.
Decision tree generated from the training data.
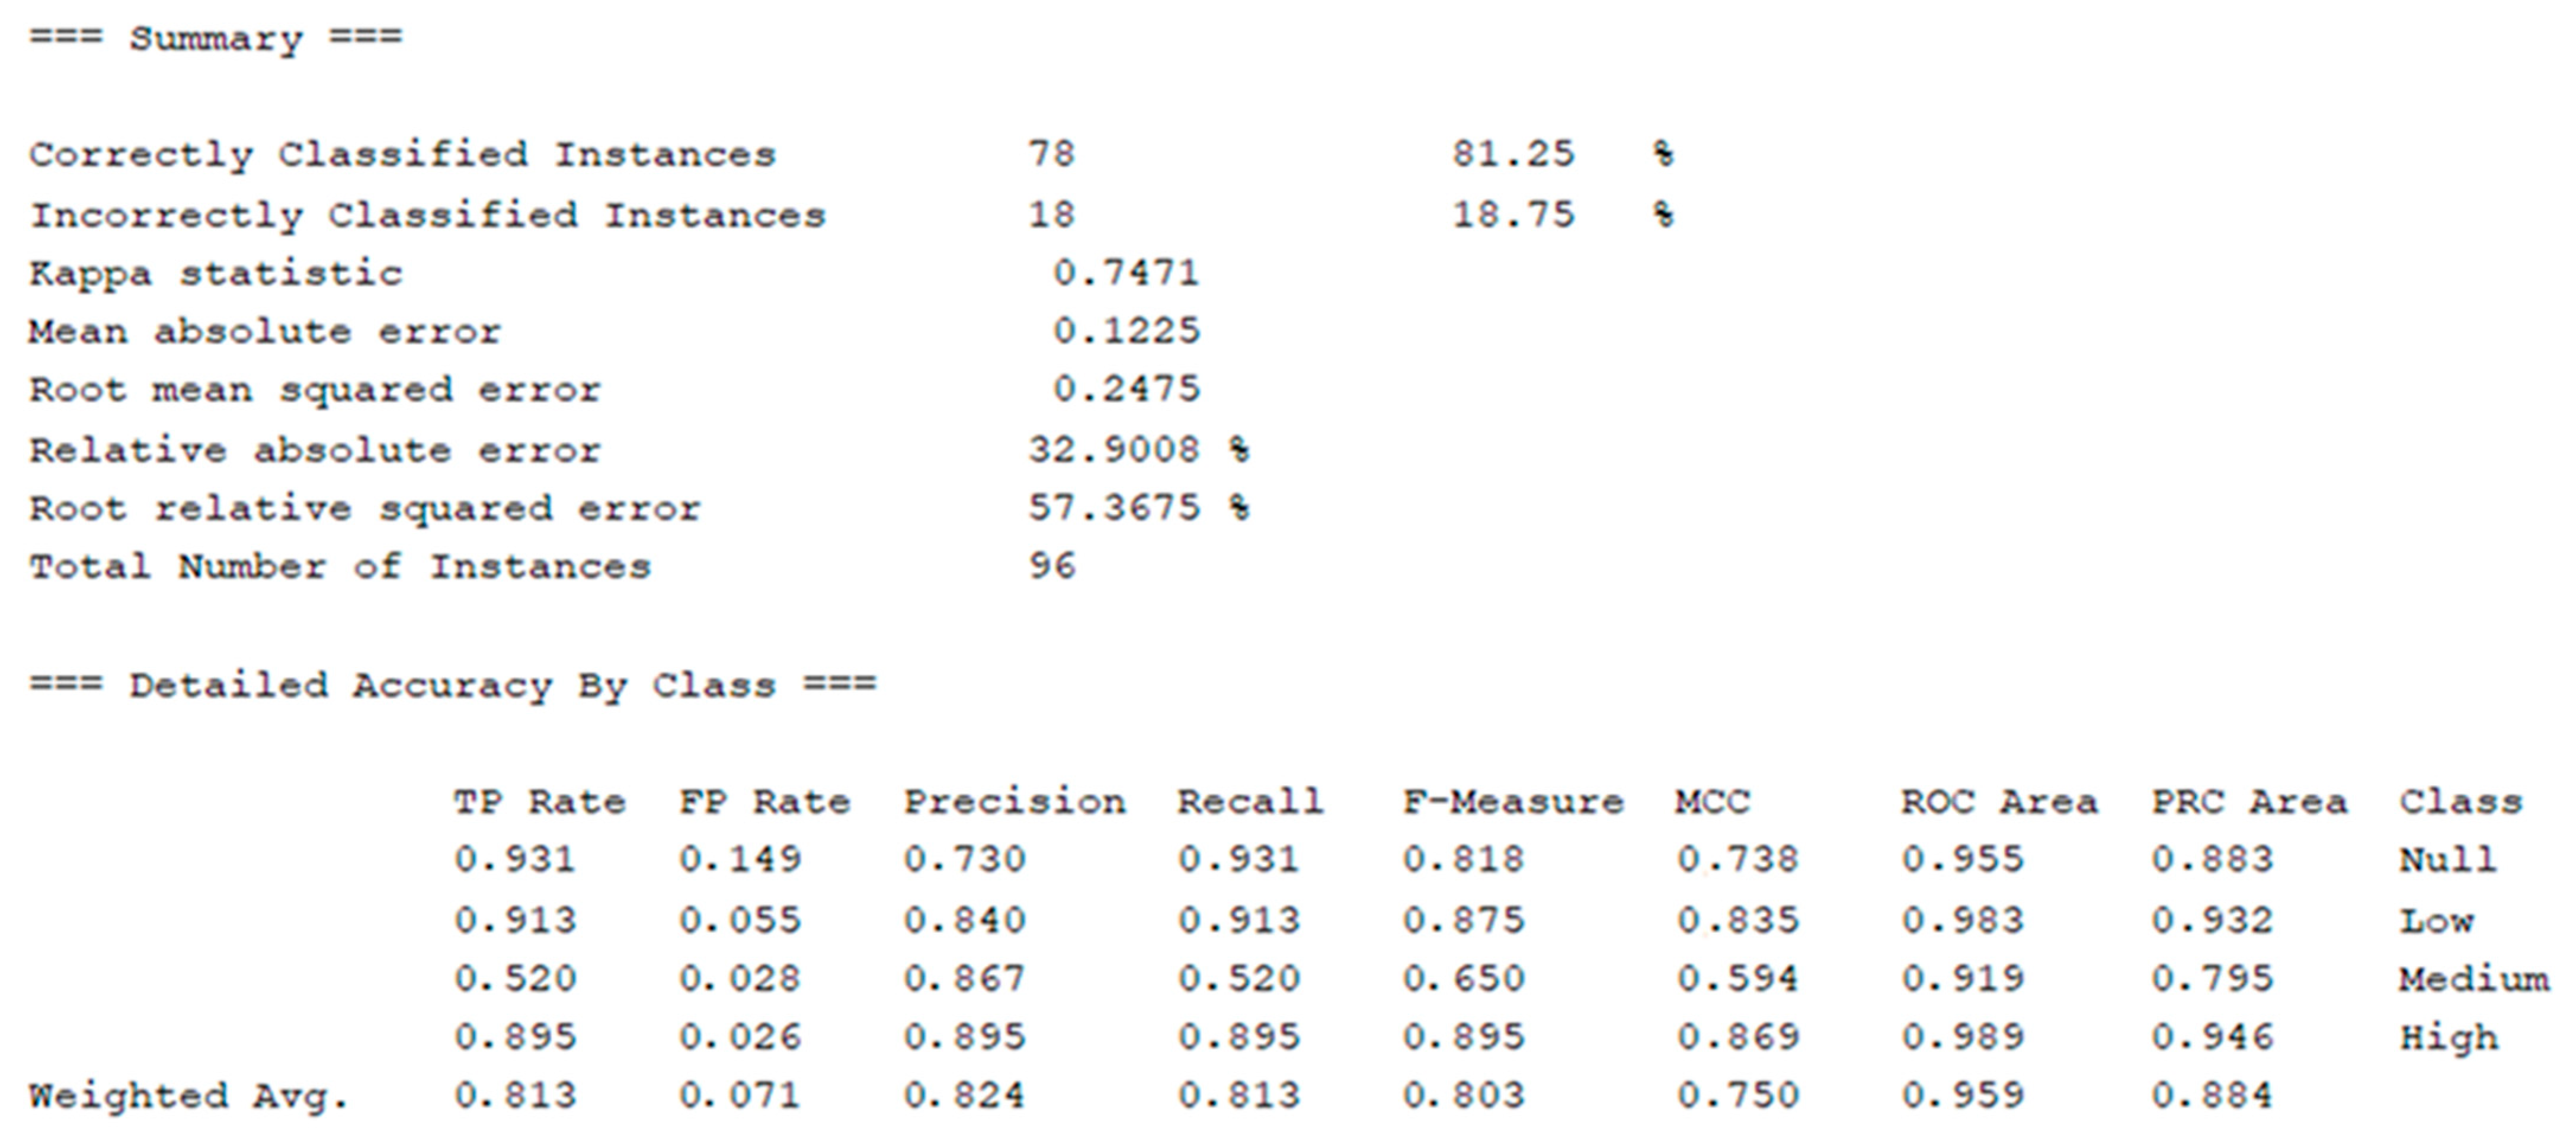
Regarding performance, the trained model achieved an accuracy of 81.25% and a Kappa index of 74.71%, indicating good agreement for the classifier’s results. These performance measures, illustrated in Figure 8, are calculated from the confusion matrix presented in Table 6, which details the classification’s hits and errors. Figure 8, generated by WEKA, also shows performance measures for each class.
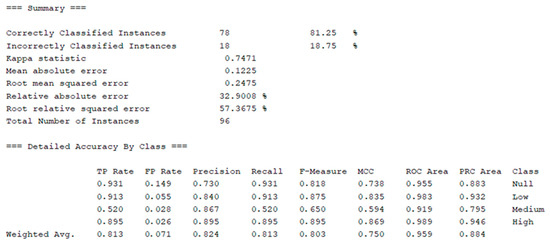
Figure 8.
Results analysis generated by WEKA.
Table 6.
Confusion matrix.
From the confusion matrix, it can be highlighted that the model performed exceptionally well for the “Null”, “Low”, and “High” categories but faced greater difficulty with the intermediate category (“Medium”). This may be due to the range of values defining the classes associated with the variables, as shown in Table 5. However, it is important to note that these ranges were designed to balance the classes, aiming to reduce generalization problems and biases.
Figure 8 confirms that the model achieved strong results for the “Null” and “Low” classes, with accuracy rates (true positive rates) exceeding 0.9. However, for the “Medium” class, the model exhibited its weakest performance (TP Rate = 0.520). Conversely, the false positive rates (FP Rate) were relatively low for all classes, indicating a degree of stability in the classification process, directly impacting the model’s overall accuracy (81.25%). Furthermore, the high precision and ROC curve values close to 1 for all classes reflect the model’s ability to effectively classify instances.
The patterns presented below, derived from the rules generated by the decision tree, explain the relationships between socio-spatial variables and their impact on the distribution of collection points across São Paulo’s districts. They can be utilized in planning the installation of new collection points to optimize WEEE reverse logistics.
- Districts with low income and education indices (HDI_E and HDI_R), combined with small areas, tend to lack WEEE collection points. This knowledge, extracted from the tree, may reflect limitations in infrastructure or investment priorities that do not favor the implementation of collection points in certain areas. It may also indicate inequalities in access to WEEE collection points, especially in socially vulnerable areas.
- It was observed that even in districts with higher income levels, the number of ecopoints and WEEE collection points can be limited. This highlights the importance of studies focused on increasing accessibility to collection services.
- Populous districts with moderate ecopoint availability generally have an average number of WEEE collection points. This indicates a relationship between population size, solid waste recycling infrastructure (represented by the number of ecopoints), and the availability of WEEE collection points.
- Districts with favorable socioeconomic conditions and robust solid waste recycling infrastructure are correlated with higher numbers of WEEE collection points. This suggests that a strengthened socioeconomic environment combined with significant investments in ecopoints creates ideal conditions for promoting WEEE recycling.
Additionally, attributes related to income, education, and population were identified as the most significant in determining patterns. This relative importance was defined based on information gain, which is the measure employed by the C4.5 algorithm for decision tree construction [59].
The knowledge produced by the DT model highlights how the socio-spatial characteristics of São Paulo’s districts influence the availability of WEEE collection services, providing valuable insights for implementing collection point location strategies and recycling initiatives. This knowledge can further contribute to the development of urban and environmental planning policies.
4.2. Pattern Discovery Using the Apriori Algorithm
As previously mentioned, the data were also analyzed using the Apriori algorithm, which generates association rules that complement the patterns discovered by the DT. In our experiments, we considered only association rules with a minimum confidence factor of 0.5, as listed in Table 7.
Table 7.
Association rules generated by the Apriori algorithm.
The strongest rule (confidence factor of 0.78) suggests that districts with medium HDI_E and HDI_I levels are highly likely to have a medium number of WEEE collection points. This indicates a balanced relationship between the districts’ socioeconomic conditions and the WEEE recycling infrastructure. On the other hand, the last two rules suggest that districts where socioeconomic conditions and solid waste recycling infrastructure (ecopoints) are poor generally lack WEEE collection points. This reinforces the fact that areas with greater social vulnerability are more susceptible to inequalities in access to WEEE collection points.
The rules generated by the Apriori algorithm, like those from the DT, reveal that socioeconomic characteristics, particularly HDI_I, are crucial for studies focused on improving WEEE reverse logistics infrastructure. The correlation between the absence of eco-points (for general solid waste collection) and a low number of WEEE collection points underscores the importance of investing in basic disposal and recycling infrastructure in São Paulo.
5. Discussion
The results obtained with the decision tree (accuracy of 81.25%, Kappa index of 74.71%), combined with those produced by the Apriori algorithm, reveal consistent patterns, demonstrating the potential of the proposed approach to support the management of the WEEE reverse logistics chain in São Paulo, particularly concerning the geographical distribution of collection points. These findings reinforce the importance of data mining in discovering patterns associated with the dynamics of WEEE collection point distribution. Unfortunately, the lack of similar studies in the literature hinders a direct comparison of the results obtained. Lv and Du [26] developed a spatial mathematical model based on the Kriging method to predict the amount of WEEE returns in reverse logistics, but they did not explore how factors such as income, education, population, area, and population density influence the establishment of collection points.
This study contributes to the literature by addressing a gap: most research utilizing computational techniques to support WEEE management does not explore social aspects. Typically, these studies focus on economic optimization, such as minimizing transportation distances for WEEE, as seen in the works of Oliveira Neto et al. [4]; Mar-Ortiz et al. [8]; Qiang and Zhou [9]; Elia et al. [10]; Bal and Satoglu [12]; Alumur et al. [13]; Gomes et al. [14]; Kilic et al. [15]; and Achilles et al. [18]. In contrast, this study applies data mining techniques, including decision trees and the Apriori algorithm, to identify patterns that explain the relationships between socio-spatial variables and WEEE collection infrastructure.
Thus, the findings of this research are significant, especially when considering a complex megacity like São Paulo, with over 12 million inhabitants. The study explores the relationship between the socioeconomic development of districts and the implementation of recycling infrastructure, emphasizing the importance of public policies that integrate these variables. It was observed that districts with lower socioeconomic development, particularly low-income areas, tend to have fewer WEEE collection points, indicating that these regions are often underserved in terms of the necessary infrastructure for effective electronic waste management. Conversely, the presence of ecopoints and more favorable socioeconomic conditions is associated with a greater number of WEEE collection points, suggesting that investments in recycling infrastructure are particularly effective in districts with stronger socioeconomic indicators.
This study also provides practical insights for WEEE management in organizational settings, which is currently a governmental, industrial, and social challenge. The studies of Yu and Solvang [17], Achilles et al. [11]; Achilles et al. [18]; and Shokohyar and Mansour [20] emphasize the importance of analyzing real-world data, not only to advance theoretical knowledge but also to generate actionable insights for practical decision-making, as suggested by Oliveira Neto et al. [4]. The knowledge produced by this research offers substantial support for decision-making regarding the installation of new collection points, taking into account the socio-spatial characteristics of the target areas.
Furthermore, the insights from this study have significant implications for the development and urban planning of sustainability policies in São Paulo. They underscore the necessity of a more targeted and contextualized approach to developing recycling infrastructure, highlighting the importance of considering the specific characteristics of each district. Strategies that promote equity in access to electronic waste collection points, alongside efforts to increase community awareness and participation in recycling, can help overcome existing barriers and enhance electronic waste management in the city.
6. Conclusions
This study explored the application of data mining techniques to generate rules that encapsulate knowledge explaining the relationships between socio-spatial characteristics and the distribution of WEEE collection points in São Paulo. Through decision trees, significant patterns and influential variables were identified in determining the number of WEEE collection points, while the Apriori algorithm revealed robust associations between explanatory variables and the availability of electronic recycling services. By combining these data analysis techniques to explore specific patterns in São Paulo, the study provides insights that extend beyond conventional analyses found in the literature and contributes to the achievement of SDG 11 (Sustainable Cities and Communities) and SDG 12 (Responsible Consumption and Production).
By identifying disparities in the location of collection points relative to areas with greater socioeconomic vulnerability or population density, the study offers guidance for public policies aimed at more equitable and accessible distribution. This fosters social inclusion in WEEE management, encourages sustainable disposal and recycling practices, reduces environmental impacts, and promotes a circular economy. Additionally, it raises environmental awareness and strengthens cooperation networks among governments, businesses, and communities, aligning with the principles of urban sustainability and social justice.
Strategies informed by the analysis conducted in this study can provide promising directions for improving the coverage and efficiency of electronic recycling services in São Paulo, emphasizing the importance of data-driven and evidence-based approaches to addressing contemporary environmental challenges.
The primary limitations of this study include the lack of higher granularity and more up-to-date data. Future research should focus on replicating the proposed approach in other Brazilian or international cities to verify the generalizability of the patterns and associations found, incorporate additional variables—such as electronic waste flows and local policies—to refine the prediction and association models, and combine the proposed approach with optimization models to identify ideal locations for new collection points, with the aim of minimizing costs while maximizing accessibility and the efficiency of WEEE reverse logistics systems.
As a future research direction, this study proposes the optimization of the socio-spatial coverage of electronic waste (WEEE) collection points, focusing on the equitable redistribution of these points across the districts of São Paulo. This can be achieved through the application of heuristic and metaheuristic algorithms, such as those employed in [4,60,61,62], which have proven effective in solving complex optimization problems in urban contexts.
Author Contributions
Conceptualization, G.C.d.O.N., P.A.B. and S.A.d.A.; Methodology, G.C.d.O.N., P.A.B., S.A.d.A. and M.R.; Software, P.A.B. and S.A.d.A.; Formal analysis, S.A.d.A.; Investigation, M.A. (Marcos Alexandruk), M.A. (Marlene Amorim), S.A.d.A. and G.C.d.O.N.; Data curation, F.C.D. and R.A.F.; Writing—original draft, M.A. (Marlene Amorim), G.C.d.O.N., P.A.B. and S.A.d.A.; Writing—review and editing, G.C.d.O.N., P.A.B., J.M. and S.A.d.A.; Supervision, G.C.d.O.N. and M.A. (Marlene Amorim). All authors have read and agreed to the published version of the manuscript.
Funding
The authors are grateful to CNPq—Conselho Nacional de Desenvolvimento Científico e Tecnológico (National Council for Scientific and Technological Development)—Universal Projects 2023 (Processes 409321/2023-0 and 421769/2023-8).
Institutional Review Board Statement
Not applicable.
Informed Consent Statement
Not applicable.
Data Availability Statement
The data used in this work come from public repositories that were reported in the article.
Conflicts of Interest
The authors declare no conflicts of interest.
Appendix A
Data Description
The data used in this study refer to the districts of the municipality of São Paulo and were extracted from the GeoSampa platform (https://geosampa.prefeitura.sp.gov.br/PaginasPublicas/_SBC.aspx, accessed on 10 January 2025). This platform, maintained by the São Paulo City Hall through the Municipal Department of Urban Planning and Licensing (SMUL), serves as the city’s official geospatial data portal. It provides open access to a comprehensive range of thematic layers, including all data used in our experiments. Data can be exported in various structured formats, such as CSV, SHP, and GeoJSON, allowing seamless integration into Geographic Information Systems (GIS) and data analysis tools. For this study, district-level information on territorial area, population, population density, number of ecopoints, and municipal development indices was extracted. After acquisition, the data underwent a systematic cleaning and normalization process, including the removal of duplicates and missing values, standardization of variable names, and categorization into value ranges. The processed data were then aggregated into a single dataset.
The explanatory variables include: territorial area (Area_km2), which indicates the geographic extension of each district; population (Pop), corresponding to the total number of inhabitants; and population density (Pop_Dens), which expresses the average number of people per square kilometer. The variable number of ecopoints (Num_Eco), representing the locations designated for the proper disposal of solid waste such as rubble, recyclables, and bulky items, was also included.
Additionally, the dimensions Education (HDI_E) and Income (HDI_I) from the Municipal Human Development Index (IDHM) were considered. HDI_E is calculated using a weighted geometric mean of school attendance (weight 2/3) and educational attainment (weight 1/3), while HDI_I is obtained from the per capita income indicator, using the formula: [(observed value of the indicator − minimum value)/(maximum value − minimum value)]. These dimensions directly influence factors such as technology consumption, environmental awareness, and access to information, making them particularly relevant for analyzing the relationship with WEEE collection points. The longevity dimension (HDI_L), although part of the overall IDHM, was excluded from this study as it is more closely related to health and sanitation and less relevant to electronic waste behavior and infrastructure access. It should be clarified that the IDH_M corresponds to the geometric mean of the IDH_E, IDH_I, and IDH_L indices, with equal weights.
The data related to the WEEE collection points were provided by [2]. The number of collection points (Num_CPs) was considered as the response variable in this study. These points, distinct from traditional ecopoints, are designated exclusively for the disposal of electronic equipment such as cell phones, chargers, computers, and small appliances. While ecopoints are managed by municipal governments and accept various types of solid waste, WEEE collection points specifically promote the environmentally appropriate disposal of electronic waste. Both systems are important for environmental preservation but serve different types of waste. It is suggested for future research the socio-environmental evaluation of the adoption of reverse logistics, using Material Intensity Factor, as used [63,64].
References
- Jaiswal, S.K.; Mukti, S.K. Prioritizing Factors Affecting E-Waste Recycling in India: A Framework for Achieving a Circular Economy. Circ. Econ. Sustain. 2024, 5, 461–481. [Google Scholar] [CrossRef]
- Oliveira Neto, G.C.; Correia, A.D.J.C.; Tucci, H.N.P.; Melatto, R.A.P.B.; Amorim, M. Reverse Chain for Electronic Waste to Promote Circular Economy in Brazil: A Survey on Electronics Manufacturers and Importers. Sustainability 2023, 15, 4135. [Google Scholar] [CrossRef]
- Gaur, T.S.; Yadav, V.; Mittal, S.; Sharma, M.K. A systematic review on sustainable E-waste management: Challenges, circular economy practices, and a conceptual framework. Manag. Environ. Qual. Int. J. 2024, 35, 858–884. [Google Scholar] [CrossRef]
- Oliveira Neto, G.C.D.; de Araujo, S.A.; Gomes, R.A.; Alliprandini, D.H.; Flausino, F.R.; Amorim, M. Simulation of Electronic Waste Reverse Chains for the Sao Paulo Circular Economy: An Artificial Intelligence-Based Approach for Economic and Environmental Optimizations. Sensors 2023, 23, 9046. [Google Scholar] [CrossRef] [PubMed]
- Nikou, V.; Sardianou, E. Bridging the socioeconomic gap in E-waste: Evidence from aggregate data across 27 European Union countries. Clean. Prod. Lett. 2023, 5, 100052. [Google Scholar] [CrossRef]
- Widanapathirana, S.; Perera, I.J.J.U.N.; Bellanthudawa, B.K.A. Electrical and electronic waste (e-waste) recycling and management strategies in South Asian region: A systematic review from Sri Lankan context. Waste Dispos. Sustain. Energy 2023, 5, 559–575. [Google Scholar] [CrossRef]
- Assavapokee, T.; Wongthatsanekorn, W. Reverse production system infrastructure design for electronic products in the state of Texas. Comput. Ind. Eng. 2012, 62, 129–140. [Google Scholar] [CrossRef]
- Mar-Ortiz, J.; Adenso-Diaz, B.; González-Velarde, J.L. Design of a recovery network for WEEE collection: The case of Galicia, Spain. J. Oper. Res. Soc. 2011, 62, 1471–1484. [Google Scholar] [CrossRef]
- Qiang, S.; Zhou, X.Z. Robust reverse logistics network design for the waste of electrical and electronic equipment (WEEE) under recovery uncertainty. J. Environ. Biol. 2016, 37, 1153–1165. [Google Scholar]
- Elia, V.; Gnoni, M.G.; Tornese, F. Designing a sustainable dynamic collection service for WEEE: An economic and environmental analysis through simulation. Waste Manag. Res. 2019, 37, 402–411. [Google Scholar] [CrossRef]
- Achilles, C.; Aidonis, D.; Vlacokostas, C.; Moussiopoulos, N.; Triantafillou, D. A multi-objective decision-making model to select waste electrical and electronic equipment transportation media. Resour. Conserv. Rec. 2012, 66, 76–84. [Google Scholar] [CrossRef]
- Bal, A.; Satoglu, S.I. A goal programming model for sustainable reverse logistics operations planning and an application. J. Clean. Prod. 2018, 201, 1081–1091. [Google Scholar] [CrossRef]
- Alumur, S.A.; Nickel, S.; Saldanha-da-Gama Verter, V. Multi-period reverse logistics network design. Eur. J. Oper. Res. 2012, 220, 67–78. [Google Scholar] [CrossRef]
- Gomes, M.I.; Barbosa-Povoa, A.P.; Novais, A.Q. Modeling a recovery network for WEEE: A case study in Portugal. Waste Manag. 2011, 31, 1645–1660. [Google Scholar] [CrossRef]
- Kilic, H.S.; Cebeli, U.; Ayhan, M.B. Reverse logistics system design for the waste of electrical and electronic equipment (WEEE) in Turkey. Resour. Conserv. Recycl. 2014, 95, 120–132. [Google Scholar] [CrossRef]
- Moslehi, M.S.; Sahebi, H.; Teymour, A. A multi-objective stochastic model for a reverse logistics supply chain design with environmental considerations. J. Ambient Intell. Humaniz. Comput. 2021, 12, 8017–8040. [Google Scholar] [CrossRef]
- Yu, H.; Solvang, W. A stochastic programming approach with improved multi-criteria scenario-based solution method for sustainable reverse logistics design of waste electrical and electronic equipment (WEEE). Sustainability 2016, 8, 1331. [Google Scholar] [CrossRef]
- Achilles, C.; Vlachokostas, C.; Aidonis, D.; Moussiopoulos, N.; Lakovou, E.; Banias, G. Optimizing reverse logistics network to support policy-making in the case of Electrical and Electronic Equipment. Waste Manag. 2010, 30, 2592–2600. [Google Scholar] [CrossRef]
- Achilles, C.; Vlachokostas, C.; Moussiopoulos, N.; Banias, G. Decision support system for the optimal location of electrical and electronic waste treatment pants: A case study in Greece. Waste Manag. 2010, 30, 870–879. [Google Scholar] [CrossRef]
- Shokohyar, S.; Mansour, S. Simulation-based optimization of a sustainable recovery network for waste from electrical and electronic equipment (WEEE). Int. J. Comput. Integr. Manuf. 2013, 26, 487–503. [Google Scholar] [CrossRef]
- Gamberini, R.; Gebennini, E.; Manzini, R.; Ziveri, A. On the integration of planning and environmental impact assessment for a WEEEtransportation network: A case study. Resour. Conserv. Recycl. 2010, 54, 937–951. [Google Scholar] [CrossRef]
- Dat, L.Q.; Linh, D.T.T.; Chou Shuo-Yan Yu, V.F. Optimizing reverse logistic costs for recycling end-of-life electrical and electronic products. Expert Syst. Appl. 2012, 39, 6380–6387. [Google Scholar] [CrossRef]
- Ayvaz, B.; Bolat, B.; Aydin, N. Stochastic reverse logistics network design for waste of electrical and electronic equipment. Resour. Conserv. Recycl. 2015, 104, 391–404. [Google Scholar] [CrossRef]
- Duman, G.M.; Kongar, E.; Gupta, S.M. Estimation of electronic waste using optimized multivariate gray models. Waste Manag. 2019, 95, 241–249. [Google Scholar] [CrossRef] [PubMed]
- Tosarkani, B.M.; Amin, S.H.; Zolfagharinia, H. A scenario-based robust possibilistic model for a multi-objective electronic reverse logistics network. Int. J. Prod. Econ. 2020, 224, 107557. [Google Scholar] [CrossRef]
- Lv, J.; Du, S. Kriging Method-Based Return Prediction of Waste Electrical and Electronic Equipment in Reverse Logistics. Appl. Sci. 2021, 11, 3536. [Google Scholar] [CrossRef]
- Zhang, H.; Peeters, P.; Demeester, E.; Duflou, J.R.; Kellens, K. A CNN-Based Fast Picking Method for WEEE Recycling. Proc. CIRP 2022, 106, 264–269. [Google Scholar] [CrossRef]
- Guo, R.; Zhong, Z. A customer-centric IoT-based novel closed-loop supply chain model for WEEE management. Adv. Eng. Inform. 2023, 55, 101899. [Google Scholar] [CrossRef]
- Liao, G.H.W.; Luo, X. Collaborative reverse logistics network for electric vehicle batteries management from sustainable perspective. J. Environ. Manag. 2022, 324, 116352. [Google Scholar] [CrossRef]
- Neto, G.C.O.; Ruiz, M.S.; Correia, A.J.C.; Mendes, H.M.R. Environmental advantages of the reverse logistics: A case study in the batteries collection in Brazil. Production 2018, 28, e20170098. [Google Scholar]
- Najm, H.; Asadi-Gangraj, E. Designing a robust sustainable reverse logistics to waste of electrical and electronic equipment: A case study. Int. J. Environ. Sci. Technol. 2024, 21, 1559–1574. [Google Scholar] [CrossRef]
- Weng, J.; Zhang, L.; Tang, J.; Wang, Q.; Zhou, D. Employing spatio-temporal analysis and multi-period location to optimize waste photovoltaic recycling network. Sustain. Energy Technol. Assess. 2024, 68, 103881. [Google Scholar] [CrossRef]
- Koshta, N.; Patra, S.; Singh, S.P. A location-allocation model for E-waste acquisition from households. J. Clean. Prod. 2024, 440, 140802. [Google Scholar] [CrossRef]
- Correia, A.J.C.; de Oliveira Neto, G.C.; Metato, R.A.P.B.; de Araújo, S.A.; Amorim, M.; Kumar, V.; Matias, J. Evaluation of circular economy practices for management of the reverse chain of electronic waste in Brazil. J. Mater. Cycles Waste Manag. 2024, 26, 3699–3713. [Google Scholar] [CrossRef]
- Doan, L.T.T.; Amer, Y.; Lee, S.H.; Phuc, P.N.K.; Tran, T.T. Optimizing a reverse supply chain network for electronic waste under risk and uncertain factors. Appl. Sci. 2021, 11, 1946. [Google Scholar] [CrossRef]
- Shevchenko, T.; Saidani, M.; Danko, Y.; Golysheva, I.; Chovancová, J.; Vavrek, R. Towards a smart E-waste system utilizing supply chain participants and interactive online maps. Recycling 2021, 6, 8. [Google Scholar] [CrossRef]
- Ni, Z.; Chan, H.K.; Tan, Z. Systematic literature review of reverse logistics for e-waste: Overview, analysis, and future research agenda. Int. J. Logist. Res. Appl. 2023, 26, 843–871. [Google Scholar] [CrossRef]
- Nowakowski, P.; Kuśnierz, S.; Płoszaj, J.; Sosna, P. Collecting Small-Waste Electrical and Electronic Equipment in Poland—How Can Containers Help in Disposal of E-Waste by Individuals? Sustainability 2021, 13, 12422. [Google Scholar] [CrossRef]
- Mohamad, N.S.; Thoo, A.C.; Huam, H.T. The determinants of consumers’ E-waste recycling behavior through the lens of extended theory of planned behavior. Sustainability 2022, 14, 9031. [Google Scholar] [CrossRef]
- Shi, J.; Chen, W.; Verter, V. The joint impact of environmental awareness and system infrastructure on e-waste collection. Eur. J. Oper. Res. 2023, 310, 760–772. [Google Scholar] [CrossRef]
- Gautam, D.; Bolia, N. Developing an incentive-based model for efficient product recovery and reverse logistics. Bus. Strategy Environ. 2024, 33, 7972–7989. [Google Scholar] [CrossRef]
- Liu, T.; Cao, J.; Wu, Y.; Weng, Z.; Senthil, R.A.; Yu, L. Exploring influencing factors of WEEE social recycling behavior: A Chinese perspective. J. Clean. Prod. 2021, 312, 127829. [Google Scholar] [CrossRef]
- Jangre, J.; Prasad, K.; Patel, D. Analysis of barriers in e-waste management in developing economy: An integrated multiple-criteria decision-making approach. Environ. Sci. Pollut. Res. 2022, 29, 72294–72308. [Google Scholar] [CrossRef]
- Ghisellini, P.; Quinto, I.; Passaro, R.; Ulgiati, S. Circular economy management of waste electrical and electronic equipment (WEEE) in Italian urban systems: Comparison and perspectives. Sustainability 2023, 15, 9054. [Google Scholar] [CrossRef]
- Brito, J.L.R.D.; Ruiz, M.S.; Kniess, C.T.; Santos, M.R.D. Reverse remanufacturing of electrical and electronic equipment and the circular economy. Rev. Gestão 2022, 29, 380–394. [Google Scholar] [CrossRef]
- Guo, R.; Zhong, Z. Assessing WEEE sustainability potential with a hybrid customer-centric forecasting framework. Sustain. Prod. Consum. 2021, 27, 1918–1933. [Google Scholar] [CrossRef]
- Wang, B.; Li, H. Optimization of electronic waste recycling network designing. In Proceedings of the 2020 5th International Conference on Electromechanical Control Technology and Transportation (ICECTT), Nanchang, China, 15–17 May 2020; IEEE: Piscataway, NJ, USA, 2020; pp. 368–371. [Google Scholar]
- Safdar, N.; Khalid, R.; Ahmed, W.; Imran, M. Reverse logistics network design of e-waste management under the triple bottom line approach. J. Clean. Prod. 2020, 272, 122662. [Google Scholar] [CrossRef]
- Duman, G.M.; Kongar, E. ESG Modeling and Prediction uncertainty of electronic waste. Sustainability 2023, 15, 11281. [Google Scholar] [CrossRef]
- Moher, D.; Liberati, A.; Tetzlaff, J.; Altman, D.G.; Prisma Group. Preferred reporting items for systematic reviews and meta-analyses: The PRISMA statement. Int. J. Surg. 2010, 8, 336–341. [Google Scholar] [CrossRef]
- PMSP—Prefeitura Municipal de São Paulo. Pulsante, Moderna e Inclusiva; Conheça São Paulo—A Maior Metrópole da América Latina. Junho de 2023. Available online: https://capital.sp.gov.br/web/governo/w/institucional/348594 (accessed on 24 November 2024).
- Joseph, W.; Silva, G.A. Metropolitan governance and the problem of sociospatial fragmentation in Brazilian metropolises: The case of the metropolis of São Paulo. In Proceedings of the ENANPUR 2023, Belém, PA, Brazil, 22–26 May 2023; pp. 1–15. [Google Scholar]
- São Paulo: SMDU, 2014. Available online: https://gestaourbana.prefeitura.sp.gov.br/marco-regulatorio/plano-diretor/ (accessed on 24 November 2024).
- Empresa Paulista de Planejamento Metropolitano. Região Metropolitana de São Paulo. São Paulo: EMPLASA, 2024. Available online: https://publicacoes.agb.org.br/boletim-paulista/article/view/3310 (accessed on 24 November 2024).
- Instituto Brasileiro de Geografia e Estatística. São Paulo: Panorama. Rio de Janeiro: IBGE, 2023. Available online: https://cidades.ibge.gov.br/brasil/sp/sao-paulo/panorama (accessed on 24 November 2024).
- Fundação Sistema Estadual de Análise de Dados. Indicadores do Estado de São Paulo por Município; SEADE: São Paulo, Brazil, 2023. Available online: https://www.seade.gov.br/ (accessed on 24 November 2024).
- Geosampa, P. Mapa Digital da cidade de São Paulo. 2019. Available online: https://geosampa.prefeitura.sp.gov.br/PaginasPublicas/_SBC.aspx (accessed on 24 November 2024).
- de Araújo, S.A.; de Barros, D.F.; da Silva, E.M.; Cardoso, M.V. Applying computational intelligence techniques to improve the decision making of business game players. Soft Comput. 2019, 23, 8753–8763. [Google Scholar] [CrossRef]
- Mitchell, T.M. Machine Learning; McGraw-Hill: New York, NY, USA, 2010. [Google Scholar]
- da Silva Lourenço, W.; de Araujo Lima, S.J.; Alves de Araújo, S. TASNOP: A tool for teaching algorithms to solve network optimization problems. Comput. Appl. Eng. Educ. 2018, 26, 101–110. [Google Scholar] [CrossRef]
- Benvenga, M.A.; Araújo, S.A.D.; Librantz, A.F.; Santana, J.C.; Tambourgi, E.B. Application of simulated annealing in simulation and optimization of drying process of Zea mays malt. Eng. Agrícola 2011, 31, 940–953. [Google Scholar] [CrossRef]
- Rosa, J.M.; Guerhardt, F.; Júnior, S.E.R.R.; Belan, P.A.; Lima, G.A.; Santana, J.C.C.; Berssaneti, F.T.; Tambourgi, E.B.; Vanale, R.M.; de Araújo, S.A. Modeling and optimization of reactive cotton dyeing using response surface methodology combined with artificial neural network and particle swarm techniques. Clean Technol. Environ. Policy 2021, 23, 2357–2367. [Google Scholar] [CrossRef]
- de Oliveira Neto, G.C.; de Sousa, W.C. Economic and Environmental Advantage Evaluation of the Reverse Logistic Implementation in the Supermarket Retail. IFIP Adv. Inf. Commun. Technol. 2014, 439, 197–204. [Google Scholar]
- De Oliveira Neto, G.C.; Lucato, W.C. Production planning and control as a tool for eco-efficiency improvement and environmental impact reduction. Prod. Plan. Control 2016, 27, 148–156. [Google Scholar] [CrossRef]


Disclaimer/Publisher’s Note: The statements, opinions and data contained in all publications are solely those of the individual author(s) and contributor(s) and not of MDPI and/or the editor(s). MDPI and/or the editor(s) disclaim responsibility for any injury to people or property resulting from any ideas, methods, instructions or products referred to in the content. |
© 2025 by the authors. Licensee MDPI, Basel, Switzerland. This article is an open access article distributed under the terms and conditions of the Creative Commons Attribution (CC BY) license (https://creativecommons.org/licenses/by/4.0/).