Abstract
Today, considerable amounts of resources are landfilled or incinerated, and recyclable materials such as metal, glass, plastic, and paper are disposed of as residual waste instead of being sorted into recyclable fractions. Recycling is one way of transitioning towards a circular economy and a more resource-efficient society. However, in many older cities there is insufficient space for waste bins, which makes waste sorting difficult. The aim of the study was to test how the introduction of a new kerbside collection system, using different-coloured plastic bags, would influence the amounts of residual waste and separately collected food waste. Coloured plastic bags were introduced in an old city centre in Kalmar, in the southeast of Sweden. This type of kerbside collection was applied to 38 apartments with a total of 87 residents for four weeks. Results show that residual waste decreased directly by 15 percent and the collected amount of food waste increased directly by 35 percent. The residents perceived that the sorting system facilitated sorting and that the sorting of recyclable materials increased. Kerbside collection, close to properties, seemed to be an important factor in reducing the amount of residual waste, leading to increased sorting, and hence improved recycling.
1. Introduction
There are many arguments in favour of the improved management of natural resources, and the twelfth UN Sustainable Development Goal (SDG) emphasises the need for sustainable consumption and production [1,2]. In line with this goal lies the concept of a circular economy (CE), in which linear economies based on ‘take, make and dispose’ modes of production and consumption are replaced by closed material loops, such as those in Europe [3] and China [4]. From the CE point of view, waste materials should be considered as resources [5,6], and therefore waste management and initiatives for resource recovery should be important drivers.
The increasing amount of waste is a global problem, as well as a national and local one. According to a global review, the global amount of waste from households is estimated to grow by 50% between 2012 and 2025, from 1.3 to 1.95 billion tonnes per year [7]. In Sweden, for example, the total amount of waste from households was approximately 440 kg per person in 2016. This figure includes all waste, for example residual waste (garbage bags), packaging waste, wood, scrapped vehicles and other hazardous waste [8]. Residual waste accounts for about 180 kg per person (41%) of these waste amounts from households. Solid waste composition analyses of Swedish residual waste concluded that about 31–36% consisted of packaging waste and newspapers that had not been separated properly [9]. This amounts to approximately 60 kg per year and person in lost resources, or 600,000 tonnes in Sweden alone. Hence, there is great potential to reduce residual waste and sort packaging waste, newspapers, and food waste, and thereby increase recycling. The situation is similar in other parts of the world; for example, the European Environment Agency concludes that most countries have to make an extraordinary effort to meet Europe’s set recycling goals [10].
According to a recent review, the main influential factors for waste sorting at household level are (i) social demographic factors, such as age; (ii) economic incentives, such as waste fees; (iii) awareness and knowledge on recycling, and (iv) the system for waste collection [11]. In another review, the studied literature indicates that increased recycling can be achieved by using a combination of bring systems, kerbside (US English: curbside) collection and recycling banks [12].
In this article, the term ‘kerbside collection’ is used for the collection of different types of waste close to apartments. It may include coloured plastic bags with subsequent optical sorting; bags with mixed recyclables placed on the kerbside, with subsequent sorting; buildings close to the apartments with bins for different types of waste or multicompartment bins [13,14,15,16,17,18]. The term ‘bring collection’ or ‘drop-off collection’ is used when residents need to take their waste to a recycling station (drop-off point).
Despite the upsides of kerbside collection, this system is generally quite bulky, in which different waste fractions are sorted in different bins. In cities with older buildings and narrow streets, it is often difficult, or even impossible, to place multiple waste bins in the limited spaces available. To keep the distance to the recycling point sufficiently short, another kerbside collection system is therefore desirable. Kerbside collection with subsequent optical sorting could then be a solution for properties with insufficient space for several bins. This system means that waste is sorted by household members into different-coloured plastic bags and placed in a single large waste bin, followed by transportation to an optical sorting facility. This system has been implemented in three Swedish cities (Eskilstuna, Strängnäs, and Örebro) with the first city starting in 2010 and the latest in 2016, for single-family houses and more recently also in multi-family houses [19]. However, there has been no scientific reporting of the results of this system.
The aim of the study was to test how the introduction of a new kerbside collection system using different-coloured plastic bags for different types of waste influenced the amounts of residual waste and food waste from households located in a dense city centre. In addition, the perception of the new system among residents was evaluated.
2. Results
2.1. Waste Generated during the Pre-Measurement Phase
The results show that the average amount of residual waste was 2.90 kg/person/week (kg/p/w) in the pre-measurement period, and that the separated food waste amounted to, on average, 0.55 kg/p/w (see Table 1). For more data details, see Supplementary Materials.

Table 1.
The average amount (kg) of residual waste and sorted food waste per person and week calculated from the pre-measure and the sorting period in Property one (P1) and Property two (P2).
2.2. Changes upon the Introduction of Coloured Bags
When the coloured bags were introduced, the amount of residual waste fell and the separated food waste rose, to on average 2.47 kg/p/w and 0.73 kg/p/w, respectively (see Table 1 and Figure 3). This means that the residual waste fell by 15% and the separated food waste increased by 35%. By weight, the most dominant fractions were food waste, newspaper and other paper, followed by paper packaging and plastic packaging (Table 2 and Figure 1). One aspect contributing to uncertainty in the exact numbers is that we did not make a quantitative assessment of the share of missorting. However, the qualitative assessment is that the waste was properly sorted. Each bag was examined when the sorted coloured bags were manually opened after registration and sorted manually into each waste fraction for recycling.
Table 2.
Average amount (kg) of sorted packaging waste and newspaper and other paper by kg/person/week (kg/p/w) in Property one (P1), Property two (P2) and both properties.
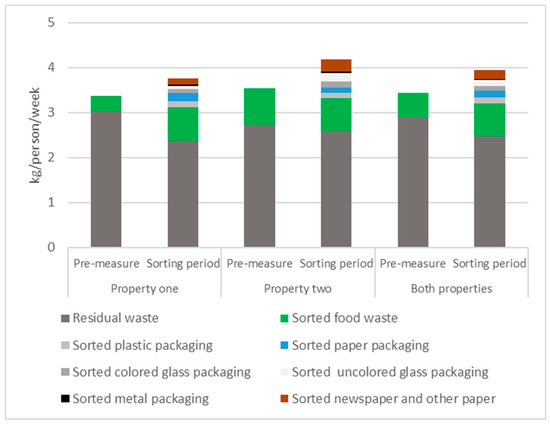
Figure 1.
The average amount of waste by type in Property 1 and Property 2 and both properties during pre-measure and sorting period (kg/person/ week).
The fact that the total amount of waste increased during the sorting period (Figure 1) was expected, since some of the packaging waste now sorted into coloured plastic bags and collected directly at the properties was probably brought to more distant recycling stations (drop-off points) before. Provided that the actual generated waste amounts in each household did not change significantly, this decrease implies that the fraction of sorted waste—which may be subjected to material recycling—has gone up.
2.3. Participant Interviews
The residents were interviewed about their experiences with the coloured bag system, how they thought it worked, and whether they found any difficulties with the sorting system. When asking about the functionality of the system (when presented with the statement “It worked well to sort with bags in the apartment”), six fully agreed and four partly agreed; the rest (five) were neutral or disagreed. One interviewee meant that this “was good and made you sort more, you have to adjust”, while another one said that “You recycle more, this was easy”. Those that thought it worked less well stated that “There is still a lack of space” and “It was a lot of bags!”. The lack of space in the apartments was an apparent issue, as residents mentioned that they needed to hang bags on door handles and put bags in closets to fit the system. When asked about the sorting of newspapers and paper packaging, they found it somewhat difficult to fit these into the bags. More than one interviewee found the system to be educational for their children as well: “Good and also fun to explain to the children”.
3. Discussion
As expected, given that these figures apply to properties in a city area with only minor possibilities to dispose of sorted waste fractions in their buildings, the weekly amounts of residual waste measured at Kvarnholmen are larger than in an average Swedish apartment (where separate food waste collection is available): on average 2.17 kg/p/w [9,20]. However, the average amount of food waste collected in the pre-measurement period was the same as the average in Swedish apartments: on average 0.55 kg/p/w [9,21].
The difference was chiefly explained by the changes measured in Property 1 (see Table 1). However, this property had greater amounts of residual waste and smaller amounts of sorted food waste to begin with, so the room for improvement was most likely higher. This difference in sorting efficiency between properties is difficult to explain. The only major known difference between the properties is the share of residents under the age of 18, which is much larger in Property 1. A study showed that schoolchildren were more accepting of implementing separate waste collection and collection systems than adults [22], and that children can affect their parents’ recycling behaviour in a positive way [23].
As already mentioned, three municipalities in Sweden use optical sorting in full scale. However, none of these municipalities have reported their findings in scientific literature, and results are only available from one municipality (personal communication), Eskilstuna (see Table 3). In that area, residual waste had decreased by 53% after seven years since the introduction of coloured plastic bags for optical sorting. In a Swedish study, it was shown that there was a 44% difference when comparing a municipality with kerbside collection to one with drop-off collection (Table 3) [14]. It also showed a rather large decrease in residual waste in two different municipalities when kerbside collection was introduced (numerical data not available, only graph). Also, when comparing areas with minor kerbside collection to areas with major kerbside collection (in Sweden), it was shown that the residual waste was 24% less in the latter areas. In a study from the Netherlands, plastic packaging decreased by 25% when kerbside collection was introduced for that type of waste [24]. Finally, in an area in Portugal, the difference in residual waste was 23% in a comparison between an area with kerbside and drop-off collection and an area with only drop-off collection [17]. In other words, our study and other studies consistently show decreased residual waste amounts when kerbside collection is introduced. The decrease in our study is not as large as in the other studies. One explanation for this could be that our measurement was performed directly after the introduction; behavioural changes often take time. The environmental benefit of a large-scale system with sorting in coloured bags partly depends on the choice of material for the bags, where renewable materials are preferable.
Table 3.
Change in residual waste (%) in different studies and regions after (1) the introduction of another waste collection system; or (2) comparisons for areas with different waste collection systems.
In this context, several qualitative studies show that people feel that the distance to the collection point for recyclable materials is critical for their recycling behaviour [25,26,27]. A study in Sweden showed that inhabitants with kerbside collection separated approximately twice the amount per person of plastic, metal and paper packaging materials compared to people in municipalities with drop-off systems [14]. The shorter distance in connection with kerbside collection and/or a higher density of drop-off points increased the amount of sorted recyclables in Portugal [17] and in the Czech Republic [18]. Still, there is potential for improved sorting, even with the introduction of kerbside collection, as packaging waste is still present [28]. In a study in Florida, USA it was found that kerbside collection resulted in better recycling than recycling banks and pay-as-you-throw [29].
If this reduction in residual waste from households (15%) could be achieved for the whole Kvarnholmen area, the decrease in residual waste would be about 30 kg/p/y, or almost 50 tonnes annually in the Kvarnholmen area alone (average amount of residual waste: 180 kg/p/y, population: 1845 persons [21]). And if this decrease could be reproduced in the whole of Sweden, the decrease would be around 300,000 tonnes (30 kg/p/y and 10,000,000 persons). This is in line with the numbers found in solid waste composition analyses in Swedish residual waste, in which about 31–36% was packaging waste and newspapers that had not been separated properly [9]. The resources lost in residual waste in Sweden currently amount to 600,000 tonnes, only taking into account residual waste from households. Consequently, if the reduction could be 30% instead of 15%, the potential to increase resource efficiency is significant. One way to achieve this is to introduce kerbside waste collection. This is in line with the waste hierarchy that has been adopted by most countries.
Convenience is a key controlling factor for the willingness to separate waste into recyclable fractions [25,30]. The relative success of kerbside collection probably lies in the availability that comes with the short distances. Accessibility is a crucial factor for successful recycling [31]. Local conditions are important when choosing a collection system and convenience is key [32]. Kerbside collection is a key element to improve waste management [33].
It is difficult to find solutions for waste handling in old areas with limited space. This problem is confirmed by the participant interviews, where several indicated that the lack of space was a key obstacle, even with this option. It is also difficult to install more drop-off collection points, due to the lack of space in the vicinity of the properties, and it would also detract from the impression of the old city. Underground waste systems (UWS) could be another suitable option, but it comes with major challenges: permits, high cost, and underground pipes and cables in the way. As it would most likely be difficult to install such systems in the vicinity, a type of drop-off collection is required. The Swedish Government very recently decided that a law should be introduced requiring property owners to provide kerbside waste collection [34].
4. Materials and Methods
“Kvarnholmen” is an area in the city centre of Kalmar, which is situated in the southeast of Sweden (see Figure 2). Kvarnholmen, with about 1800 inhabitants, has historical parts dating back to the mid-17th century. These parts are characterised by narrow streets and old buildings with little room for waste handling. Thus, waste management challenges in Kvarnholmen include a lack of space in waste collection rooms, narrow cobblestone streets and heavy traffic [35]. The lack of space leads to only a few types of waste bin in proximity to residents, often just for residual waste and food waste. For other types of recycling, residents need to take their waste to a recycling station further away. This situation is common in other cities in Sweden.
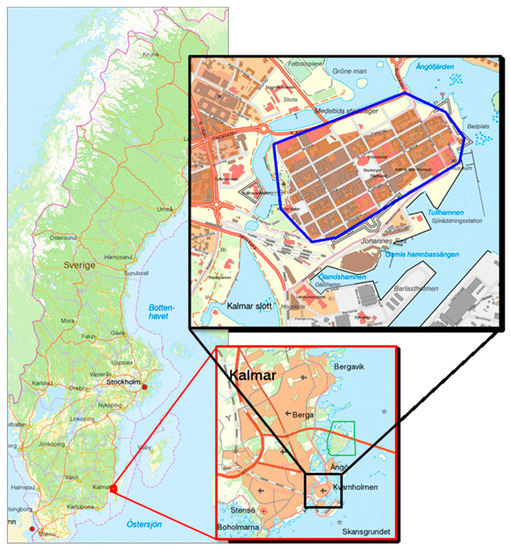
Figure 2.
The study area Kvarnholmen in the city of Kalmar, in the southeast of Sweden.
Optical sorting of food waste into green bags has been in operation in Kalmar since 2014. In the current kerbside collection system on Kvarnholmen, apartment residents throw their green bags in the same bin as the residual waste, and the green bags are subsequently sorted optically. Other recyclable fractions are generally referred to drop-off systems located outside Kvarnholmen.
To test the concept of additional coloured bags (and not only green ones) in Kvarnholmen, two properties were selected for the collection of different types of waste for four weeks. Property 1 had 23 apartments and Property 2 had 15 apartments. Only residents had access to the waste rooms, so waste from other properties could not be disposed of there. There were 87 residents in total in these apartments. In both properties, the distribution between sexes was roughly even, with 52% women in Property 1 and 51% women in Property 2. The average age was 25 and 29 years, respectively. One major difference was the share of children (under 18 years), which was 32% in Property 1 and 16% in Property 2 [21]. All households were aware of the trial through direct communication and posters about the project in the waste room. There was no study of the efficiency of the waste handling at Kvarnholmen prior to our study.
A pre-measurement of the waste was carried out for four weeks (in March 2018) before the introduction of the coloured bags to determine the amount of generated waste—residual waste and green bags—before the introduction of additional coloured bags. The weighing was performed in the morning, just before the waste was collected by the local waste management company (KSRR), three times a week. The same balance (Acculab model SVI 10A) with three decimal places (capacity 10kg, resolution 1g) was used throughout all the weight measurements.
Before the introduction of coloured bags, information about the project was communicated to residents via individual letters. Each household also received a voucher for coffee. Bags and small waste baskets with coloured plastic bags were then delivered to the residents in the beginning of April 2018 (Figure 3), together with a guide on how the residents should sort their waste. With the additional coloured bags, sorting of eight types of waste was possible: in addition to the food waste (green) and mixed waste (in ordinary plastic bags), also plastic packaging (orange), paper packaging (yellow), metal packaging (grey), coloured glass (black), uncoloured glass (transparent), newspapers and other paper (blue). Glass was included in this pilot phase, however due to risk of broken glass it might not be included in a potential full scale. Disposal of the coloured bags was done in the same bins that were normally used for residual waste and food waste, thus the residents did not need to do any sorting in the waste room.
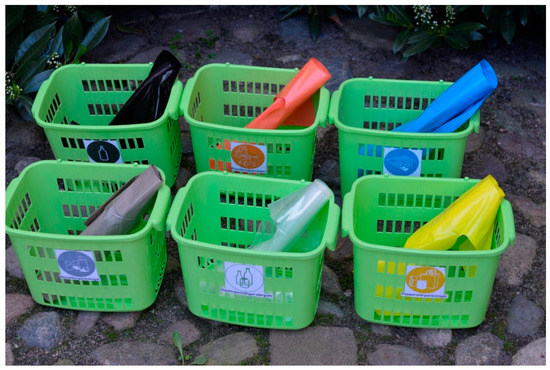
Figure 3.
Waste baskets and coloured bags labelled with the type of waste that should go into each bag that was used in the project. Food waste (green bags) and residual waste (other bags) was already collected from the properties prior to the project.
All the practical work was carried out in collaboration with the local waste collection company (KSRR) that developed routines for safeguarding that waste from the test properties was kept separated from waste from other properties. During the four weeks of sorting (mid-April to mid-May 2018) in coloured bags, KSRR collected the waste from the properties in bins 3 times per week and drove them to a separate space at a specific site near a recycling centre. Each bin was marked with the property name to ensure that the waste from the two properties was not mixed together. Since the aim was to test households’ performance when they were given the opportunity to use different-coloured bags for waste sorting before investing in expensive sorting machines, no actual optical sorting took place at this evaluation step. Instead, the coloured bags were sorted manually by the project members at the site close to the recycling centre. Each waste fraction was weighed separately and then funnelled into the correct type of waste at the centre.
The pre-measurement and test periods were selected to be comparable from a waste-generating perspective (the same season of the year, no big holidays, and so on).
After the sorting period using coloured bags, all participants were invited to individual interviews to evaluate their experience of the new system. As a result, 15 structured interviews were held face to face. One potential sampling issue is that those who agreed to participate in the interview might have had a more positive attitude towards using the system. We could not monitor the involvement in each household and the interviews were held with 15 households that had sorted. We did not measure the involvement within households.
5. Conclusions
International goals and strategies want to see closed material loops to increase resource efficiency. The evaluation of different strategies to achieve a decrease in residual waste is therefore highly interesting. A decrease in residual waste leads to increased sorting of waste, which in turn enhanceses the possibility of recycling.
The study shows that when a system using coloured bags for kerbside collection of different waste fractions was introduced, the amount of residual waste decreased directly by 15%, and the amount of sorted food waste increased directly by 35%. The perception of this system among the participating households, which answered a questionnaire, was that two thirds were fully or partially satisfied with the new system, notwithstanding comments about the size, material and quality of the plastic bags.
Earlier studies have shown that kerbside collection results in less packaging waste in the residual waste, which indicates improved sorting. This theory can be applied to the findings in this study and reinforces our conclusion that the residents increased their sorting of recyclable packaging, newspaper and other paper. In dense city centres, where there is no space for extra bins, coloured plastic bags could be an effective solution. This study supports that waste collection close to homes has an effect and is one way of enhancing the transition to a more resource-efficient society and a circular economy.
Supplementary Materials
The amount of waste collected from each property at each time of collection is found in https://www.mdpi.com/2313-4321/4/2/20/s1.
Author Contributions
Conceptualisation, L.S.; methodology, L.S. and E.V.; validation, L.S. and E.V.; formal analysis, L.S. and E.V.; investigation, E.V. and S.J.; writing—original draft preparation, L.S. and E.V.; writing—review and editing, L.S., E.V., A.A., J.R. and S.J.; visualisation, L.S.; supervision, A.A.; project administration, A.A.; funding acquisition, A.A.
Funding
This research was funded by Vinnova (Sweden’s Innovation Agency) Grant 2017-03290.
Acknowledgments
The project team would like to thank all the residents who live in the properties in question and contributed to the project, as well as the two property owners that consented to take part in the project. KSRR (Kalmarsundsregionens Renhållare, the regional waste collection company), provided highly valuable input to the practical details of the project; Peter Mellbo and his colleagues made a great contribution. Three anonymous reviewers contributed to the article with their comments, Thank you!
Conflicts of Interest
The authors declare no conflict of interests. The funders had no role in the design of the study; in the collection, analyses, or interpretation of data; in the writing of the manuscript, or in the decision to publish the results.
References
- Lukman, R.K.; Glavič, P.; Carpenter, A.; Virtič, P. Sustainable consumption and production—Research, experience, and development—The Europe we want. J. Clean. Prod. 2016, 138, 139–147. [Google Scholar] [CrossRef]
- United Nations. Sustainable Development Knowledge Platform. 2018. Available online: https://sustainabledevelopment.un.org (accessed on 2 July 2018).
- European Commission. Communication from the European Parliament the Council, the European Economic and Social Committee and the Committee of the Regions, Closing the Loop—An EU Action Plan for the Circular Economy; European Commission: Brussels, Belgium, 2015. [Google Scholar]
- Mathews, J.A.; Tan, H. Progress toward a circular economy in China: The drivers (and inhibitors) of eco-industrial initiative. J. Ind. Ecol. 2011, 15, 435–457. [Google Scholar] [CrossRef]
- Ghisellini, P.; Cialani, C.; Ulgiati, S. A review on circular economy: The expected transition to a balanced interplay of environmental and economic systems. J. Clean. Prod. 2016, 114, 11–32. [Google Scholar] [CrossRef]
- Ellen Macarthur Foundation. Towards the Circular Economy; Ellen MacArthur Foundation: Cowes, UK, 2013. [Google Scholar]
- Hoornweg, D.; Bhada-Tata, P. What a Waste: A Global Review of Solid Waste Management; World Bank: Washington, DC, USA, 2012. [Google Scholar]
- SStatistics Sweden. Generated Waste by Economic Activity NACE Rev. 2 and Households and by Waste Category. Every Second Year 2010–2016. 2018. Available online: http://www.statistikdatabasen.scb.se/pxweb/en/ssd/START__MI__MI0305/MI0305T01/?rxid=65dbeef6-179e-4f1d-9a40-decf935829d6 (accessed on 19 June 2018).
- The Swedish Waste Management Association. What is Thrown by Households in the Garbage. National Compilation of Sorting Analyses of Household and Food Waste from Households; The Swedish Waste Management Association: Malmö, Sweden, 2016. [Google Scholar]
- European Environment Agency. Managing Municipal Solid Waste: A Review of Achievements in 32 European Countries; Publications Office of the European Union: Copenhagen, Denmark, 2013. [Google Scholar]
- Mwanza, B.G.; Mbohwa, C.; Telukdarie, A. Levers Influencing Sustainable Waste Recovery at Households Level: A Review. Procedia Manuf. 2018, 21, 615–622. [Google Scholar] [CrossRef]
- Xevgenos, D.; Papadaskalopoulou, C.; Panaretou, V.; Moustakas, K.; Malamis, D. Success stories for recycling of MSW at municipal level: A review. Waste Biomass Valoriz. 2015, 6, 657–684. [Google Scholar] [CrossRef]
- Hurd, D.J. Best Practices and Industry Standards in PET Plastic Recycling; Department of Community, Trade, and Economic Development’s Clean Publisher: Washington, WA, USA, 1997. [Google Scholar]
- Dahlén, L.; Vukicevic, S.; Meijer, J.E.; Lagerkvist, A. Comparison of different collection systems for sorted household waste in Sweden. Waste Manag. 2007, 27, 1298–1305. [Google Scholar] [CrossRef] [PubMed]
- Fråne, A.; Stenmarck, Å.; Castell Rüdenhausen, M.; Gíslason, S.; Raadal, H.L.; Løkke, S.; Wahlström, M. Nordic Improvements in Collection and Recycling of Plastic Waste; Nordic Council of Ministers: Copenhagen, Denmark, 2015. [Google Scholar]
- Rousta, K.; Bolton, K.; Lundin, M.; Dahlén, L. Quantitative assessment of distance to collection point and improved sorting information on source separation of household waste. Waste Manag. 2015, 40, 22–30. [Google Scholar] [CrossRef] [PubMed]
- Martinho, G.; Gomes, A.; Santos, P.; Ramos, M.; Cardoso, J.; Silveira, A.; Pires, A. A case study of packaging waste collection systems in Portugal - Part I: Performance and operation analysis. Waste Manag. 2017, 61, 96–107. [Google Scholar] [CrossRef]
- Struk, M. Distance and incentives matter: The separation of recyclable municipal waste. Resour. Conserv. Recycl. 2017, 122, 155–162. [Google Scholar]
- Nygren, J. (Eskilstuna Energi och Miljö, Eskilstuna, Sweden). Personal communication, 2018.
- Statistics Sweden. Average Amount of Persons in a Household (2017). 2018. Available online: http://www.statistikdatabasen.scb.se/pxweb/en/ssd/START__HE__HE0111/HushallT30/?rxid=99b27931-b0df-413f-a819-923ccb4dff16 (accessed on 1 June 2018).
- Statistics Sweden. Data Retrieval from Different Registers about the Residents in the Properties in the Study; Statistics Sweden: Örebro, Sweden, 2018. [Google Scholar]
- Miafodzyeva, S.; Brandt, N.; Olsson, M. Motivation Recycling: Pre-Recycling Case Study in Minsk. Belarus. Waste Manag. Res. 2010, 28, 340–346. [Google Scholar] [CrossRef]
- Ekström, K.M. Parental Consumer Learning or ‘Keeping Up with the Children’. J. Consum. Behav. Int. Res. Rev. 2007, 6, 203–217. [Google Scholar] [CrossRef]
- Goorhuis, M.; Reus, P.; Nieuwenhuis, E.; Spanbroek, N.; Sol, M.; van Rijn, J. New developments in waste management in The Netherlands. Waste Manag. Res. 2012, 30 (Suppl. 9), 67–77. [Google Scholar] [CrossRef]
- Vencatasawmy, C.P.; Öhman, M.; Brännström, T. A survey of recycling behaviour in households in Kiruna, Sweden. Waste Manag. Res. 2000, 18, 545–556. [Google Scholar] [CrossRef]
- Gonzalez-Torre, P.L.; Adenso-Diaz, B. Influence of distance on the motivation and frequency of household recycling. Waste Manag. 2005, 25, 15–23. [Google Scholar] [CrossRef]
- Rousta, K.; Bolton, K.; Dahlén, L. A procedure to transform recycling behavior for source separation of household waste. Recycling 2016, 1, 147–165. [Google Scholar] [CrossRef]
- Bernstad, A.; la Cour Jansen, J.; Aspegren, H. Local strategies for efficient management of solid household waste--the full-scale Augustenborg experiment. Waste Manag. Res. 2012, 30, 200–212. [Google Scholar] [CrossRef]
- Park, S.; Berry, F.S. Analyzing effective municipal solid waste recycling programs: The case of county-level MSW recycling performance in Florida, USA. Waste Manag. Res. 2013, 31, 896–901. [Google Scholar] [CrossRef]
- Bom, U.B.; Belbase, S.; Lila, R.B. Public perceptions and practices of solid waste recycling in the city of laramie in Wyoming, USA. Recycling 2017, 2, 11. [Google Scholar] [CrossRef]
- Oke, A.; Kruijsen, J. The Importance of Specific Recycling Information in Designing a Waste Management Scheme. Recycling 2016, 1, 271–285. [Google Scholar] [CrossRef]
- Rousta, K.; Ordoñez, I.; Bolton, K.; Dahlén, L. Support for designing waste sorting systems: A mini review. Waste Manag. Res. 2017, 35, 1099–1111. [Google Scholar] [CrossRef] [PubMed]
- Zaman, A.U. A Strategic Framework for Working toward Zero Waste Societies Based on Perceptions Surveys. Recycling 2017, 2, 1. [Google Scholar] [CrossRef]
- Swedish Government. Mer tillgänglig källsortering nära hemmet. 2018. Available online: https://www.regeringen.se/pressmeddelanden/2018/06/mer-tillganglig-kallsortering-nara-hemmet/ (accessed on 30 April 2019).
- Smith, E. Waste Managment in Urban Areas with Lack of Space, the Example Kvarnholmen; Linnaeus University: Kalmar, Sweden, 2016. [Google Scholar]


© 2019 by the authors. Licensee MDPI, Basel, Switzerland. This article is an open access article distributed under the terms and conditions of the Creative Commons Attribution (CC BY) license (http://creativecommons.org/licenses/by/4.0/).