Article

Comparison of Sodium Hydroxide and Sodium Carbonate as Alkali Catalysts in Ethanol Organosolv Treatment of Cotton Stalks for the Release of Hydroxycinnamates

by
Georgia Papadimitriou
,
Vassiliki Zarnavalou
,
Theodoros Chatzimitakos
,
Dimitrios Palaiogiannis
,
Vassilis Athanasiadis
,
Stavros I. Lalas
and
Dimitris P. Makris
*
Green Processes & Biorefinery Group, Department of Food Science & Nutrition, School of Agricultural Sciences, University of Thessaly, N. Temponera Street, 43100 Karditsa, Greece
*
Author to whom correspondence should be addressed.
Recycling 2024, 9(2), 21; https://doi.org/10.3390/recycling9020021
Submission received: 7 December 2023 / Revised: 23 January 2024 / Accepted: 23 February 2024 / Published: 1 March 2024

Abstract

:
Cotton stalks are residual biomass resulting from cotton bud harvesting, and they are composed primarily of lignocellulosic material. This material could be a source of functional polyphenols. To investigate this prospect, this study was undertaken with the view to examining whether an ethanol-based organosolv treatment could be suitable for producing extracts enriched in polyphenolic compounds. To this end, alkali catalysis was employed, and two catalysts, sodium hydroxide and sodium carbonate, were tested. The initial approach based on treatment severity showed that both catalysts may be equally effective in the recovery of polyphenols, yet in most cases studied, no clear trend between treatment severity and total polyphenol yield was recorded. The following study, based on response surface methodology, provided optimized conditions for both treatments, sodium hydroxide and sodium carbonate, where the recommended catalyst concentrations were 0.67 and 4%, respectively. Under a constant temperature of 90 °C and residence time of 300 min, the treatments with sodium hydroxide and sodium carbonate afforded total polyphenol yields of 18.4 ± 1 and 15.6 ± 1.9 mg CAE g−1 DM, respectively, which showed no significant statistical difference (p > 0.05). However, high-performance liquid chromatography analyses revealed that the sodium carbonate-catalyzed treatment produced extract particularly enriched in two hydroxycinnamate derivatives, ferulic and p-coumaric acid. This extract also exhibited increased antioxidant activity. The outcome of this study strongly suggests cotton stalks as a bioresource of functional substances, while mild alkali-catalyzed ethanol organosolv treatment appears to be a very promising technique for effectively delivering hydroxycinnamate-enriched extracts.

1. Introduction

The agricultural sector is a critical part of the world’s economy, providing food resources to sustain the global population, but also several industrial crops and products, which are the raw materials for a spectrum of commodities essential to human wellbeing. As a result of the unprecedented intensification of agricultural production, there is, to date, an ever-increasing accumulation of waste biomass, which stems from farming practices (i.e., pruning, exfoliation), post-harvest handling (i.e., losses due to damaged products, rejection of defected products), and processing to remove undesired tissues (i.e., roots, peels, stems, stalks, etc.). The inappropriate handling and disposal of these residual materials may bring about detrimental consequences to ecosystems by provoking severe pollution and environmental degradation [1].
On the other hand, it has been well documented that agricultural side streams are composed of an array of bio-organic molecules, which may be used as feedstock for the generation of energy (i.e., biofuels), chemical building blocks (platform molecules), and the production of high-value-added compounds, such as natural antioxidants and pigments [2,3,4]. On this basis, the role of biorefinery strategies is of paramount importance, offering innovative and pioneering routes for waste biomass exploitation and bioproduct development. Such approaches may then be integrated into wider policies for establishing sustainable production systems, within a general bioeconomy framework [5,6].
The biomass derived from plant tissues such as barks, stalks, and stems may be characterized by high recalcitrance, owing to compact matrices occurring in plant tissues, which are largely composed of structures of particular complexity, such as lignocellulosic networks. Thus, a primary target in converting plant material into valuable substances is the disintegration of the plant tissue structure and the untangling of the lignocellulosic complex. Such processes may afford bio-polymers, including lignin, hemicellulose, and cellulose, at varying yields and degrees of purity. To achieve such a goal, the state-of-the-art techniques employ harsh conditions of temperature, time, and acid or alkali catalysts to disrupt lignocellulosic structures and obtain, mainly, cellulose, free from lignin and hemicellulose, which can then be readily accessible by hydrolytic enzymes and effectively converted into fermentable sugars [7,8]. One major route to perform such a task is the so-called organosolv pretreatment, which consists of exposing the biomass to media composed of water/solvent mixtures and relatively increased temperatures. This pretreatment stage results in efficient removal of lignin and hemicellulose, yielding usually high-purity cellulose [9].
However, approaches such as those mentioned above are focused on delivering a specific family of molecules (sugars), which can be utilized either as a platform compound or as a fermentation substrate to produce bioethanol. The recovery of other high-value-added chemicals, such as polyphenols, is largely disregarded, and this might limit both the applicability and the profitability of similar processes within a biorefinery concept. Recently, techniques such as organosolv treatment have been explicitly proposed as effective means of recovering polyphenolic phytochemicals from plant food processing wastes, such as olive leaves [10] and orange peels [11]. Thus, the concept of organosolv treatment has been expanded to high-value-added compounds as a particularly promising technique.
Cotton (Gossypium) is a perennial plant commercially cultivated as an annual plant in many areas around the globe. The most utilized part of the plant is the cotton bud, which is the raw material for a multitude of industrial products, such as textiles, livestock feed, edible oil, personal care, medicinal products, etc. [12]. Cotton fiber has many convenient attributes, such as color retention, strength, and absorbency, and therefore it is not surprising that world cultivation rose to an approximate production of over 23 million tons in 2013–2014. This increase entailed the generation of tons of waste remaining after harvesting and processing (ginning), consisting mainly of cotton post-harvest field residues, gin trash (CGT), and seed meal resulting from cottonseed oil production [13].
Post-harvest residues are the remaining parts of the cotton plant left in the field, primarily the stalks of the plant, a side stream of bud harvesting. This waste biomass is usually exploited as soil compost, and thus hitherto has only been added to the value chain at a low level. However, a few reports have documented the occurrence of bioactive polyphenolic substances, including p-coumaric acid and ferulic acid [14], but also gallic acid, protocatechuic acid, p-hydroxybenzoic acid, and flavonoids such as quercetin and apigenin [15]. On this conceptual basis, the examination described herein had, as its scope, to study the ethanol-based organosolv treatment of cotton stalks, with the aim of (i) investigating the possibility of recovering polyphenolic phytochemicals, and (ii) optimizing polyphenol release/recovery. Treatment appraisal was based on both the severity and response surface optimization, as well as on the composition of the extracts generated. This was achieved by tentatively identifying the principal polyphenolic constituents detected in the extracts. Antioxidant activity was also used as an additional criterion of treatment assessment. To the best of the authors’ knowledge, this is the first study on alkali-catalyzed ethanol-based organosolv treatment of cotton stalks for bioactive polyphenol recovery.

2. Results and Discussion

2.1. Treatment Severity and Catalyst Effects

The examinations pertaining to the effect of treatment severity and the role of the two alkali catalysts tested, sodium hydroxide (SoHy) and sodium carbonate (SCar), were appraised by determining the combined severity factor (CSF) and the alternative severity factor (CSF’). To investigate these effects over a range of severities, treatments were performed under various combinations of catalyst concentration and holding time.
The results obtained using SCar as the catalyst are presented in Table 1, and it can be seen that significantly higher YTP (16.2 ± 1 mg CAE g−1 DM) was attained with a catalyst concentration (CSCar) of 4% and holding time of 300 min (p < 0.05). These conditions corresponded to a CSF of −9.75 and CSF′ of 7.11. By contrast, combinations including higher CSCar with any holding time (60–300 min) resulted in significantly lower YTP (p < 0.05). This fact indicated that a CSCar higher than 4% did not favor the recovery of total polyphenols.
For the SoHy-catalyzed treatment, significantly higher YTP was achieved with a CSoHy of either 0.5 or 1% and a holding time of 300 min (p < 0.05). However, the CSF′ for the treatment with a CSoHy of 0.5% was significantly lower compared to the corresponding for the treatment with a CSoHy of 1% (p < 0.05). Thus, effective treatment was accomplished with a CSoHy of 0.5%, at 300 min, which corresponded to a CSF′ of 7.99 (Table 2).
To ascertain whether YTP exhibited any correlation with treatment severity, linear and non-linear regressions between YTP and either CSF or CSF′ were attempted (Figure 1). The results obtained showed that a statistically significant linear correlation existed only for the SoHy-catalyzed treatment, described by the following model:
YTP = 3.20CSFSoHy + 52.20 (R2 = 0.72, p = 0.0038)
For all the other cases examined, no significant linear or quadratic correlation was seen. This outcome suggested that increased severity of either SoHy or SCar-catalyzed treatment did not produce a proportional effect with regard to YTP. Therefore, it could be argued that YTP can be maximized only under specific combinations of catalyst concentration and holding time. This finding contrasts with previous studies, which demonstrated that increases in polyphenol recovery from wheat bran were directly associated with elevated levels of severity, using pressurized water/ethanol mixtures [16]. Later studies on wheat bran were in close accordance, illustrating a significant correlation between the severity of acid/alkaline ethanol organosolv treatment with total polyphenol yield [17]. A very high correlation between YTP and either CSF or CSF′ was also found for the alkali-catalyzed organosolv treatment of oat bran [18], aiming at maximizing polyphenol recovery.

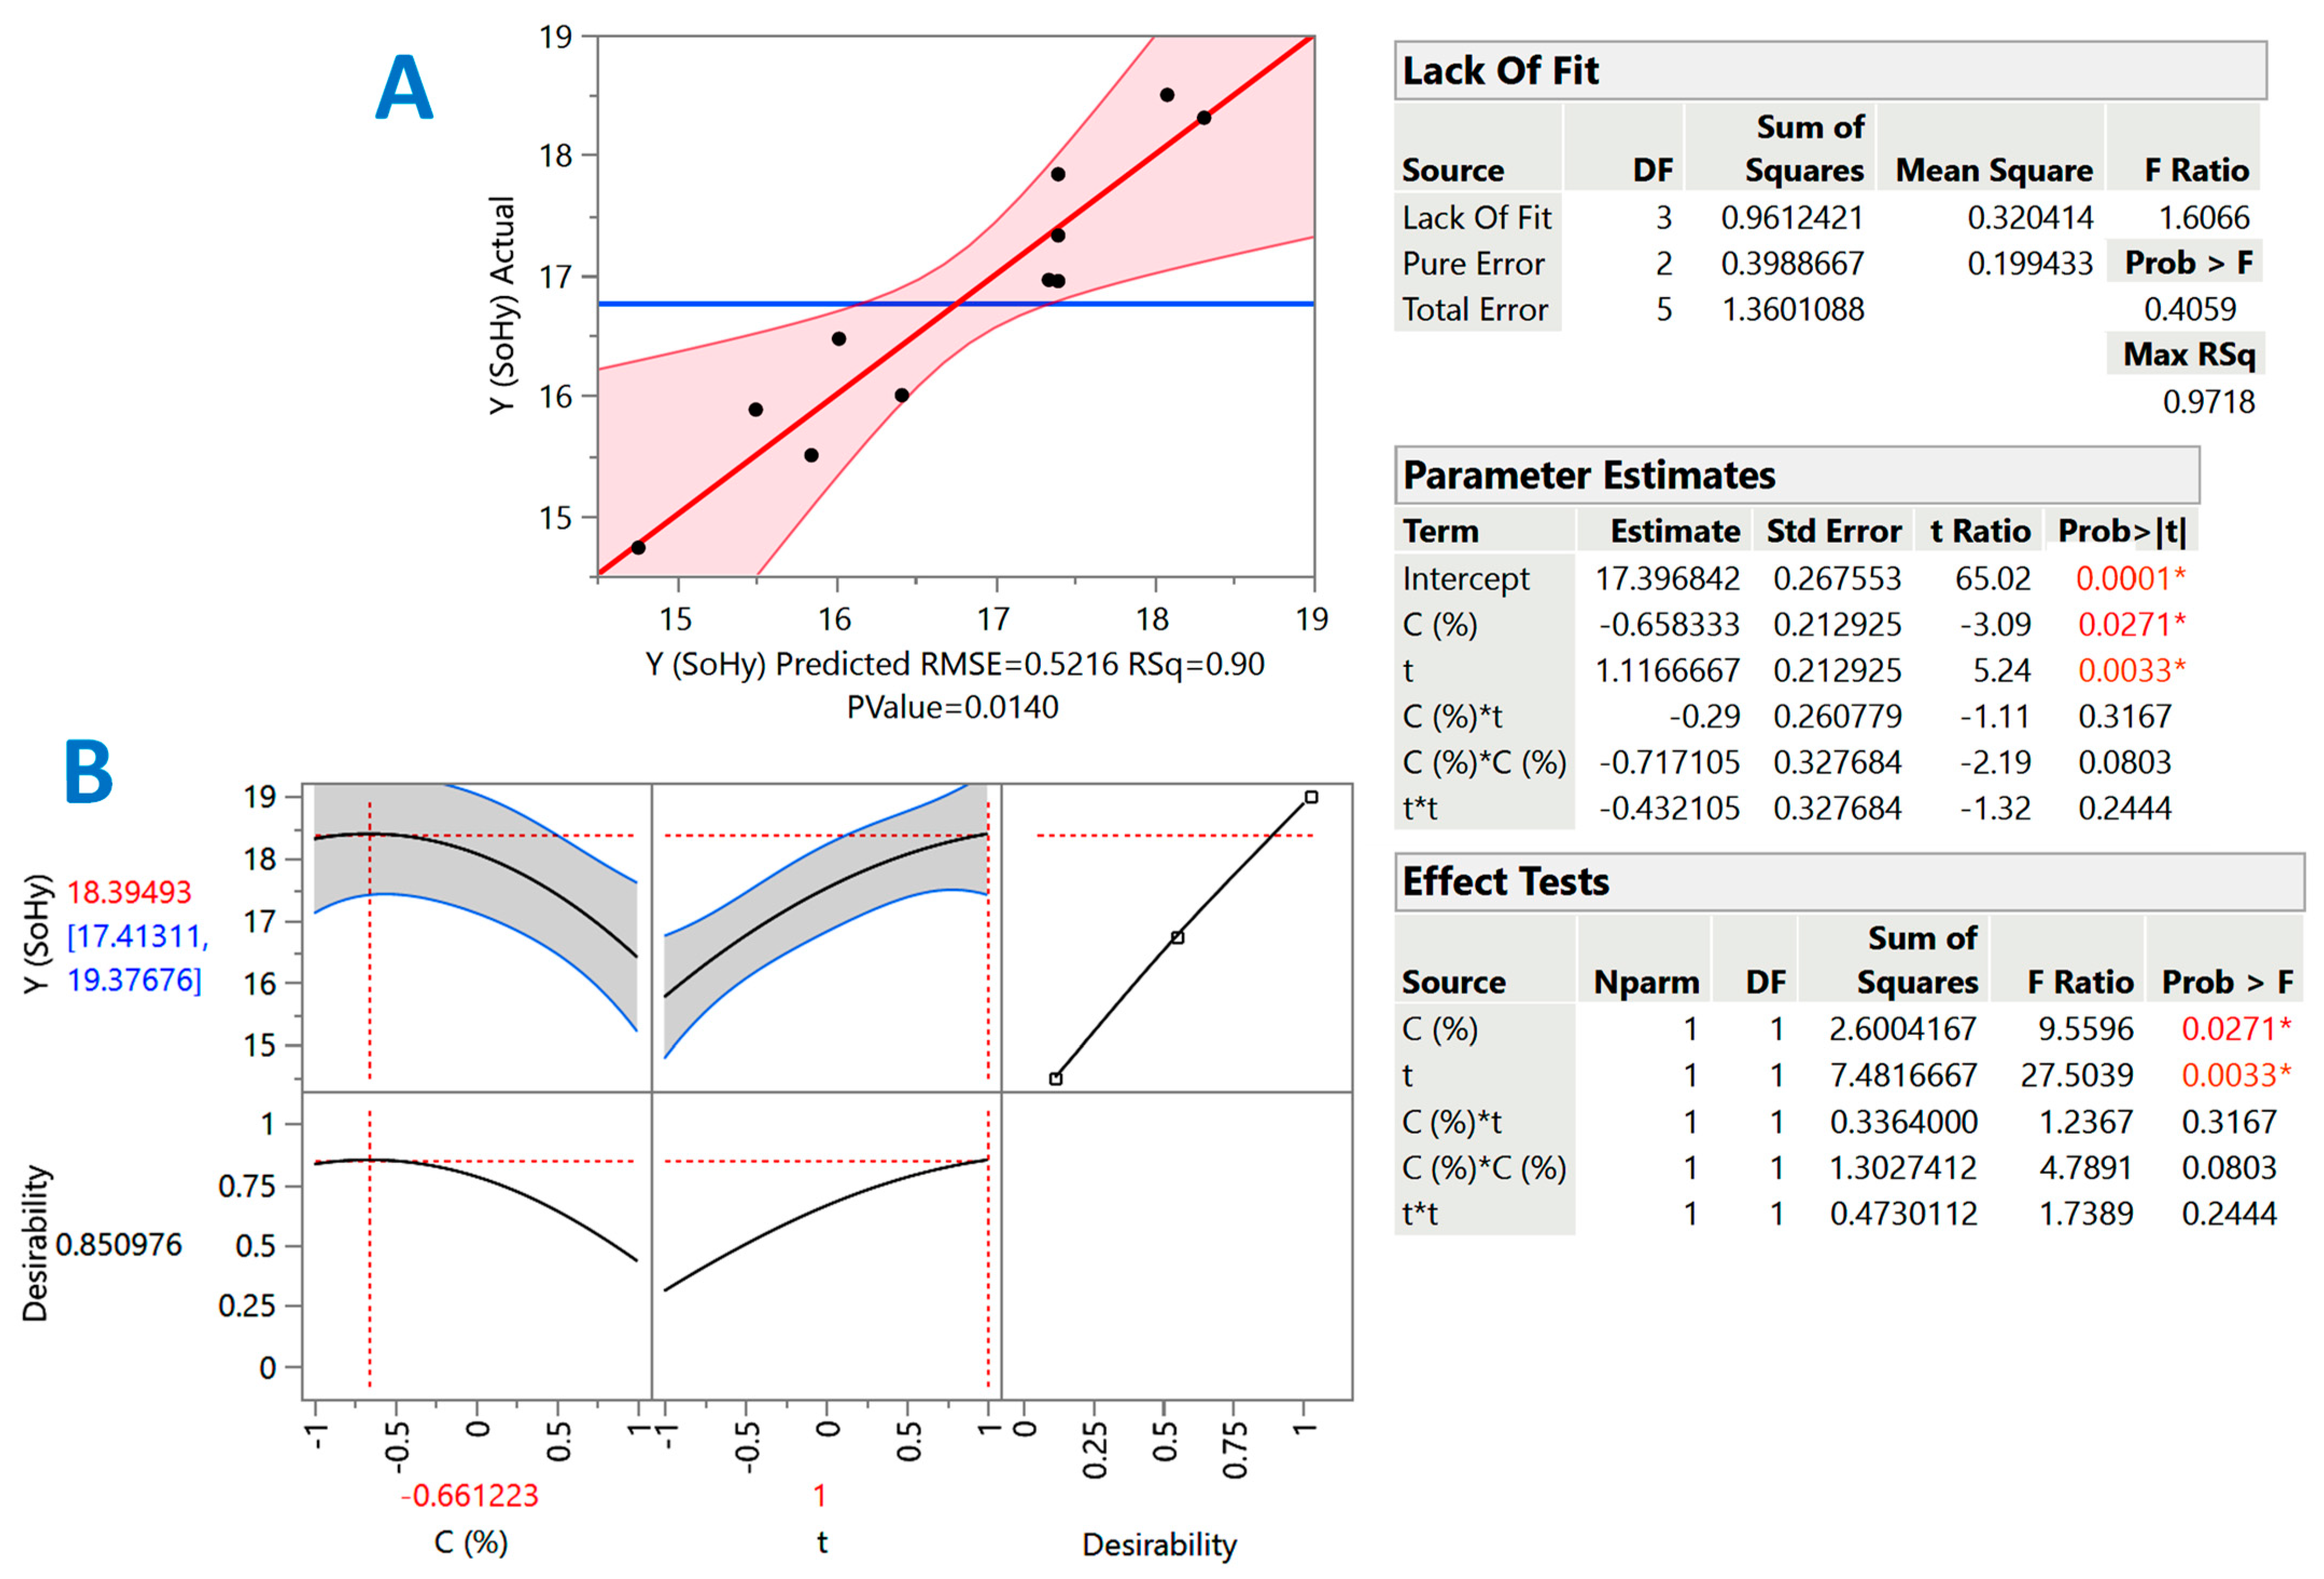
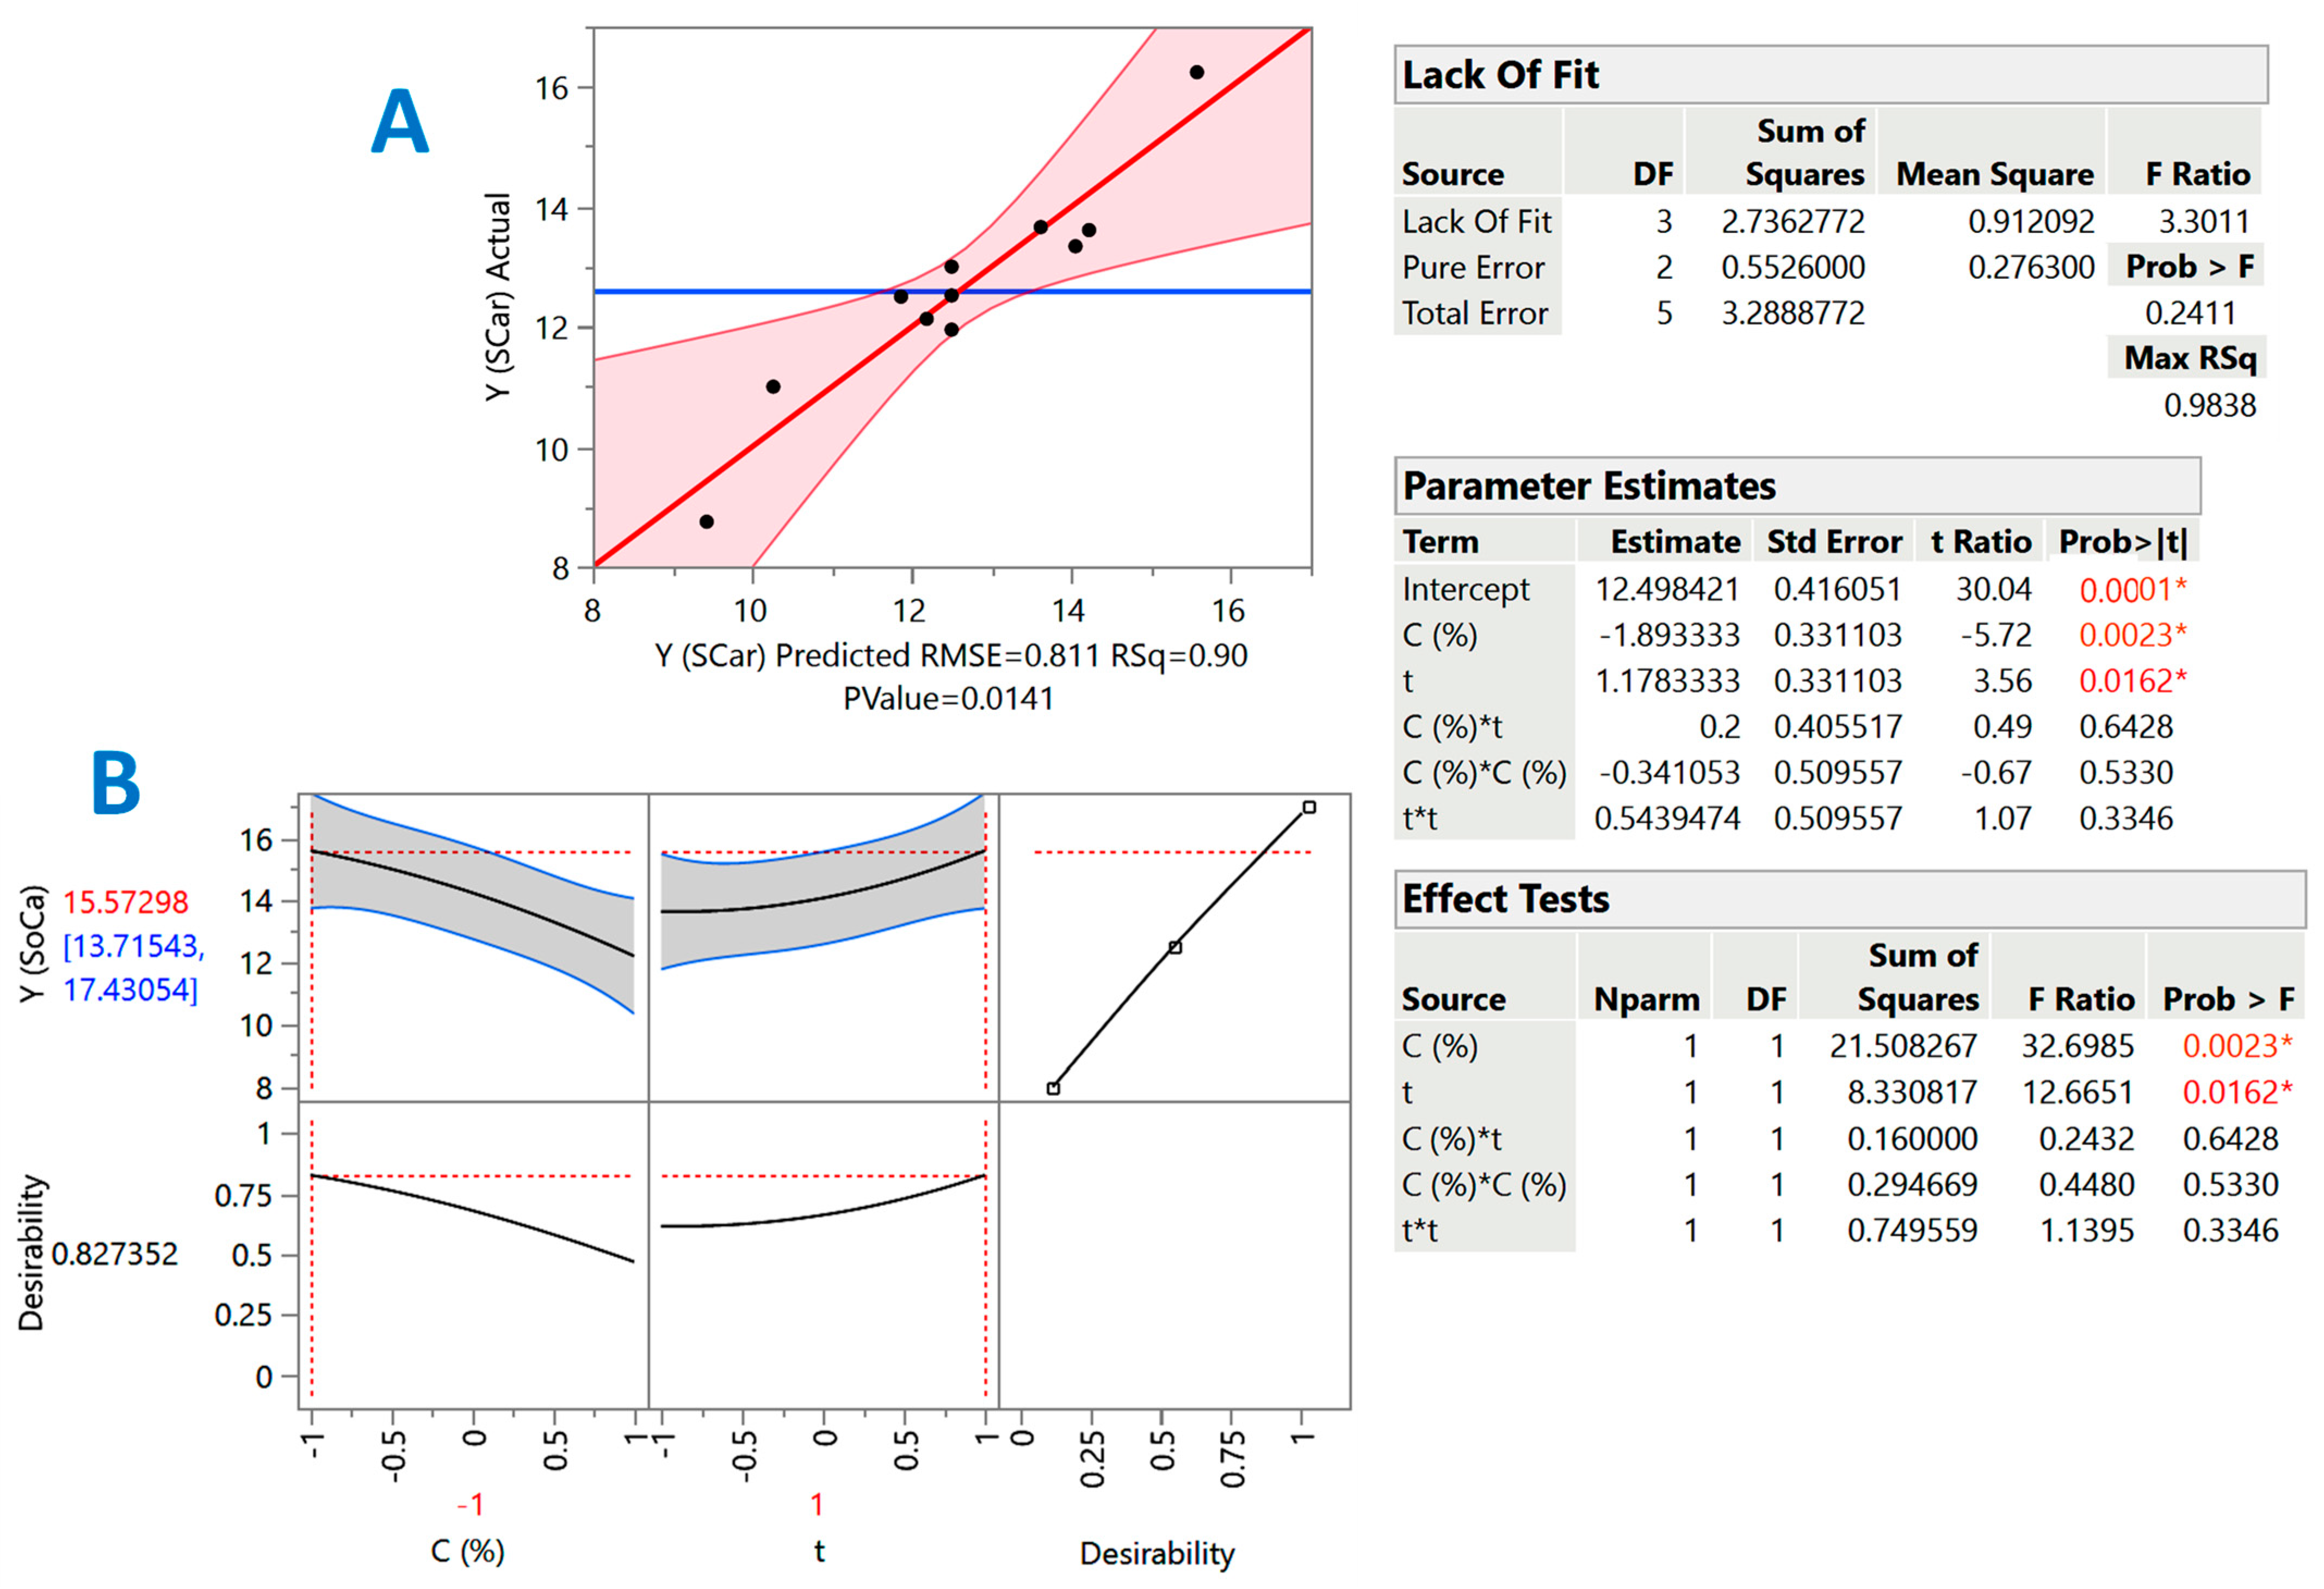
2.2. Treatment Optimization

As pointed out above, the projection of total polyphenol yield as a function of treatment severity did not reveal any specific pattern. Thus, to obtain a deeper understanding of the effect of both catalyst concentration and holding time on total polyphenol recovery, an experimental design was set up to perform a response surface optimization. Such an approach was deemed appropriate to distinguish possible differences between mild (SCar) and strong (SoHy) catalysis.
However, the severity-based examination evidenced that both treatment variables, catalyst concentration and holding time, may play key roles in polyphenol recovery from cotton stalks. Therefore, holding time, t, and catalyst concentration, C, were chosen as the treatment (independent) variables. The response surface approach had, as an objective, to better evaluate the effect of the independent variables, but also to spot possible synergistic (cross) functions between them. The overall assessment of the models derived from the response surface optimization was based on analysis of variance (ANOVA) and lack-of-fit tests (Figure 2 and Figure 3) considering predicted and measured values proximity (Table 3).
The inset tables “Parameter estimates” in Figure 2 and Figure 3 display the significance of each individual term of the models constructed through the implementation of response surface methodology. By including only the significant terms (p < 0.05), the models (mathematical equations) describing the effect of catalyst concentration (X1) and holding time (X2) were as follows:
YTP(SoHy) = 17.40 − 0.66X1 + 1.12X2 (R2 = 0.90, p = 0.0140)
YTP(SCar) = 12.50 − 1.89X1 + 1.17X2 (R2 = 0.90, p = 0.0141)
Taking into account the R2 and p values, it can be argued that both models exhibited satisfactory fitting to the experimental data. On the basis of these models, contour plots were constructed (Figure 4), depicting the effect of the treatment (experimental) variables on the response (YTP) and revealing the differences between the two catalysts studied.
For both the SoHy- and the SCar-catalyzed treatments, both C (X1) and t (X2) were significant (p < 0.05). On the contrary, cross terms (quadratic effects) of either C or t were non-significant. Moreover, in both cases, the term X1 (C) exerted a negative effect, which clearly demonstrated that effective polyphenol recovery may be carried out with low catalyst concentration, irrespective of the catalyst type (SoHy or SCar). By contrast, the positive effect of X2 (t) was clear evidence that extending holding time, up to the limit used in this study, can lead to higher YTP.
To estimate the theoretical optimal values for both C and t, but also the maximum predicted response, the desirability function was used (Figure 2A and Figure 3A). For the SoHy-catalyzed treatment, the optimum conditions were CSoHy = 0.67% and t = 300 min. Under these conditions, the maximum YTP was estimated to be 18.4 ± 4 mg CAE g−1 DM. Likewise, the optimum estimated conditions for the SCar-catalyzed treatment were CSCar = 4% and t = 300 min, providing a maximum YTP of 15.6 ± 1.9 mg CAE g−1 DM, which was 15.3% lower than that achieved in the SoHy-catalyzed treatment, but not significantly different (p > 0.05). This outcome suggested that, by maintaining the same holding time, similar polyphenol recovery levels may be attained by replacing the corrosive SoHy with the benign SCar. To test model credibility, three experiments were carried out under the theoretical optimum conditions for each catalyst used (SCar and SoHy). The corresponding YTP obtained were 14.5 ± 2.4 and 19.7 ± 3.3 mg CAE g−1 DM. This outcome highlighted the validity of the models derived.

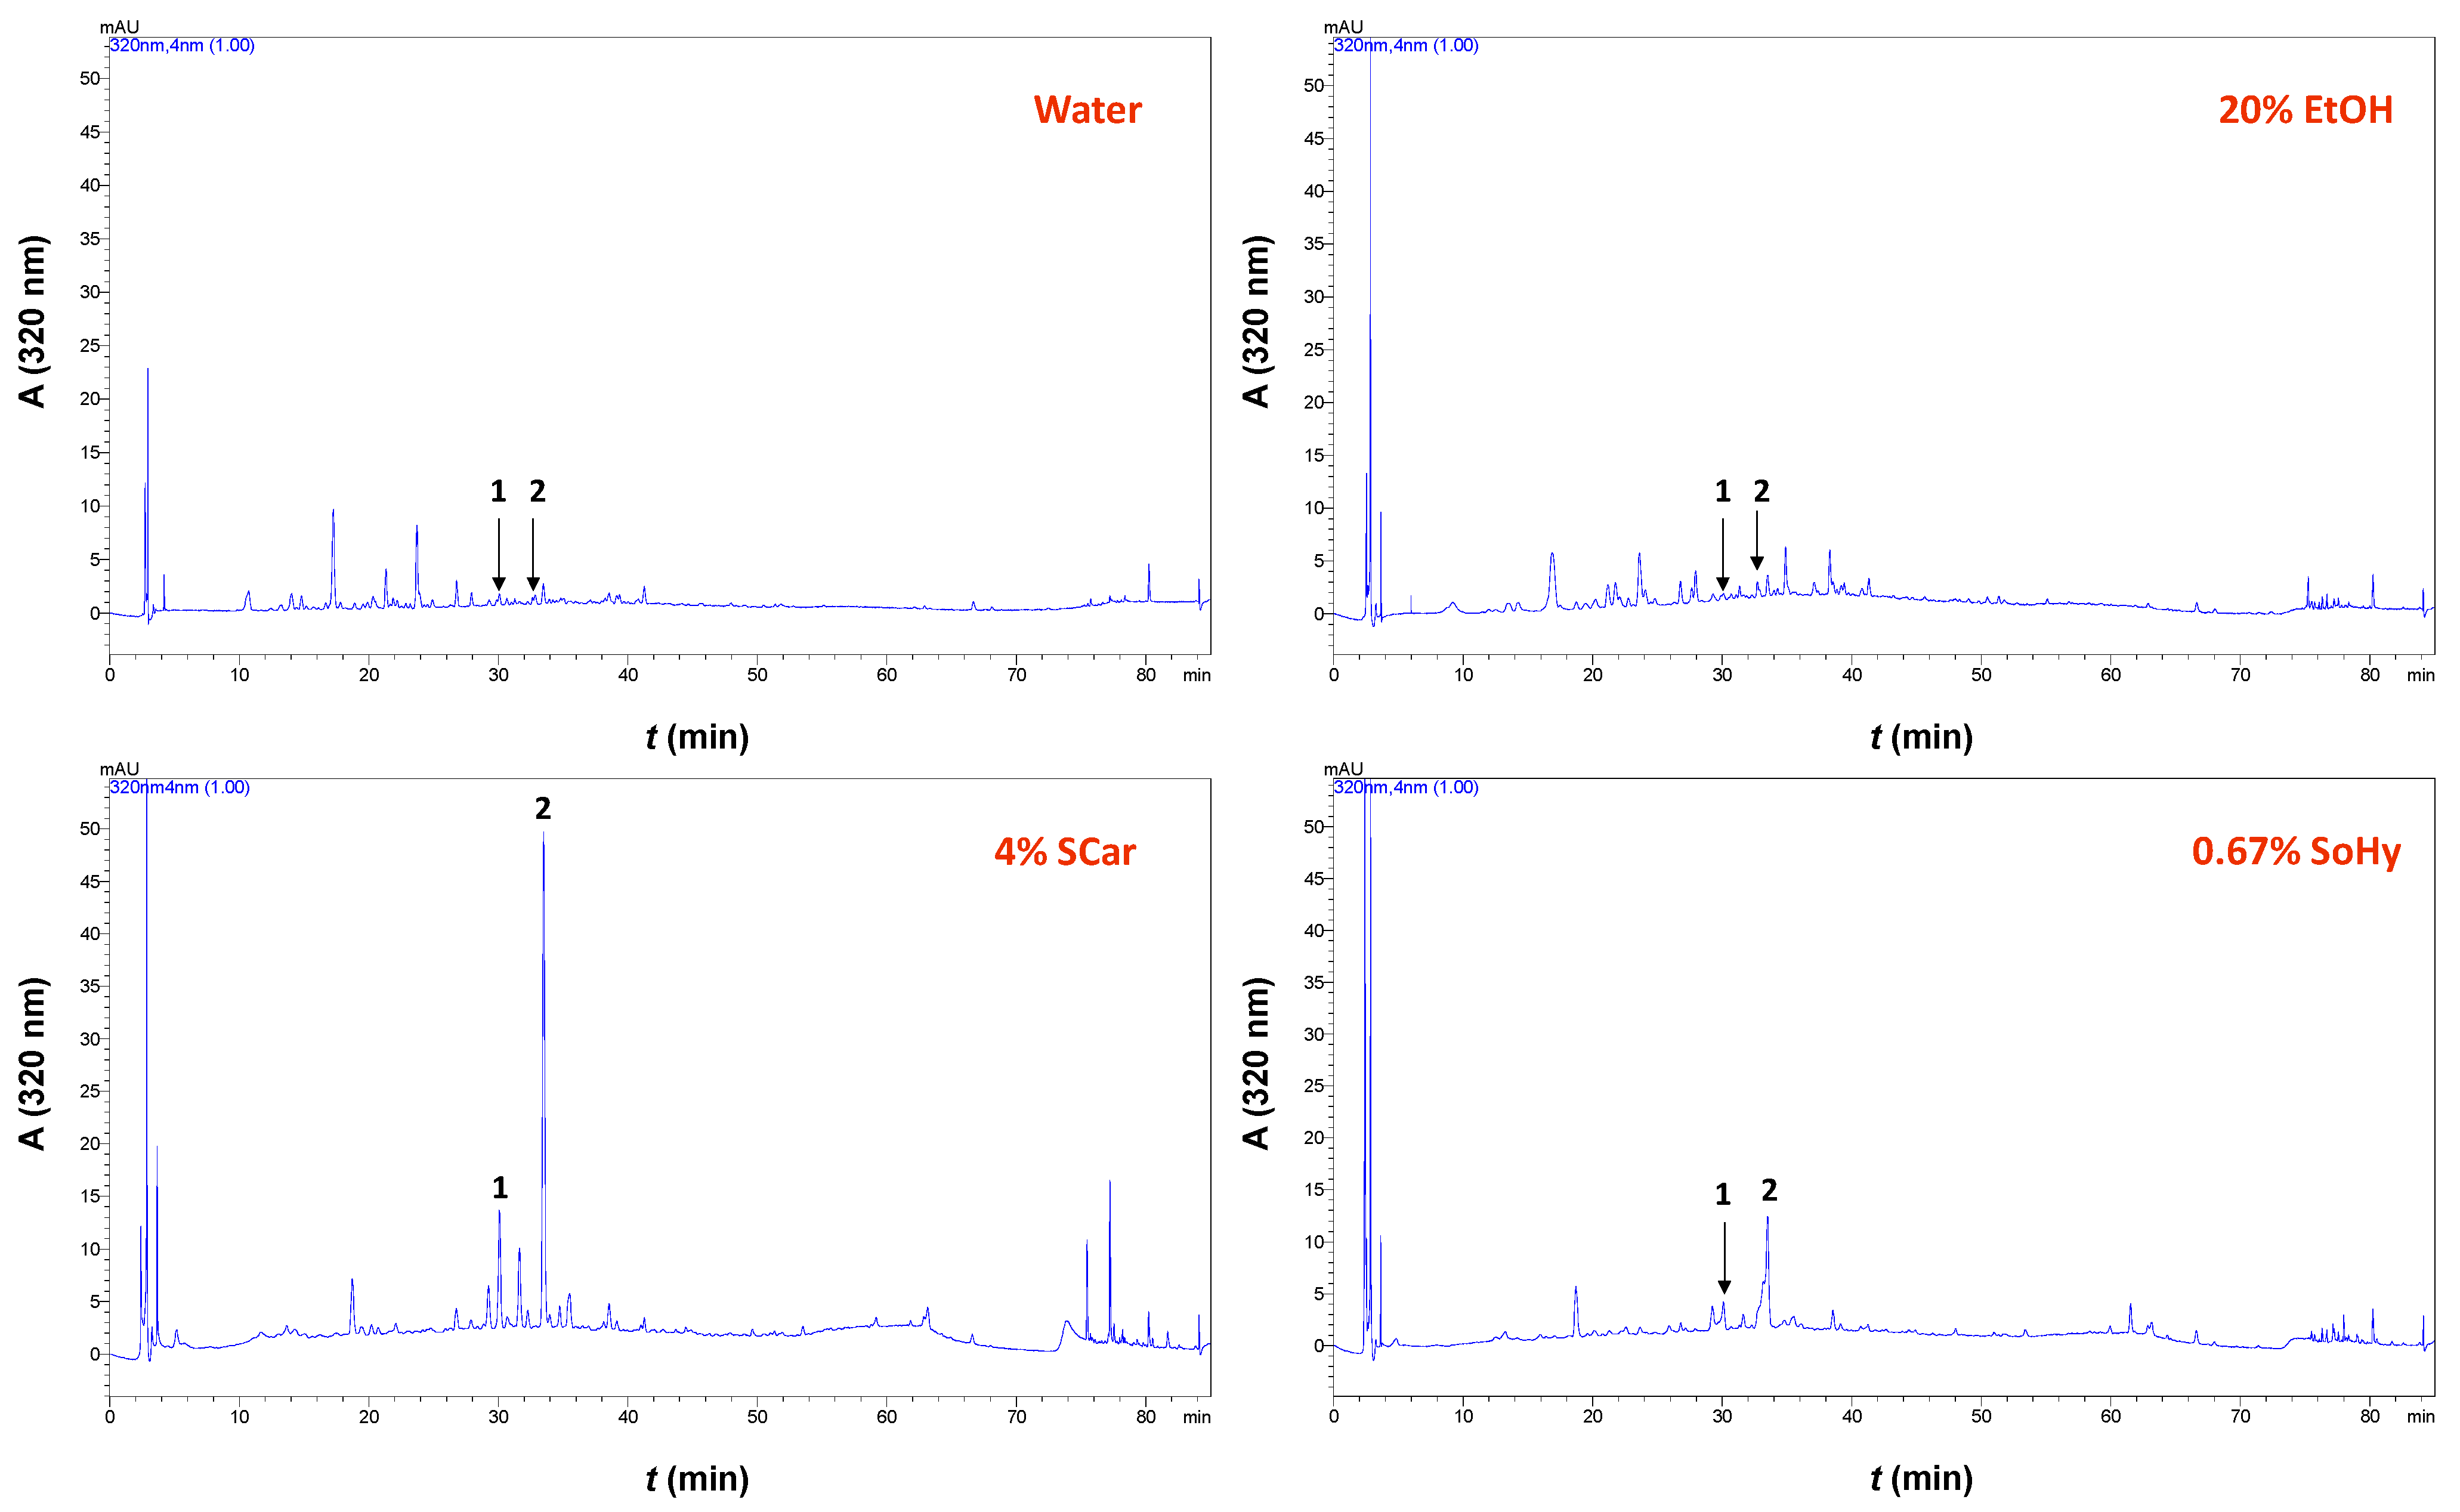
2.3. Polyphenolic Composition

The examination of the composition of the cotton stalk extracts produced by the SoHy- and SCar-catalyzed treatments included initially an assessment of the catalyst effect. As can be seen in Figure 5, the treatment using pure water instead of aqueous ethanol gave a significantly lower YTP (p < 0.05).
When 20% aqueous ethanol was used instead, the YTP level was increased by 2.26-fold. This finding pointed to the significant role of ethanol in the treatment. However, when the optimum concentration of SCar (4%) or SoHy (0.67%) was incorporated into the 20% aqueous ethanol, the YTP obtained was not significantly higher (p > 0.05). This was evidence that the role of ethanol might be more pronounced, while the effect of both catalysts was put in question. Apparently, the addition of either catalyst had practically no effect on polyphenol recovery. Therefore, to obtain a deeper insight into the polyphenolic composition of the extracts produced, high-performance liquid chromatography (HPLC) analyses were carried out. In the extract generated with pure water, two substances were tentatively identified, based on the retention time of the original standards, p-coumaric acid and ferulic acid (Figure 6). The same constituents were also detected in the extract obtained with 20% ethanol, and no major differences were seen in the chromatographic profile.
On the contrary, the extract produced with SCar-catalyzed hydrothermal treatment displayed dominant peaks corresponding to p-coumaric and ferulic acids, whereas these peaks were much less distinct in the extract produced from the SoHy-catalyzed treatment. To have a more detailed image of the composition of these extracts, quantification was also performed, and the analytical results are shown in Table 4. Taking into consideration these data, it is clear that the SCar-catalyzed treatment afforded extract that was significantly more enriched in both p-coumaric and ferulic acids compared to all other extracts tested. The yield of both these polyphenols was also higher with the SoHy-catalyzed treatment, compared to yields obtained with treatments performed only with water or aqueous ethanol. This outcome demonstrated that (I) the presence of either catalyst was essential in boosting p-coumaric acid and ferulic acid recovery, and (II) SCar was a more effective catalyst compared to SoHy.
In early investigations on the composition of cell wall components of cotton stalks, ferulic acid was amongst the predominant compounds detected, accompanied by smaller amounts of p-coumaric acid [14]. It has also been shown that conventional solvent extraction may afford extracts relatively rich in protocatechuic acid and catechin, whereas ferulic and p-coumaric acids are less abundant [15]. Thus, the fact that increased p-coumaric and ferulic acid recovery required alkali catalysts suggests that these two polyphenols may be bound to macromolecular matrices, e.g., lignocellulosic complexes. Such evidence regarding the presence of lignin-linked p-coumaric and ferulic acid has been reported for cotton stalks [19]. For other lignocellulosic materials (bamboo), biomass treatment yielded substantial amounts of p-coumaric and ferulic acid, which indicates the existence of a lignin–carbohydrate complex [20].
In grass lignocellulosic fractions, ferulic acid is attached to cell wall arabinoxylans via ester bonds [18,21]. Ester bonds may be effectively cleaved by alkaline hydrolysis, and ferulic acid can be adequately released. Furthermore, hydroxycinnamates such as p-coumaric and ferulic acid may also function as cross-linking agents between lignin and cell wall polysaccharides, onto which they are bound with alkali-labile ester bonds [22]. Ferulic acid is also a lignin network constituent, linked to it with ester bonds. It has been reported that enhanced lignin solubilization boosts ferulic acid release [23], and in this regard, ethanol could play a crucial role by assisting lignin solubilization [24]. Ethanol could also contribute to easier accessibility to ester bonds by the alkali catalysts (SCar and SoHy), which is the rate-limiting step of hydrolysis and liberation of hydroxycinnamates [23]. It has been suggested that lignin breakdown and solubilization may further enhance ferulic acid release. In ethanol organosolv treatments, lignin breakdown can be brought about by extensive splitting of α-aryl and β-aryl ether linkages [22,24]. These reactions break down large lignin polymers into smaller fractions, and thus higher lignin solubilization may be enabled.
Alkaline treatments can largely facilitate lignin solubilization [25], which can be further enhanced by ethanol [26]. Alkali-solubilized lignin has been tightly associated with ferulic acid release [23], and this could be another reason for the increased ferulic acid yield achieved in this study under the conditions employed. Ester bonds holding ferulic acid on cell wall polysaccharides may be broken down even under mild alkaline conditions, and appropriate regulation of temperature can accelerate the process [27]. However, temperature increases beyond a certain level might not be favorable for effective hydroxycinnamate recovery. It has been reported that treatments at 140 °C for over than 40 min were unsuitable for increased ferulic acid recovery, probably because of ferulic acid degradation [28]. On the other hand, pressurized hot water treatment yielded maximum ferulic acid amount at 200 °C, with only 3.5 min residence time [29], but treatment with pressurized water/ethanol mixtures afforded maximum ferulic acid amount after 74 min at 160 °C [16]. In thermal treatments, temperature and time are interdependent variables, and appropriate adjustment of treatment temperature and/or time to optimum settings is critical to maximizing hydroxycinnamate recovery.

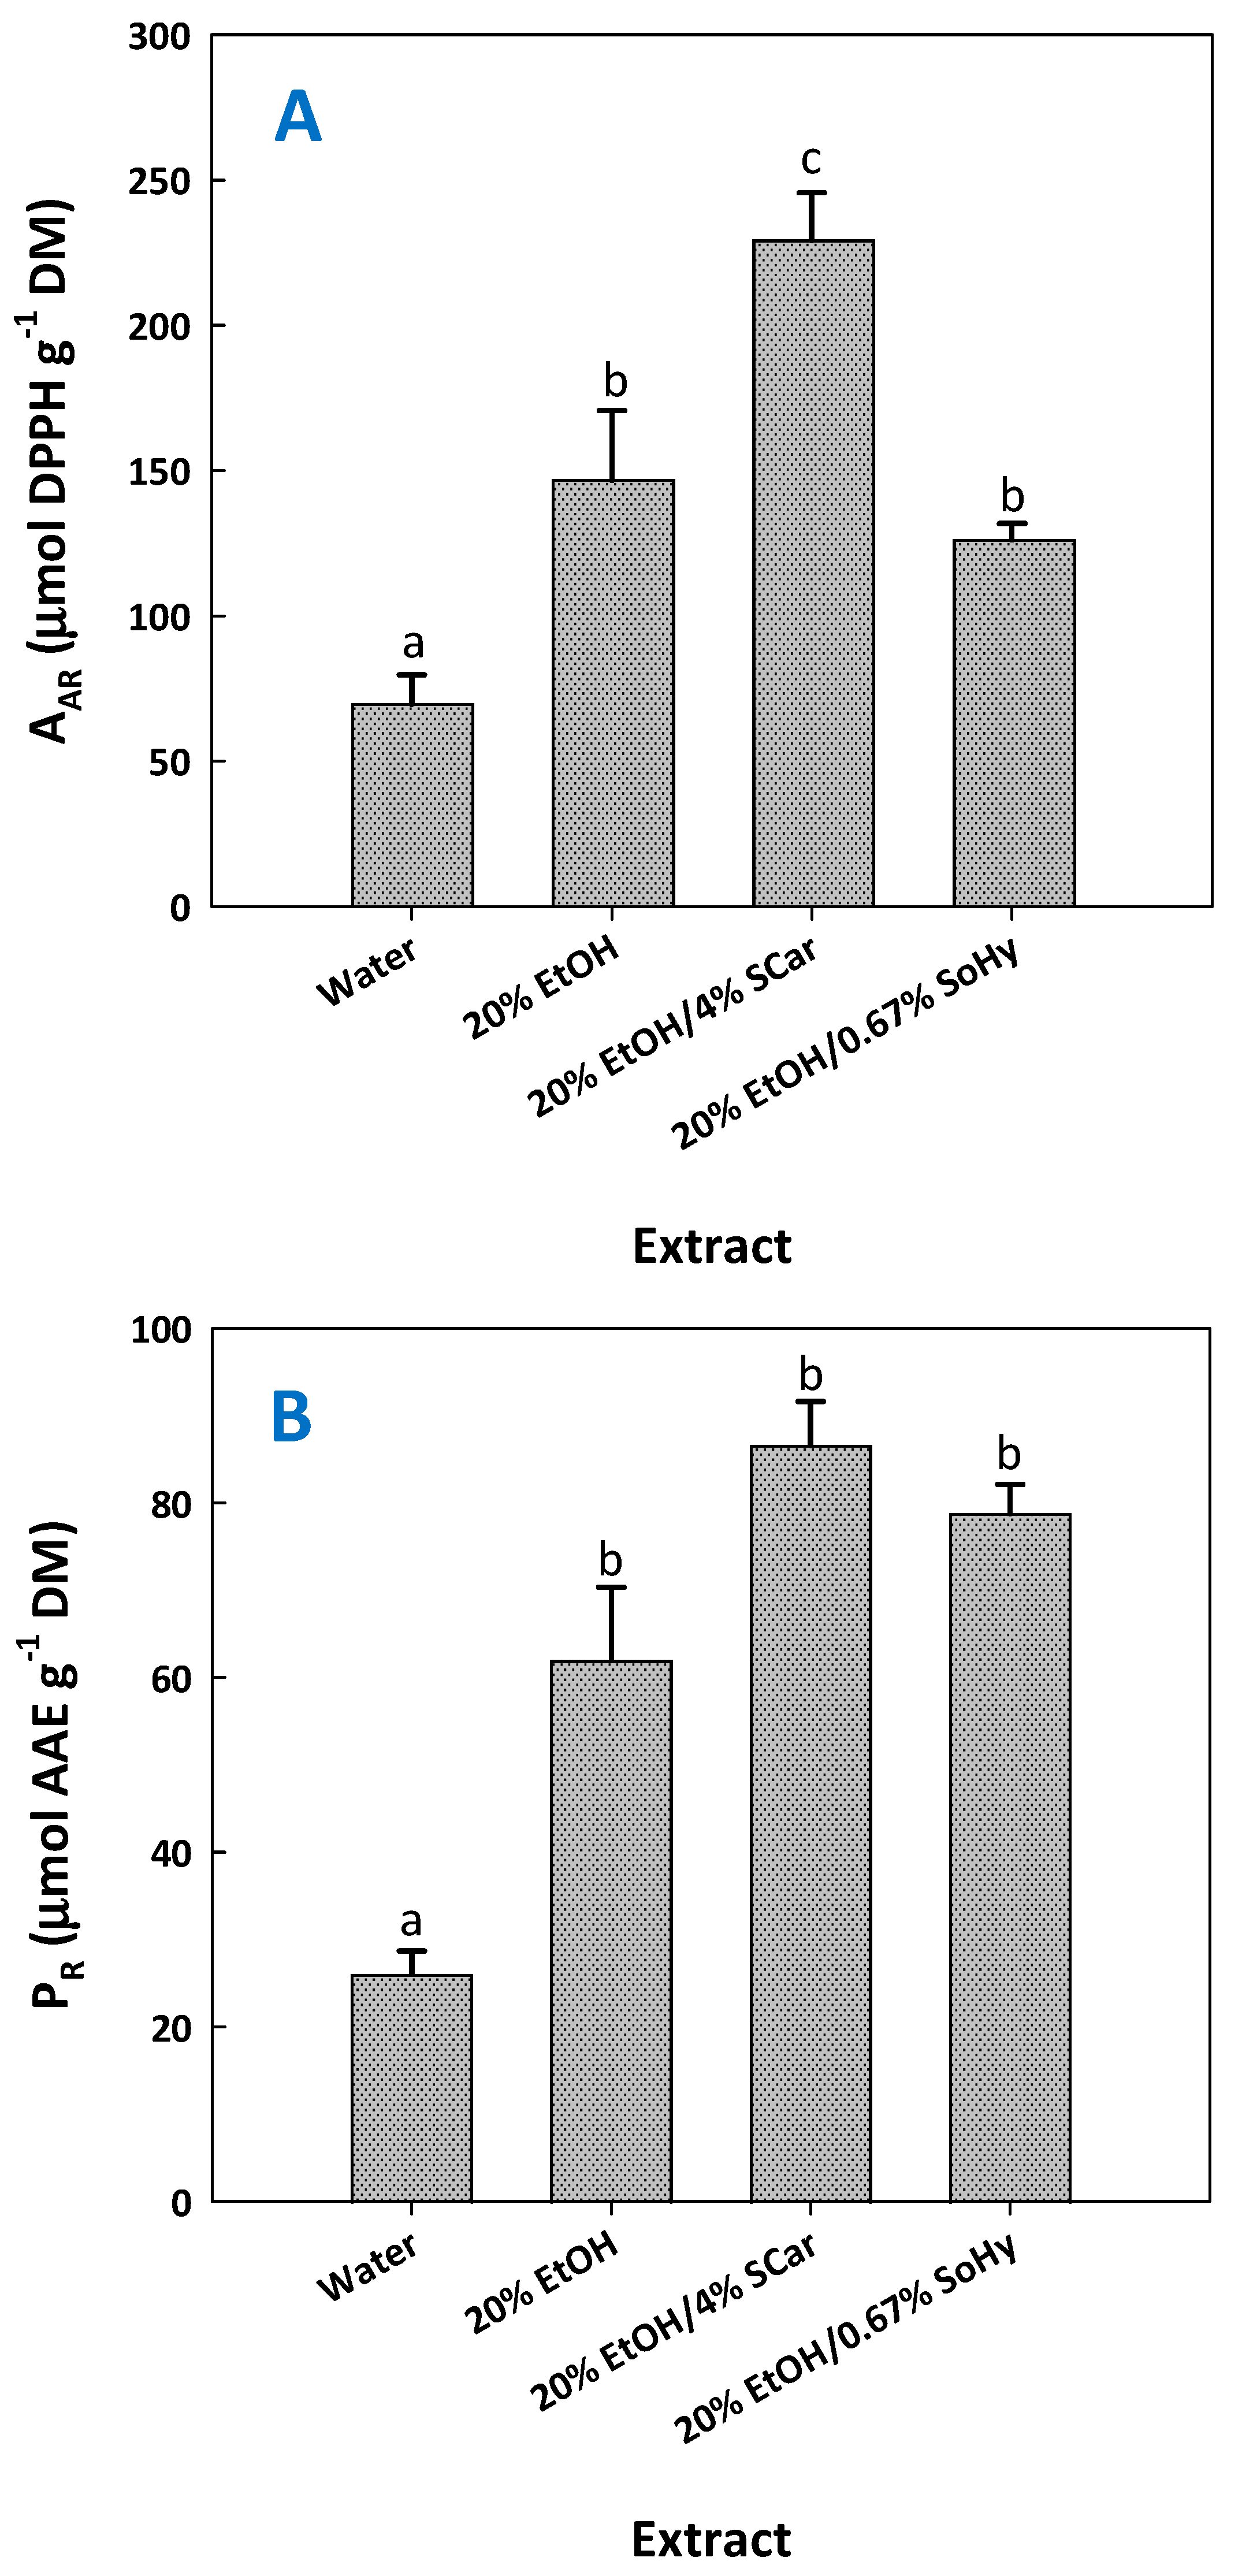
2.4. Antioxidant Activity

Previous investigations evidenced that extracts enriched in ferulic acid and/or ferulate derivatives might express significant antioxidant activity [13,17]. To examine such an effect and considering that the extracts tested had significantly different compositions (Table 5), antiradical activity (AAR), and ferric-reducing power (PR), assays were performed. The results obtained confirmed that the extract most enriched in ferulic acid, but also p-coumaric acid, exhibited significantly higher AAR (Figure 7).
This extract also possessed the highest PR, yet this was not significantly different from those shown by the control extract produced with 20% ethanol and the one produced with 20% ethanol/0.67% sodium hydroxide. Taking into account the outcome of both tests, there is strong evidence that the major determinant of antioxidant activity is the presence of ferulic and p-coumaric acid.
Such an argument would be in line with earlier findings, which demonstrated that in wheat bran extracts, ferulic acid played a key role in the expression of antioxidant activity, being the major contributor [27,30]. This effect was corroborated by studies involving hydrolysis treatments, where extracts enriched in ferulic acid, obtained after alkaline hydrolysis, displayed more powerful antiradical activity than the extracts obtained with acid hydrolysis [31]. On the basis of these data, it can be stated that the organosolv treatment of cotton stalks resulted in generating extracts enriched in hydroxycinnamate derivatives (ferulic and p-coumaric acid), with increased antioxidant activity. This finding is of particular importance, highlighting for the first time cotton stalks as a source of compounds with prospects in the food industry.

3. Materials and Methods

3.1. Chemicals

The 2,4,6-Tris(2-pyridyl)-s-triazine (TPTZ) was acquired from Fluka (Steinheim, Germany). Anhydrous citric acid and iron chloride hexahydrate (FeCl3·6H2O) were from Merck (Darmstadt, Germany). Sodium carbonate anhydrous and sodium hydroxide were provided by Penta (Prague, Czech Republic). The radical probe 2,2-diphenyl-1-picrylhydrazyl (DPPH) was acquired from Alfa Aesar (Karlsruhe, Germany), and p-coumaric acid (≥98%) and ferulic acid (≥99%) were from Sigma-Aldrich (Steinheim, Germany). L-ascorbic acid was provided by Carlo Erba (Milano, Italy). All the solvents used for chromatographic determinations were of appropriate (HPLC) grade. The absolute ethanol and Folin–Ciocalteu reagent were provided by Panreac (Barcelona, Spain).

3.2. Cotton Stalks

Cotton (Gossypium hirsutum) stalks were collected from the remaining tissues left in the field, approximately 3–5 days after cotton bud harvesting, from farmland located in the Kampos Grevenon area (Central Macedonia), at an altitude of 477 m. The stalks were transferred to the laboratory within 48 h, freeze-dried for 24 h, and comminuted in a domestic blender. The powder with a mean particle diameter of <400 μm was collected after sieving the ground material and stored at −40 °C until used.

3.3. Alkali-Catalyzed Ethanol Organosolv Treatment

For all the organosolv treatments, 20% (v/v) ethanol/water mixtures were used. This proportion was chosen to avoid sodium carbonate precipitation, which could affect the composition and pH of the treatment solvent. Sodium carbonate and sodium hydroxide were tested as alkali catalysts, and they were added in 20% ethanolic solutions at concentrations of 0.5, 1, and 1.5% (w/v) for sodium hydroxide, and 4, 7, and 10% (w/v) for sodium carbonate. A 60% (v/v) aqueous ethanol mixture and deionized water were also used to carry out control treatments.
For all the experiments, a Duran vial of 25 mL was used as the treatment vessel, and the treatments were accomplished by mixing 1 g of ground cotton stalks with 20 mL of solvent. A temperature-controlled hotplate stirrer (Witeg, Wertheim, Germany) was employed to provide constant stirring at 500 rpm and maintain the temperature at 80 °C. This temperature was selected as a safe limit to avoid the building up of excessive vapor pressure, considering that the solvent systems used were 20% ethanolic solutions. To study the effect of treatment severity, combinations of alkali catalyst concentration and treatment duration (60, 180, and 300 min) were used to attain different severity levels.

3.4. Severity-Based Examination

To study the effect of treatment severity, the following factors were determined [32,33]:
R o = t   ×   e ( T 100 14.75 )
SF = logRo
Ro may be termed as the severity, and thus SF represents the severity factor, using 100 °C as the reference temperature, and 14.75 as an empirical parameter related to the temperature of the treatment and activation energy.
The combined severity factor (CSF) represents an extension of SF, to take into account the pH of the treatment, which may be crucial in the decomposition of the biomatrix (cotton stalks) treated [34]:
R o = 10 pH   ×   t   ×   e ( T 100 14.75 )
CSF = logRo′ − pH
In addition, the alternative form of CSF, termed CFS′, may be regarded as a factor that provides a fairer comparison of the severities of the treatments performed within a wide pH spectrum [34]:
CSF′ = logRo + |pH − 7|

3.5. Organosolv Treatment Optimization

Given the constant temperature used (80 °C), two other crucial treatment variables, alkali catalyst concentration (C) and time (t), were selected to build up the experimental design for the response surface optimization. A central composite design was implemented, which encompassed 11 design points, 3 of which were the central points. Codification of the variables of the treatment (C, t) was at 3 levels, −1, 0, and 1, and it was computed as described in detail elsewhere [20]. Table 5 displays the levels of the variables in both codified and actual form. The actual ranges of both variables were chosen based on preliminary testing, but also by taking into account previous findings [35]. The significance (R2, p) of the models derived, as well as the significance of each of the model’s coefficients, was assessed based on relevant statistical analyses (lack-of-fit and ANOVA tests), at a minimum significance level of 95%.

3.6. Total Polyphenol Yield and Antioxidant Activity Measurements

A well-established methodology was used to determine the concentration of the total polyphenols in the extracts [36]. The yield in total polyphenols (YTP) was given as mg caffeic acid equivalents (CAE) per g of dry mass (DM). Likewise, both the ferric-reducing power (PR) and the antiradical activity (AAR) were estimated by well-described protocols, reported in detail elsewhere [37]. The results were determined as μmol ascorbic acid equivalents (AAE) per g of DM and μmol DPPH per g of DM, respectively.

3.7. Chromatographic Determinations

A Shimadzu CBM-20A liquid chromatograph (Shimadzu Europa GmbH, Duisburg, Germany), coupled with a Shimadzu SPD-M20A detector and bearing a CTO-20AC column oven, was used. The system was interfaced by Shimadzu LC solution software. Chromatography was carried out on a Phenomenex Luna C18(2) column (100 Å, 5 μm, 4.6 mm × 250 mm) (Phenomenex, Inc., Torrance, CA, USA), maintained at 40 °C. Samples were introduced (injected) into the system by a 20 μL loop. Details regarding flow rate, eluents, and the elution program were reported elsewhere [38]. In short, 0.5% aqueous formic acid and 0.5% formic acid in acetonitrile/water (6:4) were used as eluents A and B, respectively, delivered at a flow rate of 1 mL min−1, and the elution program was: 100% A to 60% A in 40 min, 60% A to 50% A in 10 min, 50% A to 30% A in 10 min, and then isocratic for 10 min. The quantification of both ferulic acid and p-coumaric acid was accomplished at 320 nm using commercial external standards and calibration curves established with standard solutions (0 to 50 μg mL−1; R2 = 0.9980 and 0.9990 for ferulic acid and p-coumaric acid, respectively).

3.8. Statistical Handling and Processing

Linear regressions were computed with SigmaPlot 12.5 (Systat Software Inc., San Jose, CA, USA). Distribution analysis, design of experiments, and all statistics related to response surface methodology (analysis of variance, lack-of-fit) were performed with JMP Pro 13 software (SAS, Cary, NC, USA). At least two runs were carried out for each organosolv treatment, and all the analyses were done in triplicate. The values reported are average ± standard deviation.

4. Conclusions

Cotton stalks are waste biomass produced from cotton harvesting, yet this byproduct has been poorly investigated as a pool of bioactive phytochemicals. Being a lignocellulosic material, it was suspected that cotton stalks could be used for the recovery of polyphenolic compounds, given the appropriate treatment. The investigation carried out showed that common conventional solvents such as water or water/ethanol mixtures gave poor yields in total polyphenols (less than 40 μg g−1 DM of total hydroxycinnamates), but retrieval was boosted by alkali catalysis, providing yields higher than 280 μg g−1 DM. In this regard, mild catalysis by sodium carbonate was proven more effective, providing extracts particularly enriched in antioxidant hydroxycinnamates. On this basis, this study explicitly proposes cotton stalks as an agricultural residue with high prospects as a source of functional phytochemicals. The perspective arising from the outcome may be very useful in biorefinery strategies, as it embraces an eco-friendly treatment based on green solvents (water/ethanol), benign catalysis (SCar), and the valorization of a biowaste (cotton stalks). Such applications could be a step forward in establishing sustainable routes of agri-food waste exploitation, and a further contribution to bioeconomy consolidation.

Author Contributions

Conceptualization, D.P.M.; methodology, T.C., D.P. and V.A.; validation, T.C., D.P. and V.A.; formal analysis, G.P. and V.Z.; investigation, G.P. and V.Z.; resources, D.P.M. and S.I.L.; data curation, G.P. and V.Z.; writing—original draft preparation, D.P.M.; writing—review and editing, D.P.M. and S.I.L.; visualization, D.P.M.; supervision, D.P.M. and S.I.L.; project administration, D.P.M. and S.I.L. All authors have read and agreed to the published version of the manuscript.

Funding

This research received no external funding.

Data Availability Statement

The data presented in this study are available upon request from the corresponding author. The data are not publicly available because the researchers choose to withhold data temporarily to continue their investigations, build on the findings, and use the data for future publications.

Conflicts of Interest

The authors declare no conflicts of interest.

References

  1. Esparza, I.; Jiménez-Moreno, N.; Bimbela, F.; Ancín-Azpilicueta, C.; Gandía, L.M. Fruit and vegetable waste management: Conventional and emerging approaches. J. Environ. Manag. 2020, 265, 110510. [Google Scholar] [CrossRef]
  2. Zuin, V.G.; Ramin, L.Z. Green and sustainable separation of natural products from agro-industrial waste: Challenges, potentialities, and perspectives on emerging approaches. In Chemistry and Chemical Technologies in Waste Valorization; Springer: Cham, Switzerland, 2018; pp. 229–282. [Google Scholar]
  3. Torres, A.F.; Xu, X.; Nikiforidis, C.V.; Bitter, J.H.; Trindade, L.M. Exploring the treasure of plant molecules with integrated biorefineries. Front. Plant Sci. 2019, 10, 478. [Google Scholar] [CrossRef]
  4. Drescher, A.; Kienberger, M. A systematic review on waste as sustainable feedstock for bioactive molecules—Extraction as isolation technology. Processes 2022, 10, 1668. [Google Scholar] [CrossRef]
  5. Chemat, F.; Vian, M.A.; Ravi, H.K. Toward petroleum-free with plant-based chemistry. Curr. Opin. Green Sustain. Chem. 2021, 28, 100450. [Google Scholar] [CrossRef]
  6. Ouro-Salim, O.; Guarnieri, P. Circular economy of food waste: A literature review. Environ. Qual. Manag. 2022, 32, 225–242. [Google Scholar] [CrossRef]
  7. Hendriks, A.; Zeeman, G. Pretreatments to enhance the digestibility of lignocellulosic biomass. Biores. Technol. 2009, 100, 10–18. [Google Scholar] [CrossRef] [PubMed]
  8. Thoresen, P.P.; Matsakas, L.; Rova, U.; Christakopoulos, P. Recent advances in organosolv fractionation: Towards biomass fractionation technology of the future. Biores. Technol. 2020, 306, 123189. [Google Scholar] [CrossRef] [PubMed]
  9. Sun, C.; Song, G.; Pan, Z.; Tu, M.; Kharaziha, M.; Zhang, X.; Show, P.-L.; Sun, F. Advances in organosolv modified components occurring during the organosolv pretreatment of lignocellulosic biomass. Biores. Technol. 2022, 368, 128356. [Google Scholar] [CrossRef] [PubMed]
  10. Houasni, A.; Grigorakis, S.; Kellil, A.; Makris, D.P. Organosolv treatment/polyphenol extraction from olive leaves (Olea europaea L.) using glycerol and glycerol-based deep eutectic solvents: Effect on metabolite stability. Biomass 2022, 2, 46–61. [Google Scholar] [CrossRef]
  11. Abdoun, R.; Grigorakis, S.; Kellil, A.; Loupassaki, S.; Makris, D.P. Process optimization and stability of waste orange peel polyphenols in extracts obtained with organosolv thermal treatment using glycerol-based solvents. ChemEngineering 2022, 6, 35. [Google Scholar] [CrossRef]
  12. Velmourougane, K.; Blaise, D.; Savitha, S.; Waghmare, V. Valorization of cotton wastes for agricultural and industrial applications: Present status and future prospects. In Valorization of Agri-Food Wastes and by-Products; Elsevier: Amsterdam, The Netherlands, 2021; pp. 665–692. [Google Scholar]
  13. Egbuta, M.A.; McIntosh, S.; Waters, D.L.; Vancov, T.; Liu, L. Biological importance of cotton by-products relative to chemical constituents of the cotton plant. Molecules 2017, 22, 93. [Google Scholar] [CrossRef]
  14. Yosef, E.; Ben-Ghedalia, D.; Miron, J.; Huttermann, A.; Majcherczyk, A.; Milstein, O.; Ludemann, H.D.; Frund, R. Characterization of some cell wall components of untreated and ozone-treated cotton stalks. J. Agric. Food Chem. 1994, 42, 86–90. [Google Scholar] [CrossRef]
  15. Kirkan, B.; Sarikurkcu, C.; Copuroglu, M.; Cengiz, M.; Tepe, B. Is it possible to use the stalks of Gossypium hirsitum L., an important by-product of cotton cultivation, as an alternative source of bioactive components? Eur. Food Res. Technol. 2018, 244, 1065–1071. [Google Scholar] [CrossRef]
  16. Pazo-Cepeda, V.; Benito-Román, Ó.; Navarrete, A.; Alonso, E. Valorization of wheat bran: Ferulic acid recovery using pressurized aqueous ethanol solutions. Waste Biomass Valor. 2020, 11, 4701–4710. [Google Scholar] [CrossRef]
  17. Papadaki, E.S.; Palaiogiannis, D.; Lalas, S.I.; Mitlianga, P.; Makris, D.P. Polyphenol release from wheat bran using ethanol-based organosolv treatment and acid/alkaline catalysis: Process modeling based on severity and response surface optimization. Antioxidants 2022, 11, 2457. [Google Scholar] [CrossRef]
  18. Mathew, S.; Abraham, T.E. Ferulic acid: An antioxidant found naturally in plant cell walls and feruloyl esterases involved in its release and their applications. Crit. Rev. Biotech 2004, 24, 59–83. [Google Scholar] [CrossRef]
  19. Costa, C.A.E.; Coleman, W.; Dube, M.; Rodrigues, A.E.; Pinto, P.C.R. Assessment of key features of lignin from lignocellulosic crops: Stalks and roots of corn, cotton, sugarcane, and tobacco. Ind. Crop. Prod. 2016, 92, 136–148. [Google Scholar] [CrossRef]
  20. Huang, C.; Zhan, Y.; Wang, J.; Cheng, J.; Meng, X.; Liang, L.; Liang, F.; Deng, Y.; Fang, G.; Ragauskas, A.J. Valorization of bamboo biomass using combinatorial pretreatments. Green Chem. 2022, 24, 3736–3749. [Google Scholar] [CrossRef]
  21. De Oliveira, D.M.; Finger-Teixeira, A.; Rodrigues Mota, T.; Salvador, V.H.; Moreira-Vilar, F.C.; Correa Molinari, H.B.; Craig Mitchell, R.A.; Marchiosi, R.; Ferrarese-Filho, O.; Dantas dos Santos, W. Ferulic acid: A key component in grass lignocellulose recalcitrance to hydrolysis. Plant Biotech. J. 2015, 13, 1224–1232. [Google Scholar] [CrossRef] [PubMed]
  22. Buranov, A.U.; Mazza, G. Lignin in straw of herbaceous crops. Ind. Crop. Prod. 2008, 28, 237–259. [Google Scholar] [CrossRef]
  23. Linh, T.N.; Fujita, H.; Sakoda, A. Release kinetics of esterified p-coumaric acid and ferulic acid from rice straw in mild alkaline solution. Biores. Technol. 2017, 232, 192–203. [Google Scholar] [CrossRef]
  24. Zhou, Z.; Lei, F.; Li, P.; Jiang, J. Lignocellulosic biomass to biofuels and biochemicals: A comprehensive review with a focus on ethanol organosolv pretreatment technology. Biotech. Bioeng. 2018, 115, 2683–2702. [Google Scholar] [CrossRef] [PubMed]
  25. Woiciechowski, A.L.; Neto, C.J.D.; de Souza Vandenberghe, L.P.; de Carvalho Neto, D.P.; Sydney, A.C.N.; Letti, L.A.J.; Karp, S.G.; Torres, L.A.Z.; Soccol, C.R. Lignocellulosic biomass: Acid and alkaline pretreatments and their effects on biomass recalcitrance—Conventional processing and recent advances. Biores. Technol. 2020, 304, 122848. [Google Scholar] [CrossRef] [PubMed]
  26. Borand, M.N.; Karaosmanoğlu, F. Effects of organosolv pretreatment conditions for lignocellulosic biomass in biorefinery applications: A review. J. Renew. Sustain. Energy 2018, 10, 033104. [Google Scholar] [CrossRef]
  27. Verma, B.; Hucl, P.; Chibbar, R. Phenolic acid composition and antioxidant capacity of acid and alkali hydrolysed wheat bran fractions. Food Chem. 2009, 116, 947–954. [Google Scholar] [CrossRef]
  28. Valério, R.; Cadima, M.; Crespo, J.G.; Brazinha, C. Extracting ferulic acid from corn fibre using mild alkaline extraction: A pilot scale study. Waste Biomass Valor. 2021, 13, 287–297. [Google Scholar] [CrossRef]
  29. Pazo-Cepeda, M.V.; Aspromonte, S.G.; Alonso, E. Extraction of ferulic acid and feruloylated arabinoxylo-oligosaccharides from wheat bran using pressurized hot water. Food Biosci. 2021, 44, 101374. [Google Scholar] [CrossRef]
  30. Mateo Anson, N.; van den Berg, R.; Havenaar, R.; Bast, A.; RMM Haenen, G. Ferulic acid from aleurone determines the antioxidant potency of wheat grain (Triticum aestivum L.). J. Agric. Food Chem. 2008, 56, 5589–5594. [Google Scholar] [CrossRef]
  31. Kim, K.-H.; Tsao, R.; Yang, R.; Cui, S.W. Phenolic acid profiles and antioxidant activities of wheat bran extracts and the effect of hydrolysis conditions. Food Chem. 2006, 95, 466–473. [Google Scholar] [CrossRef]
  32. Overend, R.P.; Chornet, E. Fractionation of lignocellulosics by steam-aqueous pretreatments. Phil. Trans. R. Soc. Lond. Ser. A Math. Phys. Sci. 1987, 321, 523–536. [Google Scholar]
  33. Sidiras, D.; Politi, D.; Giakoumakis, G.; Salapa, I. Simulation and optimization of organosolv based lignocellulosic biomass refinery: A review. Biores. Technol. 2022, 343, 126158. [Google Scholar] [CrossRef]
  34. Pedersen, M.; Meyer, A.S. Lignocellulose pretreatment severity–relating pH to biomatrix opening. New Biotech. 2010, 27, 739–750. [Google Scholar] [CrossRef]
  35. Athanasiadis, V.; Palaiogiannis, D.; Bozinou, E.; Lalas, S.I.; Makris, D.P. β-Cyclodextrin-aided aqueous extraction of antioxidant polyphenols from peppermint (Mentha × piperita L.). Oxygen 2022, 2, 424–436. [Google Scholar] [CrossRef]
  36. Guenaoui, A.; Casasni, S.; Grigorakis, S.; Makris, D.P. Alkali-catalyzed organosolv treatment of oat bran for enhanced release of hydroxycinnamate antioxidants: Comparison of 1-and 2-propanol. Environments 2023, 10, 118. [Google Scholar] [CrossRef]
  37. Cicco, N.; Lanorte, M.T.; Paraggio, M.; Viggiano, M.; Lattanzio, V. A reproducible, rapid and inexpensive Folin–Ciocalteu micro-method in determining phenolics of plant methanol extracts. Microchem. J. 2009, 91, 107–110. [Google Scholar] [CrossRef]
  38. Lakka, A.; Grigorakis, S.; Karageorgou, I.; Batra, G.; Kaltsa, O.; Bozinou, E.; Lalas, S.; Makris, D.P. Saffron processing wastes as a bioresource of high-value added compounds: Development of a green extraction process for polyphenol recovery using a natural deep eutectic solvent. Antioxidants 2019, 8, 586. [Google Scholar] [CrossRef]
Figure 1. Yield in total polyphenols (YTP) as a function of combined severity factor (A) and alternative severity factor (B), for the organosolv treatments catalyzed by sodium hydroxide (SoHy) and sodium carbonate (SCar).
Recycling 09 00021 g001
Figure 2. Diagrams illustrating the correlation between actual and predicted values of YTP in the SoHy-catalyzed treatment of cotton stalks (A), and the desirability function (B). The inset tables present the statistics associated with the model derived from the response surface methodology. Values with different colors designated with asterisks are statistically significant (red, p < 0.05; orange, p < 0.01).
Recycling 09 00021 g002
Figure 3. Diagrams illustrating the correlation between actual and predicted values of YTP in the SCar-catalyzed treatment of cotton stalks (A), and the desirability function (B). The inset tables present the statistics associated with the model derived from the response surface methodology. Values with different colors designated with asterisks are statistically significant (red, p < 0.05; orange, p < 0.01).
Recycling 09 00021 g003
Figure 4. Contour plots showing the effect of the variation in treatment variables on the response (total polyphenol yield). (A), sodium hydroxide catalysis; (B), sodium carbonate catalysis.
Recycling 09 00021 g004
Figure 5. Bar plot displaying the yield in total polyphenols achieved after SCar- and SoHy-catalyzed organosolv treatments of cotton stalks. The results from the control treatments (water, 20% ethanol) are also given. Columns designated with different small letters (a, b) represent statistically different values (p < 0.05).
Recycling 09 00021 g005
Figure 6. Chromatograms of the extracts obtained with the SCar- and SoHy-catalyzed organosolv treatments of cotton stalks. Peak assignments: 1, p-coumaric acid; 2, ferulic acid.
Recycling 09 00021 g006
Figure 7. Antiradical activity (AAR) (A) and ferric-reducing power (PR) (B) of the extracts produced with SCar- and SoHy-catalyzed organosolv treatments of cotton stalks. The results from the control treatments (water, 20% ethanol) are also given. Columns designated with different small letters (a, b) represent statistically different values (p < 0.05).
Recycling 09 00021 g007
Table 1. Combinations of sodium carbonate concentration and residence time used in this study to attain various levels of treatment severity, along with the corresponding total polyphenol yields.
CSCar (% w/v)t (min)CSFCSF′YTP
(mg CAE g−1 DM)
460−10.45 b6.41 a13.7 ± 0.8 c
180−9.97 c6.89 c13.3 ± 0.9 c
300−9.75 c7.11 b16.2 ± 1 b
760−10.47 a6.43 a12.5 ± 0.7 c
180−9.99 c6.91 c12.5 ± 0.9 c
300−9.77 a7.13 b13.6 ± 1 c
1060−10.50 a6.46 a8.8 ± 0.6 a
180−10.02 c6.94 c11.2 ± 1.3 c
300−9.80 a7.16 b12.1 ± 1 c
Values within columns with different superscripted letters (a, b, c), are statistically different (p < 0.05).
Table 2. Combinations of sodium hydroxide concentration and residence time used in this study to attain various levels of treatment severity, along with the corresponding total polyphenol yields.
CSoHy (% w/v)t (min)CSFCSF′YTP
(mg CAE g−1 DM)
0.560−11.33 b7.29 a15.9 ± 1.1 c
180−10.85 b7.77 c17 ± 1.3 c
300−10.63 b7.99 c18.3 ± 1.5 b
160−11.56 a7.52 a15.5 ± 1 a
180−11.08 b8.00 c17.3 ± 1.6 c
300−10.86 b8.22 b18.5 ± 1.5 b
1.560−11.61 a7.57 a14.7 ± 1 a
180−11.13 b8.05 c16.5 ± 0.9 c
300−10.91 b8.27 b16 ± 1.5 c
Values within columns with different superscripted letters (a, b, c), are statistically different (p < 0.05).
Table 3. The combinations of treatment variables (design points) used for the response surface methodology, and the predicted and measured values of the response (total polyphenol yield—YTP) for each design point.
Design PointIndependent VariablesResponse (YTP, mg CAE g−1 DM)
X1 (C)X2 (t)SoHySCar
MeasuredPredictedMeasuredPredicted
1−1−115.915.513.713.6
2−1118.318.316.215.6
31−114.714.88.89.4
4111616.412.112.2
5−101717.313.314
61016.51611.110.3
70−115.515.912.511.9
80118.518.113.614.2
90017.317.412.512.5
100016.917.41312.5
110017.817.41212.5
Table 4. Amount of ferulic acid (FA) and p-coumaric acid (p-CouA) recovered after SCar- and SoHy-catalyzed organosolv treatments of cotton stalks. The results from the control treatments (water, 20% ethanol) are also shown.
SolventFA
(μg g−1 DM)
p-CouA
(μg g−1 DM)
Total
(μg g−1 DM)
Water24.8 ± 0.5 a14.6 ± 0.3 a39.4 a
20% Ethanol25.5 ± 0.7 a13.3 ± 0.4 a38.7 a
20% Ethanol/4% Sodium Carbonate233.1 ± 9 b55.6 ± 1.9 b288.6 b
20% Ethanol/0.67% Sodium Hydroxide81.1 ± 5.3 c25.6 ± 1 a106.8 c
Values designated with different small letters (a, b, c) are statistically different (p < 0.05).
Table 5. The codified and actual values of the treatment variables used to construct the experimental design for the response surface methodology.
Process VariablesCodesCoded Variable Level
−101
t (min)X160180300
CSCar (% w/v) *X24710
CSoHy (% w/v) * 0.511.5
* CSCar and CSoHy stand for the concentrations of sodium carbonate and sodium hydroxide, respectively.
Disclaimer/Publisher’s Note: The statements, opinions and data contained in all publications are solely those of the individual author(s) and contributor(s) and not of MDPI and/or the editor(s). MDPI and/or the editor(s) disclaim responsibility for any injury to people or property resulting from any ideas, methods, instructions or products referred to in the content.

