Article

Non-Structural Vibro-Compressed Concrete Incorporating Industrial Wastes

by
Gabriela Bertazzi Pignotti
1,
Ana Mafalda Matos
2,* and
Fernanda Giannotti da Silva Ferreira
1
1
Department of Civil Engineering, University of São Carlos (UFSCar), São Carlos 13565-905, Brazil
2
Construct-Labest, Faculty of Engineering, University of Porto, 4200-465 Porto, Portugal
*
Author to whom correspondence should be addressed.
Recycling 2024, 9(2), 26; https://doi.org/10.3390/recycling9020026
Submission received: 13 January 2024 / Revised: 27 February 2024 / Accepted: 13 March 2024 / Published: 25 March 2024

Abstract

:
This study presents more eco-efficient concrete formulations for precast vibro-compressed masonry blocks. The proposed formulations incorporated industrial waste, glass powder (GP), and quartz powder (QP), in which natural aggregate was partially replaced by QP (10%) and Portland cement by GP (10% and 20%). The best combination of powder materials, water, and admixture was optimised at mortar level, considering a “zero slump” criteria and compressive strength. Afterwards, studies at concrete level followed. Specimens were vibrated and compressed in laboratory and immediately demoulded, aiming to simulate the industrial process. The compressive strength decreased when GP and QP were used alone; however, when combining 10% GP as cement replacement + 10% QP as fine aggregate replacement, the compressive strength increased by approximately 26.6% compared to the reference concrete. Water absorption results varied between 8.92 and 17.9%, and the lowest absorption was obtained by concrete specimens incorporating 20% GP. The UPV presented a narrow range of variation among all concrete mixtures under study, around 2–2.5 km/s at 28 days, whereas electrical resistivity was achieved at 28 days, at 20,000 and 25,000 ohms. Although there were some limitations of the casting process at the laboratory scale, the research results showed promising results, and it seems feasible to use this waste as a substitute for non-renewable raw materials in the production of concrete on an industrial scale. This can provide added value to abundant local wastes while contributing to a circular concrete economy.

1. Introduction

Construction plays a fundamental role in a country’s socio-economic development since it promotes a sustainable built environment, greener and more inclusive societies, improvements to people’s quality of life, economic growth, and job creation. The predicted growth in the world’s population (by 2050, it is expected to increase by more than 2000 million people [1]) and the need for housing and infrastructure will further highlight the role of the construction sector. Thus, construction stakeholders—engineers, architects, construction managers, urban planners, etc.—face the great challenge of promoting the sustainable development of construction [2].
On the other hand, the escalating growth rates of the global population directly impact production volumes. Consequently, there is a heightened generation of industrial waste, which is a significant concern in the modern world. As industries continue to expand and diversify, the quantity and complexity of industrial waste materials have also increased. These waste products can encompass a broad spectrum of materials, including hazardous chemicals, non-recyclable plastics, and various by-products of manufacturing processes, which, if disposed of irregularly—for example, in landfill sites—can cause major environmental problems. Effective waste management practices, such as recycling, reusing, and responsible disposal, are paramount to mitigate the environmental and societal impacts caused by industrial waste generation [3].
The World Green Building Council has identified that building materials can meet at least 9 of the 17 Sustainable Development Goals of the 2030 Agenda [4]. Thus, there is a growing interest in using greener materials, namely locally available materials and those including abundant waste or by-products with no added value. This is particularly true for the concrete products industry, as concrete is the most consumed material in the world after water. Concrete’s ability to incorporate waste or by-products provides a key opportunity to boost the efficient use of resources, moving towards a cleaner and more circular economy and helping to make it more resource-efficient and competitive [5,6,7].
Glass is widely used in daily life, as it is durable, non-porous, and resistant to chemicals, making it versatile for various applications. However, there are significant problems with its irregular disposal in landfills, as glass products are not biodegradable. Approximately 130 million tons of glass are produced annually [8]. But in many countries, much of this material is not recycled. In the United States alone, 12.3 million tons were produced in 2018; of these, only 31.3% were estimated to be recycled. All of the rest were deposited in landfills [9]. In the European Union, around 80.1% of glass bottles and jars were collected for recycling in 2021 [10]. About 980 000 tons of waste glass are produced in Brazil, but only 47% of this material is recycled [11].
These figures show how much needs to be recycled and reused. As a result, GP has been under consideration for inclusion in concrete to replace both aggregates and cement. GP is particularly interesting as a supplementary cementitious material since glass particles smaller than 75 µm exhibit relevant pozzolanic behaviour. In this context, the silica contained in the glass interacts with calcium hydrates (Ca(OH)2), resulting in the formation of calcium silicate hydrate (CSH) [12]. Promising results have been observed in the literature, as some of the following examples indicate. The mechanical strengths of mortar containing GP as a cement substitute increased significantly between 28 and 90 days, indicating pozzolanic activity [13]. Another investigation into GP as a cement substitute, but in three different grain size fractions, 45, 75, and 150 μm, concluded that grain size is inversely proportional to its pozzolanic activity, i.e., the smaller the size of the glass powder, the better the results [14]. Another study found that compressive and flexural strengths increased up to a 20% substitution rate of GP with cement, and then these properties gradually decreased as the substitution content increased [15]. In addition, ultra-high performance cementitious composite incorporating GP with different substitution proportions, namely, 0%, 10%, 20%, 30% and 50%, concluded that its addition at different levels resulted in high mechanical strength [16]. Also, research into ultra-high-performance concrete showed that the higher the GP content, the higher the workability [17].
On the other hand, quartz powder (QP) is waste from quartz processing, a mineral stone composed of silica [18]. Some studies show that QP can be used as an SMC or fine aggregate in cement-based materials. QP is chemically inert at room temperature [19]. This characteristic favours the acceleration of the clinker hydration reaction [20]. Despite the use of QP usually concerning high- and ultra-high-performance concrete, there are studies on its application in architectural white concrete, pointing out the great feasibility of its application [21].
As such, both GP and QP have great potential for incorporation into the construction industry in the manufacture of concrete, with engineering and environmental benefits.

2. Research Significance and Objectives

Concrete masonry block formulations (see Figure 1) comprise cement, aggregates, and water. It can be produced by manual, pneumatic, or hydraulic equipment using vibro-compaction and immediate extrusion. To ensure compaction and homogeneity, the moulded concrete must follow a careful process without cracks and damage that could lead to poor settlement, which may compromise strength and durability properties [22].
Some studies have pointed to the possibility of incorporating waste into concrete blocks [23,24,25,26,27]. However, most studies used recycled aggregate or plastic waste as coarse aggregate replacement. Incorporating steel slag in concrete blocks up to 80%, partially replacing natural aggregates, showed promising results [28]. Another study showed the feasibility of producing recycled concrete blocks by incorporating recycled aggregates from the blocks [29]. However, to the best of the authors’ knowledge, no studies were found on incorporating GP and QP for concrete masonry block production as cement and fine aggregate replacement.
The main objective of this work is to develop more eco-efficient concrete mixes for vibro-compressed non-structural concrete blocks. As such, using QP, a mining waste, is foreseen as a partial replacement for the fine aggregate and incorporating ground glass waste as a substitute for a fraction of Portland cement. Initially, compositions at the mortar level (cement, glass powder, water, admixture, and fine aggregate) were studied. Afterwards, a concrete study was conducted using the best cementitious materials combination. Subsequently, concrete characterisation was carried out, including mechanical strength, young modulus, water absorption, electrical resistivity, and ultrasonic pulse velocity. To achieve the main objective, the following specific objectives are outlined:
  • Develop mortar compositions considering performance requirements for vibro-compressed concrete blocks, particularly workability and mechanical strength, while maximising the incorporation of QP and GP.
  • Scale up the optimal mortars to concrete and proceed with their characterisation regarding workability, mechanical strength, water absorption, and non-destructive tests.
  • Propose cleaner concrete compositions for the precast concrete block industry.

3. Materials and Methodology

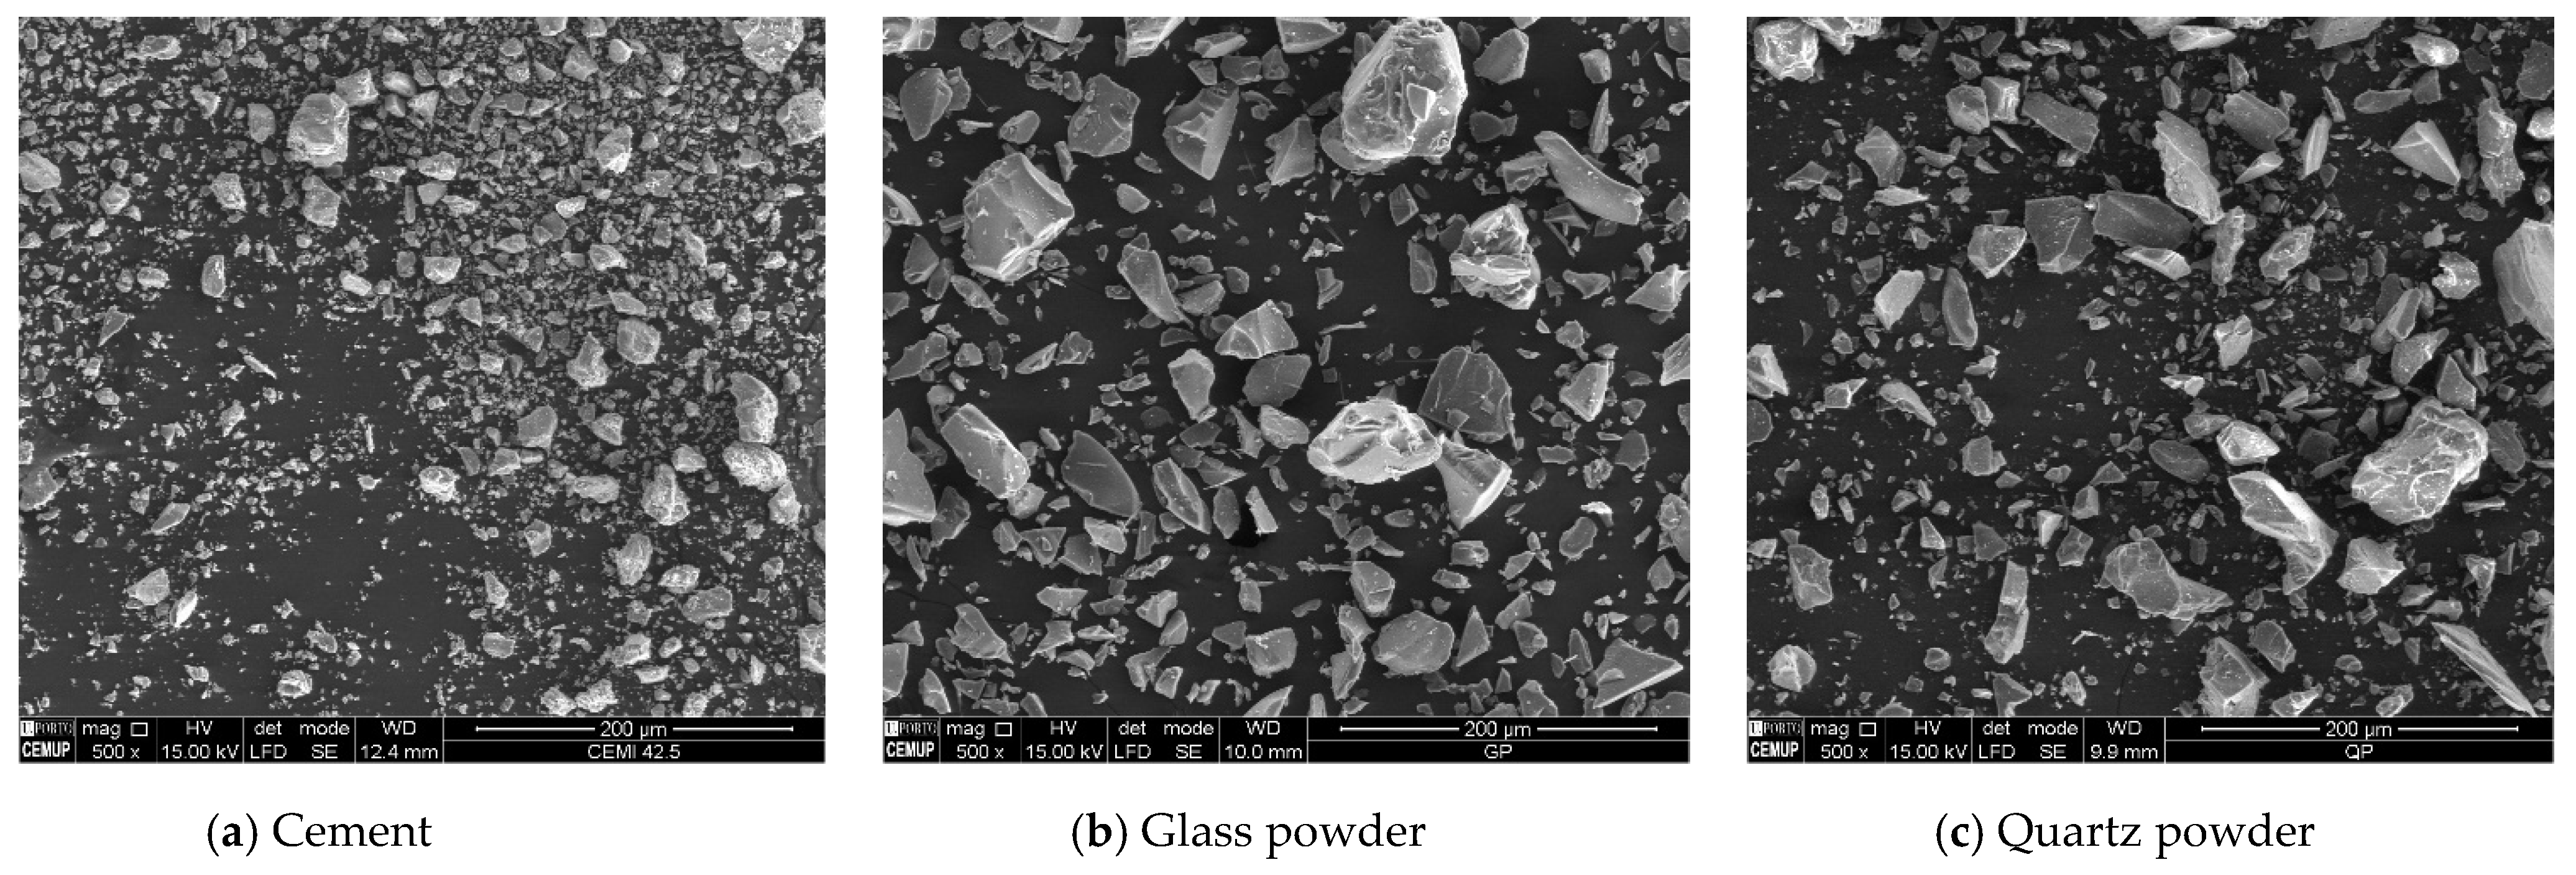
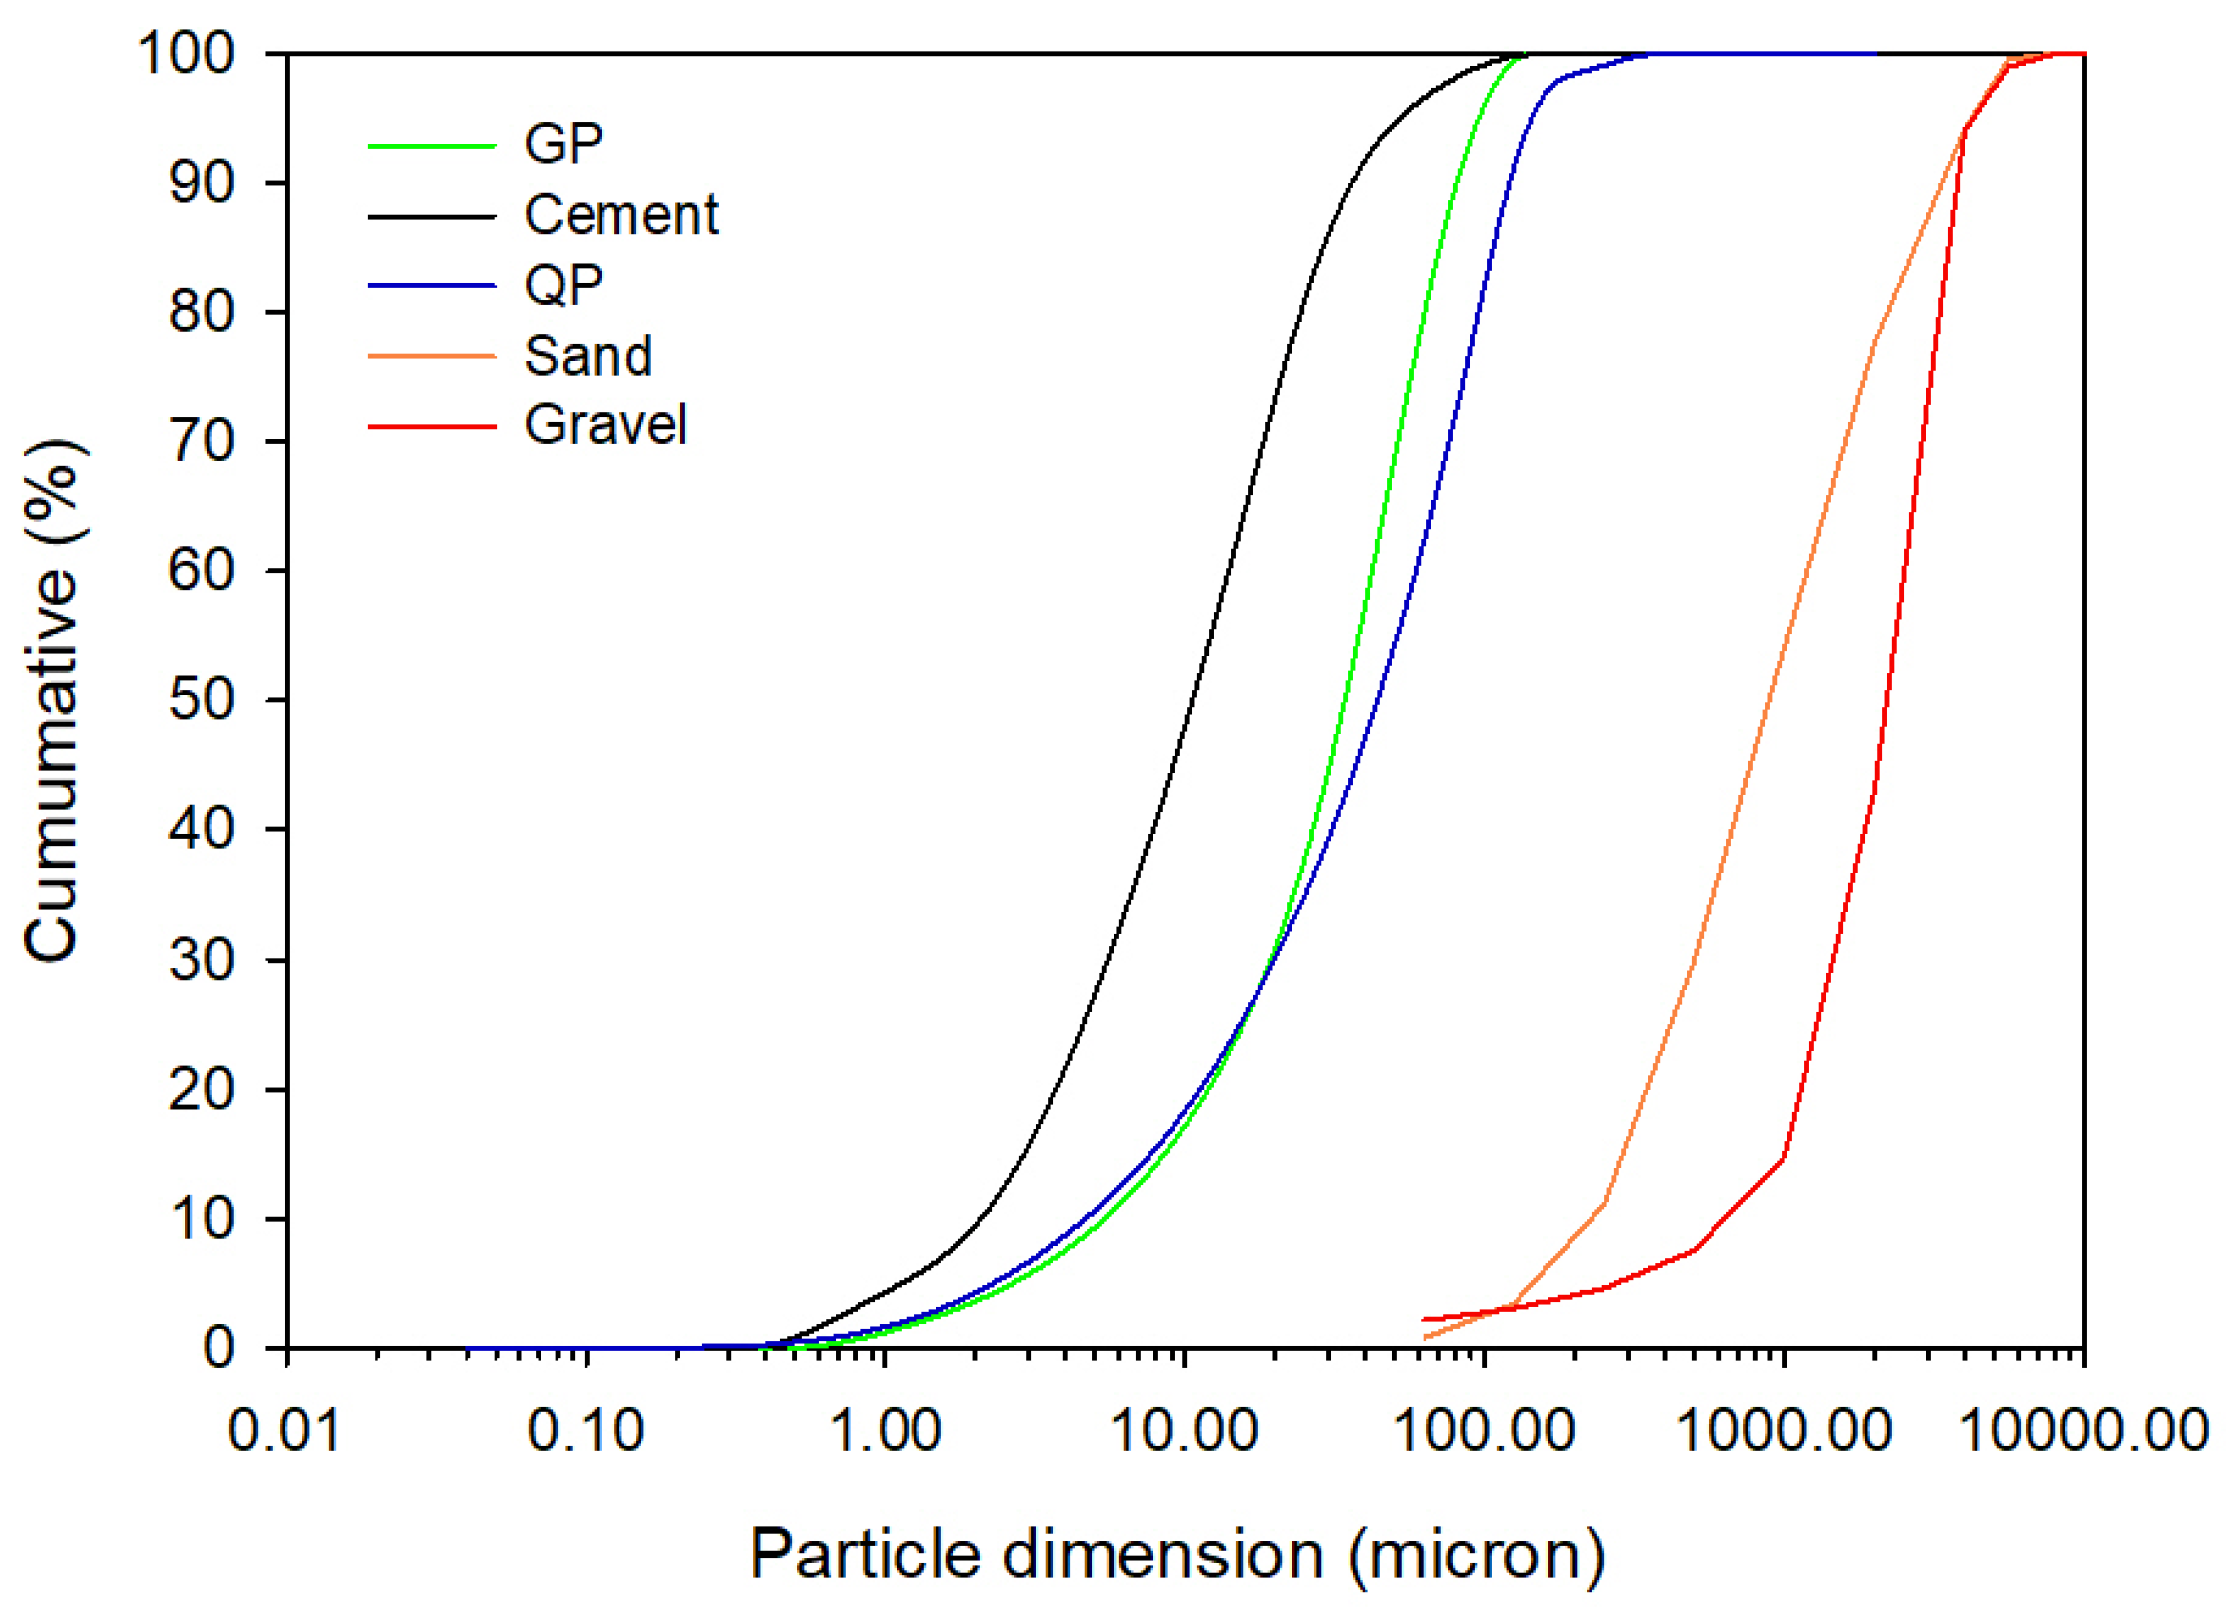
3.1. Raw Material Characterisation

The materials selection was based on locally available raw materials in the Portuguese market, except GP and QP, which were obtained from the glass recycling and mining industries, respectively. The glass waste was wet milled on an industry scale (d50 = 35 µm) until it reached a particle size similar to cement. The QP was used as supplied by the mining industry and only dried until constant mass before use (d50 = 48 µm).
For mortar and concrete tests, Portland cement CEM I 42.5R (complying with EN 197-1 [30]) GP, QP, silicious sand, and gravel (only for concrete) were used. In addition, a commercially available admixture for non-structural concrete with a specific gravity of 1250 kg/m3 and 37.0% solids content was introduced. Table 1 summarises the fundamental characterisation of the chemical, physical, and mechanical properties of cement, GP, and QP.
The particle size of cement, GP, and QP was measured by the laser method through Mastersizer 2000 and using the Mie Model according to the recommendations of ISO 13320. The sieving method prescribed in EN 933-1 [31] determined the particle size of the aggregates. Figure 2 presents the particle size distribution of solid materials. It is important to note that cement, GP, and QP were determined using the laser method, and sand and gravel were determined using the sieving method.
The morphology of cement, GP, and QP particles was observed using SEM in secondary electron (SE) mode. As shown in Figure 2, waste glass particles presented a wide size range (corroborating the particle size distribution analysis in Figure 3), and some particles presented sharp edges.

3.2. Preliminary Mortar Studies

Since both GP and QP are “innovative” materials applied in vibro-compressed concrete for concrete blocks, a step-by-step process was required to find an appropriate mix composition. Initially, the best combination of powder materials, water, and superplasticiser was studied at the mortar level.
The mortars were produced using a mortar mixture according to EN 196-1 [32], using the low-speed option. The following pre-established sequence was adopted: first, the solid materials were mixed for 30 s, then water and the admixture were incorporated, mixing for an additional 150 s. Afterwards, any material adhering to the drum and the paddle was carefully removed with a spatula. Finally, a final mix was performed for 60 s at the same speed. The study included 11 different proportions of mortar mixtures, shown in Table 2, including the workability and compressive strength results (two last lines).
The workability was measured immediately after production. Requirements for the vibro-compressed concrete of mortar were defined as “zero slump”. For that, a flow table and a brass cone in accordance with EN 12350-5 [33] were used. For the slump flow test, the fresh mortar was cast in two layers of the brass cone, and each layer was tamped 10 times with a special tamping rod. After cutting off the extra mortar by drawing a straight edge with a trowel, the brass cone mould was lifted away from the mortar. If the fresh mortar kept the brass cone shape without deformation or material loss, as depicted in Figure 4, it was considered a valid mortar mixture for vibro-compressed concrete.
Then, prismatic specimens (40 × 40 × 160 mm3) were cast and compacted using a vibration table for 30 s. Specimens remained for 48 h in the moulds and were then air cured in a controlled environment (Temperature 20 ± 2 °C and HR = 50 ± 2%) until the testing age (mechanical strength). The tests were performed on mixes 1 to 8, on prismatic test specimens, at an age of 7 days (see Table 2). Mixtures 9, 10, and 11 were tested at 28 days (see Table 2).
Several trials were made to set the cement, water, and admixture content, as seen in Table 2 (mix 1 to mix 8). Then, the ideal cement replacement dosage with GP and QP was determined. Mixtures containing 10% cement replacement by GP, by weight, (mix. 9 and mix. 10, respectively) were produced and tested at the fresh state (to check “zero slump” condition previously described), and the mechanical strength was tested at 28 days. Fresh properties and the mechanical strength of the studied mortars with “zero slump” can be seen in Table 2. It can be observed, as expected, that cement replacement decreased the mechanical strength. These mixtures were chosen as a basis for the experimental concrete.

3.3. Experimental Programme—Concrete Level

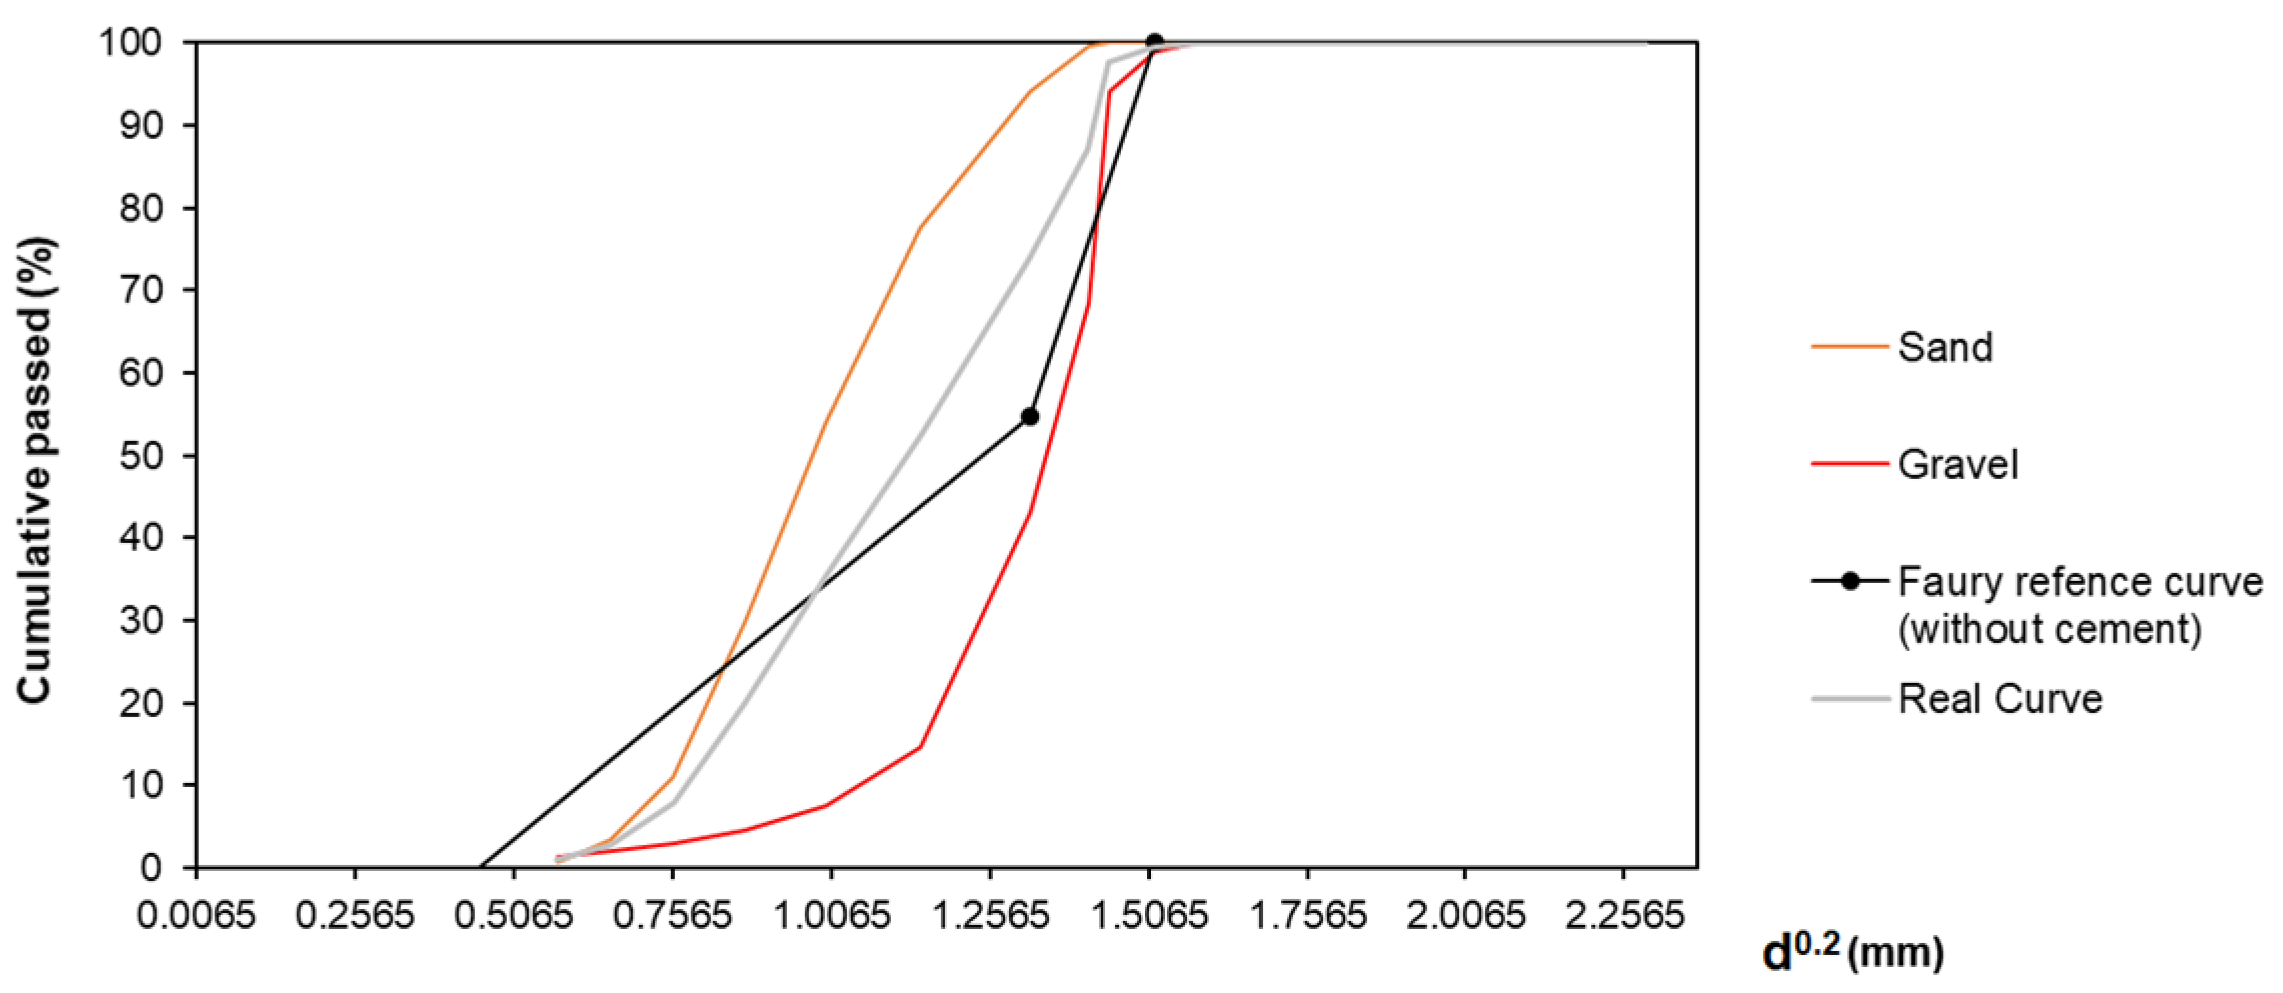
3.3.1. Concrete Mix Design

Mortar properties adequate for vibro-compressed were well defined at this level, and if target values are achieved, in the next stage, tests on concrete, although essential, are reduced to a minimum. Final trials at the concrete level were necessary to quantify the coarse aggregate amount, adjust admixture dosage (if necessary), and confirm the “zero slump” of the formulated mixtures.
The most common concrete mix design methods are based on experiments and reference curves. The experimental method requires a significant workforce and can be very time-consuming. The reference curve methods result from research work developed by specialists such as Faury, Joisel, and Dreux and are still widely used today. These methods aim to achieve an ideal mix design curve that includes aggregates and cement and also allows for the establishment of a granulometric curve of maximum compactness with the available aggregates.
The concrete mix design methods employed in this current work were based on the Faury and ACI recommendations for zero slump concrete, namely Annex 5 of the ACI 211.3R-02 [34] guide, which establishes a set of rules for obtaining the composition of concrete that is used in the production of masonry blocks and whose manufacture is carried out using vibro-compressor machines.
The best combination of aggregates was calculated in automatic Excel spreadsheets based on the Faury method, including the American recommendations for zero slump concrete. An example of Faury curves used in this current work is presented in Figure 5. Considering that 1 m3 of concrete is composed of the sum of its constituents—in this case, the binder (cement and GP), water, aggregates, and voids—and since the density of each of these materials is known (see Section 3.1), it is possible to quantify each of the constituents by mass, through the proportion adopted between them. The concrete mixture proportions are presented in Table 3.

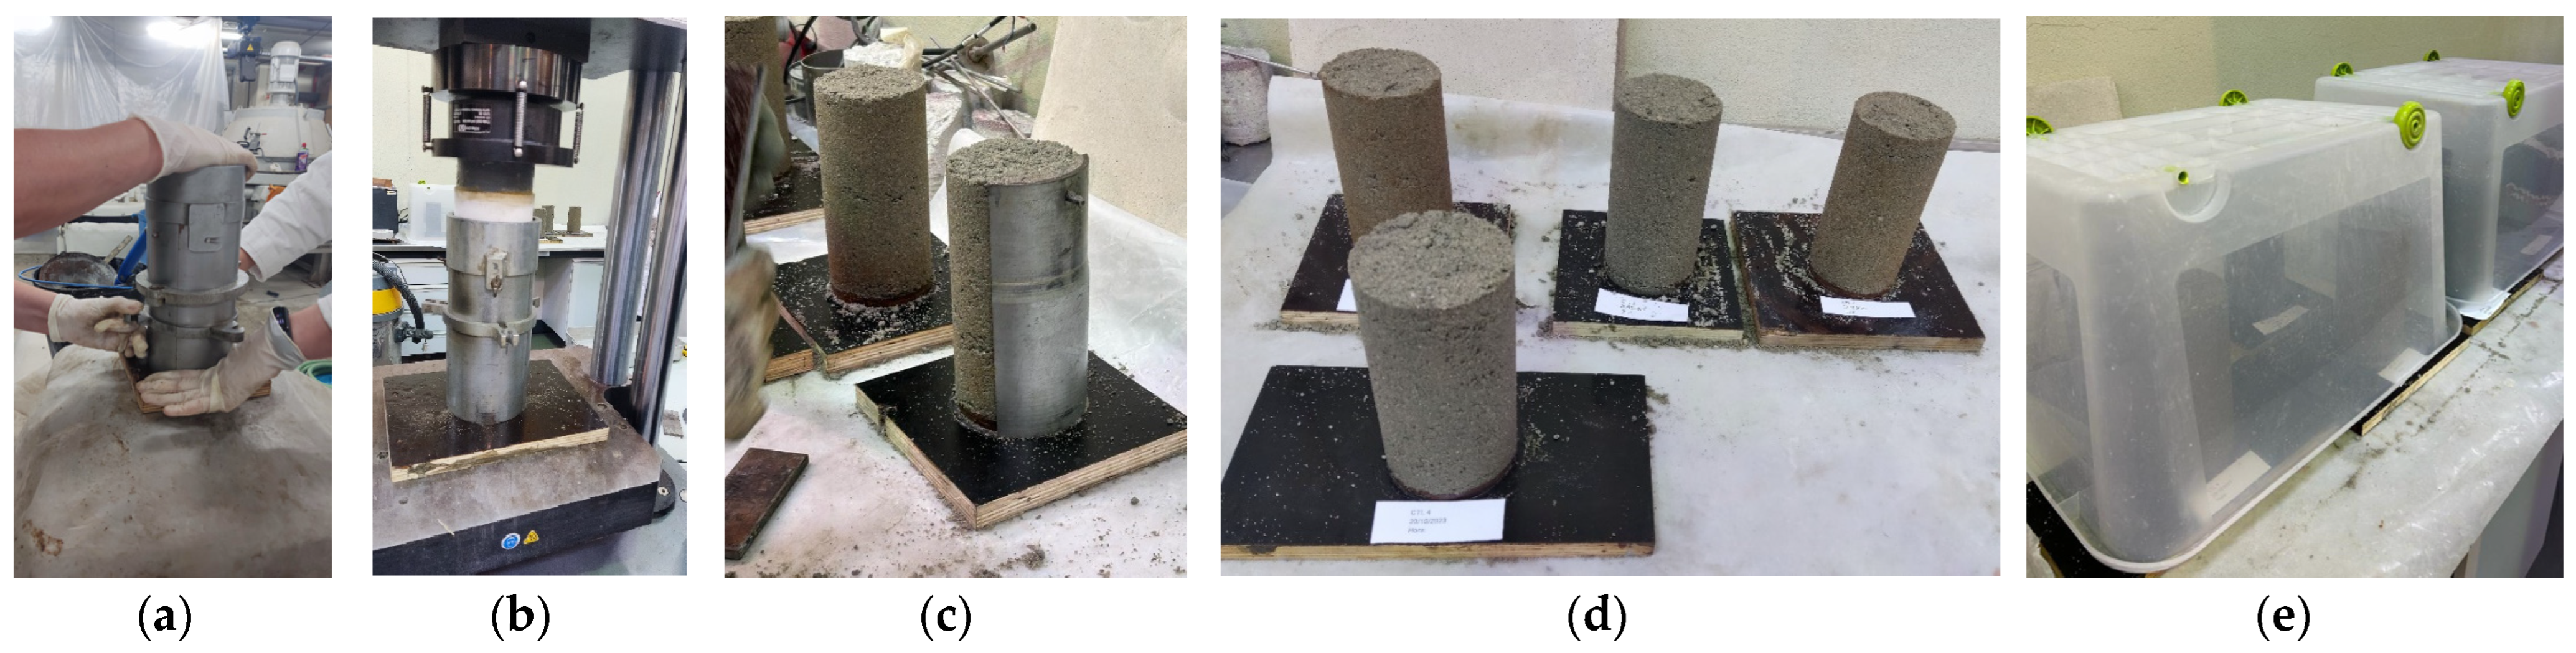
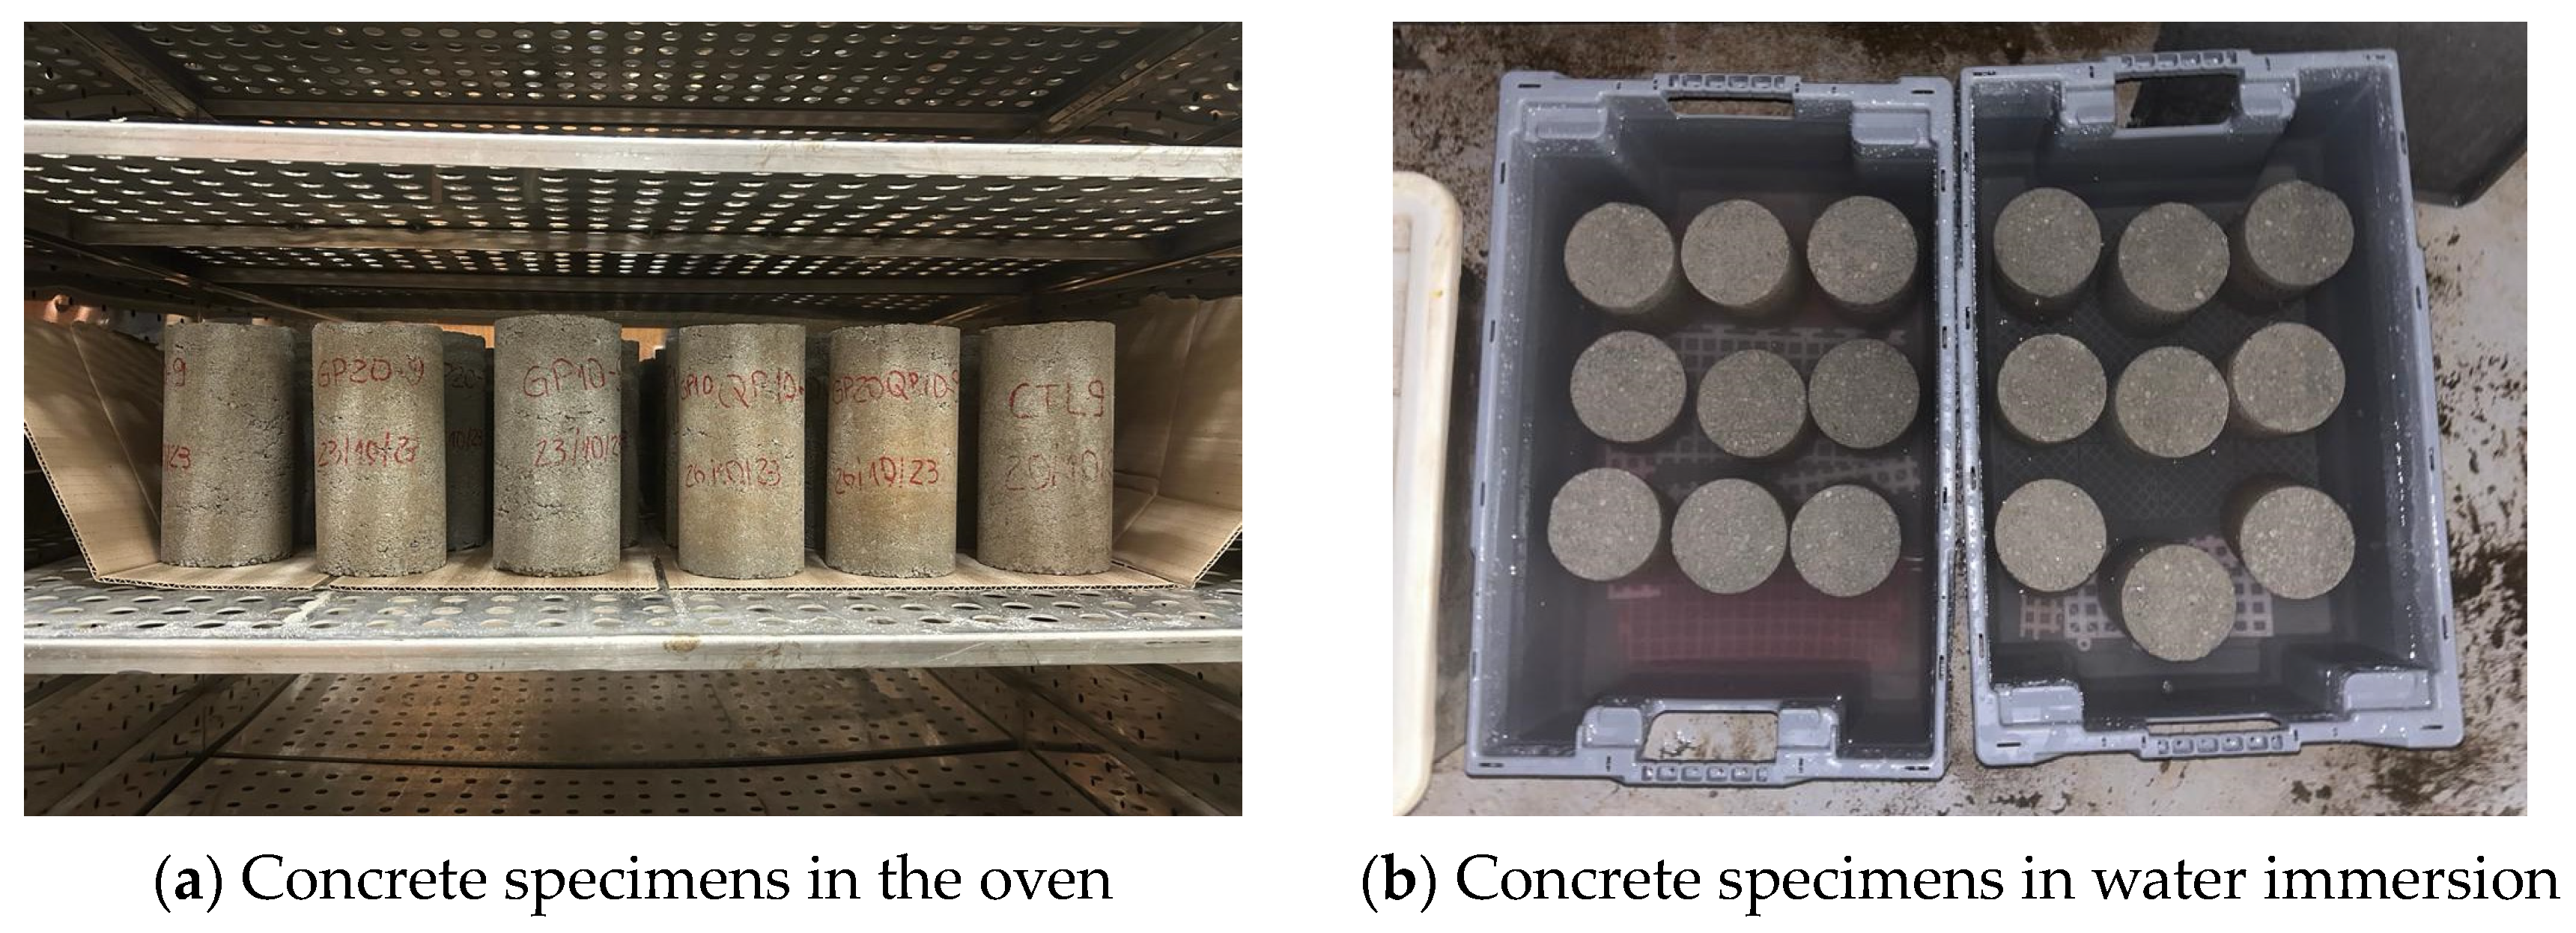
3.3.2. Concrete Specimens Production

Mixes were prepared in the laboratory in 15 L batches and mixed in an open pan mixer. The mixing sequence consisted of mixing sand and gravel with 25% of the mixing water for 1 min, waiting for 2 min for absorption and adding the powder materials, and adding the remaining water with the admixture and mixing the concrete for 5 min.
Afterwards, a tripartite metallic mould with wooden bases with a 200 mm height and 100 mm diameter was filled with concrete and placed on top of the Retsch A 200 Basic sieve vibration machine; see Figure 6a. The vibration equipment is programmed for a fixed vibration frequency of 60 Hz, but the vibration time and amplitude are adjustable. The amplitude ranges from 1 to 100%, representing a 0 to 3 mm variation in millimetres. The moulds were filled in two concrete layers, each one vibrated for 30 s. Regarding amplitude, 70% was adopted on the scale of the machine, which is equivalent to 2.1 mm, according to previous work [35]. Immediately after the end of the vibration, the specimens were transported to the Instron 300 DX press machine, and the load was applied at increments of 0.5 mm per second. The compression load varied between 50 and 75 s until a maximum load of 16 (±1) kN was reached; see Figure 6b. The load was maintained for 1 min. These steps aimed to simulate the vibro compression process, even though, at a laboratory scale, it was not possible to apply vibration and compression simultaneously. The specimens were demoulded immediately afterwards. The tripartite mould was dismantled, while the specimen remained on the wooden base; see Figure 6c,d.
For each concrete mix composition (presented in Table 3), 9 cylindrical specimens with a 200 mm height and 100 mm diameter were produced. “In situ” curing chambers were prepared, as transporting the specimens to the laboratory curing room would not have been recommended due to the risk of the specimens falling apart during transportation. These in situ curing chambers were prepared using inverted plastic boxes, as shown in Figure 6e, and were kept in those conditions for 48 h. Afterwards, the specimens were moved to a controlled environment room (Temperature 20 ± 2 °C and HR = 50 ± 2%) and separated from wooden bases.
The UPV and electrical resistivity tests at predefined ages were performed in the controlled environment room. The water absorption, modulus of elasticity, and compressive strength were assessed at 28 days.

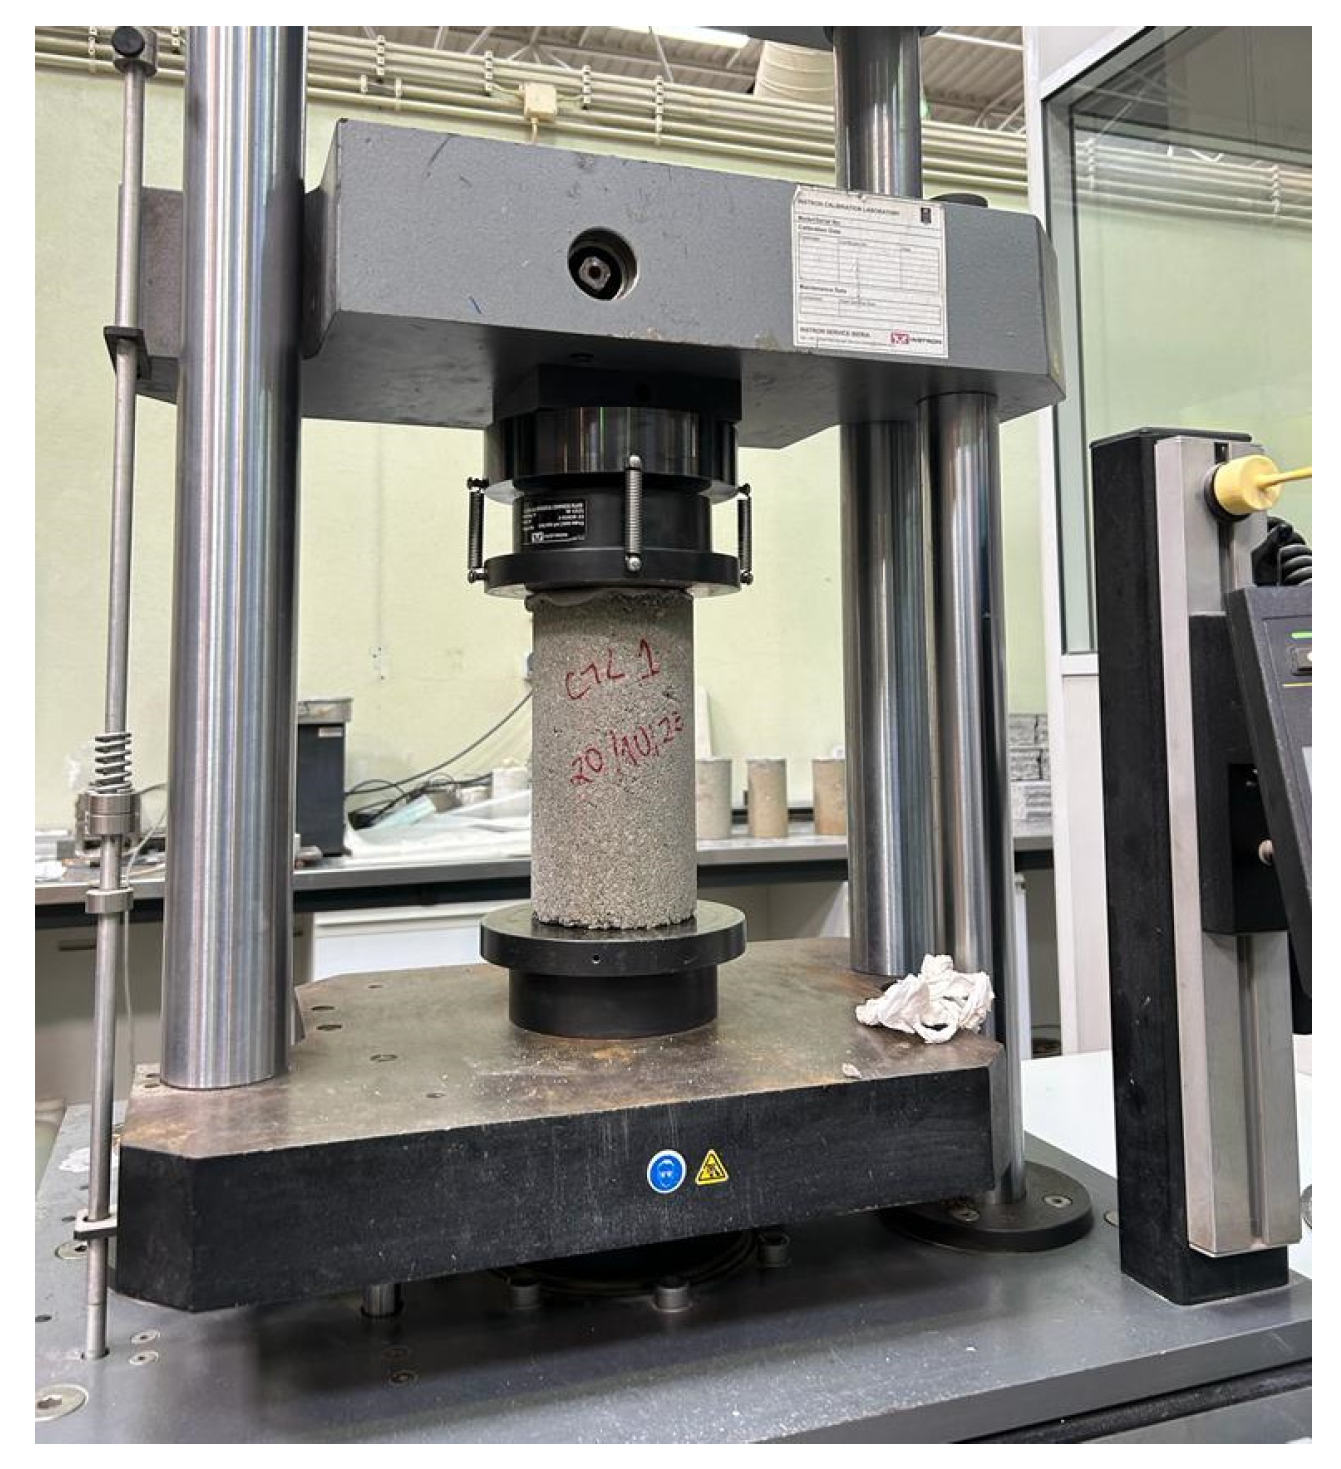
3.3.3. Mechanical Strength and Young’s Modulus

The compression tests were carried out in accordance with NP EN 12390-6 [36], with the following adaptations. The test was performed in cylindrical concrete specimens with a 200 mm height and 100 mm diameter (six for each concrete mixture, see Table 3), produced as described in Section 3.3.1. Additionally, the test was performed in displacement control, in which increments of 0.01 mm/s were applied through an Instron 300 DX press machine, as depicted in Figure 7. Previously, a layer of cement grout was applied to regularise the surfaces of the concrete specimens.
Young’s modulus was measured following the DIN 1048-5 [37], except for the load, which had to be reduced to 0.06 MPa/s to obtain a typical diagram for this test. The test was carried out on 3 cylindrical specimens for each concrete mixture; see Figure 8. The maximum load applied during the test to determine the modulus of elasticity of the concrete was calculated according to the compressive strength previously determined.

3.3.4. Water Absorption by Immersion

Water absorption by immersion was determined according to NBR 9778 [38]. In brief, after curing for 28 days in a controlled environment room (Temperature 20 ± 2 °C and HR = 50 ± 2%), the concrete cylindrical specimens were oven-dried at 105 ± 5 °C for 72 h, as shown in Figure 9a. Afterwards, the samples were cooled in the laboratory environment, and the dry mass (ms) was recorded. Then, the concrete specimens were water immersed for 72 h at 20 ± 2 °C, as seen in Figure 9b. Finally, the specimens were taken to a container of hot water, where they were heated up to boiling for over 5 h. After 5 h, the heat source was switched off, and the specimens were cooled to reach room temperature so that the immersed masses (mi) could be determined using a hydrostatic scale to determine the saturated mass (msat).
With the recorded values in the previous steps, it was possible to obtain various concrete parameters in accordance with NBR 9778 [38], such as calculating water absorption (A) in percentage using the following expression:
A = m s a t m s m s · 100 (%)
Additionally, the void index (Iv) can be determined by this equation:
I v = m s a t m s m s a t m i · 100 (%)
Furthermore, the specific mass of the dry sample (ρs) and the saturated sample (ρsat) can be calculated using these expressions:
ρ s = m s m s a t m i
ρ s a t = m s a t m s a t m i

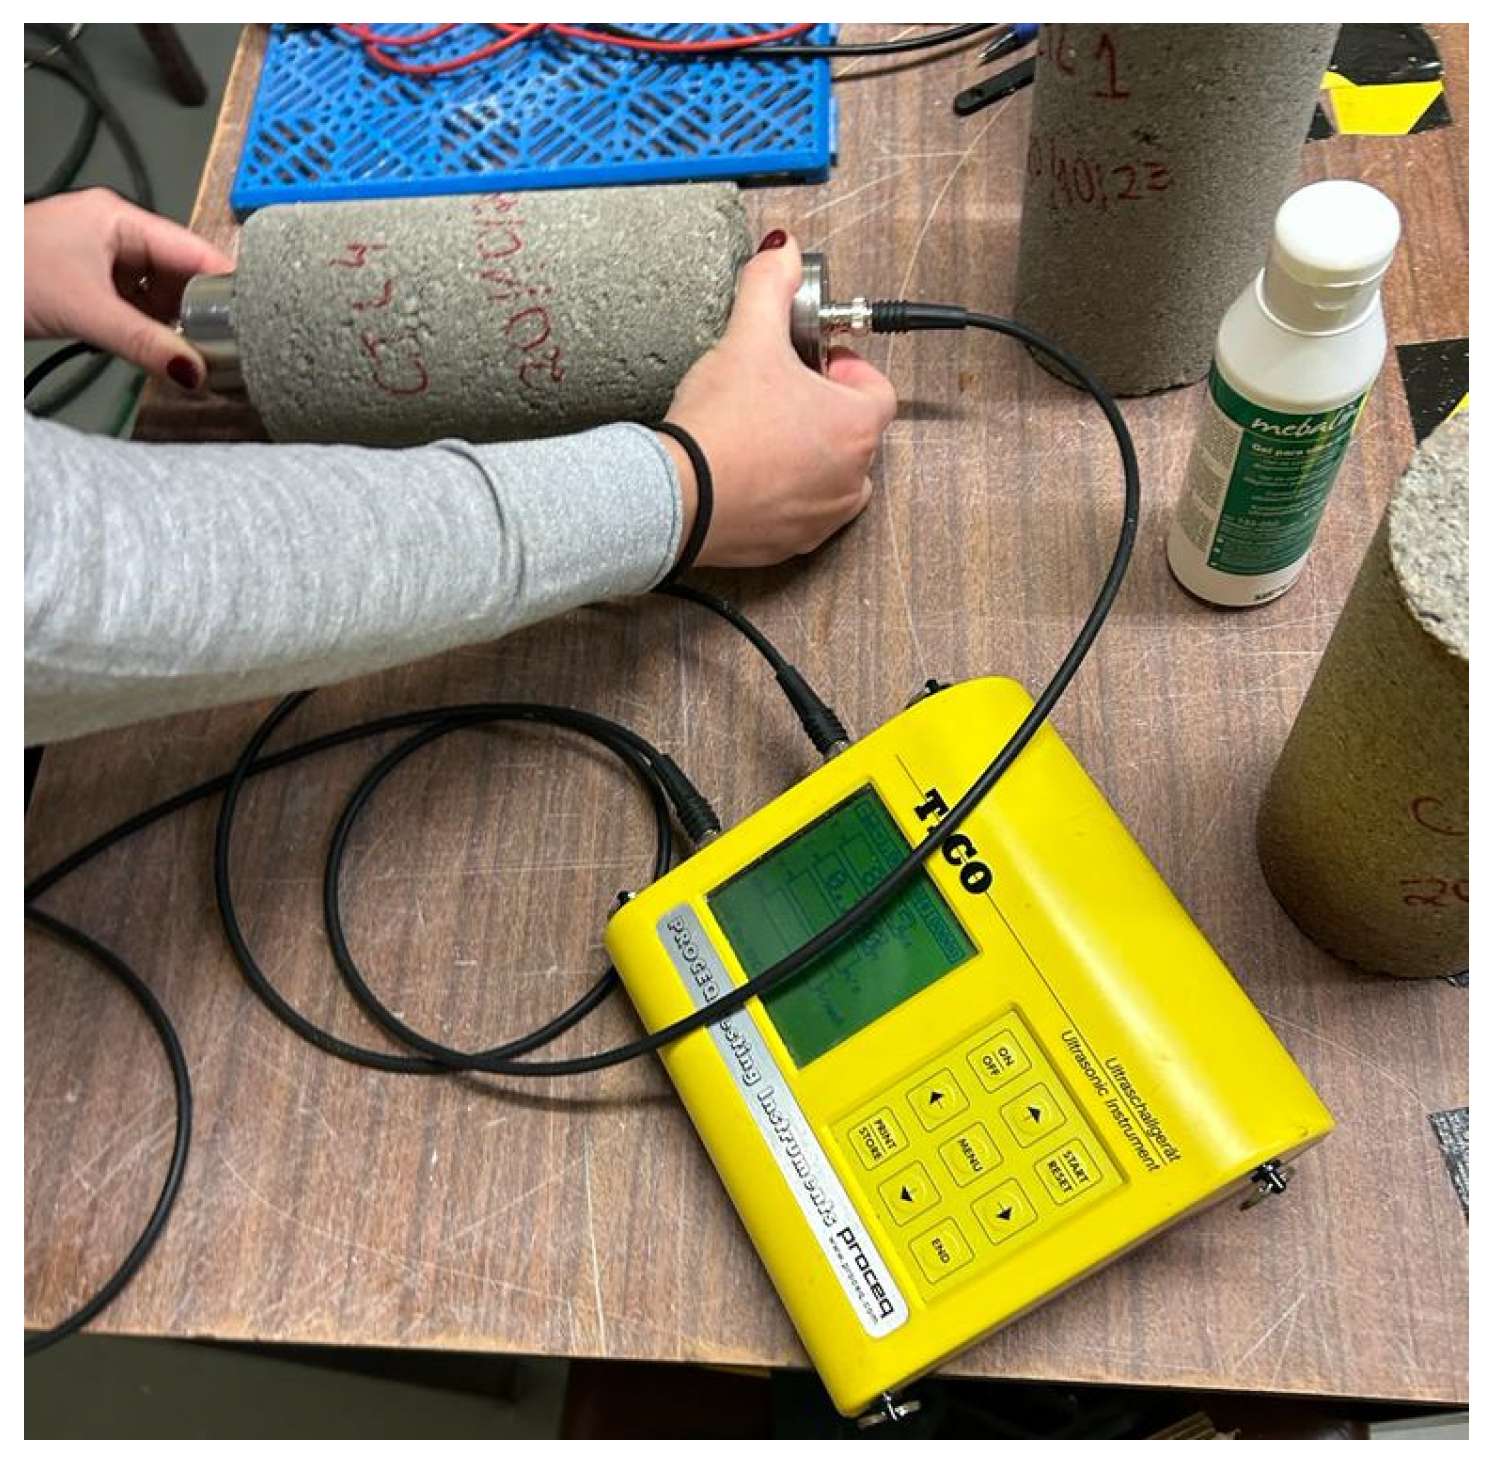
3.3.5. UPV and Electrical Resistivity

Concrete UPV was assessed according to NP EN 12504-4 [39] on cylindrical specimens (ϕ = 100 mm; h = 200 mm). The ultrasound velocity was measured on 6 specimens for each concrete mixture under study (Table 3); see Figure 10. The direct transmission method was used, and the ultrasound propagation speed calculation corresponded to the quotient between the length of the specimen and the time it took to cross that same path.
Concrete electrical resistivity was assessed using a two-electrode setup on the same six concrete cylindrical specimens (ϕ = 100 mm; h = 200 mm). For the direct test, a low-frequency electrical current was passed between the two electrodes (two stainless steel plates) while the voltage change was measured (see Figure 11). To ensure good electrical contact between the specimen and electrodes, a wet sponge was positioned, and a force was applied to maintain a constant and uniform stress distribution over the entire surface of the specimen. Resistivity was obtained from the electrical resistance (calculated from the potential response using Ohm’s law) and a geometric factor, applying Equation (5).
ρ = V A I L
where V , voltage (Volts); I , current (A); L , length (m); and A (m2) the cross area of the test specimen through which the current passed.
Since all the specimens were at the same moisture in a controlled environment room (Temperature 20 ± 2 °C and HR = 50 ± 2%), resistivity testing may provide information about pore connectivity and the resistance of concrete to the penetration of liquid or gas substances.

4. Results and Discussion

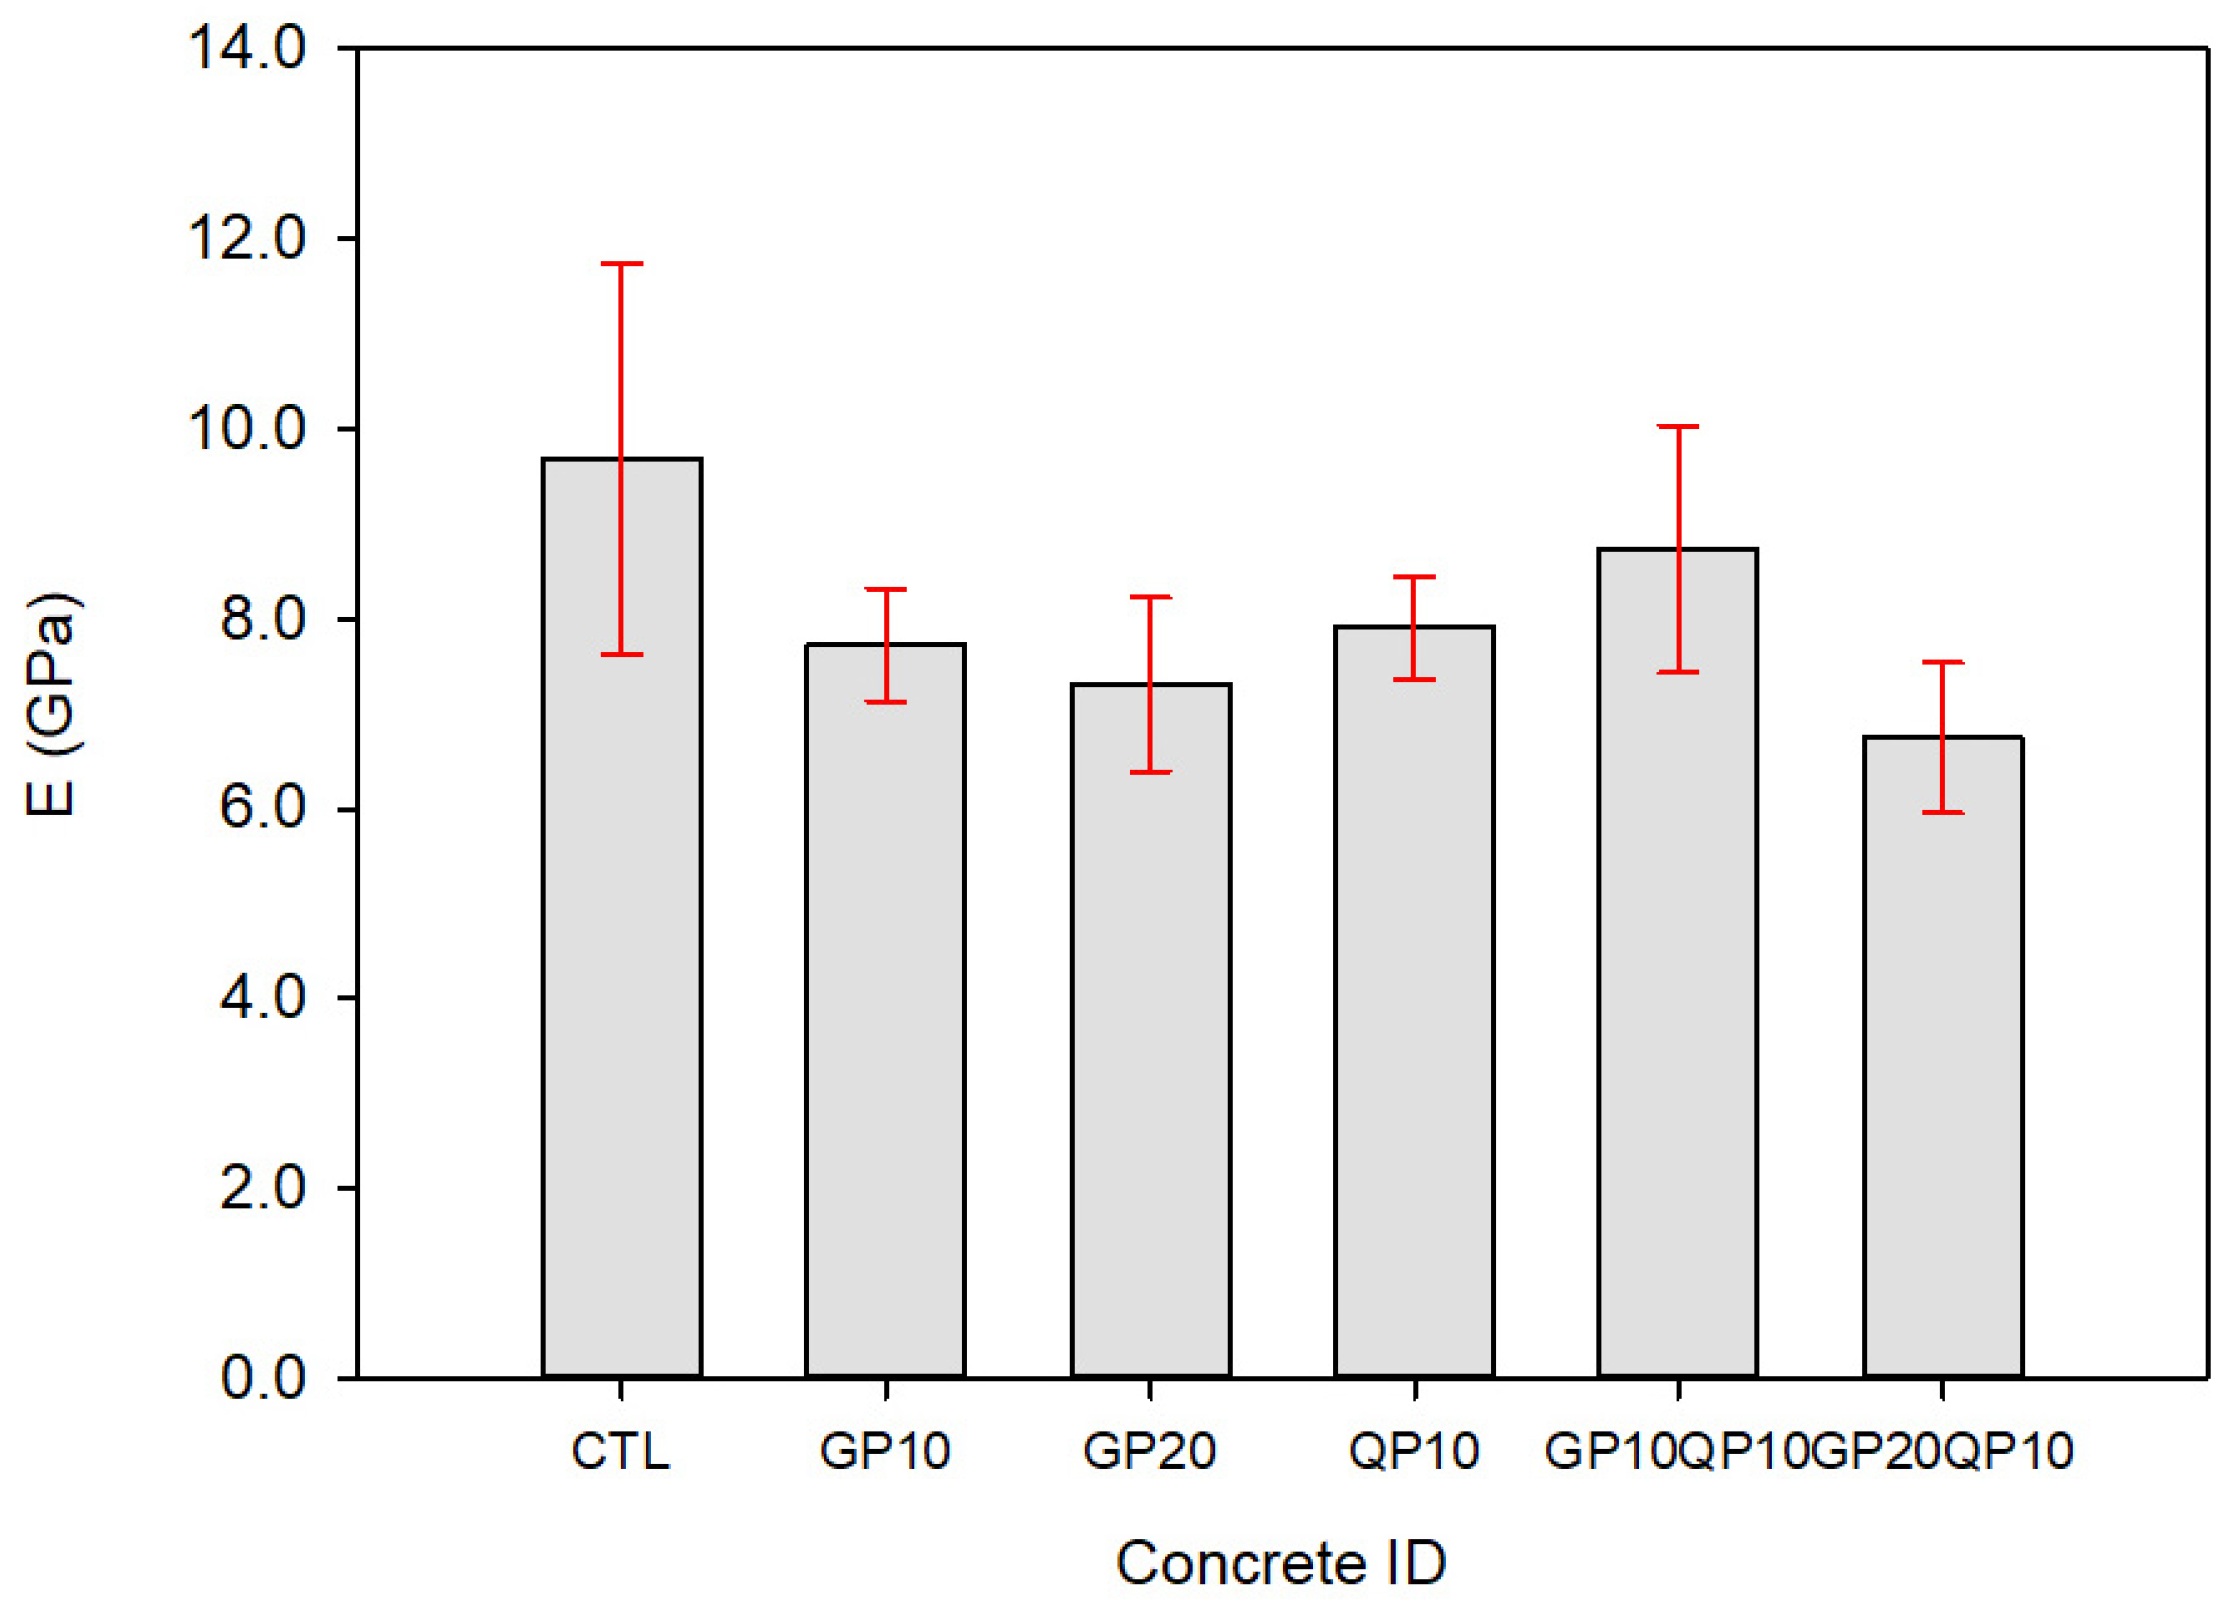
4.1. Mechanical Strength and Young’s Modulus

The compressive strength test results for the cylindrical concrete specimens are shown in Figure 12. For each concrete mixture (see Table 3), six specimens were tested at 28 days; the average result is considered the compressive strength at 28 days.
As can be perceived, the compressive strength of the concrete mixtures under study varied between 2.0 and 5.4 MPa. The highest compressive strength was reached for GP10QP10 concrete, which was very promising, followed by the reference mixture (CTL), which achieved 4.2 MPa. Partial cement replacement by GP decreased compressive strength, as observed in previous research. The same occurred for QP10 concrete; a partial sand replacement by QP resulted in a slight decrease compared to the CTL mixture. Concerning GP, a lower PSD would be beneficial for pozzolanic ability [40,41,42,43,44,45,46,47,48], since from past research, the smaller the particle size, the higher the pozzolanic reactivity of the glass powder particles [38].
The Brazilian standard ABNT NBR 6136 [22] defines the requirements for hollow concrete masonry blocks. For non-structural concrete blocks, a compressive strength higher than 3 MPa must be reached in blocks when normal-density aggregate is used. In this current research work, the compressive strength was assessed on typical cylindrical specimens since concrete mix designs are the focus of this study. With some limitations, one can say that GP10 and GP20 concrete did not pass the test. It must also be noted that the vibro compression applied in the laboratory (explained in Section 3.3.1) may not exactly represent the industrial-scale process.
Figure 13 shows Young’s modulus results for the concrete mixtures under study (see Table 3). The result for each concrete mixture corresponded to the average of three specimens. Young’s modulus varied between 6.7 and 9.7 GPa, a narrow range compared to compressive strength. The highest Young’s modulus result was obtained for reference concrete mixture (CTL), followed by GP10QP10.

4.2. Water Absorption by Immersion

The water absorption test results are presented in Table 4, and each result corresponds to the average of three concrete specimens for each concrete mix shown in Table 3. Besides water absorption (A), other measures can be calculated, namely, void index (Iv), specific mass of the dry sample (ρs), and the saturated sample (ρsat) (as explained in Section 3.3.4), which are also presented in Table 4. In this case, the lower the results, the better the concrete resistance to water. The results varied between 8.92% and 17.90%, and the lowest absorption was obtained by GP20 concrete specimens. According to the Brazilian standard ABNT NBR 6136 [22], hollow concrete blocks for concrete masonry must present an absorption lower than 11% when normal-density aggregates are used. In this case, since cylindrical concrete specimens were used, the authors followed the procedure of NBR 9778 [38]. However, with some precautions, it can be perceived that GP10 and GP20QP10 concrete absorption values were higher than 11%. Surprisingly, GP20 reached the lowest absorption with a value of 8.90%.

4.3. UPV and Electrical Resistivity

Non-destructive testing techniques, particularly the UPV, are usually employed to evaluate the quality of a concrete structure since they enable such examination without damaging it. UPV can assess the homogeneity of concrete and properties that change with time [49]. Figure 14 depicts the UPV from 7 to 28 days for the concrete specimens of the mixtures under study (see Table 3). Each UPV value for each age corresponded to the average of six specimens. As can be perceived, the UPV did not change significantly, except for CTL concrete, in which a significant increase was observed from 7 to 14 days, as well as for GP10 concrete specimens. The UPV presented a narrow range of variation among all the concrete mixtures under study, around 2–2.5 km/s at 28 days.
Electrical resistivity can be an empirical indicator of cement-based material durability [11,27,50]. Since it depends on the pore structure, such as porosity and pore connectivity, as well as pore solution conductivity, electrical resistivity provides valuable information regarding the microstructure and hydration process of cementitious materials [50,51,52]. Figure 15 shows the electrical resistivity results concerning the concrete mixtures under study between 7 and 28 days. At an early age, 7 days, the resistivity reached values between 5000 and 12,000 ohms. Afterwards, a substantial increase for all concrete types occured, reaching 20,000 and 25,000 ohmmeters at 28 days. This translates as an increase of about 400%. Figure 15 also proposes that the resistivity of all concrete mixtures would continue to increase beyond 28 days. This indicates that the hydration reaction was still undergoing due to the high w/c, which allowed for a continuous hydration reaction.
It must be noted that before the non-destructive test, the mass of each specimen was recorded to ensure that UPV and resistivity did not translate to drying. No mass loss was observed (below 1%).

4.4. Main Results Summary and Material Efficiency

Table 5 shows the main results obtained from the tests conducted in this work. Note that the variation was very low for the six concrete formulations under study for both electrical resistivity and ultrasonic pulse velocity, indicating a positive result. On the other hand, the results of the water absorption test varied considerably. The best value obtained and within the standard was for the GP20 composition, with 8.90% absorption, while the others did not reach the limit. As for compression, the individual substitutions resulted in low values compared to the reference concrete, which obtained 4.24 MPa, while the highest value obtained was 5.37 MPa for the composition that combined the two substitutions, GP10QP10. It also obtained good results for the modulus of elasticity, with 8.74 MPa, while the reference concrete obtained 9.69 MPa, a difference of less than 10%.
Besides engineering properties, global warming potential (GWP) was used as an environmental indicator of designed concrete mixtures on a volumetric basis, i.e., the sum of the embodied carbon of each constituent raw material to produce 1 m3 of each concrete mixture studied in this current work (see Table 2). The embodied CO2 for each constituent material used in the current concrete formulations was considered according to Table 5. Since GP and QP are waste materials, GWP allocation was considered zero, as defined in the European Union Directive 2008/98/EC. The embodied CO2 for all concrete mixtures is also presented in Table 5. As can be seen, the embodied CO2 was between 91 and 112 kgCO2/m3. The cement content was the most significant contributor to GWP. As expected, GP20 presented the lowest GWP since the cement content was reduced. The admixture also had significant GWP (see Table 5), even though it was used in lower dosages than the remaining constituent materials.
In addition, the relationship between the GWP (per 1 m3) of each concrete mixture and the compressive strength was investigated, as can be seen in Table 6. For that, the embodied carbon dioxide index (CI) was calculated according to previous research [53,54,55] as follows:
C I = G W P   ( K g C O 2 / m 3 ) R c , 28 d   ( M P a )
The carbon dioxide index (CI) translates the relation between the embodied CO2 and MPa of strength. As such, the lower the CI, the higher the strength with lower CO2 emissions. Thus, the best compromise between mechanical performance and ecological balance (at the material level, not considering production or transport costs) corresponds to concrete GP10QP10.

5. Conclusions

Concrete masonry blocks are used worldwide in large quantities for many applications. As such, the use of industrial waste in their manufacture represents an interesting and sustainable final waste destination, namely if generated in considerable amounts as waste glass powder and quartz powder. This current work studied the application of GP and QP for producing vibro-compressed concrete blocks with non-structural behaviour. Given the results obtained from this research, the following conclusions were drawn:
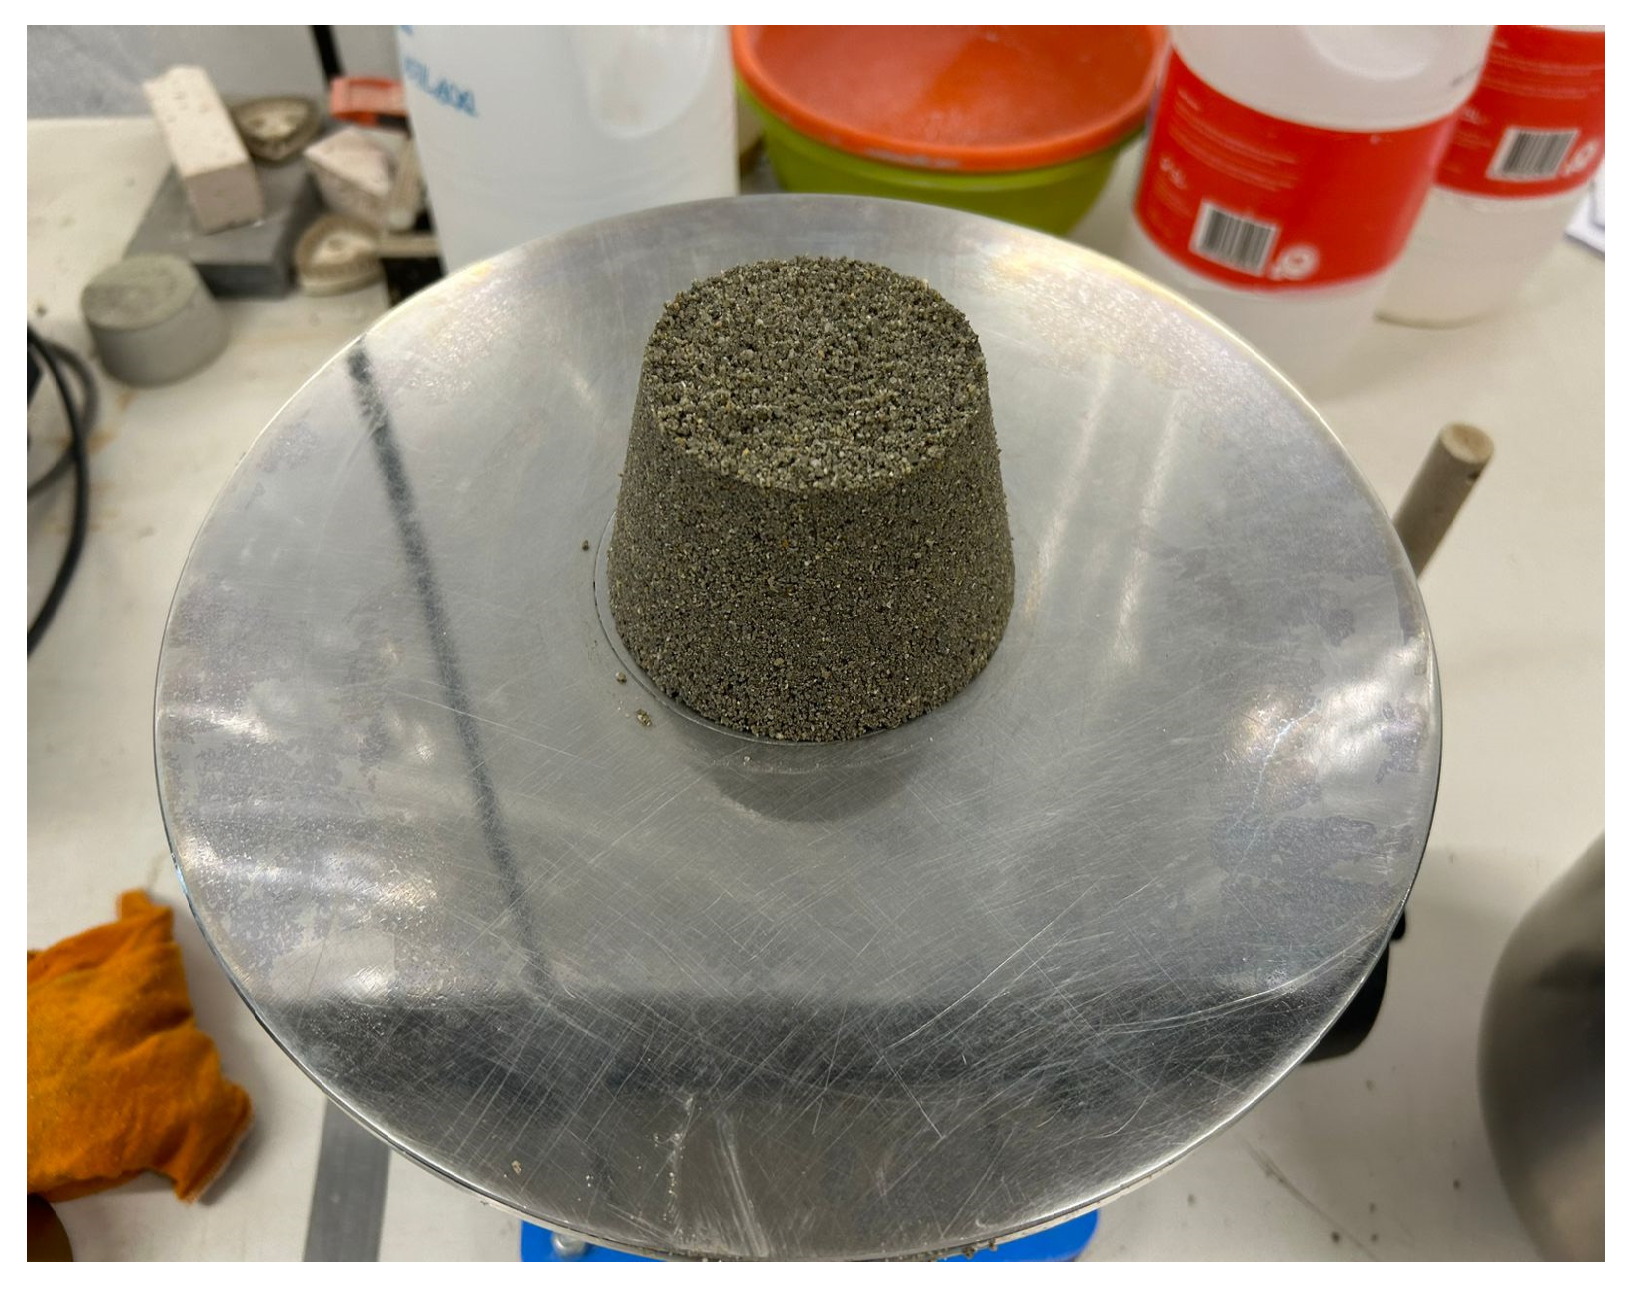
  • The best combination of cement + water + admixture was studied at the mortar level to obtain zero slump mortars for vibro-compressed concrete.
  • The compressive decreased when GP and QP were used alone; however, when combining 10% GP as a cement replacement +10% QP as a fine aggregate replacement, the compressive strength increased compared to the reference concrete.
  • Concerning water absorption, the results varied between 8.92% and 17.9%, and the lowest absorption was obtained by GP20 concrete specimens.
  • The UPV presents a narrow range of variation among all the concrete mixtures under study, around 2–2.5 km/s at 28 days.
  • By contrast, electrical resistivity was achieved at 28 days, at 20,000 and 25,000 ohmmeters, and it seemed that the resistivity of all concrete mixtures would continue to increase beyond 28 days, which indicates that the hydration reaction was still undergoing.
Even though the other results obtained were within expectations, it is worth mentioning that the casting of the concrete did not completely simulate the manufactured process on an industrial scale since vibration was not carried out simultaneously with compression, which may affect the results. However, the research showed promising results, thus proving the added value of different and abundant local waste for the precast concrete block industry.
Based on the analyses of the results, as a suggestion for future research, it is believed that it would be interesting to test other substitution levels. Moreover, this current work can be integrated with coarse aggregate replacement studies, considering previous research work [23,24,25,26,27].

Author Contributions

Conceptualization, A.M.M.; methodology, A.M.M.; software, A.M.M.; validation, A.M.M.; formal analysis, A.M.M. and G.B.P.; investigation, G.B.P.; resources, A.M.M.; data curation, G.B.P. and A.M.M.; writing—original draft preparation, G.B.P. and A.M.M.; writing—review and editing, A.M.M. and F.G.d.S.F.; visualization, A.M.M. and F.G.d.S.F.; supervision, A.M.M. and F.G.d.S.F.; project administration, A.M.M.; funding acquisition, G.B.P., A.M.M. and F.G.d.S.F. All authors have read and agreed to the published version of the manuscript.

Funding

This work was financially supported by Base Funding—UIDB/04708/2020 with DOI 10.54499/UIDB/04708/2020 (https://doi.org/10.54499/UIDB/04708/2020) and Programmatic Funding—UIDP/04708/2020 with DOI 10.54499/UIDP/04708/2020 (https://doi.org/10.54499/UIDP/04708/2020) of the CONSTRUCT—Instituto de I&D em Estruturas e Construções—funded by national funds through the FCT/MCTES (PIDDAC); by FCT—Fundação para a Ciência e a Tecnologia through the individual Scientific Employment Stimulus 2021.01765.CEECIND. The collaboration and material supply by Secil and Chryso Portugal is gratefully acknowledged. The first author would like to thank the São Paulo Research Foundation (FAPESP), Grant #2023/07772-0.

Data Availability Statement

The article contains the information that was utilized to support the study’s conclusions.

Acknowledgments

The authors would like to thank the technical support of the Structures Laboratory and Materials Laboratory of DEC-FEUP.

Conflicts of Interest

The authors declare no conflict of interest.

List of Abbreviations

AWater absorption (%)
EYoung’s Modulus (GPa)
fcCompressive strength in concrete (MPa)
GPWaste Glass Powder
hHours
HRRelative Humidity (%)
LFLimestone filler
LOILoss on ignition (%)
QPQuartz powder
PCPortland cement
RcCompressive strength in mortar (MPa)
SCMSupplementary cementitious materials
SEMScanning electron microscopy
w/cWater to cement weight ratio
w/bWater to binder weight ratio
UPVUltrasonic pulse velocity (km/s)

References

  1. United Nations. World Population Prospects 2019 Highlights, New York. 2019. Available online: https://reliefweb.int/sites/reliefweb.int/files/resources/WPP2019_Highlights.pdf (accessed on 30 November 2023).
  2. Alexandridou, C.; Angelopoulos, G.N.; Coutelieris, F.A. Mechanical and durability performance of concrete produced with recycled aggregates from Greek construction and demolition waste plants. J. Clean Prod. 2018, 176, 745–757. [Google Scholar] [CrossRef]
  3. Khoshsepehr, Z.; Alinejad, S.; Alimohammadlou, M. Exploring industrial waste management challenges and smart solutions: An integrated hesitant fuzzy multi-criteria decision-making approach. J. Clean Prod. 2023, 420, 138327. [Google Scholar] [CrossRef]
  4. Green Building & the Sustainable Development Goals.
  5. Siddique, R. Waste Materials and By-Products in Concrete; Springer: Berlin Heidelberg, Germany, 2008. [Google Scholar] [CrossRef]
  6. Karthigai Priya, P.; Vanitha, S.; Meyyappan, P. Utilisation of waste for building materials-a review. In Proceedings of the First International Conference on Sustainable Infrastructure with Smart Technology for Energy and Environmental Management (FIC-SISTEEM-2020), Tamil Nadu, India, 3–4 September 2020. [Google Scholar] [CrossRef]
  7. Siddique, R.; Cachim, P. Waste and Supplementary Cementitious Materials in Concrete. Characterisation, Properties, and Applications; Woodhead Publishing: Cambridge, UK, 2018. [Google Scholar] [CrossRef]
  8. Mohajerani, A.; Vajna, J.; Cheung TH, H.; Kurmus, H.; Arulrajah, A.; Horpibulsuk, S. Practical recycling applications of crushed waste glass in construction materials: A review. Constr. Build. Mater. 2017, 156, 443–467. [Google Scholar] [CrossRef]
  9. United States Environmental Protection Agency. Advancing Sustainable Materials Management: 2018 Fact Sheet Assessing Trends in Materials Generation and Management in the United States; US EPA: Washington, DC, USA, 2020.
  10. Close the Glass Loop. Container Glass Collection for Recycling in Europe. Available online: www.closetheglassloop.eu (accessed on 27 September 2023).
  11. Compromisso Empresarial para Reciclagem. Vidro, São Paulo. Available online: http://cempre.org.br/artigo-publicacao/ficha-tecnica/id/6/%20 (accessed on 20 May 2023).
  12. Subramani, T.; Ram, S.B.S. Experimental Study on Concrete Using Cement with Glass Powder. Dep. Civ. Eng. VMKV Engg. Coll. Vinayaka Mission. Univ. Salem India 2015, 5, 43–53. [Google Scholar]
  13. Matos, A.M.; Sousa-Coutinho, J. Durability of mortar using waste glass powder as cement replacement. Constr. Build. Mater. 2012, 36, 205–215. [Google Scholar] [CrossRef]
  14. Borges, A.L.; Soares, S.M.; Freitas, T.O.G.; Oliveira Júnior, A.D.; Ferreira, E.B.; Ferreira, F.G.D.S. Evaluation of the pozzolanic activity of glass powder in three maximum grain sizes. Mater. Res. 2021, 24, 2021. [Google Scholar] [CrossRef]
  15. Soares, S.M. Durabilidade de Compósitos Cimentícios de Ultra Alto Desempenho com Incorporação de Pó de Vidro Frente à Ação de Cloretos. Ph.D. Thesis, Universidade Federal de São Carlos, São Carlos, Brazil, 2021. [Google Scholar]
  16. Talsania, S.; Pitroda, J.; Vyas, C. Experimental investigation for partial replacement of cement with waste glass powder on pervious concrete. In International Conference on: Engineering: Issues, Opportunities and Challenges for Development; United Nations Educational, Scientific and Cultural Organization: Paris, France, 2015. [Google Scholar]
  17. Soliman, N.A.; Tagnit-Hamou, A. Development of ultra-high-performance concrete using glass powder—Towards ecofriendly concrete. Constr. Build. Mater. 2016, 125, 600–612. [Google Scholar] [CrossRef]
  18. Guzzo, P.L. Revisão Sobre as Propriedades e Aplicações do Quartzo Natural e Seu Papel no Desenvolvimento da Indústria de Dispositivos Piezelétricos. XXI ENTMME Encontro Nac. De Trat. De Minérios E Metal. Extrativa 2005, 2, 438–445. [Google Scholar]
  19. Suraneni, P.; Weiss, J. Examining the pozzolanicity of supplementary cementitious materials using isothermal calorimetry and thermogravimetric analysis. Cem. Concr. Compos. 2017, 83, 273–278. [Google Scholar] [CrossRef]
  20. Kadri, E.H.; Aggoun, S.; De Schutter, G.; Ezziane, K. Combined effect of chemical nature and fineness of mineral powders on Portland cement hydration. Mater. Struct. 2010, 43, 665–673. [Google Scholar] [CrossRef]
  21. Matos, A.M.; Maia, L.; Sousa-Coutinho, J. Valorização de Resíduo de Quartzo em Betão Branco Arquitetónico; Estudo ao Nível da Argamassa: Lisbon, Portugal, 2022. [Google Scholar]
  22. NBR 6136; Blocos Vazados de Concreto Simples Para Alvenaria—Requisitos; In Hollow Concrete Blocks for Concrete Masonry—Requirements. Associação Brasileira de Normas Técnicas: Rio de Janeiro, Brazil, 2016. (In Portuguese)
  23. Mas, B.; Cladera, A.; Del Olmo, T.; Pitarch, F. Influence of the amount of mixed recycled aggregates on the properties of concrete for non-structural use. Constr. Build. Mater. 2012, 27, 612–622. [Google Scholar] [CrossRef]
  24. Juan-Valdés, A.; Rodríguez-Robles, D.; García-González, J.; Guerra-Romero, M.I.; Morán-del Pozo, J.M. Mechanical and microstructural characterisation of non-structural precast concrete made with recycled mixed ceramic aggregates from construction and demolition wastes. J. Clean Prod. 2018, 180, 482–493. [Google Scholar] [CrossRef]
  25. Rodríguez, C.; Parra, C.; Casado, G.; Miñano, I.; Albaladejo, F.; Benito, F.; Sánchez, I. The incorporation of construction and demolition wastes as recycled mixed aggregates in non-structural concrete precast pieces. J. Clean Prod. 2016, 127, 152–161. [Google Scholar] [CrossRef]
  26. Yeo, J.S.; Koting, S.; Onn, C.C.; Radwan, M.K.H.; Cheah, C.B.; Mo, K.H. Optimisation and environmental impact analysis of green dry mix mortar paving block incorporating high volume recycled waste glass and ground granulated blast furnace slag. Environ. Sci. Pollut. Res. 2023, 30, 58493–58515. [Google Scholar] [CrossRef]
  27. Infante-Alcalde, J.; Valderrama-Ulloa, C. Análisis Técnico, Económico y Medioambiental de la Fabricación de Bloques de Hormigón con Polietileno Tereftalato Reciclado (PET). Inf. Tecnológica 2019, 30, 25–36. [Google Scholar] [CrossRef]
  28. Benittez, L.H. Utilização de Escória de Aciaria na Fabricação de Blocos de Concreto. Master’s Dissertation, University of São Carlos (UFSCar), São Carlos, Brazil, 2020. [Google Scholar]
  29. Gomes, P.C.C.; Pereira, F.A.; Uchôa, S.B.B.; De Oliveira, F.C.; Almeida, L.H. Obtenção de blocos de concreto com utilização de resíduos reciclados da própria fabricação dos blocos. Ambiente Construído 2017, 17, 267–280. [Google Scholar] [CrossRef]
  30. EN 197; European Standard: Cement Part 1—Composition, Specifications and Conformity Criteria for Common Cements. European Committee for Standardization: London, UK, 2011.
  31. EN 933; Norma Portuguesa: Tests for Geometrical Properties of Aggregates Part 1—Determination of Particle Size Distribution. British Standards Institution: London, UK, 2014.
  32. EN 196; Norma Portuguesa: Methods of Testing Cement Part 1—Determination of Strength. Turkish Standards Institute: Ankara, Turkey, 2006.
  33. EN 12350; Norma Portuguesa: Testing Fresh Concrete Part 5—Flow Table Test. British Standards Institution: London, UK, 2009.
  34. ACI 211.3R-02; Guide for Selecting Proportions for No-Slump Concrete. American Concrete Institute: Indianapolis, IN, USA, 2009.
  35. Pattofatto, S. Comportement Dynamique du Béton Frais: Application au Procédé de Fabrication des Parpaings. École Normale Supérieure de Cachan, Cachan. 2004. Available online: https://theses.hal.science/tel-00133659 (accessed on 8 January 2024).
  36. EN 12390; Norma Portuguesa: Testing Hardened Concrete Part 6—Testing Hardened Concrete. British Standards Institution: London, UK, 2003.
  37. DIN 1048; Part 5—Testing Concrete: Testing of Hardened Concrete (Specimens Prepared in Mould). Deutsches Institute Für Normung: Berlin, Germany, 1991.
  38. NBR 9778; Argamassa e Concreto Endurecidos—Determinação da Absorção de Água, índice de Vazios e Massa Específica, (Hardened Mortar and Concrete—Determination of Absorption, Voids and Specific Gravity). Associação Brasileira de Normas Técnicas: Rio de Janeiro, Brazil, 2005. (In Portuguese)
  39. EN 12504; Norma Portuguesa: Testing Concrete in Structures Part 4—Determination of Ultrasonic Pulse Velocity. British Standards Institution: London, UK, 2007.
  40. Shi, C.; Wu, Y.; Riefler, C.; Wang, H. Characteristics and pozzolanic reactivity of glass powders. Cem. Concr. Res. 2005, 35, 987–993. [Google Scholar] [CrossRef]
  41. Idir, R.; Cyr, M.; Tagnit-Hamou, A. Pozzolanic properties of fine and coarse color-mixed glass cullet. Cem. Concr. Compos. 2011, 33, 19–29. [Google Scholar] [CrossRef]
  42. Jiang, Y.; Ling, T.-C.; Mo, K.H.; Shi, C. A critical review of waste glass powder—Multiple roles of utilization in cement-based materials and construction products. J. Environ. Manag. 2019, 242, 440–449. [Google Scholar] [CrossRef] [PubMed]
  43. Liu, S.; Xie, G.; Wang, S. Effect of glass powder on microstructure of cement pastes. Adv. Cem. Res. 2015, 27, 259–267. [Google Scholar] [CrossRef]
  44. Du, H.; Tan, K.H. Properties of high volume glass powder concrete. Cem. Concr. Compos. 2017, 75, 22–29. [Google Scholar] [CrossRef]
  45. Aliabdo, A.A.; Abd Elmoaty, A.E.M.; Aboshama, A.Y. Utilization of waste glass powder in the production of cement and concrete. Constr. Build. Mater. 2016, 124, 866–877. [Google Scholar] [CrossRef]
  46. Patel, D.; Tiwari, R.P.; Shrivastava, R.; Yadav, R.K. Effective utilisation of waste glass powder as the substitution of cement in making paste and mortar. Constr. Build. Mater. 2019, 199, 406–415. [Google Scholar] [CrossRef]
  47. Lu, J.-X.; Shen, P.; Zhang, Y.; Zheng, H.; Sun, Y.; Poon, C.S. Early-age and microstructural properties of glass powder blended cement paste: Improvement by seawater. Cem. Concr. Compos. 2021, 122, 104165. [Google Scholar] [CrossRef]
  48. Khan, Q.S.; Sheikh, M.N.; McCarthy, T.J.; Robati, M.; Allen, M. Experimental investigation on foam concrete without and with recycled glass powder: A sustainable solution for future construction. Constr. Build. Mater. 2019, 201, 369–379. [Google Scholar] [CrossRef]
  49. Neville, A.M. Properties of Concrete, Fifth. Longman Group Limited. 2011. [Google Scholar]
  50. Sengul, O. Use of electrical resistivity as an indicator for durability. Constr. Build. Mater. 2014, 73, 434–441. [Google Scholar] [CrossRef]
  51. Kamali, M.; Ghahremaninezhad, A. An investigation into the hydration and microstructure of cement pastes modified with glass powders. Constr. Build. Mater. 2016, 112, 915–924. [Google Scholar] [CrossRef]
  52. Azarsa, P.; Gupta, R. Electrical Resistivity of Concrete for Durability Evaluation: A Review. Adv. Mater. Sci. Eng. 2017, 2017, 8453095. [Google Scholar] [CrossRef]
  53. Shi, Y.; Long, G.; Ma, C.; Xie, Y.; He, J. Design and preparation of ultra-high performance concrete with low environmental impact. J. Clean. Prod. 2019, 214, 633–643. [Google Scholar] [CrossRef]
  54. Long, G.; Gao, Y.; Xie, Y. Designing more sustainable and greener self-compacting concrete. Constr. Build. Mater. 2015, 84, 301–306. [Google Scholar] [CrossRef]
  55. Li, Y.; Zeng, X.; Zhou, J.; Shi, Y.; Umar, H.A.; Long, G.; Xie, Y. Development of an eco-friendly ultra-high performance concrete based on waste basalt powder for Sichuan-Tibet Railway. J. Clean. Prod. 2021, 312, 127775. [Google Scholar] [CrossRef]
  56. Müller, H.S.; Haist, M.; Vogel, M. Assessment of the sustainability potential of concrete and concrete structures considering their environmental impact, performance and lifetime. Constr. Build. Mater. 2014, 67, 321–337. [Google Scholar] [CrossRef]
  57. Chiaia, B.; Fantilli, A.P.; Guerini, A.; Volpatti, G.; Zampini, D. Eco-mechanical index for structural concrete. Constr. Build. Mater. 2014, 67, 386–392. [Google Scholar] [CrossRef]
Figure 1. Non-structural concrete masonry block.
Recycling 09 00026 g001
Figure 2. Secondary electron mode SEM images of (a) cement; (b) glass powder; (c) quartz powder.
Recycling 09 00026 g002
Figure 3. Particle size distribution of solid materials.
Recycling 09 00026 g003
Figure 4. Example of a “zero slump” mortar.
Recycling 09 00026 g004
Figure 5. Faury reference and real curves obtained for sand and gravel used in the current concrete mix design for “zero slump”.
Recycling 09 00026 g005
Figure 6. Vibro-compressed concrete specimen producing steps in the laboratory. (a) Vibration step; (b) Compression step; (c) Demoulding; (d) Concrete specimens immediately demoulded; (e) Concrete specimens under curing.
Recycling 09 00026 g006
Figure 7. Compressive strength test on a concrete specimen.
Recycling 09 00026 g007
Figure 8. Modulus of elasticity test on a concrete specimen.
Recycling 09 00026 g008
Figure 9. Water absorption test.
Recycling 09 00026 g009
Figure 10. UPV test on a concrete specimen.
Recycling 09 00026 g010
Figure 11. Electrical resistivity test on a concrete specimen.
Recycling 09 00026 g011
Figure 12. Compressive strength at 28 days for concrete mixtures.
Recycling 09 00026 g012
Figure 13. Young’s modulus at 28 days for concrete mixtures.
Recycling 09 00026 g013
Figure 14. UPV evolution from 7 to 28 days for the concrete mixtures under study.
Recycling 09 00026 g014
Figure 15. Electrical resistivity evolution from 7 to 28 days for the concrete mixtures under study.
Recycling 09 00026 g015
Table 1. Main properties of cement, QP, and GP.
CementQPGP
Main oxide composition and LOI (%)LOI2.62 1.08
Insoluble residue1.73
SiO220.1099.1070.35
Al2O35.180.410.88
Fe2O32.960.030.44
CaO63.35<0.019.23
MgO0.78<0.013.57
Na2O0.150.0113.89
K2O0.610.090.33
SO3 0.19
Cl0.05 <0.015
Physical propertiesDensity (kg/m3)311026602530
Specific surface (g/cm2)383013201680
Mechanical properties (according to EN 196-1)Rc,2 (MPa)29.9
Rc,7 (Mpa)45.6
Rc,28 (Mpa)58.3
Table 2. Summary of the mortar studied.
Raw MaterialMix 1Mix 2Mix 3Mix 4 *Mix 5 *Mix 6 *Mix 7Mix 8Mix 9Mix 10Mix 11
kg/m3
Cement150.00150.00180.00150.00150.00150.00180.00180.00126.00180.00126.00
GP 54.000.0054.00
Sand2096.372096.372096.372096.372096.372096.372096.372096.372096.371672.301672.30
QP 418.07418.07
Water94.5094.50108.0090.0090.0090.00108.00108.00108.00108.00108.00
Admixture0.000.000.007.57.57.59.07.57.57.57.5
“Zero slump”yesyesyesyesyesyesyesyesyesyesyes
Rc (MPa)5.029.413.474.344.264.157.234.711.992.030.75
* Mix 4, 5, and 6 presented the same mixtures, but different sands were tested.
Table 3. Concrete mixing proportions.
Raw Materialkg/m3
CTLGP10GP20QP10GP10QP10GP20QP10
Cement150.00135.00120.00150.00135.00120.00
GP 15.0030.00-15.0030.00
Sand1327.571327.571327.571194.821194.821194.82
QP---132.76132.76132.76
Gravel876.42876.42876.42876.42876.42876.42
Water73.9273.9273.9273.9273.9273.92
Admixture7.507.507.507.507.507.50
Table 4. Water absorption test results for concrete mixtures.
A (%)Iv (%)ρs
(kg/m3)
ρsat
(kg/m3)
ρr
(kg/m3)
CTL11.92 ± 0.8723.50197022102580
GP1017.82 ± 2.2422.70199022102570
GP208.90 ± 0.4723.34198022102580
QP1011.70 ± 0.6323.16198022102580
GP10QP1011.15 ± 0.2822.33200022302580
GP20QP1012.09 ± 0.5923.82197022102590
Table 5. Summary of the main properties of the concrete studied.
PropertyCTLGP10GP20QP10GP10QP10GP20QP10
Electrical resistivity—28 days (k Ω.m)25,63026,53623,88621,60021,72823,536
Ultrasonic pulse velocity—28 days (km/s)2.192.162.042.352.352.00
Water absorption by immersion (%)11.9217.828.9011.7011.1512.09
Compressive strength—28 days (MPa)4.242.781.973.535.372.78
Modulus of elasticity—28 days (MPa)9.697.737.317.918.746.75
GWP (Kg CO2/kg)112.78102.4192.05112.64102.2791.91
CI (KgCO2/MPa)26.6036.8446.7331.9119.0533.06
Table 6. GWP for each constituent material employed in concrete production.
MaterialGWP (Kg CO2/kg)Source
Cement0.691[56]
Glass powder0European Union Directive 2008/98/EC
Quartz Powder0European Union Directive 2008/98/EC
Natural Sand0.00106[56]
Gravel0.00246[57]
Water0.000318[57]
Admixture0.739[56]
Disclaimer/Publisher’s Note: The statements, opinions and data contained in all publications are solely those of the individual author(s) and contributor(s) and not of MDPI and/or the editor(s). MDPI and/or the editor(s) disclaim responsibility for any injury to people or property resulting from any ideas, methods, instructions or products referred to in the content.

