Abstract
Celiac disease (CD) is a gluten-sensitive immune-mediated enteropathy. This proof-of-concept study used a convolutional neural network (CNN) to classify hematoxylin and eosin (H&E) CD histological images, normal small intestine control, and non-specified duodenal inflammation (7294, 11,642, and 5966 images, respectively). The trained network classified CD with high performance (accuracy 99.7%, precision 99.6%, recall 99.3%, F1-score 99.5%, and specificity 99.8%). Interestingly, when the same network (already trained for the 3 class images), analyzed duodenal adenocarcinoma (3723 images), the new images were classified as duodenal inflammation in 63.65%, small intestine control in 34.73%, and CD in 1.61% of the cases; and when the network was retrained using the 4 histological subtypes, the performance was above 99% for CD and 97% for adenocarcinoma. Finally, the model added 13,043 images of Crohn’s disease to include other inflammatory bowel diseases; a comparison between different CNN architectures was performed, and the gradient-weighted class activation mapping (Grad-CAM) technique was used to understand why the deep learning network made its classification decisions. In conclusion, the CNN-based deep neural system classified 5 diagnoses with high performance. Narrow artificial intelligence (AI) is designed to perform tasks that typically require human intelligence, but it operates within limited constraints and is task-specific.
1. Introduction
Celiac disease (CD) is a gluten-sensitive immune-mediated enteropathy that occurs in genetically predisposed individuals [1]. Diagnosis of celiac disease is made by combining clinical data, serological tests, and histopathological features [1,2]. Although celiac disease is a disease of infants, its onset usually occurs in patients aged between 10 and 40 years, when the typical signs of malabsorption are often replaced by an atypical presentation [3,4,5,6].
The clinical presentation is variable and exhibits a continuum spectra [3,4,5,6], with several degrees of severity correlated with histological severity and levels of tissue transglutaminase [7,8]. The “classical” gastrointestinal symptoms include persistent diarrhea, abdominal distension, weight loss, abdominal pain, constipation, and vomiting [9]. Celiac disease is also associated with several non-gastrointestinal manifestations, such as growth and development alterations, neurologic and behavioral symptoms, liver disease, iron deficiency, skin alterations (dermatitis herpetiformis), dental and metabolic bone diseases, arthritis, and cardiomyopathy [9,10].
Histological characteristics of the small intestine (usually evaluated using duodenum biopsy) include mucosal inflammation, villous atrophy, and crypt hyperplasia that occur after exposure to dietary gluten; signs that improve after removing gluten from the diet [11]. These histological features are variable and range from mild alteration with only increased numbers of intraepithelial lymphocytes, to severe atrophy and epithelial apoptosis [12,13,14,15,16]. These alterations are assessed in several classifications, including the Marsh [17], Marsh–Oberhuber [18], Corazza–Villanacci [19], Q-Marsh scale [20], and Q-histology [2].
The pathogenesis of celiac disease includes genetic factors (HLA DR3-DQ2, DR4-DQ8, several non-HLA loci, and autoimmune disorders), adaptive immune response (gliadin reactive T lymphocytes), autoantibodies and intraepithelial lymphocytes (IELs), and innate immune response. In patients with celiac disease, the immune response to fractions of gliadin results in an abnormal inflammatory reaction characterized by infiltration of the lamina propria and epithelium by chronic inflammatory cells and villous atrophy [4]. A comprehensive review of the pathogenesis was conducted in our recent publication [21].
Primary treatment for celiac disease is a gluten-free diet. Persistent or recurring symptoms may be due to a lack of adherence to dietary protocol, an incorrect initial diagnosis, or complications of refractory celiac disease and lymphoma [1]. Among the different primary intestinal T-cell lymphomas, enteropathy-associated T-cell lymphoma (EATL) [22,23,24,25] may be preceded by refractory celiac disease [26].
The diagnosis of celiac disease is based on the combination of clinical data (enterologist), serology (clinical pathologist), and duodenal biopsy with histological evaluation performed by a certified anatomical pathologist [1]. Artificial intelligence technology allows computers to imitate human intellectual capacity and solve problems [27]. Modern computer vision systems exhibit extraordinary image recognition and analysis accuracy. However, these systems do not understand what they observe. In recent years, applications of artificial intelligence in celiac disease diagnosis have been developed. The most relevant studies can be divided into two groups, the ones that perform computer vision on endoscopic images and others that performed histological analyses [28,29,30,31,32,33]. These studies have provided the basis for further development of the analysis of celiac disease using artificial intelligence, such as the introduction of other types of pathologies as shown in our study.
Several machine learning and deep learning algorithms have been developed to construct models that make predictions on images. Convolutional neural networks are supervised algorithms that are mostly used for image recognition workloads [34]. Top pre-trained models for image classification are the following: ResNet (Residual Networks), Inception (GoogLeNet), VGG (Visual Geometry Group), EfficientNet, DenseNet (Dense Convolutional Network), MobileNet, NASNet (Neural Architecture Search Network), Xception (Extreme Inception), AlexNet, and Vision Transformers (ViT).
This study used a convolutional neural network to classify images of celiac disease, small intestine control, duodenal inflammation, duodenal adenocarcinoma, and Crohn’s disease.
2. Materials and Methods
A script was written to create and train a deep learning network with 71 layers and 78 connections (Figure 1 and Figure 2). The script was run to create network layers (Appendix B), import training and validation data, and train the network. The code was created in MATLAB (R2023b Update 8 (23.2.0.25999560) 64-bit (win64) 29 April 2024) (MathWorks, Tokyo, Japan) and was based on transfer learning from the ResNet-18 (version 23.2.0) [35] (Figure 1 and Figure 2). All analyses were performed using a desktop computer equipped with an AMD Ryzen 9 7950X CPU (AMD Japan Ltd., Marunouchi, Chiyoda-ku, Tokyo, Japan) [36], 32 Gb of RAM, and an Nvidia GeForce RTX 4080 super-graphics card (Nvidia, Minato-ku, Tokyo, Japan) [37].
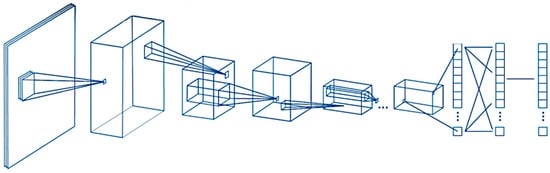
Figure 1.
General design of the convolutional neural network. A convolutional neural network (CNN) is a deep learning algorithm that takes an input image, assigns weights/biases to different components of the image, and classifies all the images. There are three major components of the network: the convolutional layer, the pooling layer, and the fully connected layer.
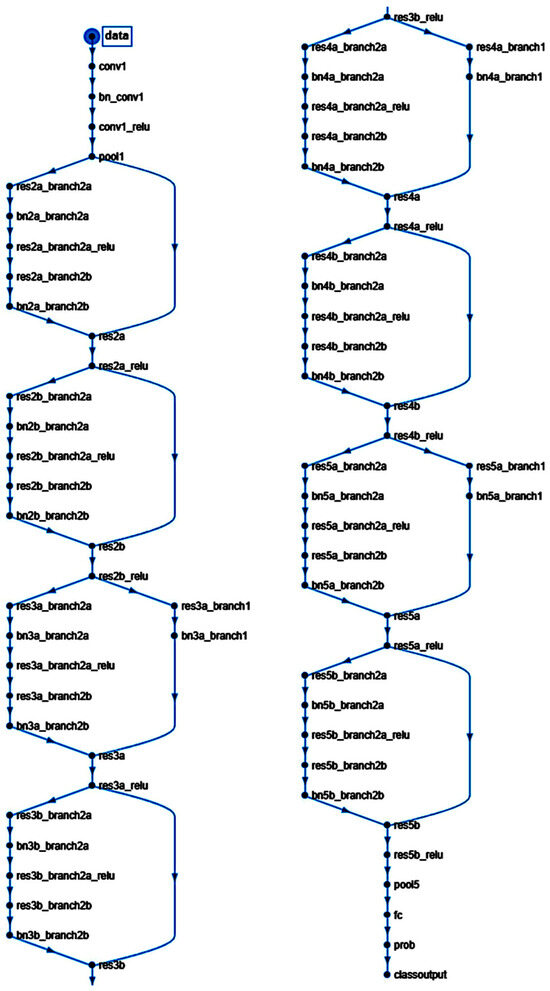
Figure 2.
Structure of the convolutional neural network of this study (based on ResNet-18).
ResNet-18 is a pre-trained model that was previously trained in a subset of images in the ImageNet database [38]. This database includes 1000 types of objects and contains more than 1,000,000 images. ResNet-18 is a convolutional neural network with 18 layers. The input size is 224-by-224 (224 × 224 × 3). Size: 44.0 MB. Parameters: 11.7 M.
The analysis of the convolutional neural network (CNN) included the following steps: loading the pre-trained network, replacement of final layers, training of the network, prediction and assessment of network accuracy, and deployment of results.
The input images were hematoxylin and eosin (H&E) stainings of several diseases (Figure 3).
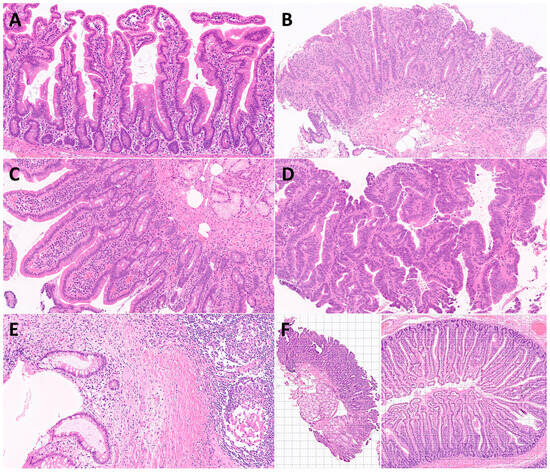
Figure 3.
Characteristic histological images of the small intestine (duodenum). Duodenal control (A); celiac disease (B); inflammatory duodenum (C); duodenal adenocarcinoma (D); Cronh’s disease (E); examples of image cropping at 224-by-224 (224 × 224 × 3) size (F).
The diagnostic dataset included hematoxylin and eosin (H&E) staining of 16 celiac disease patients (57 biopsies), selected from the Department of Pathology, Hospital Clinic of Barcelona, Spain, as previously described [21]. The clinicopathological characteristics, such as age, sex, biopsy location, anatomical pathology diagnosis, and the Marsh–Oberhuber histological grade [21,39,40] are shown in Appendix A.
First, the input data for celiac disease included 7294 images, and the small intestine control included 11,642 images. The color images had three channels: red, green, and blue. An example is shown in Figure 4 and Figure 5.
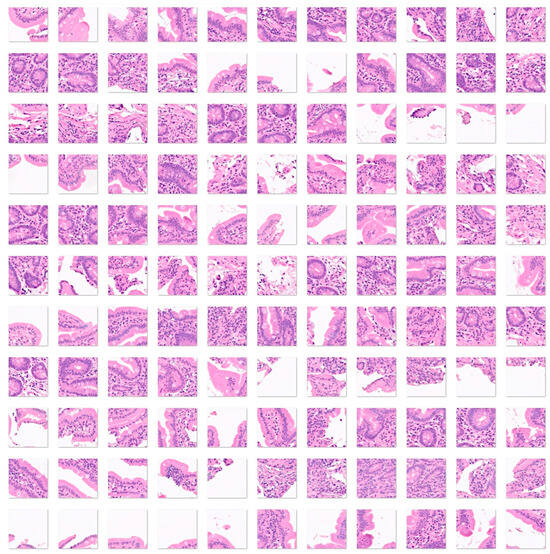
Figure 4.
Images of celiac disease. Celiac disease is a gluten-sensitive immune-mediated enteropathy that occurs in genetically predisposed individuals. Diagnosis of celiac disease is made by combining clinical data, serological tests, and histopathological features. Celiac disease is characterized by mucosal inflammation, intraepithelial lymphocytosis, chronic inflammation in the lamina propria, villous atrophy, and crypt hyperplasia. When the disease persists despite the gluten-free diet, it is called refractory celiac disease, type I (the intraepithelial lymphocytes display normal phenotype, associated with good prognosis when combined with immunosuppressive therapy) and type II (loss of phenotype of the intraepithelial lymphocytes, monoclonal rearrangement of T-cell receptor, and higher risk of developing enteropathy-associated T-cell lymphoma (EATL)) [41,42,43,44,45,46,47,48,49]. The input size is 224-by-224 (224 × 224 × 3). Original magnification 200×.

Figure 5.
Images of small intestine control. The small intestine is located between the stomach and the large intestine. It is comprised of three parts: the duodenum, jejunum, and ileum. The histological structure has four main layers. The mucosa is the innermost layer that contains epithelium, lamina propria, and muscularis mucosae. The submucosa is a connective tissue layer with blood vessels, lymphatics, and the submucosal plexus. The muscularis externa contains two smooth muscle layers, the inner circular and the outer longitudinal layer. Between them, the myenteric plexus is found. The outermost layer is the adventitia comprised of fibroblasts, collagen, vessels, and nerves. The adventitia is covered by mesothelium (serosa). The small intestine is characterized by high absorption. The mucosa and submucosa form large folds (plicae) in circular manner. The plicae contain microvilli. The epithelium has several components, enterocytes, globet cells, crypts of Lieberkuhm, enteroendocrine cells, and Paneth cells [50,51]. This figure shows images of the ileum. Additionally, images obtained from the duodenum were included in the dataset. The input size is 224-by-224 (224 × 224 × 3). Original magnification 200×.
The data (images) were split into three sets: a training set used for training the network (70%), a validation set used for testing its performance as it was trained (10%), and a test set (holdout) used after training to assess how well the network performed on new data (20%). The order of the images was randomized to ensure that the network learned the classes at a more even rate. As transfer learning (adjustment of a pre-trained network) was performed on ResNet-18, the fully connected and classification layers were removed and replaced with new layers with an output size of 2. Augmentation was not performed during training. To avoid overfitting, the initial learning rate was set to 0.001. The number of maximum epochs was set to five.
Data normalization was applied to the input images: imageInputLayer (an image input layer inputs 2-D images to a neural network and applies data normalization), and batchNormalizationLayer (a batch normalization layer normalizes a mini-batch of data across all observations for each channel independently. To speed up training of the convolutional neural network and reduce the sensitivity to network initialization, batch normalization layers are used between convolutional layers and nonlinearities, such as ReLU layers. Layer = batchNormalizationLayer (Name, Value) creates a batch normalization layer and sets the optional TrainedMean, TrainedVariance, Epsilon, Parameters and Initialization, Learning Rate and Regularization, and Name properties using one or more name-value pairs. After normalization, the layer scales the input with a learnable scale factor γ and shifts it by a learnable offset β) [52].
Second, the analysis was repeated by adding a third histological subtype of nonspecific inflammation of the small intestine (duodenum). Therefore, in this analysis, the input data included 7294 images of celiac disease, 11,642 images of small intestine control, and 5966 images of the small intestine (duodenum) with chronic and acute inflammation (Figure 6).
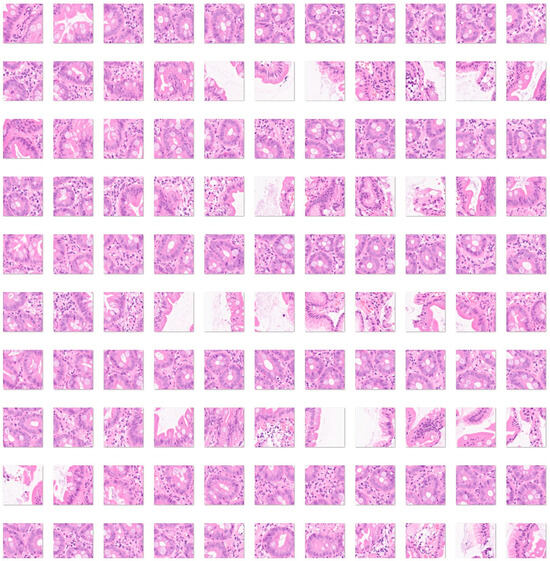
Figure 6.
Images of nonspecific inflammatory small intestine. The input size is 224-by-224 (224 × 224 × 3). Original magnification 200×.
Third, a fourth histological subtype of 3723 images of duodenal adenocarcinoma (Figure 7) was added as test images of the previously trained convolutional neural network. The purpose of this analysis was to determine how the previously trained network, which was trained using celiac disease, small intestine control, and non-specific inflammation of the duodenum, could classify an unknown histological disease.
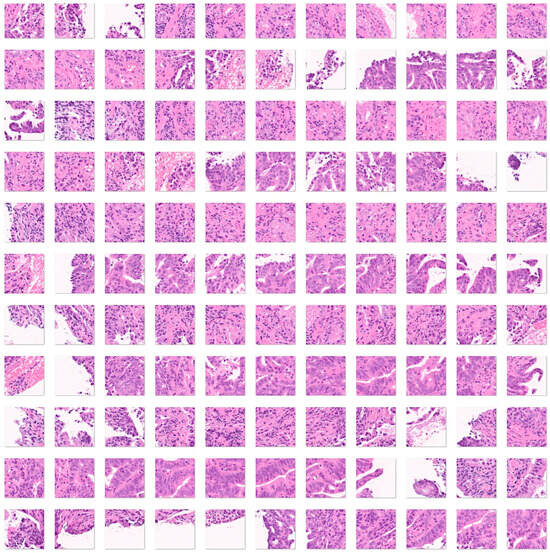
Figure 7.
Images of duodenal adenocarcinoma. Small bowel adenocarcinomas are histologically very similar to colorectal adenocarcinomas. Adenocarcinomas are characterized by columnar epithelial cells with elongated and pseudostratified nuclei that form a complex glandular structure. There is nuclear polymorphism, loss of epithelial polarity, and necrosis. Inflammatory, autoimmune, genetic, and familiar diseases are common risk factors, including celiac disease, Crohn’s disease, familiar adenomatous polyposis, Peutz–Jeghers syndrome, and Lynch syndrome [53,54,55,56,57]. The input size is 224-by-224 (224 × 224 × 3). Original magnification 200×.
Fourth, a convolutional neural network was trained, including as input all the histological subtypes of celiac disease, small intestine control (both duodenum and ileum), non-specific inflammation of the duodenum, and duodenal adenocarcinoma (Figure 4, Figure 5, Figure 6 and Figure 7).
Finally, to expand the diagnosis differential into other intestinal pathologies related to alterations to the immune tolerance and immune homeostasis of the gut, the model included 13,032 images of Crohn’s disease (Figure 8).
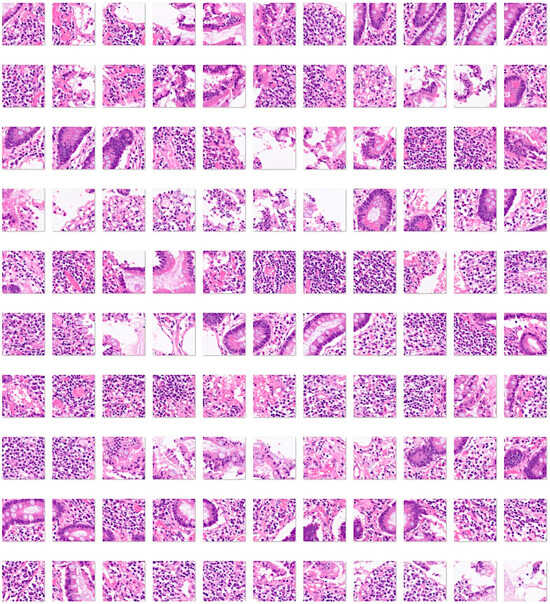
Figure 8.
Images of Crohn’s disease. Crohn’s disease is an idiopathic chronic inflammatory condition that can affect both the upper and lower gastrointestinal tract, but usually involves the distal ileum and proximal large intestine. The diagnostic criteria are segmental disease, transmural inflammation, noncaseating granulomas, deep fissuring ulcers, and ileal involvement [58,59,60]. The input size is 224-by-224 (224 × 224 × 3). Original magnification 200×.
All cropped images of 224-by-224 (224 × 224 × 3) size were reviewed by the histopathologist (J.C.) and non-diagnostic and artefactual images were excluded from the datasets.
3. Results
3.1. Celiac Disease vs. Small Intestine Control
The data (images) were split into three sets: a training set used for training the network (70%), a validation set used for testing its performance as it was trained (10%), and a test set used after training to assess how well the network performed on new data (20%).
The progress of the convolutional neural network (ResNet-18) was satisfactory with a high validation accuracy. The training cycle included 5 epochs, 515 iterations, and 103 iterations per epoch. The validation cycle included 50 iterations. Within the first 100 iterations, the accuracy percentage reached nearly 100%, and the loss the 0 value (Figure 9).
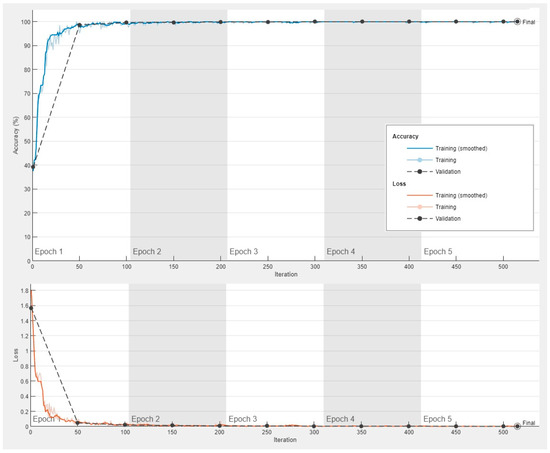
Figure 9.
Training progress of the convolutional neural network for the classification of celiac disease and small intestine control.
The images in the test set (20%) were classified by the trained network. The results are shown as a confusion matrix (Figure 10). The performance parameters for celiac disease were as follows: accuracy, 99.97%; precision, 99.93%; recall, 100%; F1-score, 99.97%; specificity, 100%; and false positive rate (FPR), 0.04% (Table 1).
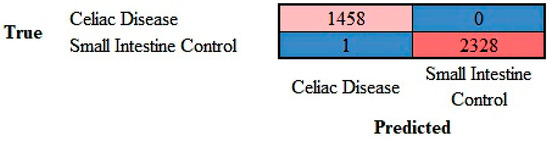
Figure 10.
Confusion matrix of celiac disease and small intestine control. This image shows the confusion matrix of the test set, which includes the analysis of images not previously used in the training and validation steps (i.e., the holdout data). The accuracy of predicting celiac disease was 99.97%.

Table 1.
Performance parameters of the classification into 2 classes.
3.2. Comparion between ResNet-18 and Other Top Models for Image Classification in the Celiac Disease vs. Small Intestine Control
The performance of ResNet-18 was compared with other top pre-trained models for image classification including GoogLeNet, VGG-19, EfficientNet, MobileNet, and NASNet. The confusion matrices are shown in Figure 11 and the performance parameters in Table 2. Overall, these models also classified the images with good performance, although the accuracy was slightly lower.
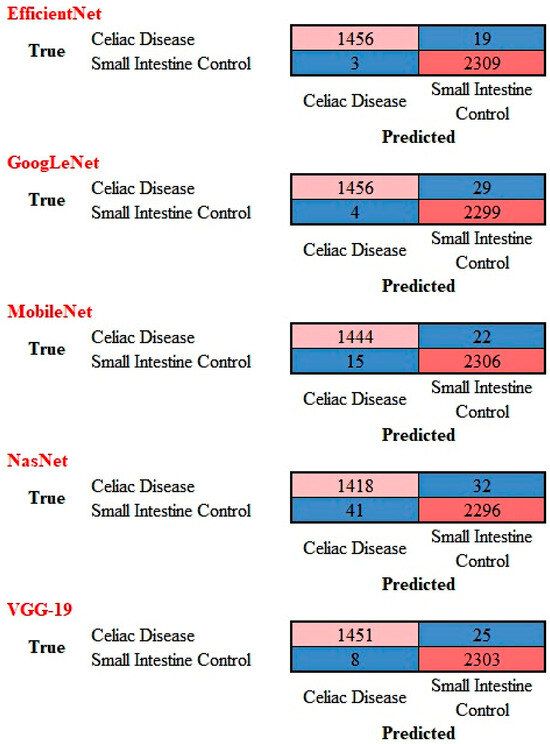
Figure 11.
Confusion matrix of celiac disease and small intestine control using different AI models. This image shows the confusion matrices of the test set, which includes the analysis of images not previously used in the training and validation steps (i.e., the holdout data).
Table 2.
Performance parameters of the models for classification of celiac disease versus small intestine control.
3.3. Celiac Disease vs. Small Intestine Control vs. Duodenal Inflammation
The progress of the training of the convolutional neural network (ResNet-18) is shown in Appendix C. The results are shown as a confusion matrix (Figure 12).
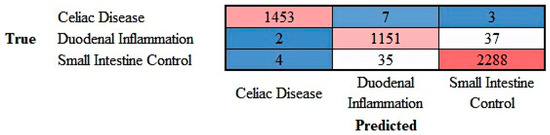
Figure 12.
Confusion matrix of celiac disease, duodenal inflammation, and small intestine control. This image shows the confusion matrix of the test set, which includes the analysis of images not previously used in the training and validation steps (i.e., the holdout data).
The class-wise performance is summarized in Table 3.
Table 3.
Performance parameters of the classification into 3 classes.
3.4. Test for Duodenal Adenocarcinoma on Previously Trained Network
Images of duodenal adenocarcinoma were tested directly on the previously trained ResNet-18 network that had classified celiac disease, small intestine control, and duodenal inflammation. The analysis showed that the convolutional network classified duodenal adenocarcinoma as duodenal inflammation in 63.65% of images, small intestine control in 34.73%, and celiac disease in 1.61% of images. Therefore, a previously trained network can classify an unknown type of image but incorrectly diagnoses the image.
3.5. Celiac Disease vs. Small Intestine Control vs. Duodenal Inflammation vs. Duodenal Adenocarcinoma
The progress of training the convolutional neural network (ResNet-18) is shown in Appendix D. The results are shown as a confusion matrix (Figure 13).
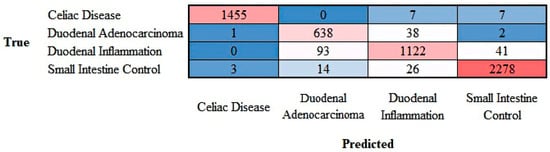
Figure 13.
Confusion matrix of celiac disease, duodenal adenocarcinoma, duodenal inflammation, and small intestine control. This image shows the confusion matrix of the test set, which includes the analysis of images not previously used in the training and validation steps (i.e., the holdout data).
The class-wise performance is summarized in Table 4.
Table 4.
Performance parameters of the classification into 4 classes.
3.6. Addition of Crohn’s Disease into the Dataset
To expand the analysis into other pathologies, Crohn’s disease images were added into the dataset. Figure 14 shows the confusion matrix with 5 classes that includes celiac disease, Crohn’s disease, duodenal adenocarcinoma, duodenal inflammation, and small intestine control. The overall accuracy of the test set was 96.87% The performances of each diagnosis is shown in Table 5. The output is shown in the Supplementary Material.
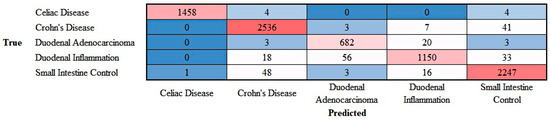
Figure 14.
Confusion matrix of celiac disease, Crohn’s disease, duodenal adenocarcinoma, duodenal inflammation, and small intestine control. This image shows the confusion matrix of the test set, which includes the analysis of images not previously used in the training and validation steps (i.e., the holdout data).
Table 5.
Performance parameters of the classification into 4 classes.
3.7. Grad-CAM Analysis
The Grad-CAM analysis visualized which parts of an image were important to the classification decision of the ResNet-18 network. From the histopathological point of view, the Grad-CAM analysis showed that the CNN was focusing on important parts of the tissue such as the epithelial layer and inflammation (Figure 15 and Figure 16).
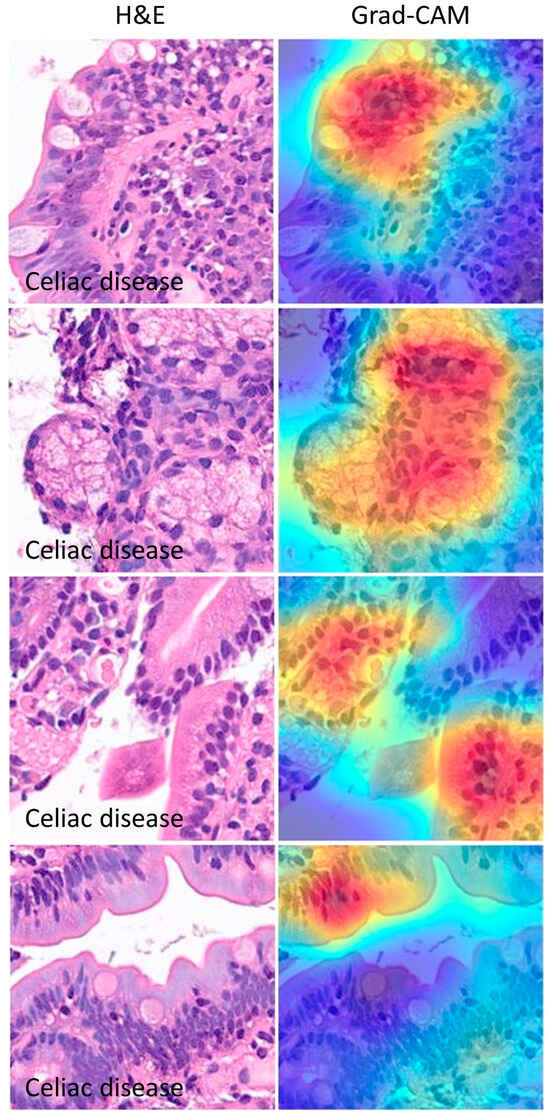
Figure 15.
Grad-CAM images of celiac disease. The gradient-weighted class activation mapping (Grad-CAM) visualizes which parts of an image are important to the classification decision of a network. From the histopathological point of view, the Grad-CAM showed that the CNN was focusing on the important parts of the tissue such as the epithelial layer and inflammation.
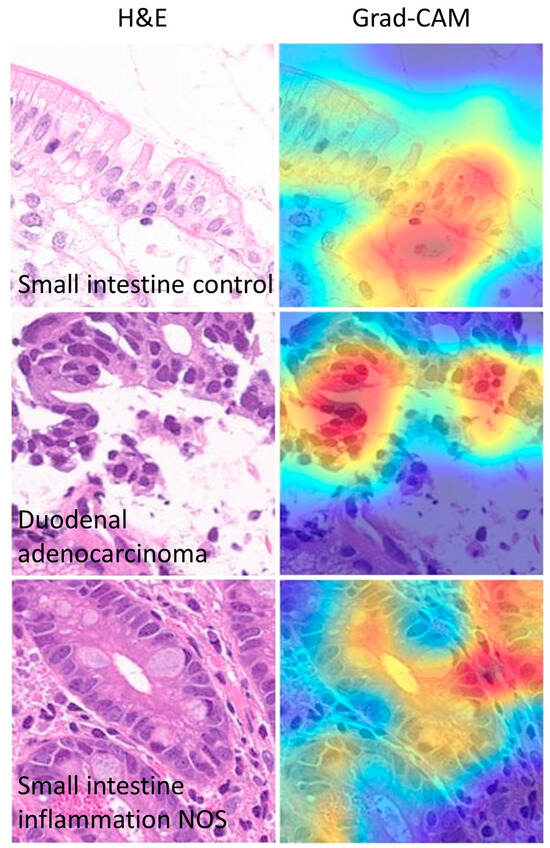
Figure 16.
Other Grad-CAM images. The gradient-weighted class activation mapping (Grad-CAM) visualizes which parts of an image are important for the classification decision by the CNN. In this example, the most important part of the image for classification is the epithelial layer.
Discordant cases between true and predicted classes were also recorded and analyzed. In summary, differences were due to images that did not have a clear diagnosis from a histological point of view and/or wrong focus area that was important for the classification by the CNN (Figure 17).
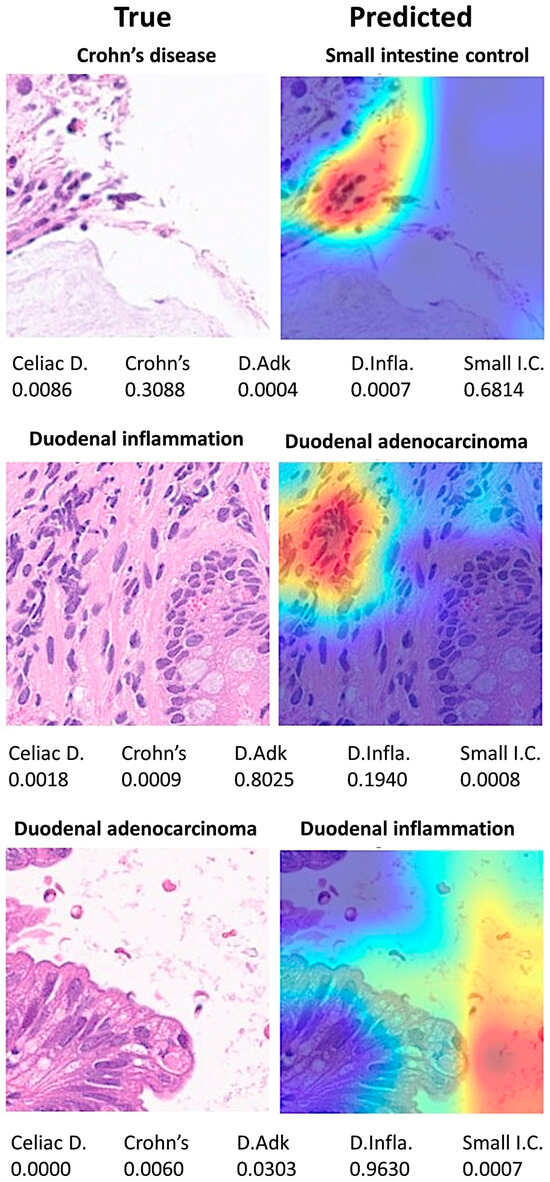
Figure 17.
Grad-CAM analysis of discordant cases. The Grad-CAM visualizes which parts of an image are important to the classification decision of a network. Differences were due to images that did not have a clear diagnosis from a histological point of view and/or wrong focus area that was important to the classification of the network. Celiac D. (celiac Disease), Crohn’s (Crohn’s disease), D.Adk (duodenal adenocarcinoma), D.Infla. (duodenal inflammation), Small I.C. (small intestine control).
The Grad-CAM technique utilizes the gradients of the classification score with respect to the final convolutional feature map, to identify the parts of an input image that most impact the classification score. The places where this gradient is large are exactly the places where the final score depends most on the data [61].
4. Discussion
Within the specialty of computer science, computer vision is a technique that allows computers to recognize the observable world. In the field of artificial intelligence, there are several machine learning and deep learning algorithms that build models that make predictions from images or videos [62]. Convolution neural networks are a type of supervised deep learning algorithm that are used for image recognition. A simple convolutional network comprises several steps, including image channel, convolutions, pooling, convolutions, pooling, flattening, artificial neural network full connection, and prediction [62].
The ResNet-18 network was used in this study. This convolutional neural network was a pre-trained model trained on a subset of the ImageNet database. The network is trained with more than a million images and managed to classify them into 1000 different categories [35]. In the medical field, this network has been used in several studies based on transfer learning, such as in the diagnosis of intracranial hemorrhage in CT scans [63], heartbeat classification of electrocardiogram (ECG) signals [64], dynamic gesture recognition [65], selective transplanting of leafy vegetable seedlings [66], automatic classification of malaria parasites on the blood smear [67], prostate imaging [68], classification of Alzheimer’s disease levels [69], and diabetic retinopathy [70], among others. Therefore, the ResNet-18 model is a useful network that can be applied to many types of studies, including our study of celiac disease.
Convolutional neural networks and image recognition have also been applied to celiac disease research, including the analysis of whole slide images [29,71,72,73,74] and endoscopic images [75,76]. Therefore, computer vision is a useful tool in the field of histopathology.
Our group has published several papers on the use of artificial intelligence, including machine learning and artificial neural networks, in the field of lymphoma research [77,78,79,80,81,82,83]. In these publications, the focus was on data analysis of gene expression levels in the context of immuno-oncology in lymphoma and other hematological neoplasia [77,78,79,80,81,82,83]. The most frequent lymphoma subtype that we analyzed was diffuse large b-cell lymphoma [78,79,80,81], which is one of the most frequent non-Hodgkin lymphomas [26]. In addition, we have also published data analysis-based studies on celiac disease in which we highlighted the importance of the B and T lymphocyte associated (BTLA) gene [21], and programmed cell death 1 ligand 1 (CD274 antigen) in ulcerative colitis [84]. The subject of this article represented a switch from data analytics to computer vision.
In this study, a confusion matrix was used to measure the performance of the trained network. The data (images) were split into three sets: a training set used for training (i.e., teaching) the network (70%), a validation set used for testing its performance as it was trained (10%), and a test set used after training to assess how well the network performed on new data (20%). The order of the images was randomized to ensure that the network learned the classes at a more even rate. In the Results Section, the confusion matrices of the test set were shown. Of note, if the data were imbalanced, the performance checking by accuracy could be deceptive. The confusion matrices of our study combined output data that was binary (Figure 9) and multiclass (Figure 10 and Figure 11). All performance parameters were high, including accuracy (defined as the proportion of correct predictions), precision (used in information retrieval, pattern recognition), recall (what in medicine is called sensitivity), and F1-score (measures test of accuracy). The fundamentals of clinical data science and modeling methodology are well described in chapter 8 of the book written by Frank J.W.M. Dankers et al. [85].
This study focused on the identification and classification of celiac disease images compared with normal small intestine images obtained from the duodenum and ileum. The accuracy of the network was very high. The model could handle and properly classify 3 classes with the addition of non-specific acute and chronic duodenal inflammation. Interestingly, when the 3 classes’ trained network was tested with duodenal adenocarcinoma, the network failed to realize that those samples were a different type of disease. Therefore, the use of automated computer vision analysis for the evaluation of histopathological slides is not recommended without the supervision of a pathology specialist. However, when the network was trained with 4 classes of histological subtypes, the network managed to differentiate celiac disease, duodenal inflammation, small intestine control, and duodenal adenocarcinoma with good performance, proving the usefulness of the convolutional neural network for classifying histological images.
To expand to other intestine inflammatory conditions, images of Crohn’s disease were included in the study, and the neural networks also manage to classify the different diseases properly.
There are several reports of artificial intelligence studies of celiac disease diagnosis and classification using both endoscopic and histological images.
Regarding endoscopic images, Ciaccio EJ et al. used videocapsule endoscopy images to detect pathologic alterations of 13 celiac and 13 control patients using a masking strategy that allowed nearly 80% accuracy [86]. Bing Nan Li implemented a principal component analysis (PCA) on videocapsule endoscopy images to develop a computerized tool of celiac disease recognition; a dataset of 240 images was used and the strip PCA method had an average recognition accuracy of 93.9% [87]. Jahmunah Vicnesh et al. used DAISY descriptors for the automated diagnosis of celiac disease by videocapsule endoscopy reaching an accuracy of 90% [88].
Regarding histological images, Joseph DiPalma et al. proposed a deep learning-based methodology for improving the computational efficiency of histology image classification based on distillation and self-supervision [89]. Florentino Luciano Caetano Dos Santos et al. used machine learning to assess and classify images of IgA-class endomysial autoantibody (EmA) images with an accuracy of 97% [90]. Kamran Kowsari et al. used a deep learning Hierarchical Medical Image classification (HMIC) approach to classify between celiac disease, environmental enteropathy, and histologically normal controls and the precision was 91% [91]. Joel En Wei Koh et al. used a Steerable Pyramid Transform (SPT) method and nonlinear features to automatically detect and classify celiac disease biopsy H&E images with an 89% accuracy [92]. Oliver Faust et al. used high-magnification biopsy images and a Support Vector Machine (SVM) to classify celiac disease versus normal control with an accuracy of 98% [30]. In the study of Prasenjit Das et al., the quantitative histological classification system based on software from Media Cybernetics and a Q-histological assessment reached a sensitivity of 94% [93]. J Denholm et al. classified H&E celiac disease and normal images from biopsies from several different types of digital image slide scanners. The workflow included patch extraction, stain normalization, and classification using ResNet50, and the final model reached an accuracy of 97%. Overall, these studies classified celiac disease images successfully but there is variability in methodology and accuracy. Our study is comparable to the one by J Denholm. However, our study included more different types of diagnosis.
5. Conclusions
In conclusion, a convolutional neural network based on the transfer learning of ResNet-18 was able to classify celiac disease, other duodenal pathological diseases, and tissue control with good performance. The current methodology is simple and reliable enough to be used as a real application. Narrow artificial intelligence (AI) is designed to perform tasks that typically require human intelligence, it operates within limited constraints and is task-specific. Therefore, all computer vision-based automated diagnoses should be supervised and validated by pathology medical specialists to identify other pathologies for which the network has not previously trained.
Supplementary Materials
The following supporting information can be downloaded at: https://www.mdpi.com/article/10.3390/jimaging10080200/s1, Supplementary_Output_5_classes.
Funding
This research was funded by the Ministry of Education, Culture, Sports, Science and Technology of Japan, KAKEN grants 23K06454, 18K15100, and 15K19061.
Institutional Review Board Statement
The study was conducted in accordance with the Declaration of Helsinki, and approved by the Institutional Review Board of TOKAI UNIVERSITY, SCHOOL OF MEDICINE (protocol code IRB14R-080 and IRB20-156).
Informed Consent Statement
Informed consent was obtained from all subjects involved in the study.
Data Availability Statement
All the data, including methodology, are available upon reasonable request to Dr. Joaquim Carreras (joaquim.carreras@tokai-u.jp).
Acknowledgments
I want to thank Josep A. Bombi from the Department of Pathology, Hospital Clinic of Barcelona (Spain) for the celiac disease cases. I want to thank Maxim Sharaev from Skolkovo Institute of Science and Technology, National Medical Research Center of Oncology named after N.N. Blokhin and BIMAI-Lab for revising the revised manuscript. I also want to thank Rifat Hamoudi of Department of Clinical Sciences, College of Medicine (University of Sharjah), Division of Surgery and Interventional Science (University College London) and ASPIRE Precision Medicine Research Institute Abu Dhab for his critical comments on the revised manuscript.
Conflicts of Interest
The author declares no conflicts of interest. The funders had no role in the design of the study; in the collection, analyses, or interpretation of data; in the writing of the manuscript; or in the decision to publish the results.
Appendix A
Table A1.
Clinicopathological characteristics of celiac disease cases.
Table A1.
Clinicopathological characteristics of celiac disease cases.
| Age | Sex | Biopsy Location | Diagnosis | Marsh–Oberhuber Classification |
|---|---|---|---|---|
| 70 | Male | Duodenum | Celiac Disease | 3a |
| 62 | Male | Pylorus/duodenum | Celiac Disease/Chronic gastritis | 2 |
| 62 | Male | Duodenum | Celiac Disease | 2 |
| 78 | Female | Duodenum | Celiac Disease | 3b |
| 59 | Male | Duodenum | Celiac Disease | 3a |
| 44 | Female | Duodenum | Celiac Disease | 2 |
| 17 | Female | Duodenum | Celiac Disease | 3b |
| 56 | Female | Duodenum | Celiac Disease | 3a |
| 54 | Female | Duodenum | Celiac Disease | 2 |
| 58 | Female | Duodenum | Celiac Disease | 3b |
| 61 | Female | Duodenum | Celiac Disease | 3c |
| 45 | Male | Duodenum | Celiac Disease | 3a |
| 70 | Female | Duodenum | Celiac Disease | 2 |
| 40 | Female | Duodenum | Celiac Disease | 3a |
| 61 | Female | Duodenum | Celiac Disease | 3c |
| 44 | Female | Duodenum | Celiac Disease | 3a |
Appendix B
Table A2.
Design of trained network.
Table A2.
Design of trained network.
| Trained Network | Trained Network Connections | ||
|---|---|---|---|
| Num. | Layers | 1 Source | 2 Destination |
| 1 | 1 × 1 ImageInputLayer | ‘data’ | ‘conv1’ |
| 2 | 1 × 1 Convolution2DLayer | ‘conv1’ | ‘bn_conv1’ |
| 3 | 1 × 1 BatchNormalizationLayer | ‘bn_conv1’ | ‘conv1_relu’ |
| 4 | 1 × 1 ReLULayer | ‘conv1_relu’ | ‘pool1’ |
| 5 | 1 × 1 MaxPooling2DLayer | ‘pool1’ | ‘res2a_branch2a’ |
| 6 | 1 × 1 Convolution2DLayer | ‘pool1’ | ‘res2a/in2’ |
| 7 | 1 × 1 BatchNormalizationLayer | ‘res2a_branch2a’ | ‘bn2a_branch2a’ |
| 8 | 1 × 1 ReLULayer | ‘bn2a_branch2a’ | ‘res2a_branch2a_relu’ |
| 9 | 1 × 1 Convolution2DLayer | ‘res2a_branch2a_relu’ | ‘res2a_branch2b’ |
| 10 | 1 × 1 BatchNormalizationLayer | ‘res2a_branch2b’ | ‘bn2a_branch2b’ |
| 11 | 1 × 1 AdditionLayer | ‘bn2a_branch2b’ | ‘res2a/in1’ |
| 12 | 1 × 1 ReLULayer | ‘res2a’ | ‘res2a_relu’ |
| 13 | 1 × 1 Convolution2DLayer | ‘res2a_relu’ | ‘res2b_branch2a’ |
| 14 | 1 × 1 BatchNormalizationLayer | ‘res2a_relu’ | ‘res2b/in2’ |
| 15 | 1 × 1 ReLULayer | ‘res2b_branch2a’ | ‘bn2b_branch2a’ |
| 16 | 1 × 1 Convolution2DLayer | ‘bn2b_branch2a’ | ‘res2b_branch2a_relu’ |
| 17 | 1 × 1 BatchNormalizationLayer | ‘res2b_branch2a_relu’ | ‘res2b_branch2b’ |
| 18 | 1 × 1 AdditionLayer | ‘res2b_branch2b’ | ‘bn2b_branch2b’ |
| 19 | 1 × 1 ReLULayer | ‘bn2b_branch2b’ | ‘res2b/in1’ |
| 20 | 1 × 1 Convolution2DLayer | ‘res2b’ | ‘res2b_relu’ |
| 21 | 1 × 1 BatchNormalizationLayer | ‘res2b_relu’ | ‘res3a_branch2a’ |
| 22 | 1 × 1 ReLULayer | ‘res2b_relu’ | ‘res3a_branch1’ |
| 23 | 1 × 1 Convolution2DLayer | ‘res3a_branch2a’ | ‘bn3a_branch2a’ |
| 24 | 1 × 1 BatchNormalizationLayer | ‘bn3a_branch2a’ | ‘res3a_branch2a_relu’ |
| 25 | 1 × 1 Convolution2DLayer | ‘res3a_branch2a_relu’ | ‘res3a_branch2b’ |
| 26 | 1 × 1 BatchNormalizationLayer | ‘res3a_branch2b’ | ‘bn3a_branch2b’ |
| 27 | 1 × 1 AdditionLayer | ‘bn3a_branch2b’ | ‘res3a/in1’ |
| 28 | 1 × 1 ReLULayer | ‘res3a_branch1’ | ‘bn3a_branch1’ |
| 29 | 1 × 1 Convolution2DLayer | ‘bn3a_branch1’ | ‘res3a/in2’ |
| 30 | 1 × 1 BatchNormalizationLayer | ‘res3a’ | ‘res3a_relu’ |
| 31 | 1 × 1 ReLULayer | ‘res3a_relu’ | ‘res3b_branch2a’ |
| 32 | 1 × 1 Convolution2DLayer | ‘res3a_relu’ | ‘res3b/in2’ |
| 33 | 1 × 1 BatchNormalizationLayer | ‘res3b_branch2a’ | ‘bn3b_branch2a’ |
| 34 | 1 × 1 AdditionLayer | ‘bn3b_branch2a’ | ‘res3b_branch2a_relu’ |
| 35 | 1 × 1 ReLULayer | ‘res3b_branch2a_relu’ | ‘res3b_branch2b’ |
| 36 | 1 × 1 Convolution2DLayer | ‘res3b_branch2b’ | ‘bn3b_branch2b’ |
| 37 | 1 × 1 BatchNormalizationLayer | ‘bn3b_branch2b’ | ‘res3b/in1’ |
| 38 | 1 × 1 ReLULayer | ‘res3b’ | ‘res3b_relu’ |
| 39 | 1 × 1 Convolution2DLayer | ‘res3b_relu’ | ‘res4a_branch2a’ |
| 40 | 1 × 1 BatchNormalizationLayer | ‘res3b_relu’ | ‘res4a_branch1’ |
| 41 | 1 × 1 Convolution2DLayer | ‘res4a_branch2a’ | ‘bn4a_branch2a’ |
| 42 | 1 × 1 BatchNormalizationLayer | ‘bn4a_branch2a’ | ‘res4a_branch2a_relu’ |
| 43 | 1 × 1 AdditionLayer | ‘res4a_branch2a_relu’ | ‘res4a_branch2b’ |
| 44 | 1 × 1 ReLULayer | ‘res4a_branch2b’ | ‘bn4a_branch2b’ |
| 45 | 1 × 1 Convolution2DLayer | ‘bn4a_branch2b’ | ‘res4a/in1’ |
| 46 | 1 × 1 BatchNormalizationLayer | ‘res4a_branch1’ | ‘bn4a_branch1’ |
| 47 | 1 × 1 ReLULayer | ‘bn4a_branch1’ | ‘res4a/in2’ |
| 48 | 1 × 1 Convolution2DLayer | ‘res4a’ | ‘res4a_relu’ |
| 49 | 1 × 1 BatchNormalizationLayer | ‘res4a_relu’ | ‘res4b_branch2a’ |
| 50 | 1 × 1 AdditionLayer | ‘res4a_relu’ | ‘res4b/in2’ |
| 51 | 1 × 1 ReLULayer | ‘res4b_branch2a’ | ‘bn4b_branch2a’ |
| 52 | 1 × 1 Convolution2DLayer | ‘bn4b_branch2a’ | ‘res4b_branch2a_relu’ |
| 53 | 1 × 1 BatchNormalizationLayer | ‘res4b_branch2a_relu’ | ‘res4b_branch2b’ |
| 54 | 1 × 1 ReLULayer | ‘res4b_branch2b’ | ‘bn4b_branch2b’ |
| 55 | 1 × 1 Convolution2DLayer | ‘bn4b_branch2b’ | ‘res4b/in1’ |
| 56 | 1 × 1 BatchNormalizationLayer | ‘res4b’ | ‘res4b_relu’ |
| 57 | 1 × 1 Convolution2DLayer | ‘res4b_relu’ | ‘res5a_branch2a’ |
| 58 | 1 × 1 BatchNormalizationLayer | ‘res4b_relu’ | ‘res5a_branch1’ |
| 59 | 1 × 1 AdditionLayer | ‘res5a_branch2a’ | ‘bn5a_branch2a’ |
| 60 | 1 × 1 ReLULayer | ‘bn5a_branch2a’ | ‘res5a_branch2a_relu’ |
| 61 | 1 × 1 Convolution2DLayer | ‘res5a_branch2a_relu’ | ‘res5a_branch2b’ |
| 62 | 1 × 1 BatchNormalizationLayer | ‘res5a_branch2b’ | ‘bn5a_branch2b’ |
| 63 | 1 × 1 ReLULayer | ‘bn5a_branch2b’ | ‘res5a/in1’ |
| 64 | 1 × 1 Convolution2DLayer | ‘res5a_branch1’ | ‘bn5a_branch1’ |
| 65 | 1 × 1 BatchNormalizationLayer | ‘bn5a_branch1’ | ‘res5a/in2’ |
| 66 | 1 × 1 AdditionLayer | ‘res5a’ | ‘res5a_relu’ |
| 67 | 1 × 1 ReLULayer | ‘res5a_relu’ | ‘res5b_branch2a’ |
| 68 | 1 × 1 GlobalAveragePooling2DLayer | ‘res5a_relu’ | ‘res5b/in2’ |
| 69 | 1 × 1 FullyConnectedLayer | ‘res5b_branch2a’ | ‘bn5b_branch2a’ |
| 70 | 1 × 1 SoftmaxLayer | ‘bn5b_branch2a’ | ‘res5b_branch2a_relu’ |
| 71 | 1 × 1 ClassificationOutputLayer | ‘res5b_branch2a_relu’ | ‘res5b_branch2b’ |
| ‘res5b_branch2b’ | ‘bn5b_branch2b’ | ||
| ‘bn5b_branch2b’ | ‘res5b/in1’ | ||
| ‘res5b’ | ‘res5b_relu’ | ||
| ‘res5b_relu’ | ‘pool5’ | ||
| ‘pool5’ | ‘fc’ | ||
| ‘fc’ | ‘prob’ | ||
| ‘prob’ | ‘classoutput’ | ||
Appendix C

Figure A1.
Training progress of the convolutional neural network for the classification of celiac disease, small intestine control, and duodenal inflammation.
Figure A1.
Training progress of the convolutional neural network for the classification of celiac disease, small intestine control, and duodenal inflammation.

Appendix D

Figure A2.
Training progress of the convolutional neural network for the classification of celiac disease, small intestine control, duodenal inflammation, and duodenal adenocarcinoma.
Figure A2.
Training progress of the convolutional neural network for the classification of celiac disease, small intestine control, duodenal inflammation, and duodenal adenocarcinoma.

References
- Al-Toma, A.; Volta, U.; Auricchio, R.; Castillejo, G.; Sanders, D.S.; Cellier, C.; Mulder, C.J.; Lundin, K.E.A. European Society for the Study of Coeliac Disease (ESsCD) guideline for coeliac disease and other gluten-related disorders. United Eur. Gastroenterol. J. 2019, 7, 583–613. [Google Scholar] [CrossRef] [PubMed]
- Vargas, M.M.; Artigiani Neto, R.; Sdepanian, V.L. Quantitative histology as a diagnostic tool for celiac disease in children and adolescents. Ann. Diagn Pathol. 2022, 61, 152031. [Google Scholar] [CrossRef]
- Catassi, C.; Verdu, E.F.; Bai, J.C.; Lionetti, E. Coeliac disease. Lancet 2022, 399, 2413–2426. [Google Scholar] [CrossRef]
- Detlef Schuppan, W.D. Epidemiology, Pathogenesis, and Clinical Manifestations of Celiac Disease in Adults; UpToDate: Waltham, MA, USA, 2023. [Google Scholar]
- Oxentenko, A.S.; Rubio-Tapia, A. Celiac Disease. Mayo Clin. Proc. 2019, 94, 2556–2571. [Google Scholar] [CrossRef] [PubMed]
- Pinto-Sanchez, M.I.; Silvester, J.A.; Lebwohl, B.; Leffler, D.A.; Anderson, R.P.; Therrien, A.; Kelly, C.P.; Verdu, E.F. Society for the Study of Celiac Disease position statement on gaps and opportunities in coeliac disease. Nat. Rev. Gastroenterol. Hepatol. 2021, 18, 875–884. [Google Scholar] [CrossRef]
- Taavela, J.; Kurppa, K.; Collin, P.; Lahdeaho, M.L.; Salmi, T.; Saavalainen, P.; Haimila, K.; Huhtala, H.; Laurila, K.; Sievanen, H.; et al. Degree of damage to the small bowel and serum antibody titers correlate with clinical presentation of patients with celiac disease. Clin. Gastroenterol. Hepatol. 2013, 11, 166–171.e161. [Google Scholar] [CrossRef] [PubMed]
- West, J.; Logan, R.F.; Hill, P.G.; Khaw, K.T. The iceberg of celiac disease: What is below the waterline? Clin. Gastroenterol. Hepatol. 2007, 5, 59–62. [Google Scholar] [CrossRef] [PubMed]
- Marisa Stahl, E.L. Diagnosis of Celiac Disease in Children; UpToDate: Waltham, MA, USA, 2023. [Google Scholar]
- Sahin, Y. Celiac disease in children: A review of the literature. World J. Clin. Pediatr. 2021, 10, 53–71. [Google Scholar] [CrossRef]
- Tye-Din, J.A.; Galipeau, H.J.; Agardh, D. Celiac Disease: A Review of Current Concepts in Pathogenesis, Prevention, and Novel Therapies. Front. Pediatr. 2018, 6, 350. [Google Scholar] [CrossRef]
- Ferguson, A.; Arranz, E.; O’Mahony, S. Clinical and pathological spectrum of coeliac disease--active, silent, latent, potential. Gut 1993, 34, 150–151. [Google Scholar] [CrossRef] [PubMed]
- Fry, L.; Seah, P.P.; McMinn, R.M.; Hoffbrand, A.V. Lymphocytic infiltration of epithelium in diagnosis of gluten-sensitive enteropathy. Br. Med. J. 1972, 3, 371–374. [Google Scholar] [CrossRef] [PubMed]
- Hvas, C.L.; Jensen, M.D.; Reimer, M.C.; Riis, L.B.; Rumessen, J.J.; Skovbjerg, H.; Teisner, A.; Wildt, S. Celiac disease: Diagnosis and treatment. Dan. Med. J. 2015, 62, C5051. [Google Scholar]
- Marsh, M.N.; Crowe, P.T. Morphology of the mucosal lesion in gluten sensitivity. Baillieres Clin. Gastroenterol. 1995, 9, 273–293. [Google Scholar] [CrossRef] [PubMed]
- Troncone, R.; Greco, L.; Mayer, M.; Paparo, F.; Caputo, N.; Micillo, M.; Mugione, P.; Auricchio, S. Latent and potential coeliac disease. Acta Paediatr Suppl 1996, 412, 10–14. [Google Scholar] [CrossRef] [PubMed]
- Marsh, M.N. Gluten, major histocompatibility complex, and the small intestine. A molecular and immunobiologic approach to the spectrum of gluten sensitivity (‘celiac sprue’). Gastroenterology 1992, 102, 330–354. [Google Scholar] [CrossRef]
- Oberhuber, G. Histopathology of celiac disease. Biomed. Pharmacother. 2000, 54, 368–372. [Google Scholar] [CrossRef]
- Corazza, G.R.; Villanacci, V. Coeliac disease. J. Clin. Pathol. 2005, 58, 573–574. [Google Scholar] [CrossRef] [PubMed]
- Adelman, D.C.; Murray, J.; Wu, T.T.; Maki, M.; Green, P.H.; Kelly, C.P. Measuring Change In Small Intestinal Histology In Patients With Celiac Disease. Am. J. Gastroenterol. 2018, 113, 339–347. [Google Scholar] [CrossRef] [PubMed]
- Carreras, J. Artificial Intelligence Analysis of Celiac Disease Using an Autoimmune Discovery Transcriptomic Panel Highlighted Pathogenic Genes including BTLA. Healthcare 2022, 10, 1550. [Google Scholar] [CrossRef] [PubMed]
- Martin-Masot, R.; Herrador-Lopez, M.; Navas-Lopez, V.M.; Carmona, F.D.; Nestares, T.; Bossini-Castillo, L. Celiac Disease Is a Risk Factor for Mature T and NK Cell Lymphoma: A Mendelian Randomization Study. Int. J. Mol. Sci. 2023, 24, 7216. [Google Scholar] [CrossRef]
- Abdullah, S.A.A.; Goa, P.; Vandenberghe, E.; Flavin, R. Update on the Pathogenesis of Enteropathy-Associated T-Cell Lymphoma. Diagnostics 2023, 13, 2629. [Google Scholar] [CrossRef]
- Al Somali, Z.; Hamadani, M.; Kharfan-Dabaja, M.; Sureda, A.; El Fakih, R.; Aljurf, M. Enteropathy-Associated T cell Lymphoma. Curr. Hematol. Malig. Rep. 2021, 16, 140–147. [Google Scholar] [CrossRef]
- Rishi, A.R.; Rubio-Tapia, A.; Murray, J.A. Refractory celiac disease. Expert Rev. Gastroenterol. Hepatol. 2016, 10, 537–546. [Google Scholar] [CrossRef] [PubMed]
- Campo, E.; Jaffe, E.S.; Cook, J.R.; Quintanilla-Martinez, L.; Swerdlow, S.H.; Anderson, K.C.; Brousset, P.; Cerroni, L.; de Leval, L.; Dirnhofer, S.; et al. The International Consensus Classification of Mature Lymphoid Neoplasms: A report from the Clinical Advisory Committee. Blood 2022, 140, 1229–1253. [Google Scholar] [CrossRef] [PubMed]
- Zhang, Z. A gentle introduction to artificial neural networks. Ann. Transl. Med. 2016, 4, 370. [Google Scholar] [CrossRef]
- Chetcuti Zammit, S.; McAlindon, M.E.; Greenblatt, E.; Maker, M.; Siegelman, J.; Leffler, D.A.; Yardibi, O.; Raunig, D.; Brown, T.; Sidhu, R. Quantification of Celiac Disease Severity Using Video Capsule Endoscopy: A Comparison of Human Experts and Machine Learning Algorithms. Curr. Med. Imaging 2023, 19, 1455–1662. [Google Scholar] [CrossRef]
- Denholm, J.; Schreiber, B.A.; Evans, S.C.; Crook, O.M.; Sharma, A.; Watson, J.L.; Bancroft, H.; Langman, G.; Gilbey, J.D.; Schonlieb, C.B.; et al. Multiple-instance-learning-based detection of coeliac disease in histological whole-slide images. J. Pathol. Inform. 2022, 13, 100151. [Google Scholar] [CrossRef] [PubMed]
- Faust, O.; De Michele, S.; Koh, J.E.; Jahmunah, V.; Lih, O.S.; Kamath, A.P.; Barua, P.D.; Ciaccio, E.J.; Lewis, S.K.; Green, P.H.; et al. Automated analysis of small intestinal lamina propria to distinguish normal, Celiac Disease, and Non-Celiac Duodenitis biopsy images. Comput. Methods Programs Biomed. 2023, 230, 107320. [Google Scholar] [CrossRef]
- Sana, M.K.; Hussain, Z.M.; Shah, P.A.; Maqsood, M.H. Artificial intelligence in celiac disease. Comput. Biol. Med. 2020, 125, 103996. [Google Scholar] [CrossRef]
- Stoleru, C.A.; Dulf, E.H.; Ciobanu, L. Automated detection of celiac disease using Machine Learning Algorithms. Sci. Rep. 2022, 12, 4071. [Google Scholar] [CrossRef]
- Wang, X.; Qian, H.; Ciaccio, E.J.; Lewis, S.K.; Bhagat, G.; Green, P.H.; Xu, S.; Huang, L.; Gao, R.; Liu, Y. Celiac disease diagnosis from videocapsule endoscopy images with residual learning and deep feature extraction. Comput. Methods Programs Biomed. 2020, 187, 105236. [Google Scholar] [CrossRef]
- Pang, S.; Du, A.; Orgun, M.A.; Yu, Z. A novel fused convolutional neural network for biomedical image classification. Med. Biol. Eng. Comput. 2019, 57, 107–121. [Google Scholar] [CrossRef]
- He, K.; Zhang, X.; Ren, S.; Sun, J. Deep Residual Learning for Image Recognition. arXiv 2015. [Google Scholar] [CrossRef]
- Advanced Micro Devices, I. AMD Ryzen™ 9 7950X Desktop Processor. Available online: https://www.amd.com/en/products/processors/desktops/ryzen/7000-series/amd-ryzen-9-7950x.html (accessed on 27 June 2024).
- Corporation, N. GeForce RTX 4080 Family. Available online: https://www.nvidia.com/en-us/geforce/graphics-cards/40-series/rtx-4080-family/ (accessed on 27 June 2024).
- Stanford Vision Lab, S.U., Princeton University. ImageNet. Available online: https://www.image-net.org/ (accessed on 1 June 2024).
- Kelly, C.P. Diagnosis of Celiac Disease in Adults; UpToDate: Waltham, MA, USA, 2023. [Google Scholar]
- Oberhuber, G.; Granditsch, G.; Vogelsang, H. The histopathology of coeliac disease: Time for a standardized report scheme for pathologists. Eur. J. Gastroenterol. Hepatol. 1999, 11, 1185–1194. [Google Scholar] [CrossRef] [PubMed]
- Tomita, S.; Kikuti, Y.Y.; Carreras, J.; Kojima, M.; Ando, K.; Takasaki, H.; Sakai, R.; Takata, K.; Yoshino, T.; Bea, S.; et al. Genomic and immunohistochemical profiles of enteropathy-associated T-cell lymphoma in Japan. Mod. Pathol. 2015, 28, 1286–1296. [Google Scholar] [CrossRef]
- Ruiz-Ramirez, P.; Carreras, G.; Fajardo, I.; Tristan, E.; Carrasco, A.; Salvador, I.; Zabana, Y.; Andujar, X.; Ferrer, C.; Horta, D.; et al. Intraepithelial Lymphocyte Cytometric Pattern Is a Useful Diagnostic Tool for Coeliac Disease Diagnosis Irrespective of Degree of Mucosal Damage and Age-A Validation Cohort. Nutrients 2021, 13, 1684. [Google Scholar] [CrossRef] [PubMed]
- Liu, H.; Brais, R.; Lavergne-Slove, A.; Jeng, Q.; Payne, K.; Ye, H.; Liu, Z.; Carreras, J.; Huang, Y.; Bacon, C.M.; et al. Continual monitoring of intraepithelial lymphocyte immunophenotype and clonality is more important than snapshot analysis in the surveillance of refractory coeliac disease. Gut 2010, 59, 452–460. [Google Scholar] [CrossRef]
- Woodward, J. The management of refractory coeliac disease. Ther. Adv. Chronic. Dis. 2013, 4, 77–90. [Google Scholar] [CrossRef] [PubMed]
- Liu, H.; Fofaria, R.K.; Greenfield, S.M.; Robson, A.; Wright, P.; Isaacson, P.G.; Woodward, J.; Du, M.Q. The aberrant intraepithelial T cells in refractory coeliac disease show epidermotropism. J. Clin. Pathol. 2014, 67, 380–382. [Google Scholar] [CrossRef]
- Daum, S.; Weiss, D.; Hummel, M.; Ullrich, R.; Heise, W.; Stein, H.; Riecken, E.O.; Foss, H.D.; Intestinal Lymphoma Study Group. Frequency of clonal intraepithelial T lymphocyte proliferations in enteropathy-type intestinal T cell lymphoma, coeliac disease, and refractory sprue. Gut 2001, 49, 804–812. [Google Scholar] [CrossRef]
- Tomita, S.; Kikuti, Y.Y.; Carreras, J.; Sakai, R.; Takata, K.; Yoshino, T.; Bea, S.; Campo, E.; Missiaglia, E.; Bouilly, J.; et al. Monomorphic Epitheliotropic Intestinal T-Cell Lymphoma in Asia Frequently Shows SETD2 Alterations. Cancers 2020, 12, 3539. [Google Scholar] [CrossRef]
- Domoto, H.; Araki, T.; Ogai, A.; Inukai, M.; Chen, C.K.; Tomita, S.; Mukai, K.; Nakamura, N. Surface CD3-negative monomorphic epitheliotropic intestinal T-cell lymphoma. J. Clin. Exp. Hematop. 2022, 62, 169–174. [Google Scholar] [CrossRef]
- Carreras, J.; Hamoudi, R.; Howat, W.; Lavergne-Slove, A.; Chuang, S.S.; Venkatraman, L.; Dogan, A.; Woodward, J.; Cerf-Bensussan, N.; John, G.; et al. P1-008 Defective immune homeostasis mechanisms in Celiac Disease (CD), in its progression to Refractory Celiac Disease (RCD) and transformation to Enteropathy-Associated T-Cell Lymphoma (EATL type 1). Jpn. J. Clin. Immunol. 2012, 35, 330b. [Google Scholar] [CrossRef][Green Version]
- Fiorenza, V.; Yee, Y.S.; Zfass, A.M. Small intestinal motility: Normal and abnormal function. Am. J. Gastroenterol. 1987, 82, 1111–1114. [Google Scholar] [PubMed]
- Sarna, S.K.; Otterson, M.F. Small intestinal physiology and pathophysiology. Gastroenterol. Clin. N. Am. 1989, 18, 375–404. [Google Scholar] [CrossRef]
- MathWorks. Batch normalization layer. Available online: https://www.mathworks.com/help/deeplearning/ref/nnet.cnn.layer.batchnormalizationlayer.html (accessed on 28 July 2024).
- Bennett, C.M.; Coleman, H.G.; Veal, P.G.; Cantwell, M.M.; Lau, C.C.; Murray, L.J. Lifestyle factors and small intestine adenocarcinoma risk: A systematic review and meta-analysis. Cancer Epidemiol. 2015, 39, 265–273. [Google Scholar] [CrossRef]
- Aparicio, T.; Pachev, A.; Laurent-Puig, P.; Svrcek, M. Epidemiology, Risk Factors and Diagnosis of Small Bowel Adenocarcinoma. Cancers 2022, 14, 2268. [Google Scholar] [CrossRef] [PubMed]
- Fujimori, S.; Hamakubo, R.; Hoshimoto, A.; Nishimoto, T.; Omori, J.; Akimoto, N.; Tanaka, S.; Tatsuguchi, A.; Iwakiri, K. Risk factors for small intestinal adenocarcinomas that are common in the proximal small intestine. World J. Gastroenterol. 2022, 28, 5658–5665. [Google Scholar] [CrossRef]
- Barsouk, A.; Rawla, P.; Barsouk, A.; Thandra, K.C. Epidemiology of Cancers of the Small Intestine: Trends, Risk Factors, and Prevention. Med. Sci. 2019, 7, 46. [Google Scholar] [CrossRef]
- Dunne, P.D.; Arends, M.J. Molecular pathological classification of colorectal cancer-an update. Virchows Arch. 2024, 484, 273–285. [Google Scholar] [CrossRef]
- Dolinger, M.; Torres, J.; Vermeire, S. Crohn‘s disease. Lancet 2024, 403, 1177–1191. [Google Scholar] [CrossRef] [PubMed]
- Freeman, H.J. Natural history and long-term clinical course of Crohn‘s disease. World J. Gastroenterol. 2014, 20, 31–36. [Google Scholar] [CrossRef]
- Feakins, R.M. Ulcerative colitis or Crohn‘s disease? Pitfalls and problems. Histopathology 2014, 64, 317–335. [Google Scholar] [CrossRef] [PubMed]
- Selvaraju, R.R.; Cogswell, M.; Das, A.; Vedantam, R.; Parikh, D.; Batra, D. Grad-CAM: Visual Explanations from Deep Networks via Gradient-Based Localization. In Proceedings of the IEEE International Conference on Computer Vision (ICCV), Venice, Italy, 22–29 October 2017; pp. 618–626. [Google Scholar]
- Madhavan, S. Introduction to Convolutional Neural Networks. 12 July 2021. IBM Corporation. IBM Developer. Available online: https://developer.ibm.com/articles/introduction-to-convolutional-neural-networks/ (accessed on 26 June 2024).
- Zhou, Q.; Zhu, W.; Li, F.; Yuan, M.; Zheng, L.; Liu, X. Transfer Learning of the ResNet-18 and DenseNet-121 Model Used to Diagnose Intracranial Hemorrhage in CT Scanning. Curr. Pharm. Des. 2022, 28, 287–295. [Google Scholar] [CrossRef] [PubMed]
- Jing, E.; Zhang, H.; Li, Z.; Liu, Y.; Ji, Z.; Ganchev, I. ECG Heartbeat Classification Based on an Improved ResNet-18 Model. Comput. Math Methods Med. 2021, 2021, 6649970. [Google Scholar] [CrossRef] [PubMed]
- Zhang, Y.; Peng, L.; Ma, G.; Man, M.; Liu, S. Dynamic Gesture Recognition Model Based on Millimeter-Wave Radar With ResNet-18 and LSTM. Front. Neurorobot. 2022, 16, 903197. [Google Scholar] [CrossRef] [PubMed]
- Jin, X.; Tang, L.; Li, R.; Ji, J.; Liu, J. Selective transplantation method of leafy vegetable seedlings based on ResNet 18 network. Front. Plant Sci. 2022, 13, 893357. [Google Scholar] [CrossRef] [PubMed]
- Zhu, Z.; Wang, S.; Zhang, Y. ROENet: A ResNet-Based Output Ensemble for Malaria Parasite Classification. Electronics 2022, 11, 2040. [Google Scholar] [CrossRef] [PubMed]
- Kang, Z.; Xiao, E.; Li, Z.; Wang, L. Deep Learning Based on ResNet-18 for Classification of Prostate Imaging-Reporting and Data System Category 3 Lesions. Acad. Radiol. 2024, 31, 2412–2423. [Google Scholar] [CrossRef]
- Li, C.; Wang, Q.; Liu, X.; Hu, B. An Attention-Based CoT-ResNet With Channel Shuffle Mechanism for Classification of Alzheimer‘s Disease Levels. Front. Aging Neurosci. 2022, 14, 930584. [Google Scholar] [CrossRef]
- Amin, J.; Shazadi, I.; Sharif, M.; Yasmin, M.; Almujally, N.A.; Nam, Y. Localization and grading of NPDR lesions using ResNet-18-YOLOv8 model and informative features selection for DR classification based on transfer learning. Heliyon 2024, 10, e30954. [Google Scholar] [CrossRef] [PubMed]
- Wei, J.W.; Wei, J.W.; Jackson, C.R.; Ren, B.; Suriawinata, A.A.; Hassanpour, S. Automated Detection of Celiac Disease on Duodenal Biopsy Slides: A Deep Learning Approach. J. Pathol. Inform. 2019, 10, 7. [Google Scholar] [CrossRef]
- Gruver, A.M.; Lu, H.; Zhao, X.; Fulford, A.D.; Soper, M.D.; Ballard, D.; Hanson, J.C.; Schade, A.E.; Hsi, E.D.; Gottlieb, K.; et al. Pathologist-trained machine learning classifiers developed to quantitate celiac disease features differentiate endoscopic biopsies according to modified marsh score and dietary intervention response. Diagn Pathol. 2023, 18, 122. [Google Scholar] [CrossRef] [PubMed]
- Schreiber, B.A.; Denholm, J.; Jaeckle, F.; Arends, M.J.; Branson, K.M.; Schonlieb, C.B.; Soilleux, E.J. Rapid artefact removal and H&E-stained tissue segmentation. Sci. Rep. 2024, 14, 309. [Google Scholar] [CrossRef]
- Schreiber, B.A.; Denholm, J.; Gilbey, J.D.; Schonlieb, C.B.; Soilleux, E.J. Stain normalization gives greater generalizability than stain jittering in neural network training for the classification of coeliac disease in duodenal biopsy whole slide images. J. Pathol. Inform. 2023, 14, 100324. [Google Scholar] [CrossRef]
- Wimmer, G.; Vecsei, A.; Hafner, M.; Uhl, A. Fisher encoding of convolutional neural network features for endoscopic image classification. J. Med. Imaging 2018, 5, 034504. [Google Scholar] [CrossRef] [PubMed]
- Zhou, T.; Han, G.; Li, B.N.; Lin, Z.; Ciaccio, E.J.; Green, P.H.; Qin, J. Quantitative analysis of patients with celiac disease by video capsule endoscopy: A deep learning method. Comput. Biol. Med. 2017, 85, 1–6. [Google Scholar] [CrossRef]
- Carreras, J.; Yukie Kikuti, Y.; Miyaoka, M.; Miyahara, S.; Roncador, G.; Hamoudi, R.; Nakamura, N. Artificial Intelligence Analysis and Reverse Engineering of Molecular Subtypes of Diffuse Large B-Cell Lymphoma Using Gene Expression Data. BioMedInformatics 2024, 4, 295–320. [Google Scholar] [CrossRef]
- Carreras, J.; Nakamura, N. Artificial Intelligence, Lymphoid Neoplasms, and Prediction of MYC, BCL2, and BCL6 Gene Expression Using a Pan-Cancer Panel in Diffuse Large B-Cell Lymphoma. Hemato 2024, 5, 119–143. [Google Scholar] [CrossRef]
- Carreras, J.; Hamoudi, R. Anomaly Detection and Artificial Intelligence Identified the Pathogenic Role of Apoptosis and RELB Proto-Oncogene, NF-kB Subunit in Diffuse Large B-Cell Lymphoma. BioMedInformatics 2024, 4, 1480–1505. [Google Scholar] [CrossRef]
- Carreras, J.; Hiraiwa, S.; Kikuti, Y.Y.; Miyaoka, M.; Tomita, S.; Ikoma, H.; Ito, A.; Kondo, Y.; Roncador, G.; Garcia, J.F.; et al. Artificial Neural Networks Predicted the Overall Survival and Molecular Subtypes of Diffuse Large B-Cell Lymphoma Using a Pancancer Immune-Oncology Panel. Cancers 2021, 13, 6384. [Google Scholar] [CrossRef] [PubMed]
- Carreras, J.; Hamoudi, R.; Nakamura, N. Artificial Intelligence Analysis of Gene Expression Data Predicted the Prognosis of Patients with Diffuse Large B-Cell Lymphoma. Tokai J. Exp. Clin. Med. 2020, 45, 37–48. [Google Scholar] [PubMed]
- Carreras, J.; Nakamura, N.; Hamoudi, R. Artificial Intelligence Analysis of Gene Expression Predicted the Overall Survival of Mantle Cell Lymphoma and a Large Pan-Cancer Series. Healthcare 2022, 10, 155. [Google Scholar] [CrossRef]
- Carreras, J.; Roncador, G.; Hamoudi, R. Artificial Intelligence Predicted Overall Survival and Classified Mature B-Cell Neoplasms Based on Immuno-Oncology and Immune Checkpoint Panels. Cancers 2022, 14, 318. [Google Scholar] [CrossRef]
- Carreras, J. Artificial Intelligence Analysis of Ulcerative Colitis Using an Autoimmune Discovery Transcriptomic Panel. Healthcare 2022, 10, 1476. [Google Scholar] [CrossRef] [PubMed]
- Dankers, F.; Traverso, A.; Wee, L.; van Kuijk, S.M.J. Prediction Modeling Methodology. In Fundamentals of Clinical Data Science; Kubben, P., Dumontier, M., Dekker, A., Eds.; Springer: Cham, Switzerland, 2019; pp. 101–120. [Google Scholar]
- Ciaccio, E.J.; Lewis, S.K.; Bhagat, G.; Green, P.H. Color masking improves classification of celiac disease in videocapsule endoscopy images. Comput. Biol. Med. 2019, 106, 150–156. [Google Scholar] [CrossRef] [PubMed]
- Li, B.N.; Wang, X.; Wang, R.; Zhou, T.; Gao, R.; Ciaccio, E.J.; Green, P.H. Celiac Disease Detection From Videocapsule Endoscopy Images Using Strip Principal Component Analysis. IEEE/ACM Trans. Comput. Biol. Bioinform. 2021, 18, 1396–1404. [Google Scholar] [CrossRef]
- Vicnesh, J.; Wei, J.K.E.; Ciaccio, E.J.; Oh, S.L.; Bhagat, G.; Lewis, S.K.; Green, P.H.; Acharya, U.R. Automated diagnosis of celiac disease by video capsule endoscopy using DAISY Descriptors. J. Med. Syst. 2019, 43, 157. [Google Scholar] [CrossRef]
- DiPalma, J.; Suriawinata, A.A.; Tafe, L.J.; Torresani, L.; Hassanpour, S. Resolution-based distillation for efficient histology image classification. Artif. Intell Med. 2021, 119, 102136. [Google Scholar] [CrossRef] [PubMed]
- Caetano Dos Santos, F.L.; Michalek, I.M.; Laurila, K.; Kaukinen, K.; Hyttinen, J.; Lindfors, K. Automatic classification of IgA endomysial antibody test for celiac disease: A new method deploying machine learning. Sci. Rep. 2019, 9, 9217. [Google Scholar] [CrossRef]
- Kowsari, K.; Sali, R.; Ehsan, L.; Adorno, W.; Ali, A.; Moore, S.; Amadi, B.; Kelly, P.; Syed, S.; Brown, D. HMIC: Hierarchical Medical Image Classification, A Deep Learning Approach. Information 2020, 11, 318. [Google Scholar] [CrossRef] [PubMed]
- Koh, J.E.W.; De Michele, S.; Sudarshan, V.K.; Jahmunah, V.; Ciaccio, E.J.; Ooi, C.P.; Gururajan, R.; Gururajan, R.; Oh, S.L.; Lewis, S.K.; et al. Automated interpretation of biopsy images for the detection of celiac disease using a machine learning approach. Comput. Methods Programs Biomed 2021, 203, 106010. [Google Scholar] [CrossRef] [PubMed]
- Das, P.; Gahlot, G.P.; Singh, A.; Baloda, V.; Rawat, R.; Verma, A.K.; Khanna, G.; Roy, M.; George, A.; Singh, A.; et al. Quantitative histology-based classification system for assessment of the intestinal mucosal histological changes in patients with celiac disease. Intest Res. 2019, 17, 387–397. [Google Scholar] [CrossRef] [PubMed]


Disclaimer/Publisher’s Note: The statements, opinions and data contained in all publications are solely those of the individual author(s) and contributor(s) and not of MDPI and/or the editor(s). MDPI and/or the editor(s) disclaim responsibility for any injury to people or property resulting from any ideas, methods, instructions or products referred to in the content. |
© 2024 by the author. Licensee MDPI, Basel, Switzerland. This article is an open access article distributed under the terms and conditions of the Creative Commons Attribution (CC BY) license (https://creativecommons.org/licenses/by/4.0/).