Article

A New Approach for Effective Retrieval of Medical Images: A Step towards Computer-Assisted Diagnosis

Computer Science and Engineering Department, Thapar Institute of Engineering and Technology, Patiala 147004, Punjab, India
*
Author to whom correspondence should be addressed.
J. Imaging 2024, 10(9), 210; https://doi.org/10.3390/jimaging10090210
Submission received: 20 July 2024 / Revised: 23 August 2024 / Accepted: 23 August 2024 / Published: 26 August 2024

Abstract

:
The biomedical imaging field has grown enormously in the past decade. In the era of digitization, the demand for computer-assisted diagnosis is increasing day by day. The COVID-19 pandemic further emphasized how retrieving meaningful information from medical repositories can aid in improving the quality of patient’s diagnosis. Therefore, content-based retrieval of medical images has a very prominent role in fulfilling our ultimate goal of developing automated computer-assisted diagnosis systems. Therefore, this paper presents a content-based medical image retrieval system that extracts multi-resolution, noise-resistant, rotation-invariant texture features in the form of a novel pattern descriptor, i.e., M s N r R i T x P , from medical images. In the proposed approach, the input medical image is initially decomposed into three neutrosophic images on its transformation into the neutrosophic domain. Afterwards, three distinct pattern descriptors, i.e., M s T r P , N r T x P , and R i T x P , are derived at multiple scales from the three neutrosophic images. The proposed M s N r R i T x P pattern descriptor is obtained by scale-wise concatenation of the joint histograms of M s T r P × R i T x P and N r T x P × R i T x P . To demonstrate the efficacy of the proposed system, medical images of different modalities, i.e., CT and MRI, from four test datasets are considered in our experimental setup. The retrieval performance of the proposed approach is exhaustively compared with several existing, recent, and state-of-the-art local binary pattern-based variants. The retrieval rates obtained by the proposed approach for the noise-free and noisy variants of the test datasets are observed to be substantially higher than the compared ones.

1. Introduction

1.1. Background and Motivation

With the advent of the digital age, there has been a rapid escalation in the use of digital images in applications like medical diagnosis. This has led to the formation of numerous digital image repositories and image archives. The use of biomedical images has enormously helped doctors make accurate diagnoses for patients [1]. Another aspect associated with the use of digital images is the ever-increasing demand for automated computer-assisted diagnosis (CAD) using machine learning [2]. After the COVID-19 pandemic severely affected the entire world, a lot of work has been put towards the computer-assisted detection of corona virus in patients’ chest X-ray images or CT images. This has further fueled the demand for CAD systems to ease the burden on already burdened and scarce medical personnel. Thus, our presented work focuses on one such branch of CAD systems, i.e., medical image retrieval (MIR) systems [3]. With the formation of medical image repositories and archives, effective data management and retrieval are required to ensure their optimum usage [4]. The sole purpose of MIR systems is to retrieve the most relevant and meaningful images in response to a user’s query from the existing database. MIR systems can be categorized based on the way in which the user submits their query, i.e., text-based image retrieval or content-based image retrieval [5].
In text-based image retrieval, the user submits their query in the form of a string containing keywords like lung, brain, tumor, etc., which are used to search relevant images on the basis of automatic or manual annotation of the image. Manual annotation is subjective and infeasible on large datasets, leading to its inability to describe complex visual properties (such as irregular shapes, varying textures) contained within medical images, thereby posing significant challenges for their retrieval [6]. A traditional patient diagnosis includes a comprehensive examination of the patient’s data (both image and non-image) in conjunction with the doctor’s previous encounters with similar situations. It has been observed that knowledge from similar cases has been greatly enhanced with the use of the visual content of medical images [1,2]. Therefore, the capability to search based on medical image information is growing in significance. Content-based medical image retrieval (CBMIR) retrieves images by extracting relevant visual properties such as shape, color, and texture. CBMIR systems can assist in diagnosis prognosis by retrieving images of the same anatomic location affected by the same disease [4]. Using a CBMIR system, a clinician can search a database of known instances for images with similar traits to those found in the abnormal diagnostic image. CBMIR offers pertinent supporting information from previous instances, presenting the physician with training examples with a proven diagnostic record, enabling them to garner confidence in their prognosis of the detected disease. Less experienced practitioners can benefit from the expertise by using visually identical retrieved images as a form of expert consultation. CBMIR would be beneficial for medical students and researchers to search and explore extensive collections of disease-related images based on their visual characteristics, serving as a valuable training tool. CBMIR’s success will lead to advancements in medical services and research, including disease tracking, differential diagnosis, noninvasive surgical planning, clinical training, etc. [5].

1.2. State of the Art

A lot of effort has been put forth by researchers across the globe in developing such CBMIR systems, employing a wide range of feature extraction strategies, mainly harnessing the texture information from medical images. Medical images (mostly gray-scale images) are rich in texture information. Therefore, their examination usually requires interpretation of tissue appearance, i.e., local intensity variations based on different texture properties such as smoothness, coarseness, regularity, and homogeneity [1]. Since texture information holds such a huge importance, texture-based feature extraction methods have become one of the most widely used techniques for medical image analysis, classification, and retrieval [7]. All different forms of feature descriptors (color, texture, and shape) can further be categorized into local feature descriptors (LFDs) and global feature descriptors (GFDs) [8]. GFDs capture the overall aspect of an image, such as information corresponding to shape and structure, e.g., information, etc., whereas LFDs capture localized information of an image such as the presence of a lesion in a particular location that is very small in size with respect to the entire image. GFDs are not able to accurately represent information about such lesions. In LFDs, an image is divided into sub-images and the final feature vector of the entire image is formed by appending the information extracted from each of the sub-images. In GFDs, the resultant feature vector is obtained by using all the pixels together as a whole [9]. Among the LFDs, local binary pattern (LBP) [10] has been most widely adopted for extracting texture information. The computation of LBP involves the encoding of pixel intensity differences within a local neighborhood constructed around each pixel of the image. LBP, because of its superior performance in texture-based applications, has been adopted in biomedical image processing to analyze the micro-structure of different body organs in X-ray, CT, and MRI images [11]. However, there are certain factors, such as difficult lighting conditions, noisy conditions, image rotation, etc., that limit the performance of LBP. In light of this, a lot of variants have been proposed in the literature for CBMIR. The simplest extension of LBP is local ternary pattern (LTP) [12]. Unlike LBP, in which the neighbors are coded as either 0 or 1, LTP is as a three-valued code where the neighbors are coded as 0, 1, or −1. LTP has shown superior performance in comparison to LBP under noisy, aging, and non-uniform lighting conditions. However, scenarios like threshold selection limit its performance. Murala and Wu have worked extensively in CBMIR and have proposed several variants of LBP: local co-occurrence ternary pattern (LTCoP) [13] (rotation-invariant but computationally expensive), local mesh pattern (LMeP) [14] (enhanced edge information with high computational complexity), local mesh peak valley edge pattern (LMePVP) [15] (a ternary pattern based on first-order derivatives, i.e., local mesh peak edge pattern (LMePEP) and second-order derivatives, i.e., local mesh valley edge pattern (LMeVEP)), and spherical symmetric three-dimensional LTP (SS-3D-LTP) [16] (primarily an extension of LTP from 2D to 3D). On similar grounds, Dubey et al. have proposed several LBP-based CBMIR variants such as local wavelet pattern (LWP) [17] (encodes the local inter-pixel relationship in the wavelet domain), local diagonal extrema pattern (LDEP) [18] (low-dimensional pattern incorporating only diagonal relationships among neighboring pixels), local bit-plane dissimilarity pattern (LBDISP) [19], and local bit-plane decoded pattern (LBDP) [20]) (decomposes an image into bit planes and forms a resultant feature vector by combining the local dissimilarity at each bit plane). Deep et al. also proposed two new CBMIR methods: directional local ternary quantized extrema pattern (DLTerQEP) (encodes relationship along three selected directions of mesh patterns) and local mesh ternary pattern (LMeTP) (encodes relationship along horizontal, vertical, diagonal, and anti-diagonal directional of local neighborhood) [21,22]. An improvement in retrieval performance of DLTerQEP has been presented as local quantized extrema quinary pattern (LQEQryP) [23]. Other promising variants of LBP used for retrieval and classification of facial images, texture images, etc., are local tetra pattern (LTP) [24], local gradient hexa pattern [25], local tri-diagonal pattern (LTDP) [26], local neighborhood difference pattern (LNDP) [27], local neighborhood intensity pattern (LNIP) [28], local directional gradient pattern (LDGP) [29], local directional relation pattern (LDRP) [30], local directional ZigZag pattern (LDZP) [31], local jet pattern (LJP) [32], local morphological pattern (LMP) [33], multichannel local ternary co-occurrence pattern (MCLTCoP) [34], and scale-pattern adaptive local binary pattern (SPALBP) [35]. Recently, deep learning has gained significant popularity in the research community owing to its ability to synthesize automated feature representations without manual intervention. Deep learning is data-driven and automatically generates features for a given set of training data, unlike handcrafted methods that rely on domain knowledge for feature construction. This has led to its wide spread use in MIR applications for medical image analysis [36,37,38,39,40]. Undoubtedly, the retrieval performance of such deep learning methods has been observed to be much superior to the other handcrafted feature extraction methods. However, the downside with such methods is their dependence on the data. The performance of such systems is impaired if the amount of data is too small to train them effectively (even in the case of transfer learning).

1.3. Identified Gap and Contributions

Despite significant advancements in CBMIR techniques, existing methods often struggle with the effective retrieval of medical images due to the complexity and variability inherent in medical data. These challenges include the difficulty in accurately capturing and representing the subtle texture patterns in medical images, which are essential for diagnostic purposes. Additionally, many current systems rely heavily solely on either local features or global features or simple descriptors, which may not be sufficient to differentiate between similar yet diagnostically distinct images. The gap that this study addresses lies in the inadequacy of existing CBMIR methods to effectively utilize texture features for the retrieval of medical images. Current methods are often vulnerable to noise and lack the ability to represent features across multiple scales, which is critical for accurate image analysis. The inability to handle noise effectively and capture multi-scale information results in reduced retrieval accuracy, particularly on complex medical datasets. This limitation hampers the potential of CBMIR systems to assist healthcare professionals in making accurate diagnosis.
In light of the strengths and shortcomings of the above-mentioned methods and the current need to develop effective and efficient CBMIR CAD systems, an attempt has been made in this paper to put forth a CBMIR system encompassing the novel idea of extracting noise-resistant texture features at multiple scales from neutrosophic transformed images of input medical image. Neutrosophic sets, with their ability to encode “indeterminacy” alongside “truth” and “falsity”, have garnered tremendous success in areas as diverse as decision making, information retrieval, and artificial intelligence, etc. [41,42]. Consequently, their use in image processing- and computer vision-related applications has been gaining a lot of attention, especially in areas like medical diagnosis, pattern recognition, etc. [43,44,45]. This paper aligns with the similar interest of utilizing neutrosophic information to develop a computer-assisted diagonsis system based on CBMIR. The key contributions of the paper are as follows:
  • A new idea of using neutrosophic information for extracting underlying textures from medical images. Neutrosophic images offer flexibility in representing texture information by allowing each pixel to have varying degrees of truth, indeterminacy, and falsity. This flexibility accommodates the diverse and complex nature of texture patterns in medical images, providing a more adaptable framework for feature extraction.
  • A new approach, M s N r R i T x P , is presented that extracts texture features from all three neutrosophic images, i.e., truth (T), indeterminacy (I), and falsity (F). The texture features from each of the T, I, and F images are appended together to form the final feature vector for M s N r R i T x P .
  • The presented work delineates an innovative approach which exhibits a significant enhancement over the existing CBMIR approaches by integrating a comprehensive set of features, i.e., noise resilience, rotation invariance, local and neighborhood information embedding, global information embedding, multi-scale feature representation, etc., under one umbrella. This approach is distinguished by its holistic one-stop solution strategy, which seamlessly amalgamates multiple traits into a singular, cohesive technique.
  • The proposed approach demonstrates superior retrieval performance by significantly outperforming the existing state-of-the-art LBP-based CBMIR and texture feature extraction approaches on four standard medical test datasets. To further substantiate the effectiveness of the proposed approach, an additional set of experiments is performed on noisy images of four test datasets.
The remainder of the paper is organised in the following manner: A detailed explanation of our proposed M s N r R i T x P texture descriptor is given in Section 2. The experimental framework employed to test the retrieval performance of the proposed and the compared techniques is presented in Section 3. The experimental findings on four test medical datasets are shown in Section 4. Lastly, Section 5 concludes the presented work.

2. Proposed Multi-Scale Noise-Resistant Rotation-Invariant Texture Pattern ( MsNrRiTxP ) Approach

This section presents the detailed working and layout of the proposed approach. The proposed approach is built from multiple sub-modules, which are detailed below.
  • Firstly, the medical image is transformed to the neutrosophic domain, such that for every input medical image, we obtain three neutrosophic images, i.e., truth (T), indeterminacy (I), and falsity (F).
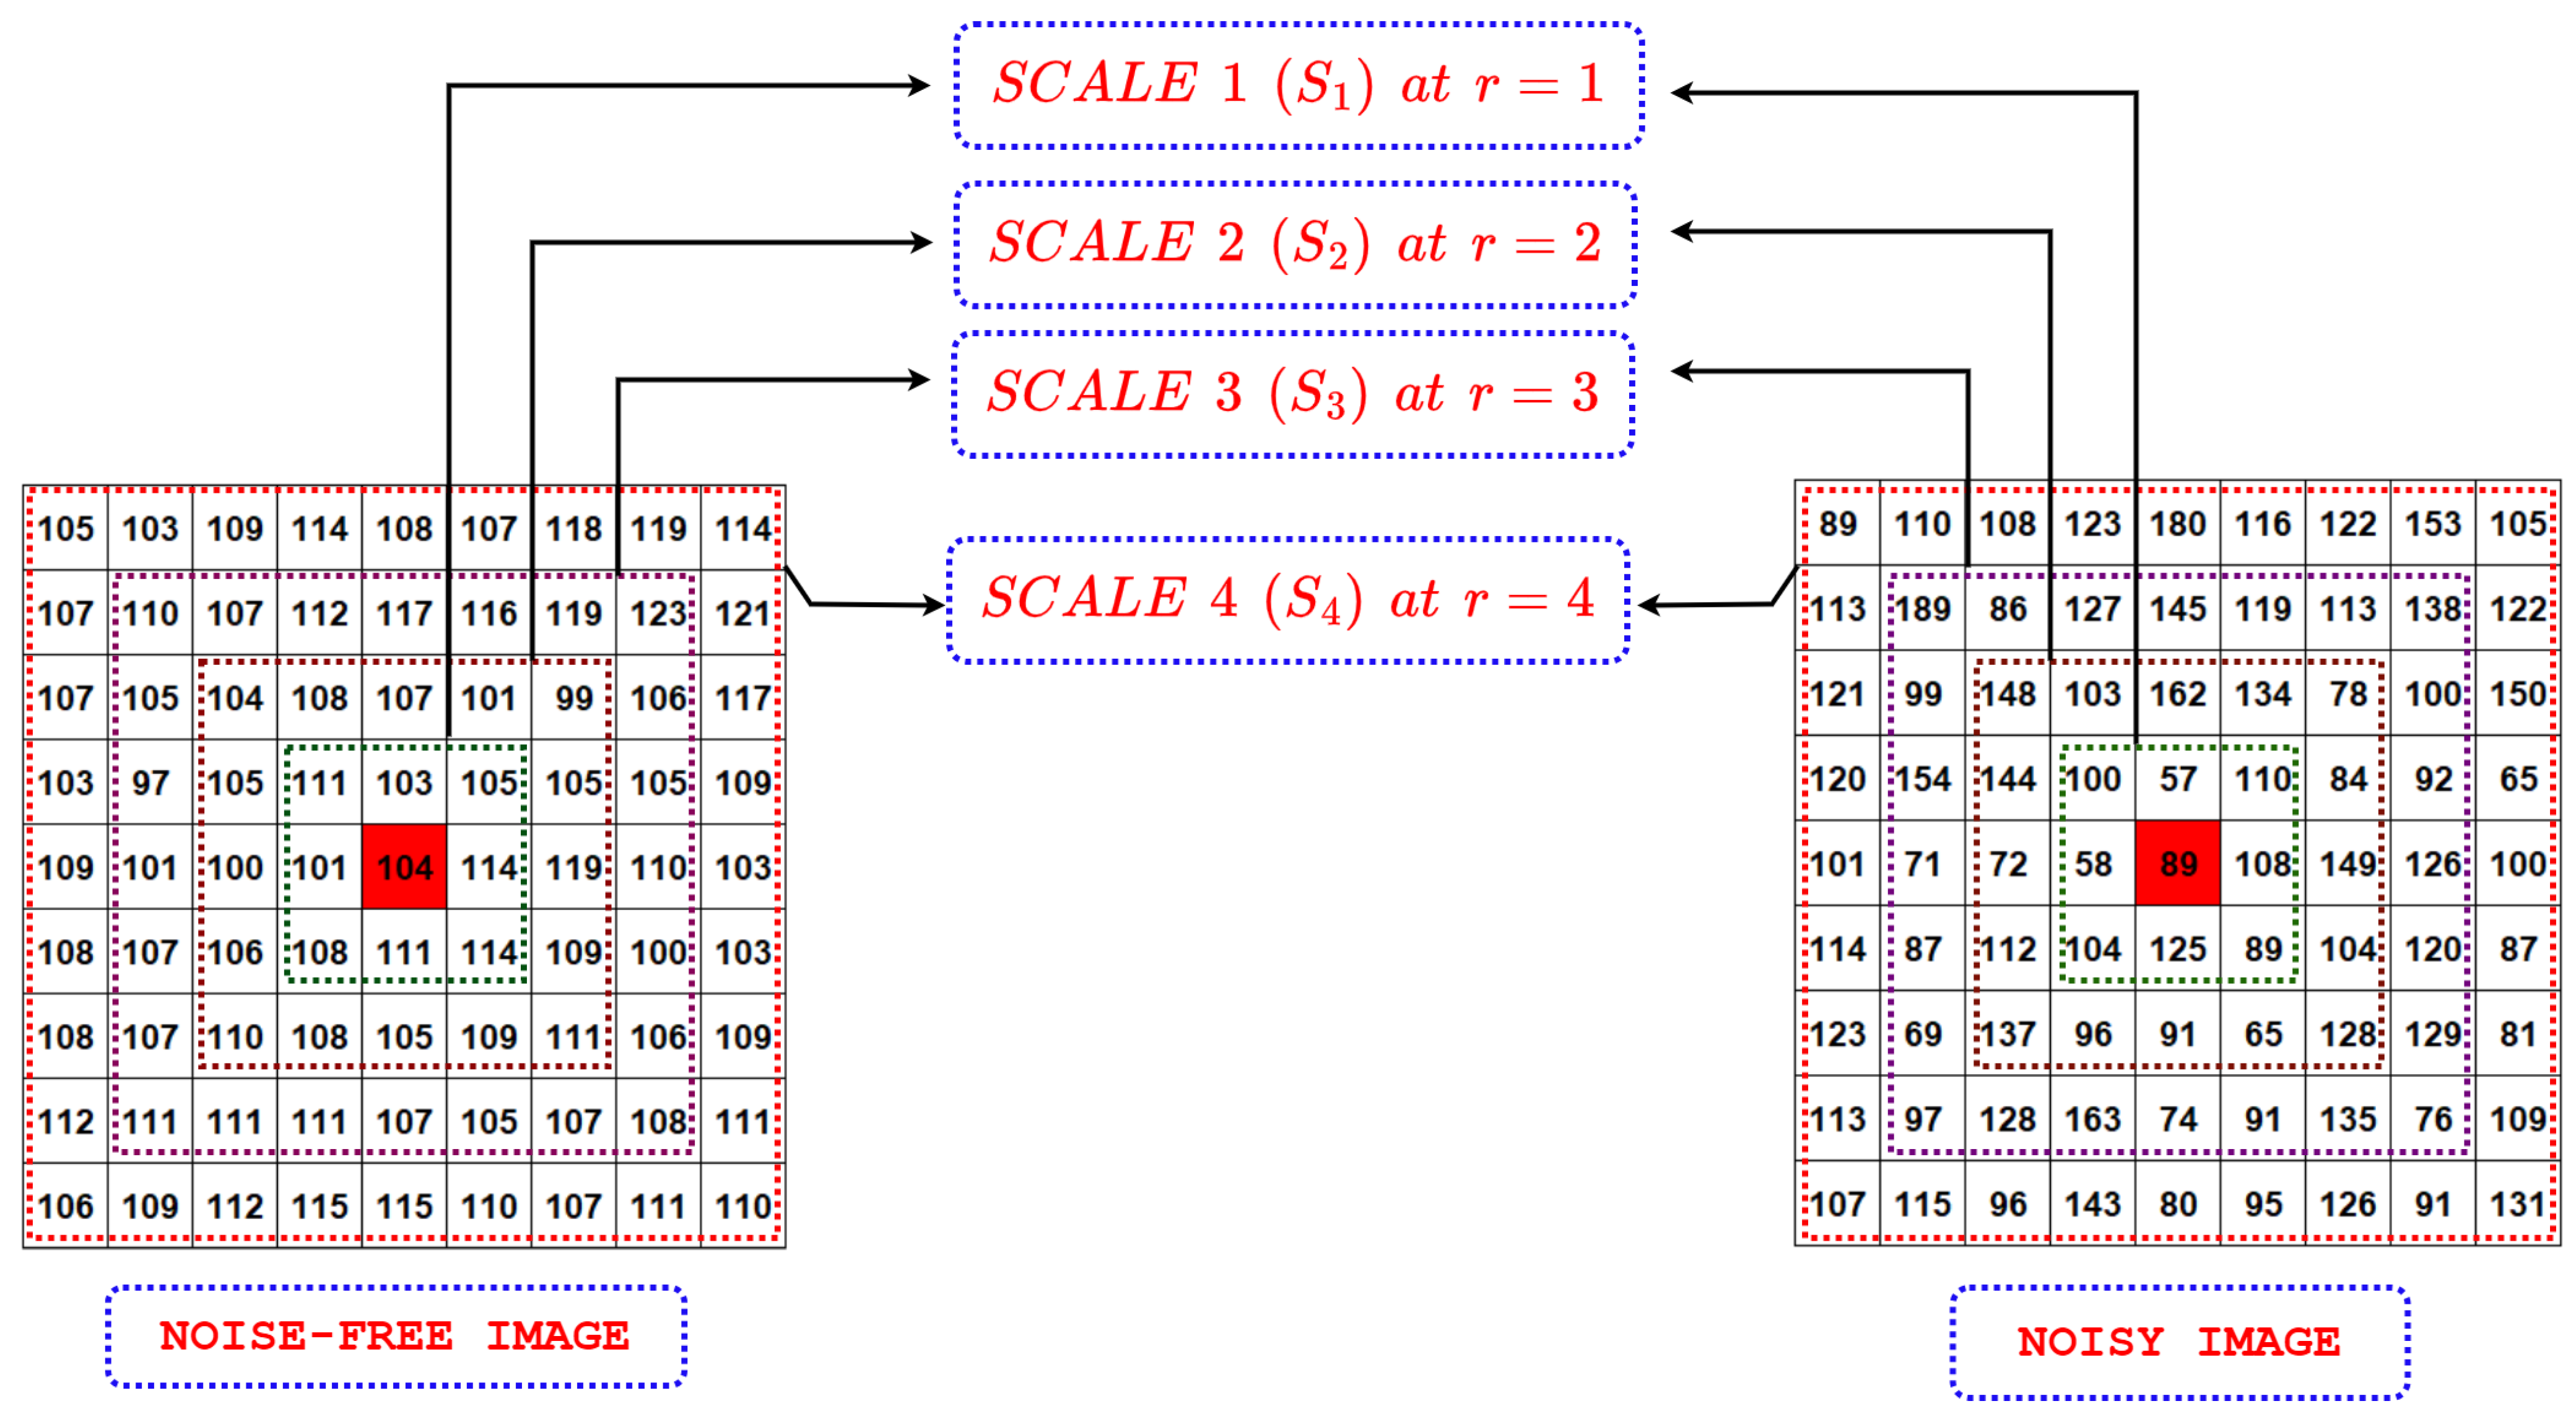
  • Secondly, from each of the T, I, and F images, rotation-invariant and noise-robust texture feature pattern descriptors, M s N r R i T x P r T , M s N r R i T x P r I , and M s N r R i T x P r F are extracted. The computation of the proposed pattern is based on construction of a symmetric neighborhood of 8 r members around every pixel at a distance r from it. The parameter r also determines the spatial scale of the M s N r R i T x P r T , M s N r R i T x P r I , and M s N r R i T x P r F patterns, which produces a constant dimensionality histogram at any spatial scale r with 8 r sampling points for each neutrosophic image. In our work, texture features are extracted at multiples scales to capture the multi-resolution view of the image.
  • Lastly, the final M s N r R i T x P r { T , I , F } pattern is formed by scale-wise appending of the individual patterns M s N r R i T x P r T , M s N r R i T x P r I , and M s N r R i T x P r F extracted from the T, I, and F images, respectively. In other words, the M s N r R i T x P r { T , I , F } pattern is formed by appending the patterns M s N r R i T x P 1 { T , I , F } , M s N r R i T x P 2 { T , I , F } , M s N r R i T x P 3 { T , I , F } , and so on, where each M s N r R i T x P i { T , I , F } pattern is obtained by concatenating the patterns M s N r R i T x P i T , M s N r R i T x P i I , and M s N r R i T x P i F .

2.1. Construction of Neutrosophic Images

Neutrosophic sets, developed as a generalization of fuzzy sets, extend classical binary logic to embrace uncertainty and inconsistency [41]. They capture not just whether something belongs to a set (like “true”) or not (like “false”), but also the degree of indeterminacy or in betweenness. These sets incorporate three degrees of membership: truth (T), indeterminacy (I), and falsity (F). Each element belongs to these categories with independent values ranging from 0 to 1, allowing for more nuanced representations of data than traditional sets. A neutrosophic set N S is represented in the form, N S = μ N S ( x ) , σ N S ( x ) , τ N S ( x ) , where μ N S ( x ) , σ N S ( x ) , and τ N S ( x ) represent the degree of membership function, the degree of indeterminacy, and the degree of non-membership, respectively, for each element x ( x X , where X is a non-empty fixed set) to the set N S .
Building on this domain knowledge, a neutrosophic image Z N S is characterized by T N S , I N S , and F N S membership sets [43]. A pixel P (i.e., P = Z N S ( i , j ) ) in the neutrosophic domain can be represented as P = t , i , f , which reflects that the pixel is t % true, i % indeterminate, and f % false, where t = T N S ( i , j ) , i = I N S ( i , j ) , and f = F N S ( i , j ) . Thus, a pixel Z ( i , j ) of an (original) image Z is transformed into the neutrosophic domain as Z N S ( i , j ) = T N S ( i , j ) , I N S ( i , j ) , F N S ( i , j ) , where T N S ( i , j ) , I N S ( i , j ) , and F N S ( i , j ) are the membership values belonging to the membership sets; truth, indeterminacy, and falsity, respectively. The neutrosophic transformation of the original image Z into three neutrosophic domain images T N S , I N S , and F N S is particularly well suited for medical image analysis. Medical images, like X-rays or MRIs, often hold vital information encoded in their textures. These images can be inherently ambiguous, due to factors like noise, or subtle variations in tissue density. Improper handling of this uncertainty often leads to inaccurate diagnosis or missed interpretations. Neutrosophic sets, with their ability to encode indeterminacy alongside truth and falsity, can better capture these nuances, leading to more robust analysis. The mathematical notations to derive the three neutrosophic domain images T N S , I N S , and F N S are given below:
T N S ( i , j ) = Z ¯ ( i , j ) Z ¯ min Z ¯ max Z ¯ min
Z ¯ ( i , j ) = 1 w × w m = i w / 2 i + w / 2 n = j w / 2 j + w / 2 Z ( m , n )
I N S ( i , j ) = δ ( i , j ) δ min δ max δ min
δ ( i , j ) = a b s ( Z ( i , j ) Z ¯ ( i , j ) )
F N S ( i , j ) = 1 T N S ( i , j )
where for every ( i , j ) th pixel, Z ( i , j ) represents its intensity value in the original image Z, Z ¯ ( i , j ) represents the mean intensity value in the w × w local neighborhood centered around it, and δ ( i , j ) represents the absolute of the difference between its intensity and its local mean value. Figure 1 shows the T N S , I N S , and F N S images obtained by the neutrosophic transformation of different samples of medical images.

2.2. Proposed M s N r R i T x P Pattern Descriptor

The fundamental design behind the working of the proposed approach has been drawn from the LBP operator [10]. Similar to LBP, the proposed approach captures the spatial structure of a local image texture in T N S , I N S , and F N S images by constructing a circular symmetric neighborhood centered around every pixel of the image. This allows the multi-resolution analysis of the image and enables the extraction of rotation-invariant features from them. Formally, given a pixel p c of the input image P, where P { T N S , I N S , F N S } , a circular symmetric neighborhood is constructed around it at a distance r. Now, on this circular neighborhood, corresponding to distance parameter r, 8 r neighboring pixels of p c are sampled that are evenly distributed along this circle of radius r. Assuming the center pixel, i.e., p c , to be at origin ( 0 , 0 ) , the coordinates of the neighboring pixels are given by ( r s i n ( 2 π n ) / 8 r , r c o s ( 2 π n ) / 8 r ) . The gray values of neighboring pixels which do not fall exactly at the center of pixels are estimated by interpolation. For instance, a total of 8, 16, 24, etc., neighboring pixels of p c will be sampled for circular neighborhoods at distances r = 1 , 2 , 3 , respectively, from p c . Let p r ( i , j ) represent the neighbor vector of pixel p c (located at the ( i , j ) th location in image P), mentioning its 8 r neighboring pixels.
p r ( i , j ) = [ p ( r , 0 ) ( i , j ) , , p ( r , 8 r 1 ) ( i , j ) ]
In our work, three different forms of binary patterns, i.e., M s T r P , N r T x P , and R i T x P are computed for every pixel of three neutrosophic images T N S , I N S , and F N S using their neighbor vectors p r ( i , j ) . The detailed process of computing these patterns is described in the following subsections.

2.2.1. Pattern 1: M s T r P

In the computation of this pattern, the neighbor vector p r ( i , j ) containing 8 r elements corresponding to a circular neighborhood at distance r from p c is transformed to the median quantized neighbor vector mqp r ( i , j ) by applying the median filter along the arc to restrict its count of elements to 8. In other words, irrespective of the scale of the input image (determined by the value of the r parameter), the median quantized neighbor vector mqp r ( i , j ) always consists of 8 elements. The following table (Table 1) illustrates this fact with suitable examples.
The median quantized neighbor vector mqp r ( i , j ) is defined as
mqp r ( i , j ) = [ m q p ( r , 0 ) ( i , j ) , , m q p ( r , 7 ) ( i , j ) ]
where
m q p ( r , k ) ( i , j ) = M E D I A N ( [ p ( r , r k ) ( i , j ) , , p ( r , r k + t ) ( i , j ) ] ) , k { 0 , 1 , , 7 } , t { 0 , , r 1 }
Thus, given mqp r ( i , j ) , a local binary pattern descriptor with respect to the center pixel p c is computed as follows:
T r P r ( i , j ) = n = 0 7 s ( m q p ( r , n ) ( i , j ) p c ) 2 n , s ( x ) = 1 x 0 0 x < 0
where s ( ) is the sign function. It can be easily observed that for any parameter r there will always be 2 8 = 256 T r P r patterns in total. Furthermore, the transformation of neighbor vectors from p r to mqp r makes the pattern more robust to noise, as illustrated in Figure 2 and Figure 3 with the help of a suitable example. Following the inspiration of rotation-invariant LBP in [46], the T r P r patterns are transformed to make them rotation-invariant and reduce the count of possible patterns (thereby, reducing the dimensionality) at any scale (i.e., for any value of r parameter) from 256 to 10. The transformed M s T r P r patterns are defined as follows:
M s T r P r ( i , j ) = n = 0 7 s m q p ( r , n ) ( i , j ) p c if U T r P r ( i , j ) 2 9 otherwise
where the function U ( ) reflects the use of rotation-invariant uniform patterns having at most two transitions in bit value (i.e., from 1 to 0 or from 0 to 1) along the neighbors. Thus, exactly 9 uniform binary patterns exists which will be assigned labels from { 0 , 1 , , 7 , 8 } corresponding to a cardinality of 1 in the bit pattern. All remaining non-uniform bit patterns are assigned the label { 9 } .
U T r P r ( i , j ) = | s m q p ( r , 7 ) ( i , j ) p c s m q p ( r , 0 ) ( i , j ) p c | + n = 1 7 s m q p ( r , n ) ( i , j ) p c s m q p ( r , n 1 ) ( i , j ) p c
Therefore, for three neutrosophic images T N S , I N S , and F N S , assuming a size M × N , the M s T r P r pattern is computed for every pixel { ( i , j ) | i { 1 + r , , M r } , j { 1 + r , , N r } } . Thus, T N S , I N S , and F N S are represented by the probability distribution (histogram) of the M s T r P r patterns as follows:
M s T r P r T ( η ) = i = 1 + r M r j = 1 + r N r ζ ( M s T r P r ( i , j ) ) T , η , η { 0 , 1 , , 8 , 9 }
M s T r P r I ( η ) = i = 1 + r M r j = 1 + r N r ζ ( M s T r P r ( i , j ) ) I , η , η { 0 , 1 , , 8 , 9 }
M s T r P r F ( η ) = i = 1 + r M r j = 1 + r N r ζ ( M s T r P r ( i , j ) ) F , η , η { 0 , 1 , , 8 , 9 }
where ζ is calculated by the following rule:
ζ α 1 , α 2 = 1 , if α 1 = α 2 0 , otherwise .

2.2.2. Pattern 2: N r T x P

This pattern quantizes the neighbor vector p r ( i , j ) with respect to the magnitude of local differences in gray values of the neighboring pixels with the center pixel p c , unlike the M s T r P pattern, where the quantization is performed with respect to the output of the median filter. In the N r T x P pattern, the neighbor vector p r ( i , j ) is initially transformed to the local differences neighbor vector ldp r ( i , j ) by taking the absolute value of the local differences between the center pixel p c and its neighboring pixels, as shown below:
ldp r ( i , j ) = [ l d p ( r , 0 ) ( i , j ) , , l d p ( r , 8 r 1 ) ( i , j ) ]
where
l d p r , k ( i , j ) = | p r , k ( i , j ) p c | , k { 0 , 1 , , 8 r 1 }
Now, the local differences neighbor vector ldp r ( i , j ) is quantized to obtain the mean local differences quantized neighbor vector mldqp r ( i , j ) by averaging the absolute value of the local differences along the arc to restrict its cardinality to 8. Similar to mqp r ( i , j ) , the count of elements in the mldqp r ( i , j ) neighbor vector will always be 8, irrespective of the scale of the neighborhood (or the value of parameter r). The idea behind averaging the local differences is to induce noise robustness capability in the N r T x P pattern. By averaging the local difference, the impact of noise in the local neighborhood is significantly reduced.
The mean local differences quantized neighbor vector mldqp r ( i , j ) is defined as
mldqp r ( i , j ) = [ m l d q p ( r , 0 ) ( i , j ) , , m l d q p ( r , 7 ) ( i , j ) ]
where
m l d q p ( r , k ) ( i , j ) = 1 r t = 0 r 1 l d p r , r k + t ( i , j ) , k { 0 , 1 , , 7 }
Similar to T r P r , the second local binary pattern descriptor T x P r , with respect to the center pixel p c , is computed using the mean local differences quantized neighbor vector, as shown below:
T x P r ( i , j ) = n = 0 7 s ( m l d q p ( r , n ) ( i , j ) ν r ) 2 n , s ( x ) = 1 x 0 0 x < 0
where ν r is defined as
ν r = y = j r j + r μ l d r ( ( i r ) , y ) + y = j r j + r μ l d r ( ( i + r ) , y ) + x = i r + 1 i + r 1 μ l d r ( x , ( j r ) ) + x = i r + 1 i + r 1 μ l d r ( x , ( j + r ) )
for i { 1 + r , , M r } , j { 1 + r , , N r } . Also, μ l d r is the mean local differences image, obtained as follows:
μ l d r ( i , j ) = 1 ( 8 r ) n = 0 8 r 1 l d p ( r , n ) ( i , j ) , i { 1 + r , , M r } j { 1 + r , , N r }
The T x P r patterns are then made noise-resistant using the same transformation as adopted in the case of the T r P r patterns. Thus, like the M s T r P r patterns, the dimensionality of the transformed T x P r patterns, i.e., N r T x P r , is always 10, irrespective of the scale of the neighborhood (or the value of parameter r). The N r T x P r patterns are defined as follows:
N r T x P r ( i , j ) = n = 0 7 s m l d q p ( r , n ) ( i , j ) ν r if U T x P r ( i , j ) 2 9 otherwise
Summarizing, for the neutrosophic images T N S , I N S , and F N S , the probability distribution (histogram) of the N r T x P r patterns for the three images at scale r are given as
N r T x P r T ( η ) = i = 1 + r M r j = 1 + r N r ζ ( N r T x P r ( i , j ) ) T , η , η { 0 , 1 , , 8 , 9 }
N r T x P r I ( η ) = i = 1 + r M r j = 1 + r N r ζ ( N r T x P r ( i , j ) ) I , η , η { 0 , 1 , , 8 , 9 }
N r T x P r F ( η ) = i = 1 + r M r j = 1 + r N r ζ ( N r T x P r ( i , j ) ) F , η , η { 0 , 1 , , 8 , 9 }

2.2.3. Pattern 3: R i T x P

Lastly, to construct this pattern, the center pixel p c is encoded into one of the two bins formed by thresholding its gray value against the local mean gray value ( μ r ) in the neighborhood of p c at scale r. Thus, the dimensionality of the histogram formed from the R i T x P patterns will always be 2, irrespective of the scale of the neighborhood (or the value of parameter r).
R i T x P r ( i , j ) = s ( p c μ r ) , s ( x ) = 1 x 0 0 x < 0
where μ r is defined as
μ r = y = j r j + r p r ( ( i r ) , y ) + y = j r j + r p r ( ( i + r ) , y ) + x = i r + 1 i + r 1 p r ( x , ( j r ) ) + x = i r + 1 i + r 1 p r ( x , ( j + r ) )
For neutrosophic images T N S , I N S , and F N S , the probability distribution (histogram) of the R i T x P r patterns at scale r is given as
R i T x P r T ( η ) = i = 1 + r M r j = 1 + r N r ζ ( R i T x P r ( i , j ) ) T , η , η { 0 , 1 }
R i T x P r I ( η ) = i = 1 + r M r j = 1 + r N r ζ ( R i T x P r ( i , j ) ) I , η , η { 0 , 1 }
R i T x P r F ( η ) = i = 1 + r M r j = 1 + r N r ζ ( R i T x P r ( i , j ) ) F , η , η { 0 , 1 }

2.2.4. Final Construction of M s N r R i T x P Pattern Descriptor

The final histogram of the proposed M s N r R i T x P pattern is constructed from the joint histograms of the three pattern descriptors, i.e., M s T r P , N r T x P , and R i T x P . The joint histogram of M s T r P , N r T x P , and R i T x P , i.e., M s T r P × N r T x P × R i T x P has a very high dimensionality of 200 features ( 10 × 10 × 2 ) at every scale. Accordingly, if five scales have been considered to perform multi-resolution analysis of the input image, the total number of features will accumulate to 1000 ( 5 × 200 ) , which is very high considering we have three neutrosophic images (corresponding to every input image) to work with. Therefore, in our work, instead of taking the joint histogram of all three patterns, the joint histogram of M s T r P × R i T x P is concatenated with the joint histogram of N r T x P × R i T x P , thereby reducing the dimensionality of the M s N r R i T x P pattern to 40 ( 10 × 2 + 10 × 2 ) bins at every scale. The sequence of concatenation adopted for the construction of the M s N r R i T x P pattern for the input (medical) image at a single scale (i.e., for a particular value of r) is explained below.
M s N r R i T x P r { T , I , F } = M s N r R i T x P r T M s N r R i T x P r I M s N r R i T x P r F
where C o n c a t e n a t i o n O p e r a t o r and
M s N r R i T x P r T = M s R i T x P r T N r R i T x P r T ,
M s N r R i T x P r I = M s R i T x P r I N r R i T x P r I ,
M s N r R i T x P r F = M s R i T x P r F N r R i T x P r F ,
where M s R i T x P and N r R i T x P are joint histograms defined as
M s R i T x P r T = M s T r P r T R i T x P r T , N r R i T x P r T = N r T x P r T R i T x P r T ,
M s R i T x P r I = M s T r P r I R i T x P r I , N r R i T x P r I = N r T x P r I R i T x P r I ,
M s R i T x P r F = M s T r P r F R i T x P r F , N r R i T x P r F = N r T x P r F R i T x P r F ,
The M s N r R i T x P pattern for multi-scale resolutions, i.e., for different values of r ( r = 1 , 2 , 3 , ), is constructed by concatenating the single-scale M s N r R i T x P r patterns, as described below:
M s N r R i T x P { r = 1 , 2 , , S } { T , I , F } = M s N r R i T x P 1 { T , I , F } M s N r R i T x P 2 { T , I , F } M s N r R i T x P S { T , I , F }

3. Experimental Setup

This section outlines the computational framework adopted to evaluate the effectiveness of our proposed methodology in contrast to recent and state-of-the-art retrieval techniques detailed in Table 2. To ensure fairness, all the methods were implemented in MATLAB 2020b.

3.1. Similarity Measure

The effectiveness of any CBMIR system relies extensively on the selection of a strong similarity measure to compare the feature vector of the query image with the feature vectors of database images. The extended Canberra distance [47] is a commonly used and popular similarity measure in retrieval applications. The mathematical expression for the extended Canberra distance is given by
D E C D ( t , Q ) = τ = 1 dim F Q ( τ ) F t ( τ ) F Q ( τ ) + μ Q + F t ( τ ) + μ t
where
μ Q = 1 dim τ = 1 dim F Q ( τ ) , μ t = 1 dim τ = 1 dim F t ( τ )
and F Q and F t are the feature vectors of query image Q and database image t, respectively.

3.2. Performance Measures

All of the images in the database were used as query images in our experiments. The following four performance metrics, i.e., average precision rate ( a v g P ) , average retrieval rate ( a v g R ) , F-score ( F s c o r e ) , and mean average precision ( M a v g P ) have been employed to evaluate the effectiveness of every retrieval method.
a v g P ( % ) = number of relevant images retrieved total number of images retrieved ( η )
a v g R ( % ) = number of relevant images retrieved total number of relevant images in the database
a v g P ( % ) = 100 ω i = 1 ω r D B i η
a v g R ( % ) = 100 ω i = 1 ω r D B i g D B i
F s c o r e ( % ) = 2 × a v g P × a v g R a v g P + a v g R
M a v g P ( % ) = 100 ω i = 1 ω η = 1 g D B i r D B i η
where ω denotes the image count in the database D B , and r D B i and r D B i are the number of relevant images retrieved and the number of relevant ground truth images available for the ith query image, respectively.

3.3. Dataset Description

Four test datasets were considered in our experimental framework to test the retrieval prowess of the proposed and the compared approaches. These include the Emphysema CT database [48] and the NEMA CT database for the purpose of retrieving CT images. Additionally, the OASIS MRI database [49] and the NEMA MRI database were used for the retrieval of MRI images. A summary of these datasets is given in Table 3. The intent of these datasets is to evaluate the effectiveness of the proposed and compared approaches to encode a multitude of textural information present in CT and MR images. Additionally, the experiments assess the methods’ effectiveness in representing changes in shape at both global and local scales. The Emphysema CT database and OASIS MRI database both consist of images depicting specific anatomical regions, namely, the lung and brain, respectively. Therefore, in order to achieve a high level of retrieval performance on these datasets, it is necessary for a method to possess the capability to effectively differentiate between images that may appear identical in general but actually differ significantly due to the local variations in their shapes. However, when it comes to the NEMA CT and NEMA MRI databases, which consist of images of various body parts, the method must possess superior information representation capability to effectively distinguish between images that have very distinct overall representations, particularly on a global scale. A sample image from each class of the four test datasets is shown in Figure 4.
To further substantiate the superiority of the proposed approach over the existing methods, an additional set of experiments performed under noisy conditions on these datasets were performed in this paper. The noisy images were generated by introducing zero-mean additive white Gaussian noise with standard deviation varying between [ 5 , 50 ] . For the purpose of evaluating the noise robustness capability of the proposed and the compared approaches, the noise-free images were used as database images in these experiments, while the noisy images were used as query images. Figure 5 shows a sample noisy image from each class of the four test datasets.

4. Experimental Results and Discussions

The proposed method was tested on four test databases with both noise-free and noisy images and a comparison with the existing texture classification methods mentioned in Table 2 is presented in this section. The proposed M s N r R i T x P pattern is computed at nine scales (i.e., r = { 1 , 2 , , 9 } ) for the NEMA CT, NEMA MRI, and OASIS MRI databases. However, for the Emphysema CT database, the number of scales considered in our approach is five (i.e., r = { 1 , 2 , , 5 } ). This is because the number of pixels in the Emphysema CT database images is much less (i.e., 61 × 61 ). For the sake of fairness, the parameter settings for the compared methods were kept as mentioned in their respective sources. For comparative analysis, the implementations of the compared methods available in the public domain were used wherever possible. In the case that the implementations were not available, we used our implementation of that method, developed as per our best understanding. For every query image, the retrieval results for the top 100 matches are tabulated here.

4.1. Performance Analysis on Noise-Free Images

Table 4, Table 5, Table 6 and Table 7 compares the retrieval rates on noise-free images of the four test datasets yielded by the proposed M s N r R i T x P and the compared approaches. From the tables, it is very evident that the proposed approach substantially surpassed all the compared approaches on all four test datasets using all four performance metrics. In the case of the Emphysema CT database, the proposed approach amassed average gains in retrieval rates of 12.61%, 7.25%, 9.21%, and 9.59% for a v g R , a v g P , F s c o r e , and M a v g P , respectively, over all the compared approaches. Among the compared approaches, LDGP demonstrated the worst retrieval performance of 63.64%, 35.55%, 45.61%, and 47.57%, lagging behind the proposed approach with substantial differences of 18.72%, 10.79%, 13.70%, and 16.25% in terms of a v g R , a v g P , F s c o r e , and M a v g P , respectively. On the other end, the recently proposed SPALBP approach showed excellent retrieval capability among the compared approaches, lagging behind our proposed M s N r R i T x P approach by approximately 1.00% in terms of all four performance metrics. In contrast to the Emphysema CT database that comprises CT images specifically focused on lung tissues, the NEMA CT database consists of CT images of different body parts. Due to the greater ease of distinguishing between CT images of various body parts compared to different lung tissues, the retrieval rates on the NEMA CT database were significantly higher than those on the Emphysema CT database. Table 5 clearly demonstrates that the proposed M s N r R i T x P approach surpassed all other methods, with an average increases in retrieval rates of 5.17%, 6.50%, 6.29%, and 2.83% for a v g R , a v g P , F s c o r e , and M a v g P , respectively. LBDISP demonstrated the worst retrieval performance, lagging behind the proposed approach by 27.57% ( a v g R ), 23.91% ( a v g P ), 26.02% ( F s c o r e ), and 17.15% ( M a v g P ). The multi-scale encoding of texture features enables our proposed approach to capture the underlining shape of the body organ distinctively, and therefore, it is able to effectively distinguish between shapes of different organs with pin-point accuracy.
For the OASIS MRI dataset, the task of retrieving matching images similar in structure to the query image is more intricate compared to the NEMA MRI dataset. The images in the OASIS dataset pose a significant challenge due to their subtle inter-class variations. While the images may appear to be similar on the surface, they can be differentiated very minutely based on the shape of the ventricular area of the brain. In light of this, the retrieval rates attained on the OASIS dataset were lower compared to all of the other datasets. The retrieval performance was 42.93% ( a v g R ), 44.52% ( a v g P ), 43.71% ( F s c o r e ), and 53.11% ( M a v g P ) for the proposed M s N r R i T x P approach on the OASIS dataset, in comparison to 100% ( a v g R ), 83.47% ( a v g P ), 90.99% ( F s c o r e ), and 100% ( M a v g P ) attained on the NEMA MRI dataset. The proposed approach demonstrated clear superiority over all the compared approaches, thereby achieving remarkable improvements of 11.73% and 2.08% in a v g R , 11.37% and 7.57% in a v g P , 11.56% and 5.49% in F s c o r e , and 14.60% and 0.83% in M a v g P on the OASIS and NEMA MRI datasets, respectively. Despite the inherent difficulty in distinguishing the images of the OASIS dataset, the proposed approach showcased substantial gains with respect to the NEMA MRI dataset. This highlights the remarkable discriminatory power that the proposed approach possesses by encoding the complex intricacies present in the texture and shape data. With retrieval rates 28.49% ( a v g R ), 30.43% ( a v g P ), 30.08% ( F s c o r e ), and 13.32% ( M a v g R ) lower with respect to the proposed approach, LWP yielded the lowest retrieval rates among all the compared methods. The NEMA MRI database represents merely five classes, each class being associated with a different anatomical part of the body. Thus, there is a very little room for ambiguity when it comes to classifications, as the classes are clearly separated from each other. This leads to enhanced retrieval rates on the NEMA dataset in comparison to OASIS. The query results on all the test datasets are illustrated in Figure 6.

4.2. Performance Analysis on Noisy Images

This section highlights the noise robustness of the proposed and all the compared approaches to retrieve images similar to that of a noise-degraded query image. Table 8, Table 9, Table 10 and Table 11 compare the performance of the proposed M s N r R i T x P approach with other methods on noise-induced versions of four test datasets. The proposed approach obtained retrieval rates of 81.28% ( a v g R ), 46.95% ( a v g P ), 59.52% ( F s c o r e ), and 63.62% ( M a v g P ) on noisy images from the Emphysema CT database; 64.78% ( a v g R ), 44.78% ( a v g P ), 52.95% ( F s c o r e ), and 49.27% ( M a v g P ) on noisy images from the NEMA CT database; 38.56% ( a v g R ), 37.50% ( a v g P ), 38.02% ( F s c o r e ), and 38.44% ( M a v g P ) on noisy images from the OASIS MRI database; and 69.92% ( a v g R ), 53.36% ( a v g P ), 60.53% ( F s c o r e ), and 57.95% ( M a v g P ) on noisy images from the NEMA MRI database; these are close to the 82.36% ( a v g R ), 46.34% ( a v g P ), 59.31% ( F s c o r e ), and 63.82% ( M a v g P ); 98.71% ( a v g R ), 69.11% ( a v g P ), 81.30% ( F s c o r e ), and 99.56% ( M a v g P ); 42.93% ( a v g R ), 44.52% ( a v g P ), 43.71% ( F s c o r e ), and 53.11% ( M a v g P ); and 100.00% ( a v g R ), 83.47% ( a v g P ), 90.99% ( F s c o r e ), and 100.00% ( M a v g P ) obtained on their noise-free variants, respectively. The noise-resilient characteristic demonstrated by the proposed approach allowed it to amass an average improvement in retrieval rates of 17.78% ( a v g R ), 11.38% ( a v g P ), 13.93% ( F s c o r e ), and 24.03% ( M a v g P ) on noisy images from the Emphysema CT database; 42.42% ( a v g R ), 31.81% ( a v g P ), 36.58% ( F s c o r e ), and 36.51% ( M a v g P ) on noisy images from the NEMA CT database; 12.84% ( a v g R ), 10.95% ( a v g P ), 11.90% ( F s c o r e ), and 11.69% ( M a v g P ) on noisy images from the OASIS MRI database; and 36.70% ( a v g R ), 22.74% ( a v g P ), 28.74% ( F s c o r e ), and 26.93% ( M a v g P ) on noisy images from the NEMA MRI database over all the compared approaches. The query results under noise conditions are shown in Figure 7. Figure 8 and Figure 9 present the comparative performance analysis of the proposed and the compared methods for noisy and noise-free images of all four test datasets in context with a v g P and M a v g P values, respectively. The figure clearly illustrates that all the approaches under review had a substantial decrease in their retrieval rates when tested on the four noisy databases. This decline, in comparison to noise-free images, underlines their inability to effectively retrieve images in noisy environments. The decrease in retrieval rates of the proposed approach is negligible in comparison to those of the existing approaches. The same can also be substantiated from Figure 10, which clearly depicts that the proposed approach yielded the minimum coefficient of variation ( C V ) among all the compared methods over noise-free and noisy images from all four test datasets. The formula for computing C V is given below. The lower values of C V signify that the proposed approach is highly robust to noise and its performance is least affected by the degradation. These results corroborate the effectiveness of the suggested approach in efficiently retrieving similar images, even in challenging conditions.
C V = Standard Deviation Mean
One of the greatest strengths of the proposed M s N r R i T x P approach is its robustness to image noise, which means that even in situations where the query image suffers from noise degradation, the proposed approach is still able to extract the intricate texture and shape details buried within the noise. This allows our approach to generate excellent retrieval rates that are almost on par with those obtained on noise-free images. Among all the compared methods, the proposed method exhibited minimum deviation in retrieval rates on noisy and noise-free images, altogether attaining the highest retrieval performances on all four test datasets. This robustness of the proposed approach is attributed to the use of neutrosophic images for texture and shape extraction. The indeterminacy component in neutrosophic images helps in capturing and representing uncertain regions, which can arise due to noise or artifacts in the image. By incorporating indeterminacy, neutrosophic images tend to be more robust to noise compared to other approaches. Neutrosophic images provide a comprehensive representation of texture information by including truth (representing a certain or true texture), indeterminacy (capturing uncertain or ambiguous texture regions), and falsity (indicating false or non-texture regions). This comprehensive representation allows for a nuanced understanding of the texture patterns within the image.

5. Conclusions

In this paper, a new effective and robust descriptor, i.e., M s N r R i T x P , pattern has been presented to perform content-based retrieval of medical images in an attempt towards the development of computer-assisted diagnosis systems. The key contributions of the proposed work are the design of a novel pattern descriptor based in the neutrosophic domain, where, corresponding to every medical image, three neutrosophic images, i.e., truth (T), indeterminacy (I), and falsity (F) are obtained. These images provide a comprehensive representation of texture information by including truth (representing a certain or true texture), indeterminacy (capturing uncertain or ambiguous texture regions), and falsity (indicating false or non-texture regions). This comprehensive representation allows for a nuanced understanding of the texture patterns within the image. The M s N r R i T x P pattern is composed of three different patterns, i.e., M s T r P , N r T x P , and R i T x P , which extracts noise-resistant and rotation-invariant texture and shape features at multiple scales from each of the three neutrosophic images. The histogram of the proposed M s N r R i T x P pattern is generated by scale-wise concatenation of the joint histograms of M s T r P × R i T x P and N r T x P × R i T x P . The proposed method has been tested on both noisy and noise-free CT and MRI images from four standard test datasets. The experimental results confirm the superiority of the proposed pattern as compared to the existing state-of-the-art texture classifying descriptors. The average improvement in the retrieval rates achieved by the proposed approach over the compared approaches is very significant, especially in the case of noisy images. This substantiates the noise-robustness of the proposed approach, which is primarily achieved through infusion of neutrosophic information in the construction of M s N r R i T x P .

Author Contributions

Conceptualization: A.A.; methodology: S.S. and A.A.; formal analysis and investigation: S.S.; writing—original draft preparation: S.S.; writing—review and editing: A.A.; supervision: A.A.; validation: A.A. All the authors contributed to the study. All authors have read and approved the final manuscript.

Funding

This research received no external funding.

Institutional Review Board Statement

Not applicable.

Informed Consent Statement

Not applicable.

Data Availability Statement

The data presented in this study will be made available on reasonable request to the corresponding author.

Conflicts of Interest

The authors declare no conflicts of interest.

References

  1. Webb, A. Introduction to Biomedical Imaging, 2nd ed.; Wiley-IEEE Press: Hoboken, NJ, USA, 2022. [Google Scholar]
  2. Nishikawa, R.M. Computer-aided detection and diagnosis. In Digital Mammography; Springer: Berlin/Heidelberg, Germany, 2010; pp. 85–106. [Google Scholar]
  3. Ghosh, P.; Antani, S.; Long, L.R.; Thoma, G.R. Review of medical image retrieval systems and future directions. In Proceedings of the 2011 24th International Symposium on Computer-Based Medical Systems (CBMS), Bristol, UK, 27–30 June 2011; pp. 1–6. [Google Scholar]
  4. Kumar, A.; Kim, J.; Cai, W.; Fulham, M.; Feng, D. Content-based medical image retrieval: A survey of applications to multidimensional and multimodality data. J. Digit. Imaging 2013, 26, 1025–1039. [Google Scholar] [CrossRef] [PubMed]
  5. Cai, W.; Song, Y.; Kumar, A.; Kim, J.; Feng, D.D. Content-based large-scale medical image retrieval. In Biomedical Information Technology; Academic Press: Amsterdam, The Netherlands, 2020; pp. 321–368. [Google Scholar]
  6. Rui, Y.; Huang, T.S.; Chang, S.F. Image retrieval: Current techniques, promising directions, and open issues. J. Vis. Commun. Image Represent. 1999, 10, 39–62. [Google Scholar] [CrossRef]
  7. Banuchitra, S.; Kungumaraj, K. A comprehensive survey of content based image retrieval techniques. Int. J. Eng. Comput. Sci. 2016, 5, 17577–17584. [Google Scholar] [CrossRef]
  8. Nixon, M.; Aguado, A. Feature Extraction and Image Processing for Computer Vision; Academic Press: Amsterdam, The Netherlands, 2019. [Google Scholar]
  9. Ping Tian, D. A review on image feature extraction and representation techniques. Int. J. Multimed. Ubiquitous Eng. 2013, 8, 385–396. [Google Scholar]
  10. Ojala, T.; Pietikäinen, M.; Harwood, D. A comparative study of texture measures with classification based on featured distributions. Pattern Recognit. 1996, 29, 51–59. [Google Scholar] [CrossRef]
  11. Nanni, L.; Lumini, A.; Brahnam, S. Local binary patterns variants as texture descriptors for medical image analysis. Artif. Intell. Med. 2010, 49, 117–125. [Google Scholar] [CrossRef] [PubMed]
  12. Tan, X.; Triggs, B. Enhanced local texture feature sets for face recognition under difficult lighting conditions. IEEE Trans. Image Process. 2010, 19, 1635–1650. [Google Scholar]
  13. Murala, S.; Wu, Q.J. Local ternary co-occurrence patterns: A new feature descriptor for MRI and CT image retrieval. Neurocomputing 2013, 119, 399–412. [Google Scholar] [CrossRef]
  14. Murala, S.; Wu, Q.J. Local mesh patterns versus local binary patterns: Biomedical image indexing and retrieval. IEEE J. Biomed. Health Inform. 2013, 18, 929–938. [Google Scholar] [CrossRef]
  15. Murala, S.; Wu, Q.J. MRI and CT image indexing and retrieval using local mesh peak valley edge patterns. Signal Process. Image Commun. 2014, 29, 400–409. [Google Scholar] [CrossRef]
  16. Murala, S.; Wu, Q.J. Spherical symmetric 3D local ternary patterns for natural, texture and biomedical image indexing and retrieval. Neurocomputing 2015, 149, 1502–1514. [Google Scholar] [CrossRef]
  17. Dubey, S.R.; Singh, S.K.; Singh, R.K. Local wavelet pattern: A new feature descriptor for image retrieval in medical CT databases. IEEE Trans. Image Process. 2015, 24, 5892–5903. [Google Scholar] [CrossRef] [PubMed]
  18. Dubey, S.R.; Singh, S.K.; Singh, R.K. Local diagonal extrema pattern: A new and efficient feature descriptor for CT image retrieval. IEEE Signal Process. Lett. 2015, 22, 1215–1219. [Google Scholar] [CrossRef]
  19. Dubey, S.R.; Singh, S.K.; Singh, R.K. Novel local bit-plane dissimilarity pattern for computed tomography image retrieval. Electron. Lett. 2016, 52, 1290–1292. [Google Scholar] [CrossRef]
  20. Dubey, S.R.; Singh, S.K.; Singh, R.K. Local bit-plane decoded pattern: A novel feature descriptor for biomedical image retrieval. IEEE J. Biomed. Health Inform. 2015, 20, 1139–1147. [Google Scholar] [CrossRef]
  21. Deep, G.; Kaur, L.; Gupta, S. Local mesh ternary patterns: A new descriptor for MRI and CT biomedical image indexing and retrieval. Comput. Methods Biomech. Biomed. Eng. Imaging Vis. 2018, 6, 155–169. [Google Scholar] [CrossRef]
  22. Deep, G.; Kaur, L.; Gupta, S. Directional local ternary quantized extrema pattern: A new descriptor for biomedical image indexing and retrieval. Eng. Sci. Technol. Int. J. 2016, 19, 1895–1909. [Google Scholar] [CrossRef]
  23. Deep, G.; Kaur, L.; Gupta, S. Local quantized extrema quinary pattern: A new descriptor for biomedical image indexing and retrieval. Comput. Methods Biomech. Biomed. Eng. Imaging Vis. 2018, 6, 687–703. [Google Scholar] [CrossRef]
  24. Murala, S.; Maheshwari, R.P.; Balasubramanian, R. Local tetra patterns: A new feature descriptor for content-based image retrieval. IEEE Trans. Image Process. 2012, 21, 2874–2886. [Google Scholar] [CrossRef]
  25. Chakraborty, S.; Singh, S.K.; Chakraborty, P. Local gradient hexa pattern: A descriptor for face recognition and retrieval. IEEE Trans. Circuits Syst. Video Technol. 2016, 28, 171–180. [Google Scholar] [CrossRef]
  26. Verma, M.; Raman, B. Local tri-directional patterns: A new texture feature descriptor for image retrieval. Digit. Signal Process. 2016, 51, 62–72. [Google Scholar] [CrossRef]
  27. Verma, M.; Raman, B. Local neighborhood difference pattern: A new feature descriptor for natural and texture image retrieval. Multimed. Tools Appl. 2018, 77, 11843–11866. [Google Scholar] [CrossRef]
  28. Banerjee, P.; Bhunia, A.K.; Bhattacharyya, A.; Roy, P.P.; Murala, S. Local neighborhood intensity pattern—A new texture feature descriptor for image retrieval. Expert Syst. Appl. 2018, 113, 100–115. [Google Scholar] [CrossRef]
  29. Chakraborty, S.; Singh, S.K.; Chakraborty, P. Local directional gradient pattern: A local descriptor for face recognition. Multimed. Tools Appl. 2017, 76, 1201–1216. [Google Scholar] [CrossRef]
  30. Dubey, S.R. Local directional relation pattern for unconstrained and robust face retrieval. Multimed. Tools Appl. 2019, 78, 28063–28088. [Google Scholar] [CrossRef]
  31. Roy, S.K.; Chanda, B.; Chaudhuri, B.B.; Banerjee, S.; Ghosh, D.K.; Dubey, S.R. Local directional ZigZag pattern: A rotation invariant descriptor for texture classification. Pattern Recognit. Lett. 2018, 108, 23–30. [Google Scholar] [CrossRef]
  32. Roy, S.K.; Chanda, B.; Chaudhuri, B.B.; Ghosh, D.K.; Dubey, S.R. Local jet pattern: A robust descriptor for texture classification. Multimed. Tools Appl. 2020, 79, 4783–4809. [Google Scholar] [CrossRef]
  33. Roy, S.K.; Chanda, B.; Chaudhuri, B.B.; Ghosh, D.K.; Dubey, S.R. Local morphological pattern: A scale space shape descriptor for texture classification. Digit. Signal Process. 2018, 82, 152–165. [Google Scholar] [CrossRef]
  34. Agarwal, M.; Maheshwari, R.P. Multichannel local ternary co-occurrence pattern for content-based image retrieval. Iran. J. Sci. Technol. Trans. Electr. Eng. 2020, 44, 495–504. [Google Scholar] [CrossRef]
  35. Hu, S.; Li, J.; Fan, H.; Lan, S.; Pan, Z. Scale and pattern adaptive local binary pattern for texture classification. Expert Syst. Appl. 2024, 240, 122403. [Google Scholar] [CrossRef]
  36. Qayyum, A.; Anwar, S.M.; Awais, M.; Majid, M. Medical image retrieval using deep convolutional neural network. Neurocomputing 2017, 266, 8–20. [Google Scholar] [CrossRef]
  37. Swati, Z.N.K.; Zhao, Q.; Kabir, M.; Ali, F.; Ali, Z.; Ahmed, S.; Lu, J. Content-based brain tumor retrieval for MR images using transfer learning. IEEE Access 2019, 7, 17809–17822. [Google Scholar] [CrossRef]
  38. Sudhish, D.K.; Nair, L.R.; Shailesh, S. Content-based image retrieval for medical diagnosis using fuzzy clustering and deep learning. Biomed. Signal Process. Control 2024, 88, 105620. [Google Scholar] [CrossRef]
  39. Lundervold, A.S.; Lundervold, A. An overview of deep learning in medical imaging focusing on MRI. Z. Med. Phys. 2019, 29, 102–127. [Google Scholar] [CrossRef]
  40. Anwar, S.M.; Majid, M.; Qayyum, A.; Awais, M.; Alnowami, M.; Khan, M.K. Medical image analysis using convolutional neural networks: A review. J. Med. Syst. 2018, 42, 226. [Google Scholar] [CrossRef]
  41. Broumi, S.; Bakali, A.; Bahnasse, A. Neutrosophic sets: An overview. In New Trends in Neutrosophic Theory and Applications; Pons Editions: Brussels, Belgium, 2018. [Google Scholar]
  42. El-Hefenawy, N.; Metwally, M.A.; Ahmed, Z.M.; El-Henawy, I.M. A review on the applications of neutrosophic sets. J. Comput. Theor. Nanosci. 2016, 13, 936–944. [Google Scholar] [CrossRef]
  43. Salama, A.A.; Smarandache, F.; Eisa, M. Introduction to image processing via neutrosophic techniques. Neutrosophic Sets Syst. 2014, 5, 59–64. [Google Scholar]
  44. Talouki, A.G.; Koochari, A.; Edalatpanah, S.A. Image completion based on segmentation using neutrosophic sets. Expert Syst. Appl. 2024, 238, 121769. [Google Scholar] [CrossRef]
  45. Alsattar, H.A.; Qahtan, S.; Zaidan, A.A.; Deveci, M.; Martinez, L.; Pamucar, D.; Pedrycz, W. Developing deep transfer and machine learning models of chest X-ray for diagnosing COVID-19 cases using probabilistic single-valued neutrosophic hesitant fuzzy. Expert Syst. Appl. 2024, 236, 121300. [Google Scholar] [CrossRef]
  46. Ojala, T.; Pietikainen, M.; Maenpaa, T. Multiresolution gray-scale and rotation invariant texture classification with local binary patterns. IEEE Trans. Pattern Anal. Mach. Intell. 2002, 24, 971–987. [Google Scholar] [CrossRef]
  47. Aswini, K.R.N.; Prakash, S.P.; Ravindran, G.; Jagadesh, T.; Naik, A.V. An Extended Canberra Similarity Measure Method for Content-Based Image Retrieval. In Proceedings of the 2023 International Conference on Evolutionary Algorithms and Soft Computing Techniques (EASCT), Bengaluru, India, 20–21 October 2023; pp. 1–5. [Google Scholar]
  48. Emphysema-CT Database. Available online: http://image.diku.dk/emphysema_database/ (accessed on 15 December 2023).
  49. OASIS-MRI Database. Available online: http://www.oasis-brains.org/ (accessed on 15 December 2023).
Figure 1. Neutrosophic images of input medical image when transformed into neutrosophic domain: (a) Sample noise-free and noisy medical images, (b) truth image ( T N S ), (c) indeterminacy image ( I N S ), and (d) falsity image ( F N S ).
Jimaging 10 00210 g001
Figure 2. A sample image patch (around a center pixel p c , highlighted in red) from noise-free and noisy image for illustration of noise robustness of the T r P r pattern. The figure also shows the multi-resolution view of the image patches at four scales S 1 , S 2 , S 3 , and S 4 , corresponding to r = 1 , 2 , 3 , 4 , respectively.
Jimaging 10 00210 g002
Figure 3. Example illustrating the computation of proposed T r P r pattern for center pixel p c (highlighted in RED color) at multiples scales S 1 , S 2 , S 3 , and S 4 , corresponding to r = 1 , 2 , 3 , 4 , respectively, on noise-free and noisy image patch shown in Figure 2: (a) Neighbor vectors p r at scales S 1 , S 2 , S 3 , and S 4 for noise-free image patch; (b) median quantized neighbor vectors mqp r at scales S 1 , S 2 , S 3 , and S 4 for noise-free image patch; (c) proposed T r P r binary pattern; (d) median quantized neighbor vectors mqp r at scales S 1 , S 2 , S 3 , and S 4 for noisy image patch; (e) neighbor vectors p r at scales S 1 , S 2 , S 3 , and S 4 for noisy image patch.
Jimaging 10 00210 g003
Figure 4. Sample image from each class of (a) Emphysema CT database, (b) NEMA CT database, (c) OASIS MRI database, and (d) NEMA MRI database.
Jimaging 10 00210 g004
Figure 5. Sample noisy image from each class of (a) Emphysema CT database, (b) NEMA CT database, (c) OASIS MRI database, and (d) NEMA MRI database.
Jimaging 10 00210 g005
Figure 6. Query results of the proposed method for noise-free query images on (a) Emphysema CT database, (b) NEMA CT database, (c) OASIS MRI database, and (d) NEMA MRI database.
Jimaging 10 00210 g006
Figure 7. Query results of the proposed method for noisy query image on (a) Emphysema CT database, (b) NEMA CT database, (c) OASIS MRI database, and (d) NEMA MRI database.
Jimaging 10 00210 g007
Figure 8. Proposed approach’s retrieval performance in comparison to all other methods in terms of a v g P on noisy and noise-free images of four test datasets.
Jimaging 10 00210 g008
Figure 9. Proposed approach’s retrieval performance in comparison to all other methods in terms of M a v g P on noisy and noise-free images of four test datasets.
Jimaging 10 00210 g009
Figure 10. Proposed approach’s retrieval performance in comparison to all other methods in terms of C V (coefficient of variation) on noisy and noise-free images of four test datasets.
Jimaging 10 00210 g010
Table 1. An illustration describing the count of elements in neighbor vector and median quantized neighbor vector at different scales.
Scale r | p r ( i , j ) | | mqp r ( i , j ) |
1188
22168    (Pair-wise median filtering)
33248    (Triplet-wise median filtering)
44328    (Quadruplet-wise median filtering)
55408    (Quintuplet-wise median filtering)
66488    (Sextuplet-wise median filtering)
77568    (Septuplet-wise median filtering)
88648    (Octuplet-wise median filtering)
99728    (Nonuplet-wise median filtering)
Table 2. Names and abbreviations of all the compared methods.
S. No.AbbreviationMethod Name
1LBPLocal Binary Pattern
2LTPLocal Ternary Pattern
3LQPLocal Quinary Pattern
4LTrPLocal Tetra Pattern
5LTCoPLocal Ternary Co-Occurrence Pattern
6LMePLocal Mesh Pattern
7LMePVEPLocal Mesh Peak Valley Edge Pattern
8LDEPLocal Diagonal Extrema Pattern
9LWPLocal Wavelet Pattern
10LQEPLocal Quantized Extrema Pattern
11SS-3D-LTPSpherical Symmetric 3D Local Ternary Pattern
12LBDPLocal Bit-Plane Decoded Pattern
13LBDISPLocal Bit-Plane Dissimilarity Pattern
14DLTerQEPDirectional Local Ternary Quantized Extrema Pattern
15LTDPLocal Tri-Directional Pattern
16LGHPLocal Gradient Hexa Pattern
17LDGPLocal Directional Gradient Pattern
18LQEQPLocal Quantized Extrema Quinary Pattern
19LMeTPLocal Mesh Ternary Patterns
20LNIPLocal Neighborhood Intensity Pattern
21LNDPLocal Neighborhood Difference Pattern
22LDZZPLocal Directional ZigZag Pattern
23LMPLocal Morphological Pattern
24LJPLocal Jet Pattern
25LDRPLocal Directional Relation Pattern
26SPALBPScale and Pattern Adaptive Local Binary Pattern
Table 3. Summary of datasets used in the experimental setup.
CT Image DatasetsMR Image Datasets
Emphysema CTNEMA CTOASIS MRINEMA MRI
No. of Images168600416372
Image Size61 × 61512 × 512208 × 208256 × 256
No. of Classes31045
Images per Class59, 50, 5954, 70, 66, 50, 15125, 104, 91, 9672, 100, 76, 59, 65
60, 52, 104, 60, 69
Table 4. Table representing the proposed approach’s retrieval performance in comparison to all other methods on Emphysema CT database. The values are expressed as percentages (%).
Performance MeasuresImprovement
avgRavgP F score MavgP(Proposed–Compared)
Proposed82.3646.3459.3163.82avgRavgP F score MavgP
SPALBP80.7145.4158.1262.541.650.931.191.28
LJP79.8944.9557.5361.912.471.391.781.91
LDRP79.0644.4956.9461.273.301.852.372.55
LBDISP77.6943.4855.7562.204.672.863.561.62
LMP76.1442.6154.6460.966.223.734.672.86
LZZP75.3642.1854.0860.337.004.165.233.49
LWP74.4641.3553.1757.087.904.996.146.74
LGHP72.9740.5252.1155.949.395.827.207.88
LTCoP70.0839.1550.2457.3912.287.199.076.43
DLTerQEP69.6439.6350.5150.7212.726.718.8013.10
LBDP68.6938.0448.9756.4113.678.3010.347.41
LQEQP68.6738.9849.7351.4413.697.369.5812.38
LQEP68.0038.3249.0248.9114.368.0210.2914.91
LTP66.9937.5348.1153.2015.378.8111.2010.62
LBP66.9837.5348.1152.4115.388.8111.2011.41
LMeP66.6837.2747.8153.7215.689.0711.5010.10
SS-3D-LTP66.1236.9847.4355.6116.249.3611.888.21
LMeTP65.8236.8347.2352.4116.549.5112.0811.41
LTrP65.6136.8647.2050.9516.759.4812.1112.87
LMePVEP65.4536.7047.0350.9616.919.6412.2812.86
LDEP65.3436.5646.8949.6117.029.7812.4214.21
LQP65.2136.5146.8151.4717.159.8312.5012.35
LNDP65.1036.5246.8048.8617.269.8212.5114.96
LTDP64.6236.1646.3748.0217.7410.1812.9415.80
LNIP64.6136.2046.4047.9917.7510.1412.9115.83
LDGP63.6435.5545.6147.5718.7210.7913.7016.25
Average Improvement12.617.259.219.59
Table 5. Table representing the proposed approach’s retrieval performance in comparison to all other methods on the NEMA CT database. The values are expressed as percentages (%).
Performance MeasuresImprovement
avgRavgP F score MavgP(Proposed–Compared)
Proposed98.7169.1181.3099.56avgRavgP F score MavgP
SPALBP97.7266.3579.0399.060.992.762.270.50
DLTerQEP96.4564.9277.6199.002.264.193.690.56
LQEP96.4364.7077.4498.962.284.413.860.60
LNDP96.4264.6277.3898.072.294.493.921.49
LMeTP96.3664.9877.6298.552.354.133.681.01
LMP96.2664.9277.5498.452.454.193.761.11
LZZP96.1764.8577.4698.352.544.263.841.21
LJP96.0764.7977.3998.252.644.323.911.31
LMeP96.1964.6477.3298.122.524.473.981.44
LTDP96.1864.5077.2198.502.534.614.091.06
LTP95.9964.5277.1798.832.724.594.130.73
SS-3D-LTP95.9264.6277.2298.432.794.494.081.13
LTrP95.9264.2676.9697.922.794.854.341.64
LQEQP95.8364.6577.2198.562.884.464.091.00
LDRP95.7164.1176.7897.463.005.004.512.10
LGHP95.6264.0476.7197.373.095.074.592.19
LDGP95.5263.9876.6397.273.195.134.672.29
LTCoP95.4763.5576.3198.363.245.564.991.20
LNIP95.4563.9376.5797.683.265.184.731.88
LQP95.2764.0076.5698.483.445.114.741.08
LDEP95.0263.7276.2897.233.695.395.022.33
LBP94.1962.2574.9697.854.526.866.341.71
LMePVEP93.5162.9175.2297.435.206.206.082.13
LWP80.3752.7663.7089.8918.3416.3517.609.67
LBDP76.9150.0660.6484.4521.8019.0520.6615.11
LBDISP71.1445.2055.2882.4127.5723.9126.0217.15
Average Improvement5.176.506.292.83
Table 6. Table representing the proposed approach’s retrieval performance in comparison to all other methods on OASIS MRI database. The values are expressed as percentages (%).
Performance MeasuresImprovement
avgRavgP F score MavgP(Proposed–Compared)
Proposed42.9344.5243.7153.11avgRavgP F score MavgP
SPALBP40.7842.2941.5350.452.152.232.192.66
LBDISP37.8940.3539.0845.815.044.174.637.30
LMP36.7539.1437.9144.446.185.385.808.67
LZZP35.6537.9736.7743.107.286.556.9410.01
LJP34.5836.8335.6741.818.357.698.0411.30
LTCoP33.3035.5134.3740.739.639.019.3412.38
LQP32.6934.7833.7040.2610.249.7410.0112.85
SS-3D-LTP31.8433.8432.8139.5811.0910.6810.9013.53
LBDP31.1832.8732.0142.4011.7511.6511.7010.71
LTDP30.9933.1232.0238.1711.9411.4011.6914.94
LNIP30.8833.0031.9038.2912.0511.5211.8114.82
LTP30.7632.7931.7438.2012.1711.7311.9714.91
LNDP30.7532.7531.7238.3012.1811.7711.9914.81
LBP30.2932.2631.2537.1312.6412.2612.4615.98
LMeP30.2632.2931.2437.8412.6712.2312.4715.27
LQEQP29.9431.7430.8236.3712.9912.7812.8916.74
LMeTP29.4631.3730.3937.3213.4713.1513.3215.79
DLTerQEP29.4331.1530.2735.8713.5013.3713.4417.24
LDRP29.1330.9330.0036.7713.8013.5913.7116.34
LTrP29.0430.8429.9236.6613.8913.6813.7916.45
LMePVEP28.3330.1929.2335.4914.6014.3314.4817.62
LGHP28.1129.9529.0034.6114.8214.5714.7118.50
LDGP28.0829.9228.9733.6014.8514.6014.7419.51
LDEP27.8429.5128.6533.3915.0915.0115.0619.72
LQEP27.6129.3828.4733.1315.3215.1415.2419.98
LWP25.6527.1226.3631.6617.2817.4017.3521.45
Average Improvement11.7311.3711.5614.60
Table 7. Table representing the proposed approach’s retrieval performance in comparison to all other methods on NEMA MRI database. The values are expressed as percentages (%).
Performance MeasuresImprovement
avgRavgP F score MavgP(Proposed–Compared)
Proposed100.0083.4790.99100.00avgRavgP F score MavgP
SPALBP100.0081.8089.99100.000.001.671.000.00
LJP100.0080.9889.49100.000.002.491.500.00
LZZP100.0080.1789.00100.000.003.301.990.00
LMP100.0079.3788.50100.000.004.102.490.00
LDRP100.0078.5888.00100.000.004.892.990.00
LGHP100.0077.7987.51100.000.005.683.480.00
LBP100.0077.0687.04100.000.006.413.950.00
LTP100.0077.0687.04100.000.006.413.950.00
LTrP100.0077.0687.04100.000.006.413.950.00
LTCoP100.0077.0687.04100.000.006.413.950.00
LMeP100.0077.0687.04100.000.006.413.950.00
LMePVEP100.0077.0687.04100.000.006.413.950.00
LNIP100.0077.0687.04100.000.006.413.950.00
LTDP100.0077.0687.04100.000.006.413.950.00
LNDP100.0077.0687.04100.000.006.413.950.00
LDGP100.0077.0687.04100.000.006.413.950.00
LQEP100.0077.0687.04100.000.006.413.950.00
DLTerQEP100.0077.0687.04100.000.006.413.950.00
LBDISP99.9977.0587.0399.990.016.423.960.01
LQEQP98.8376.0685.9699.861.177.415.030.14
LMeTP98.8076.0685.9599.771.207.415.040.23
LQP98.7975.9585.8899.801.217.525.110.20
LDEP97.9074.9684.9199.632.108.516.080.37
SS-3D-LTP96.2273.5183.3498.873.789.967.651.13
LBDP83.8063.3672.1693.9316.2020.1118.836.07
LWP71.5153.0460.9186.6828.4930.4330.0813.32
Average Improvement2.087.575.490.83
Table 8. Table representing the proposed approach’s retrieval performance in comparison to all other methods on noisy images of Emphysema CT database. The values are expressed as percentages (%).
Performance MeasuresImprovement
avgRavgP F score MavgP(Proposed–Compared)
Proposed81.2846.9559.5263.72avgRavgP F score MavgP
LWP78.2643.6356.0357.063.023.323.496.66
SPALBP76.6942.7654.9155.924.594.194.617.80
LJP75.1641.9053.8154.806.125.055.718.92
LBDP71.4139.6450.9852.419.877.318.5411.31
DLTerQEP64.8537.0247.1341.4216.439.9312.3922.30
LBDISP64.8636.4746.6940.5516.4210.4812.8323.17
LQEQP64.0836.0546.1439.7117.2010.9013.3824.01
LQEP63.1535.6445.5639.3218.1311.3113.9524.40
LTCoP62.5135.0244.8940.2718.7711.9314.6323.45
LDRP62.3234.9144.7640.1518.9612.0414.7623.57
LZZP62.1434.8144.6240.0319.1412.1414.9023.69
LDEP61.2234.6844.2835.6020.0612.2715.2428.12
LBP60.5134.0843.6036.5520.7712.8715.9227.17
LTP60.7234.0643.6437.2420.5612.8915.8826.48
LMeP60.3533.9443.4537.4320.9313.0116.0726.29
LMePVEP60.5033.9343.4835.5220.7813.0216.0428.20
LTrP60.3033.9243.4235.8620.9813.0316.1027.86
SS-3D-LTP60.9033.9043.5636.4820.3813.0515.9627.24
LNIP60.4233.8443.3835.2220.8613.1116.1428.50
LMeTP60.9033.8443.5134.3320.3813.1116.0129.39
LMP60.6033.6743.2934.1620.6813.2816.2329.56
LNDP59.9633.6143.0734.9521.3213.3416.4428.77
LQP60.2233.4443.0034.0821.0613.5116.5229.64
LGHP59.9233.4342.9233.9121.3613.5216.6029.81
LDGP59.6733.4342.8534.5721.6113.5216.6729.15
LTDP59.3833.0742.4834.3621.9013.8817.0429.36
Average Improvement17.7811.3813.9324.03
Table 9. Table representing the proposed approach’s retrieval performance in comparison to all other methods on noisy images of NEMA CT database. The values are expressed as percentages (%).
Performance MeasuresImprovement
avgRavgP F score MavgP(Proposed–Compared)
Proposed64.7844.7852.9549.27avgRavgP F score MavgP
SPALBP58.8940.7148.1444.795.894.074.814.48
LBDP47.1132.5738.5135.8317.6712.2114.4413.44
LWP46.5131.0337.2331.0018.2713.7515.7218.27
LJP42.8622.7529.7221.8521.9122.0423.2327.42
LDRP28.5815.1719.8114.5736.2029.6233.1434.70
LBDISP19.0510.1113.219.7145.7334.6739.7439.56
LQP18.459.7312.748.8346.3335.0540.2140.44
LDEP18.3910.2713.189.4846.3934.5139.7739.79
LMP17.479.7612.529.0147.3135.0340.4340.26
LDGP17.289.0511.888.9947.5035.7341.0740.28
LTrP17.039.1611.919.0347.7535.6241.0440.24
LMePVEP16.819.1811.878.6947.9735.6041.0840.58
LTP16.809.1811.878.8747.9835.6041.0840.40
LZZP16.809.1811.878.8747.9835.6041.0840.40
LTCoP16.779.1411.838.7248.0135.6441.1240.55
SS-3D-LTP16.759.2411.918.7748.0335.5441.0440.50
DLTerQEP16.689.1011.778.6648.1035.6841.1840.61
LMeTP16.679.1811.848.6148.1135.6041.1140.66
LQEQP16.679.1811.848.6848.1135.6041.1140.59
LGHP16.679.1811.848.6848.1135.6041.1140.59
LMeP16.668.9111.617.6748.1235.8741.3441.60
LTDP16.598.9711.648.7048.1935.8141.3140.57
LBP16.598.7911.499.2248.1935.9941.4640.05
LQEP16.558.9311.608.5248.2335.8541.3540.75
LNDP16.4210.0912.507.8848.3634.6940.4541.39
LNIP16.248.6711.318.0148.5436.1141.6441.26
Average Improvement42.4231.8136.5836.51
Table 10. Table representing the proposed approach’s retrieval performance in comparison to all other methods on noisy images of OASIS MRI database. The values are expressed as percentages (%).
Performance MeasuresImprovement
avgRavgP F score MavgP(Proposed–Compared)
Proposed38.5637.5038.0238.44avgRavgP F score MavgP
SPALBP35.0634.0934.5634.943.513.413.463.49
LJT33.3932.4632.9233.285.175.035.105.16
LMP31.8030.9231.3531.696.766.586.676.74
LZZP30.2829.4529.8630.198.288.058.168.25
LDRP28.8428.0428.4428.759.729.459.589.69
LGHP27.4726.7127.0827.3811.0910.7910.9411.06
LBDP24.9724.2824.6224.8913.5913.2213.4013.55
LWP24.4725.5625.0025.7614.0911.9413.0212.68
LBDISP24.3124.7224.5124.7514.2512.7813.5113.69
SS-3D-LTP24.1725.5424.8425.5514.3911.9613.1812.89
LTP24.1525.6024.8525.4014.4111.9013.1713.04
LDGP24.1126.6025.3026.3514.4510.9012.7212.09
LMePVEP24.0725.5524.7925.7014.4911.9513.2312.74
LTDP24.0626.0625.0226.0814.5011.4413.0012.36
LQEP24.0525.5524.7825.4314.5111.9513.2413.01
LTrP24.0425.8424.9125.9114.5211.6613.1112.53
LDEP24.0323.8923.9624.0214.5313.6114.0614.42
LQP24.0224.6724.3424.8014.5412.8313.6813.64
LNIP24.0126.5525.2126.4714.5510.9512.8111.97
LBP24.0125.5924.7825.4914.5511.9113.2412.95
LMeTP24.0025.7724.8525.8114.5611.7313.1712.63
LMeP23.9525.7024.8025.6214.6111.8013.2212.82
DLTerQEP23.9525.5024.7025.4114.6112.0013.3213.03
LQEQP23.9525.3224.6225.2414.6112.1813.4013.20
LTCoP23.9025.2724.5725.3714.6612.2313.4513.07
LNDP23.7824.9924.3725.0714.7812.5113.6513.37
Average Improvement12.8410.9511.9011.69
Table 11. Table representing the proposed approach’s retrieval performance in comparison to all other methods on noisy images of NEMA MRI database. The values are expressed as percentages (%).
Performance MeasuresImprovement
avgRavgP F score MavgP(Proposed–Compared)
Proposed69.9253.3660.5357.95avgRavgP F score MavgP
SPALBP63.5748.5155.0352.686.364.855.505.27
LBDP60.5446.2052.4050.179.387.168.137.78
LJP55.6144.8049.6250.4514.328.5710.917.50
LWP46.3437.3341.3542.0423.5816.0319.1815.91
LBDISP34.9129.9832.2630.0535.0123.3828.2727.90
LMP33.7332.5933.1533.2436.1920.7827.3824.71
LDRP30.6629.6230.1330.2239.2623.7430.4027.73
LTCoP30.3629.3329.8429.9239.5624.0330.6928.03
LZZP30.4929.2629.8727.4539.4324.1030.6630.50
LGHP30.1928.9729.5727.1839.7324.3930.9630.77
LQEQP30.0428.8329.4227.0439.8824.5331.1130.91
LNDP29.9027.9228.8828.1440.0225.4431.6529.81
LDEP29.8428.9629.3927.0840.0824.4031.1430.87
SS-3D-LTP29.5628.2828.9128.0640.3625.0831.6229.89
LMeTP29.4528.6929.0626.9040.4724.6731.4731.05
LQP28.3627.0527.6926.6341.5626.3132.8431.32
LMeP27.3727.2027.2926.9242.5526.1633.2431.03
DLTerQEP27.3327.2027.2626.9242.5926.1633.2731.03
LBP27.2827.1427.2127.1442.6426.2233.3230.81
LDGP26.9626.9426.9526.9542.9626.4233.5831.00
LMePVEP26.9026.8926.9026.8843.0226.4733.6331.07
LTP26.8926.8926.8926.8843.0326.4733.6431.07
LNIP26.8926.8826.8826.8843.0326.4833.6531.07
LTDP26.8926.8826.8926.8843.0326.4833.6431.07
LTrP26.8826.8826.8826.8843.0426.4833.6531.07
LQEP26.8826.8826.8826.8843.0426.4833.6531.07
Average Improvement36.7022.7428.7426.93
Disclaimer/Publisher’s Note: The statements, opinions and data contained in all publications are solely those of the individual author(s) and contributor(s) and not of MDPI and/or the editor(s). MDPI and/or the editor(s) disclaim responsibility for any injury to people or property resulting from any ideas, methods, instructions or products referred to in the content.

