
Influence of Environmental Parameters on the Abundance of Tub Gurnard, Chelidonichthys lucerna, in the Eastern Sea of Marmara


Abstract
:1. Introduction
2. Materials and Methods
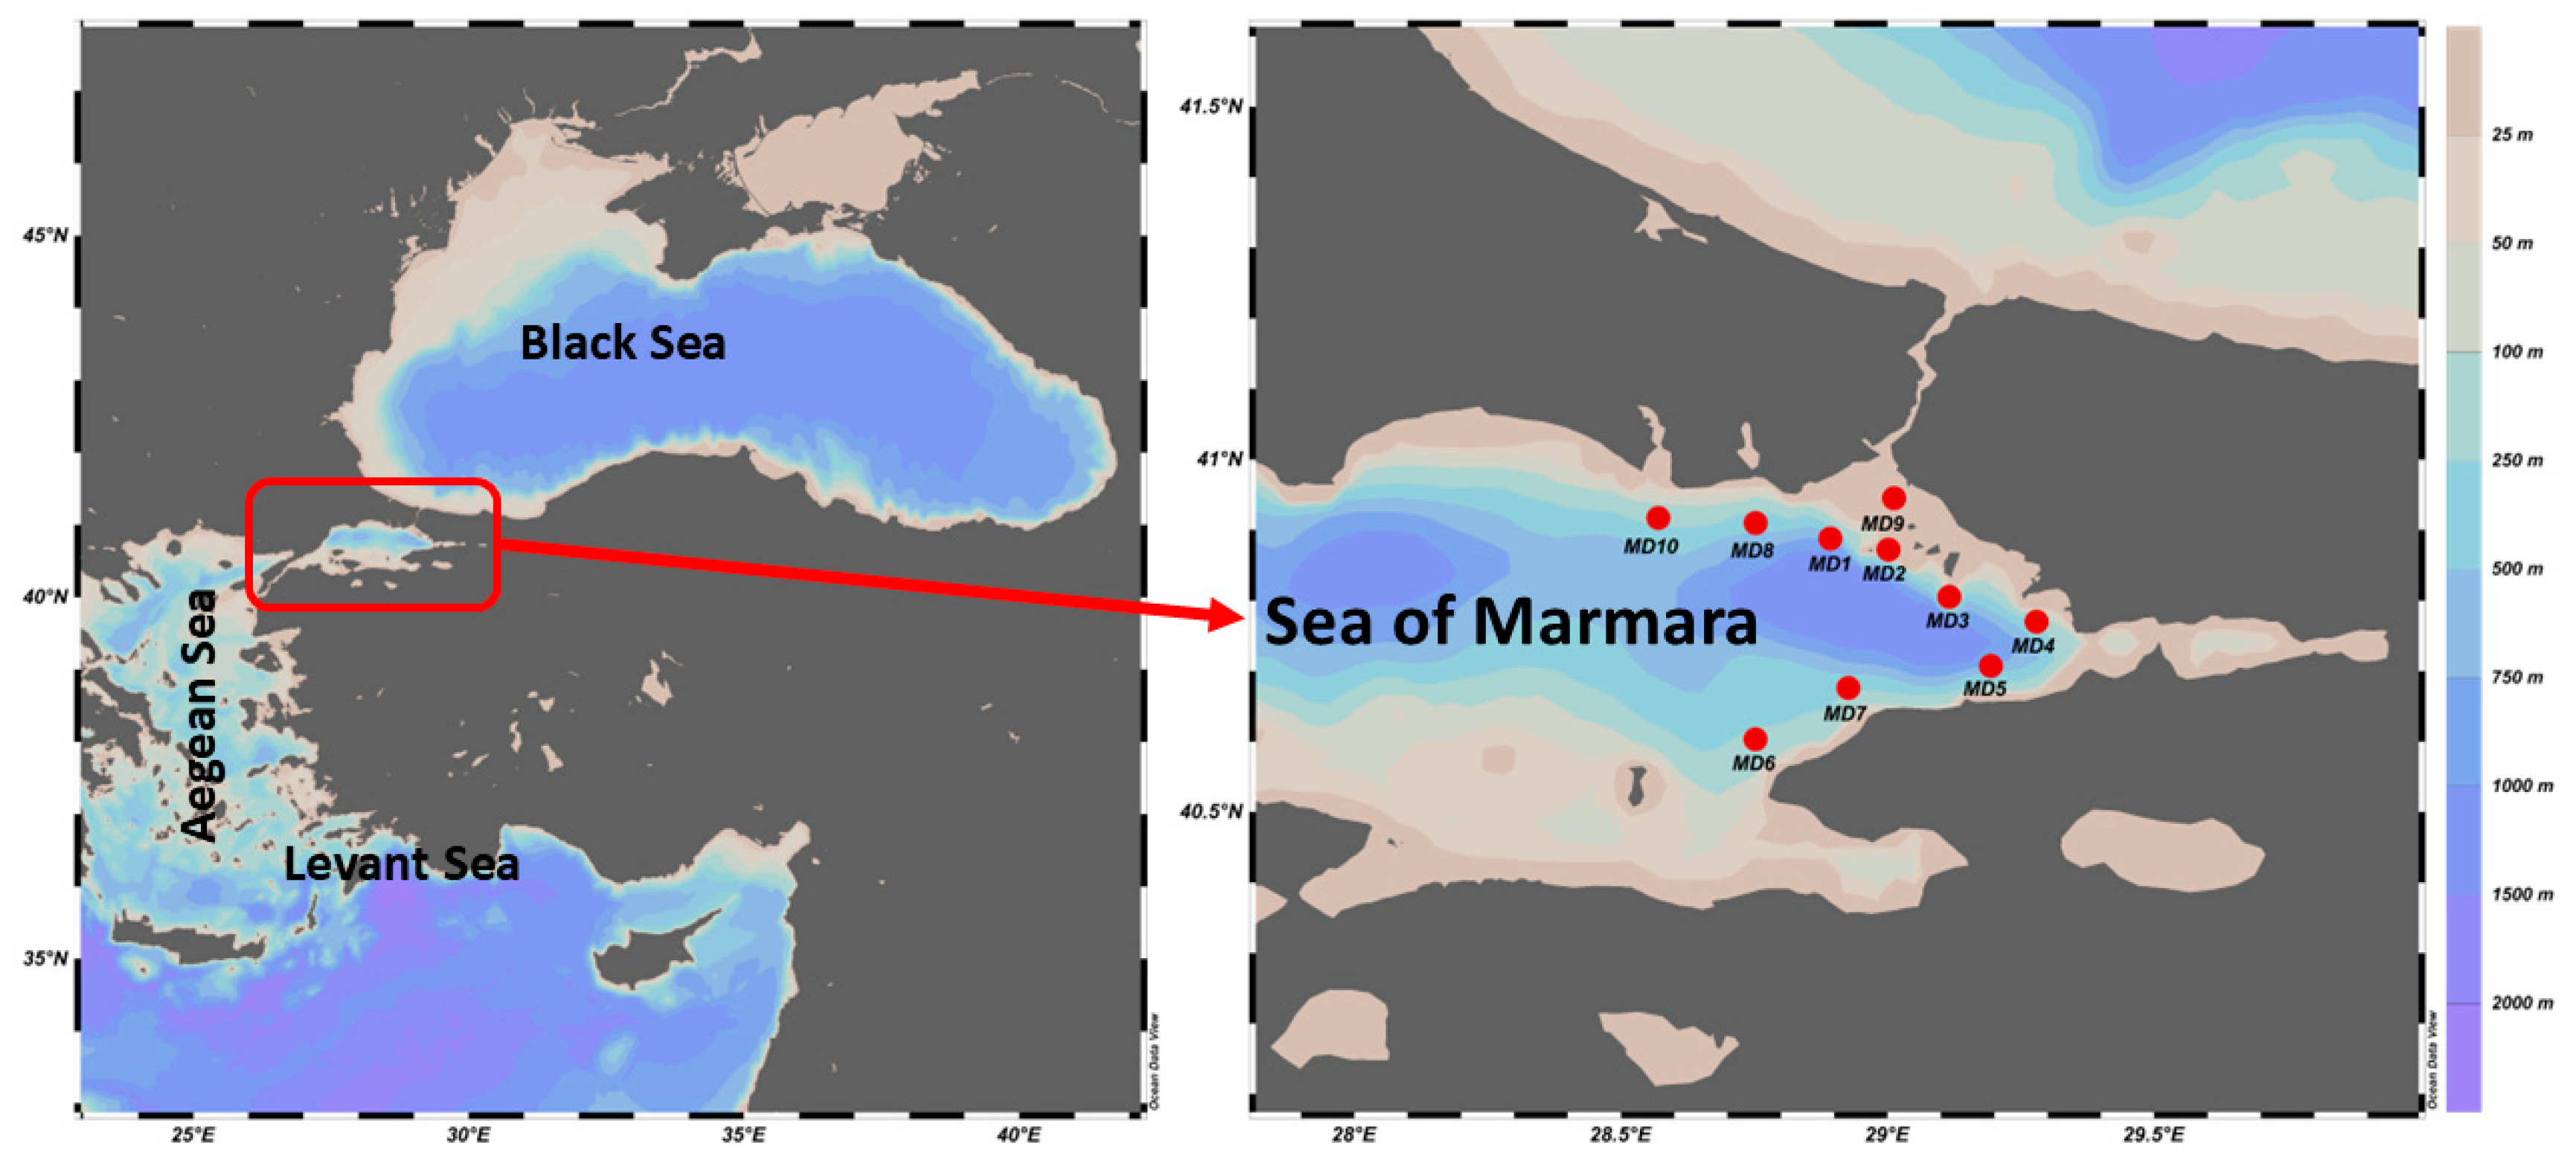
2.1. Study Area
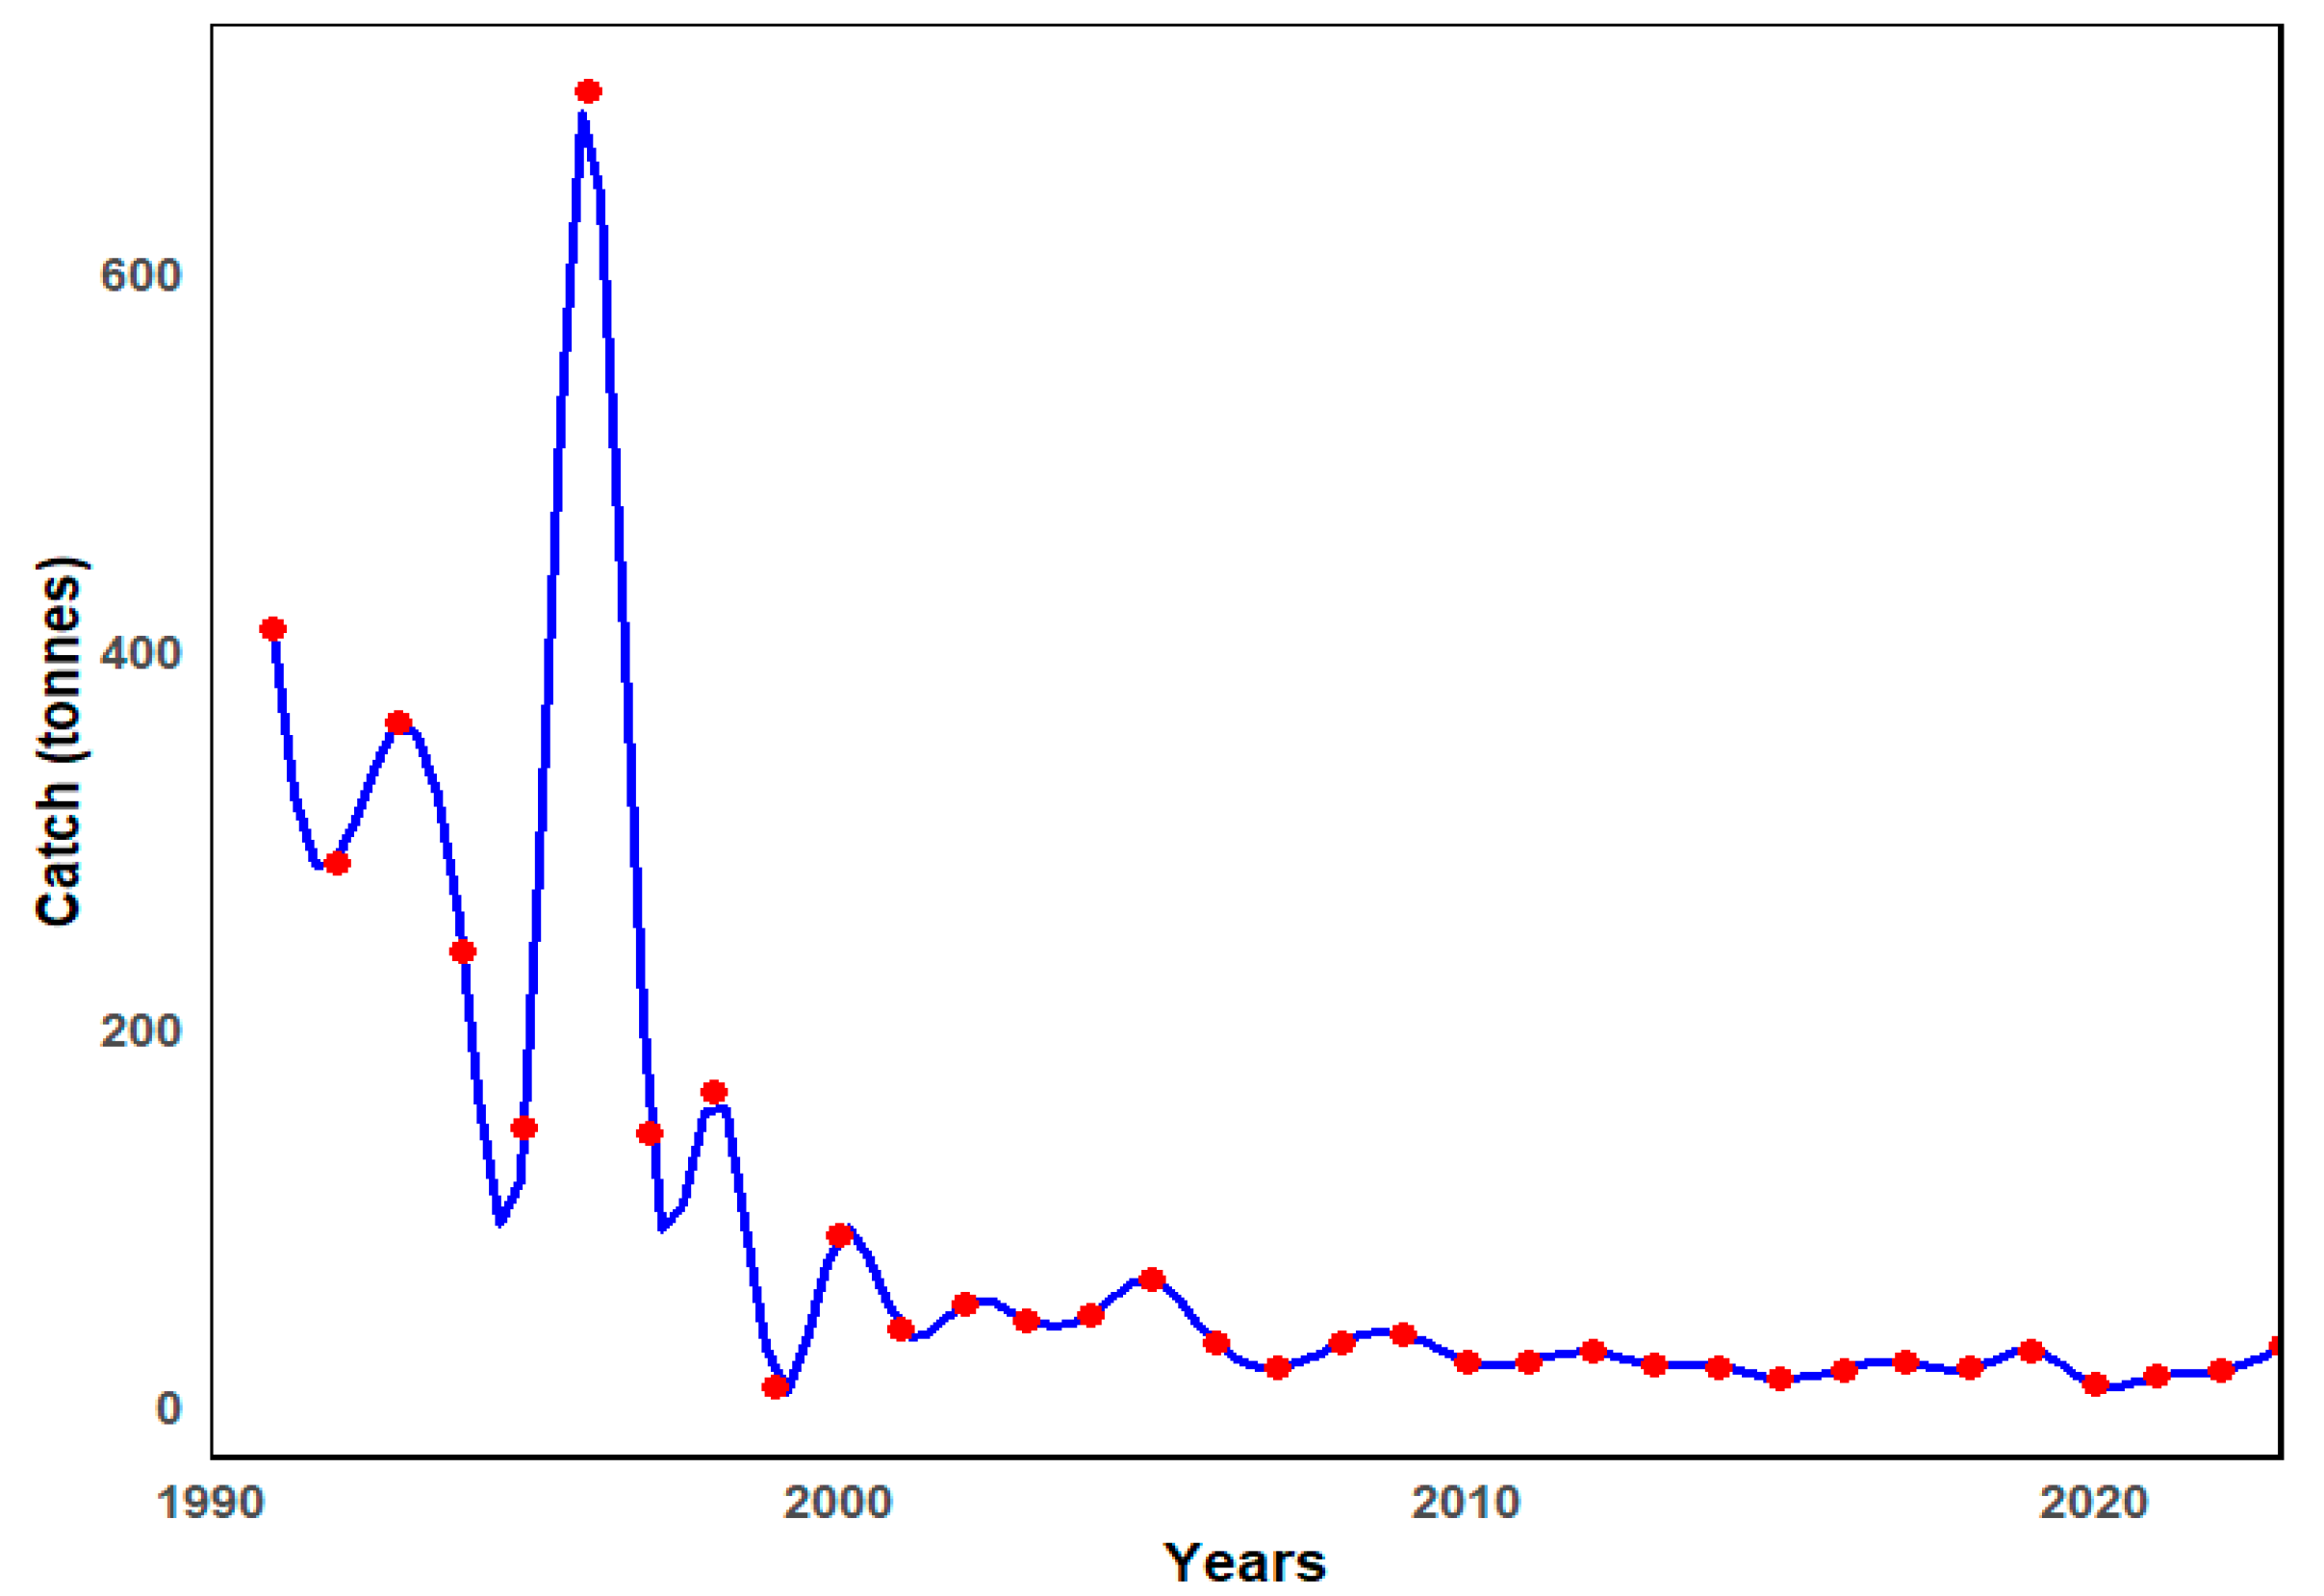
2.2. Characterization of Tub Gurnard Fishery in the SoM
2.3. Data Collection
2.4. Data Evaluation
3. Results
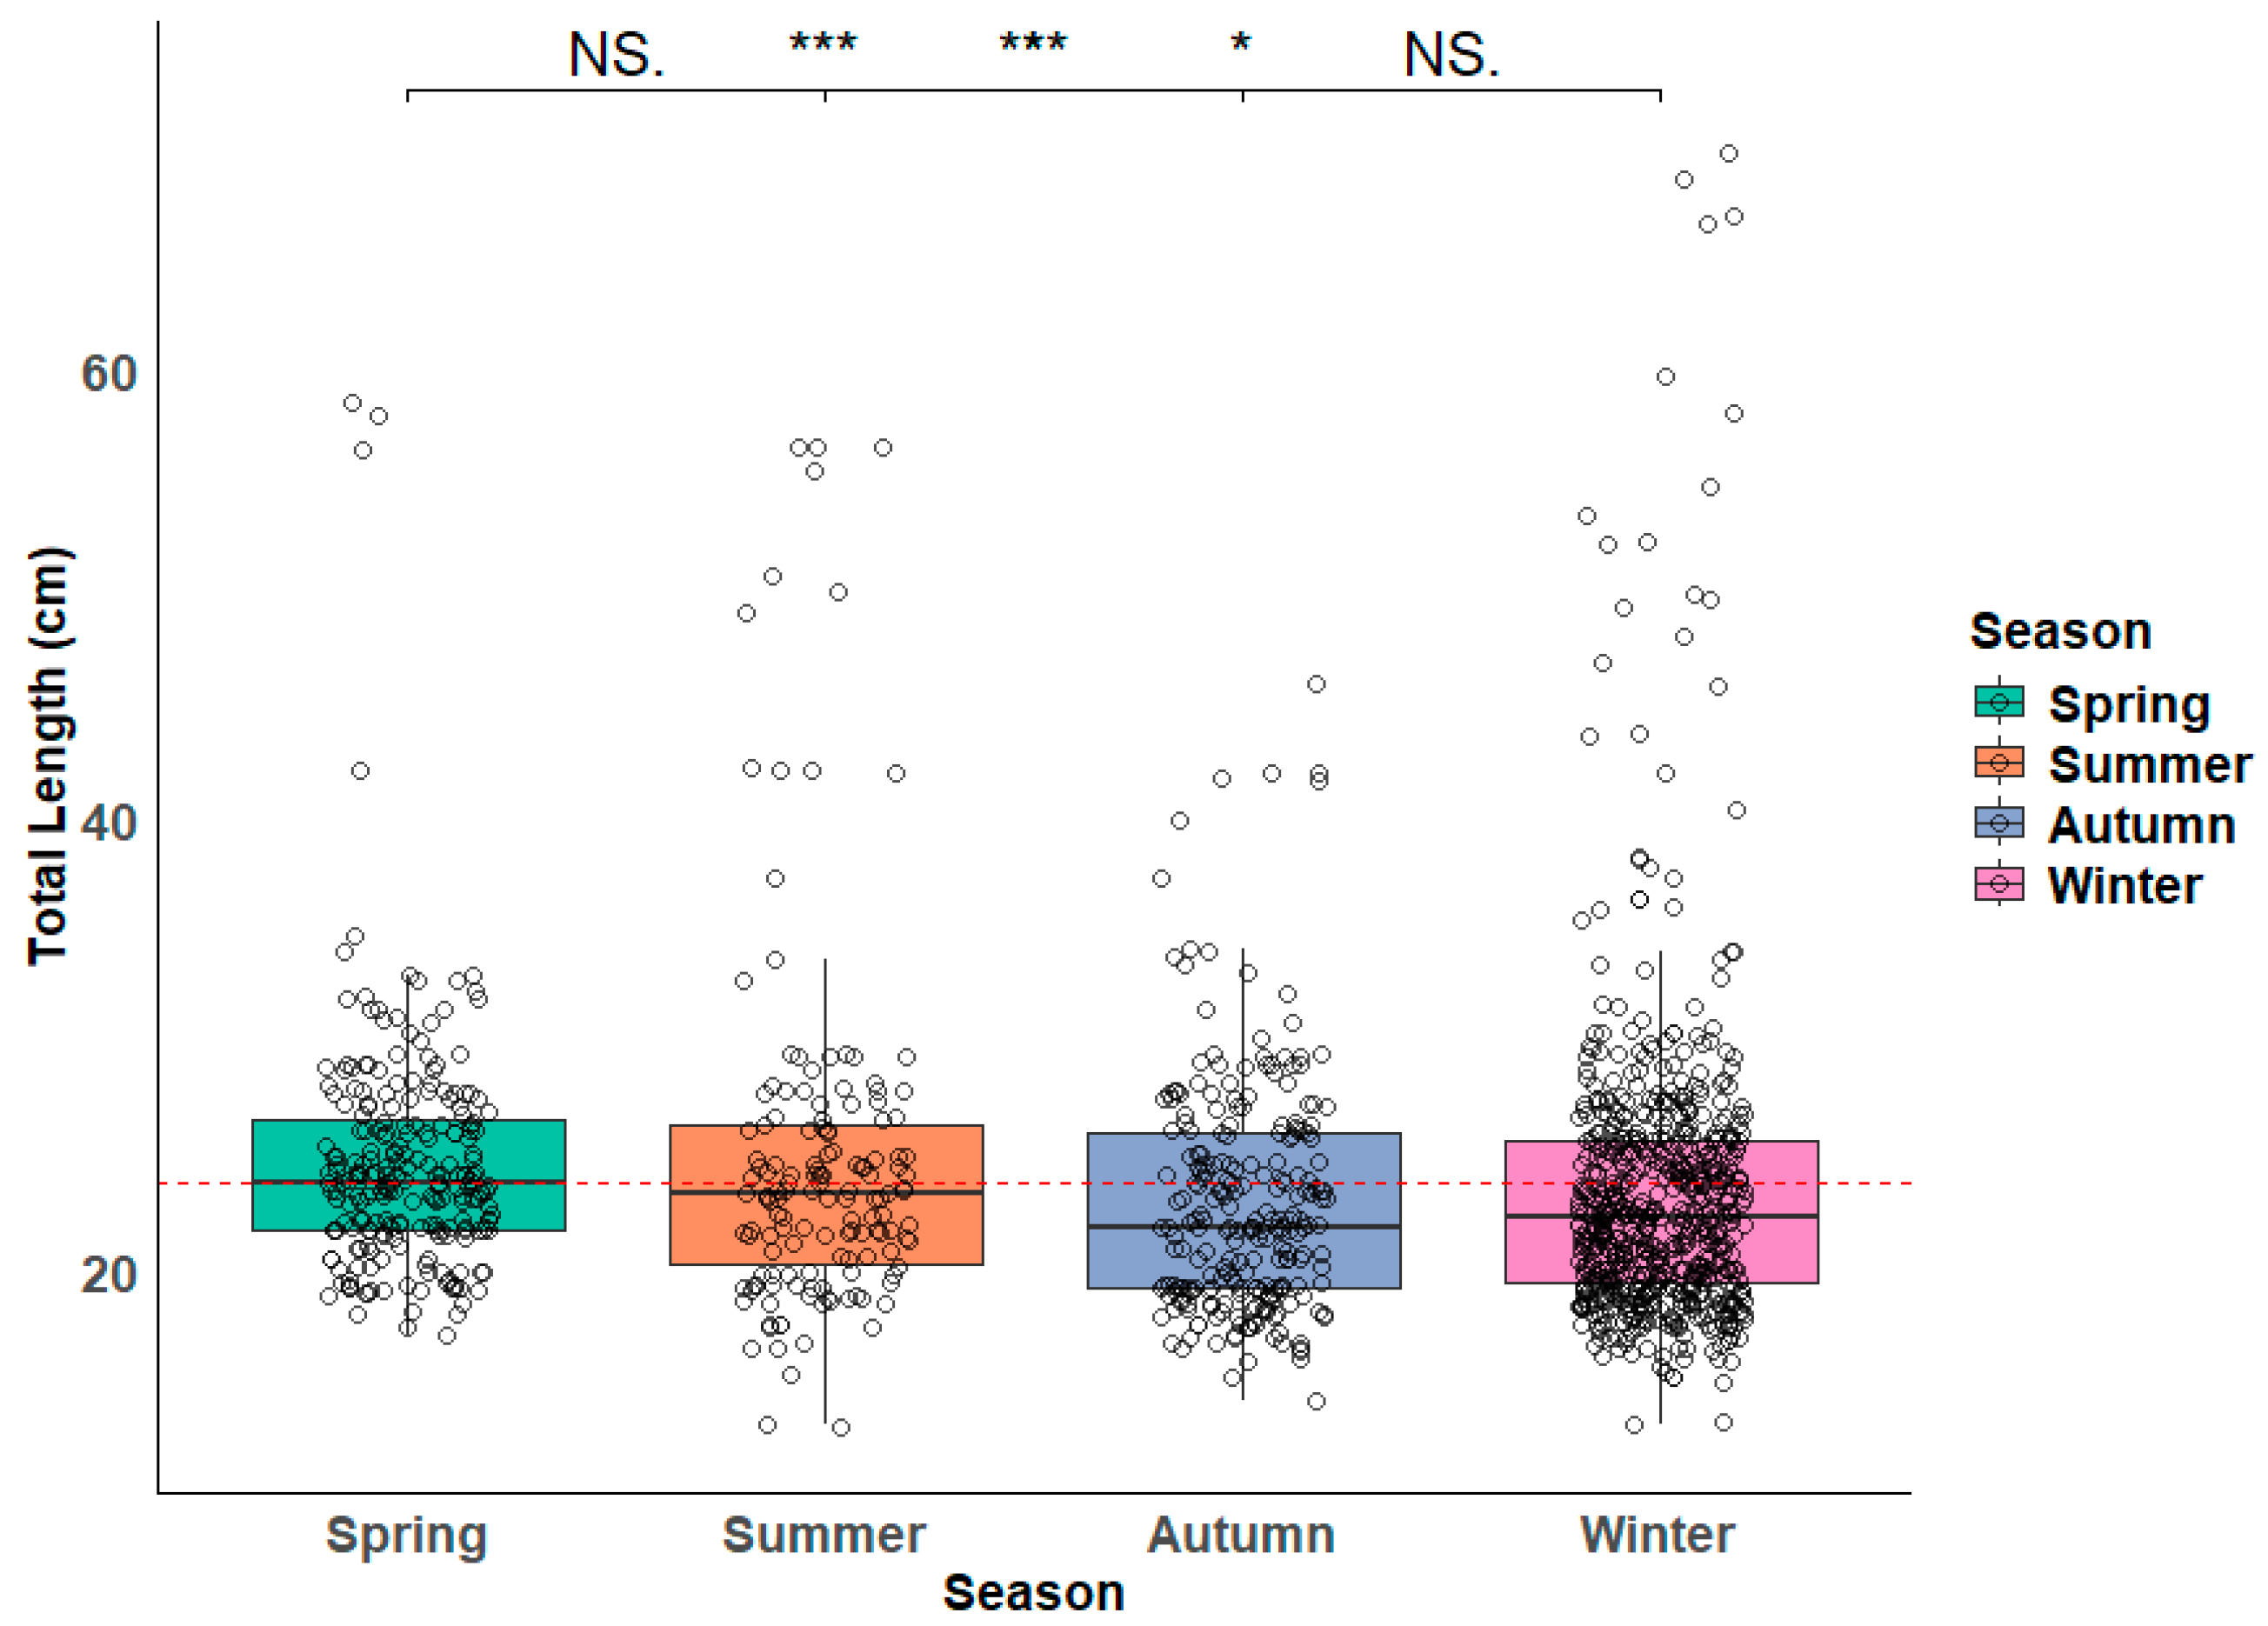
3.1. Size Analysis
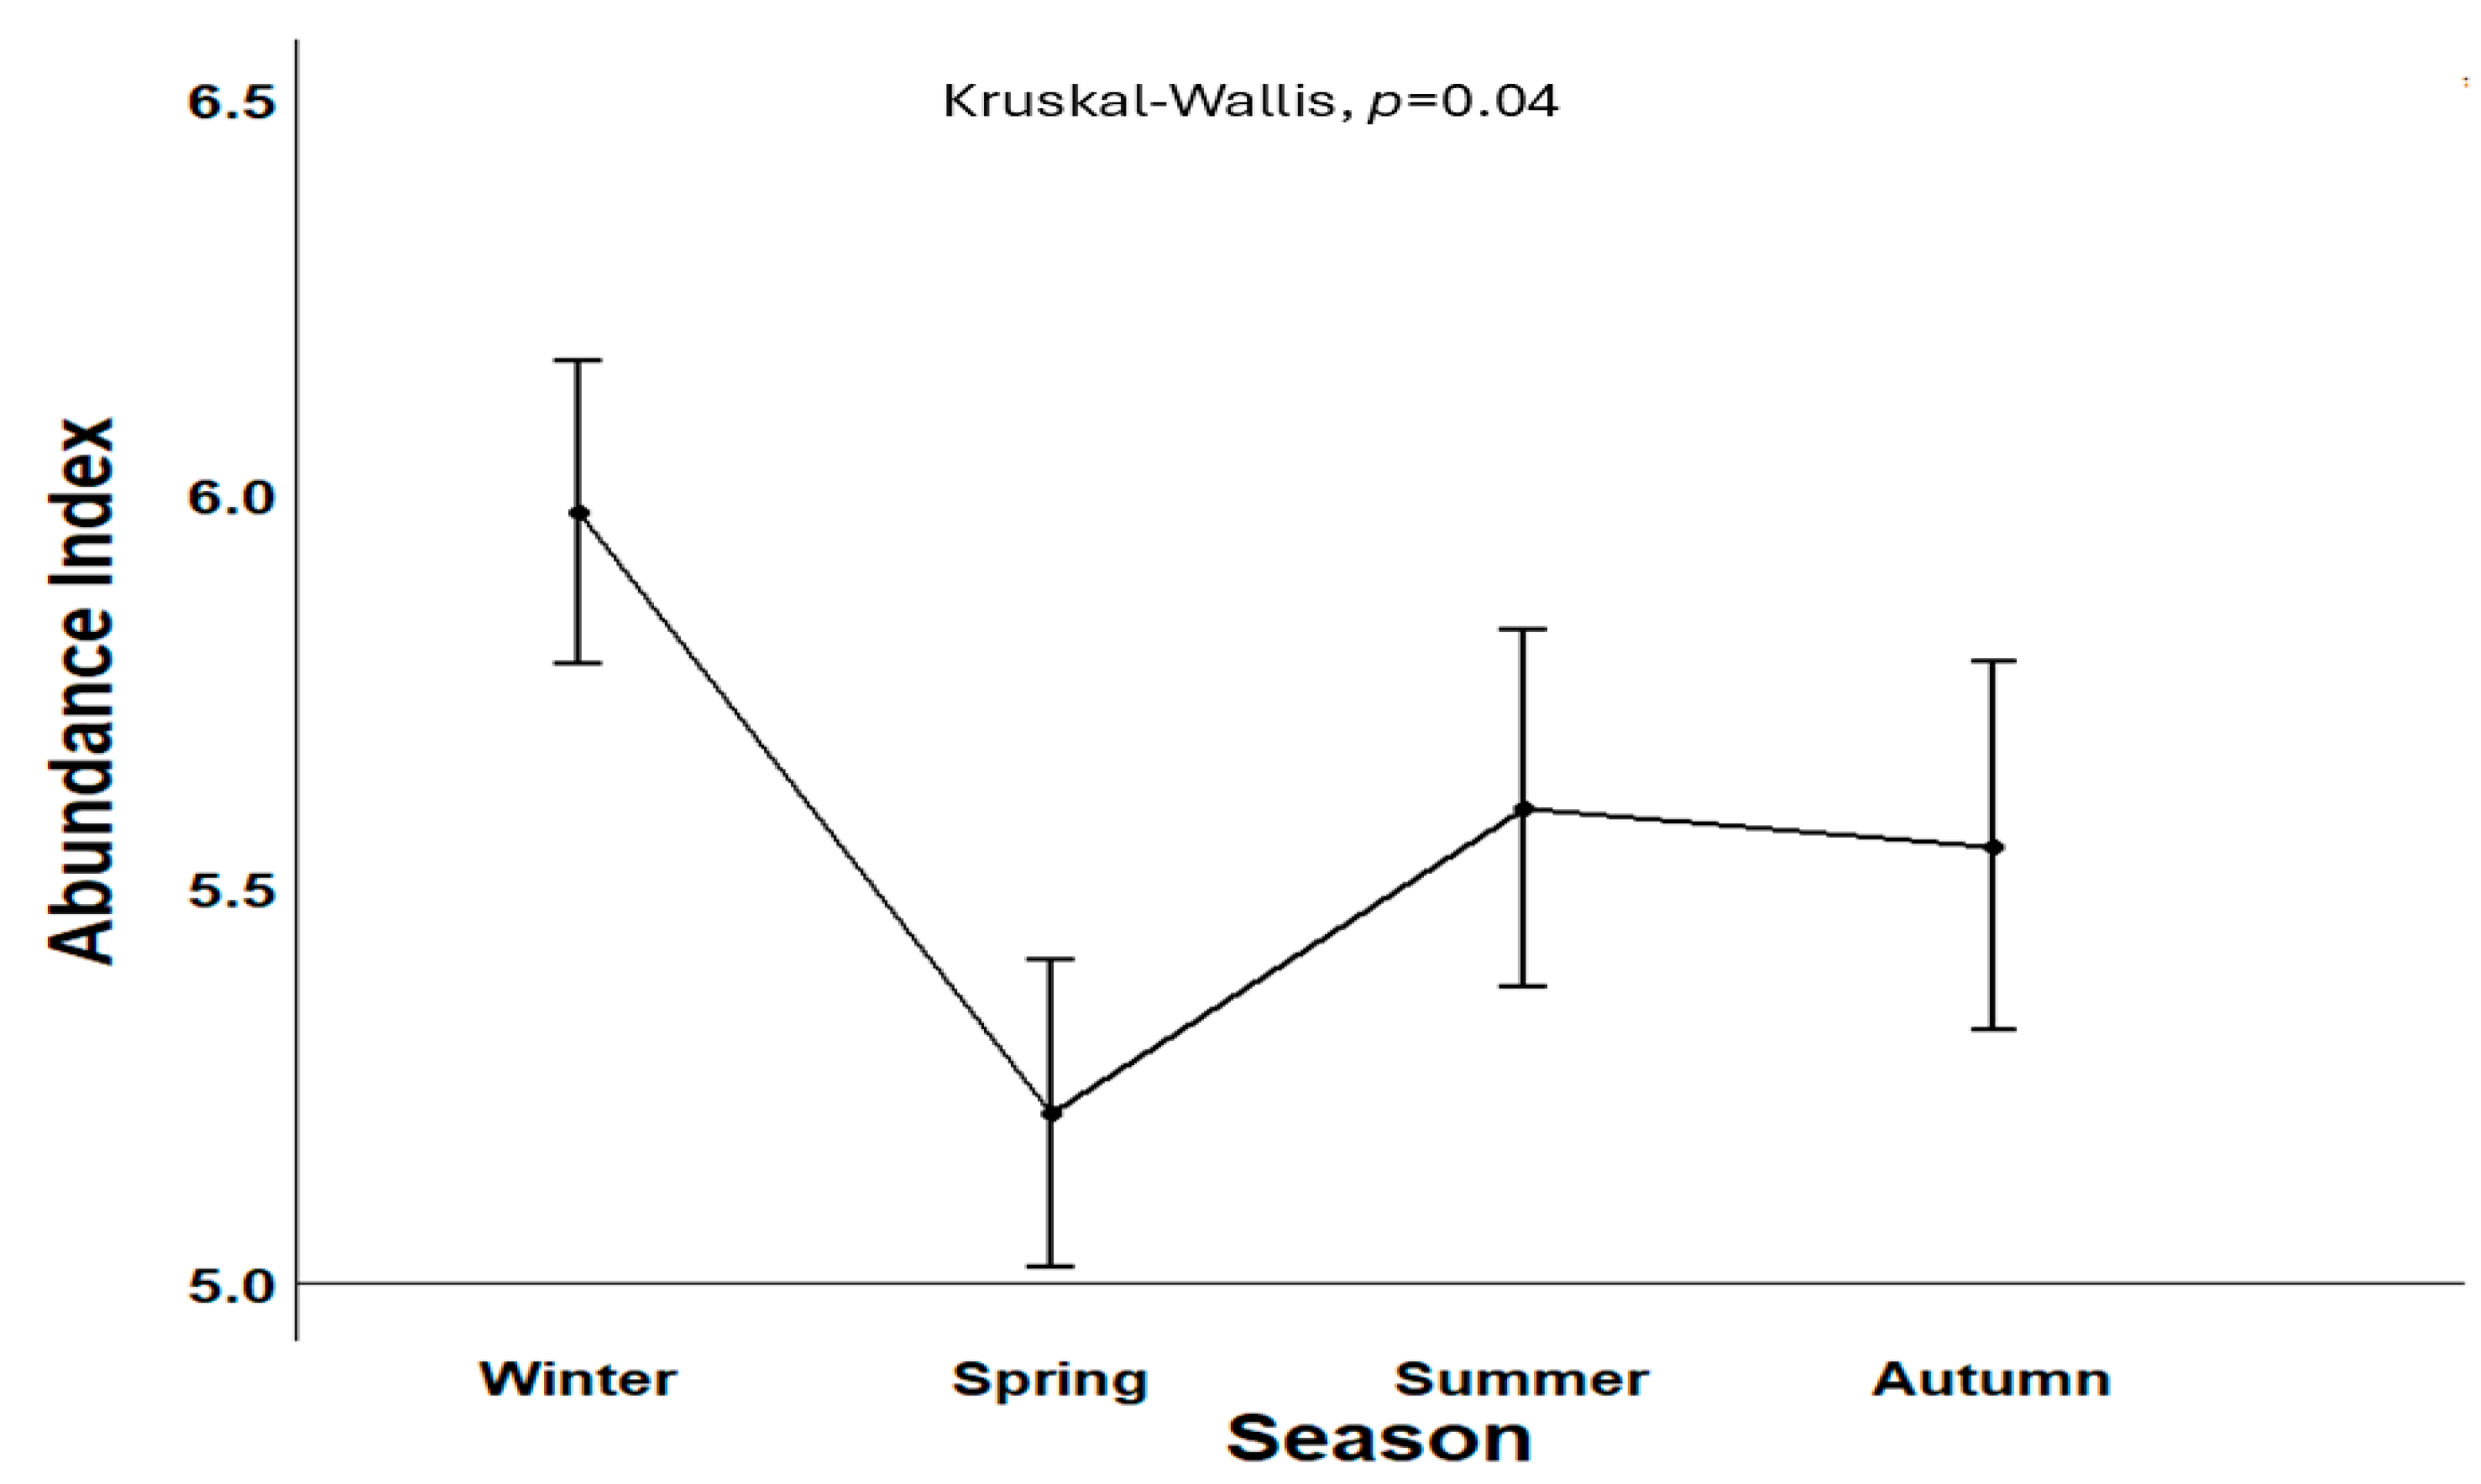
3.2. Abundance and Biomass Index
3.3. GAM Analysis
4. Discussion
5. Conclusions
Funding
Institutional Review Board Statement
Informed Consent Statement
Data Availability Statement
Acknowledgments
Conflicts of Interest
Abbreviations
| MDPI | Multidisciplinary Digital Publishing Institute |
| SoM | Sea of Marmara |
| ESoM | Eastern Sea of Marmara |
| DO | dissolved oxygen |
| GAM | generalized additive model |
| MoU | Memorandum of Understanding |
References
- Nelson, J.S.; Grande, T.C.; Wilson, M.V.H. Fishes of the World, 5th ed.; John Wiley and Sons: Hoboken, NJ, USA, 2016. [Google Scholar] [CrossRef]
- Kovačic, M.; Lipej, L.; Dulčic, J.; Iglesias, S.P.; Goren, M. Evidence-based checklist of the mediterranean sea fishes. Zootaxa 2021, 4998, 1–115. [Google Scholar] [CrossRef] [PubMed]
- Richards, W.J.; Jones, D.L. Preliminary classification of the gurnards (Triglidae: Scorpaeniformes). N. Z. J. Mar. Freshw. Res. 2002, 53, 274–282. [Google Scholar] [CrossRef]
- Jukic-Peladic, S.; Vrgoc, N.; Krstulovic-Sifner, S.; Piccinetti, C.; Piccinetti-Manfrin, G.; Marano, G.; Ungaro, N. Longterm changes in demersal resources of the Adriatic Sea: Comparison between trawl surveys carried out in 1948 and 1998. Fish. Res. 2001, 53, 95–104. [Google Scholar] [CrossRef]
- Labropoulou, M.; Papaconstantinou, C. Community structure and diversity of demersal fish assemblages: The role of fishery. Sci. Mar. 2004, 68S1, 215–226. [Google Scholar] [CrossRef]
- Massuti, E.; Reñones, O. Demersal resource assemblages in the trawl fishing grounds off the Balearic Islands (Western Mediterranean). Sci. Mar. 2005, 69, 167–181. [Google Scholar] [CrossRef]
- Tortonese, E. Osteichthyes (Pesci Ossei); Parte Seconda. Fauna d’Italia; Calderini: Bologna, Italy, 1975; 636p. [Google Scholar]
- Fischer, W.; Bianchi, G.; Scott, W.B. FAO Species Identification Sheets for Fishery Purposes; Eastern Central Atlantic; Fishing areas 34 and 47 (in part); Canada Fundsin-Trust. Ottawa, Department of Fisheries and Oceans, Canada by arrangement with the Food and Agricultural Organization of the United Nations: Ottawa, ON, Canada, 1981; Volume 4, pp. 244–245. [Google Scholar]
- Papaconstantinou, C. Age and Growth of the Yellow Gurnard (Trigla lucerna L., 1758) from the Thermakios Gulf (Greece) with Sea of Marmarae Comments on its Biology. Fish. Res. 1984, 2, 243–255. [Google Scholar] [CrossRef]
- Olim, S.; Borges, T.C. Weight-length relationships for eight species of the family Triglidae discarded on the South coast of Portugal. J. Appl. Ichthyol. 2006, 22, 257–259. [Google Scholar] [CrossRef]
- Vallisneri, M.; Stagioni, M.; Montanini, S.; Tommasini, S. Body size, sexual maturity and diet in Chelidonichthys lucerna (Osteich-thyes: Triglidae) from the Adriatic Sea, north eastern Mediterranean. Acta Adriat. 2011, 51, 141–148. [Google Scholar]
- Roncarati, A.; D’Andrea, M.; Pilla, F.; Felici, A.; Melotti, P. Tub gurnard Chelidonichthys lucerna L.: A new fish species suitable for farming? First answers evaluating the growth of juveniles reared at different stocking densities, welfare and fillet quality. Aquac. Res. 2012, 44, 1140–1151. [Google Scholar] [CrossRef]
- Uyan, A.; Turan, C. Genetic and morphological analyses of tub gurnard Chelidonichthys lucerna populations in Turkish marine waters. Biochem. Syst. Ecol. 2017, 73, 35–40. [Google Scholar] [CrossRef]
- Froese, R.; Pauly, D.; FishBase. World Wide Web Electronic Publication. Version (10/2024). 2024. Available online: www.fishbase.org (accessed on 21 October 2024).
- Colloca, F.; Ardizzone, G.D.; Gravina, M.F. Trophic ecology of gurnards (Pisces: Triglidae) in the Central MediterraneanSea. Mar. Life 1994, 4, 45–57. [Google Scholar]
- Stagioni, M.; Montanini, S.; Vallisneri, M. Feeding of tub gurnard Chelidonichthys lucerna (Scorpaeniformes: Triglidae) in the north-east Mediterranean. J. Mar. Biol. Assoc. United Kingd. 2012, 92, 605–612. [Google Scholar] [CrossRef]
- Işmen, A.; Ismen, P.; Basusta, N. Age, Growth and Reproduction of Tub Gurnard (Chelidonichthys lucerna L. 1758) in the Bay of Iskenderun in the Eastern Mediterranean. Turk. J. Vet. Anim. Sci. 2004, 28, 289–295. [Google Scholar]
- Relini, G.; Carpentieri, P.; Murenu, M. Manuale di Istruzioni Medits. [Medits Instruction Manual]. Biol. Mar. Mediterr. 2008, 15 (Suppl. S2), 1–78. (In Italian) [Google Scholar]
- Marriott, A.L.; Latchford, J.W.; McCarthy, I.D. Population biology of the red gurnard (Aspitrigla cuculus L.; Triglidae) in the inshore waters of Eastern Anglesey and Northwest Wales. J. Appl. Ichthyol. 2010, 26, 504–512. [Google Scholar] [CrossRef]
- ICES. Report of the Working Group on Assessment of New MoU Species (WGNEW); 13–15 December 2005, ICES Headquarters; ICES Advisory Committee on Fishery Management, CM: Copenhagen, Denmark, 2006. [Google Scholar]
- ICES. Report of the Working Group on Assessment of New MoU Species (WGNEW); 18–22 March, ICES HQ; ICES Advisory Committee, CM: Copenhagen, Denmark, 2013. [Google Scholar]
- Griffiths, R.C.; Robles, R.; Coppola, S.R.; Camiñas, J.A. Is There a Future for Artisanal Fisheries in the Western Mediterranean? FAO—COPEMED: Rome, Italy, 2007; ISBN 92-5-000000-0. [Google Scholar]
- Rocha, A.; Feijó, D.; Gonçalves, P. Gurnards: Species Landings’ Composition in ICES Division 27.9a; Working Document presented at the Working Group on Widely Distributed Stocks (WGWIDE); 2018. Technical report. IPMA, Instituto Português do Mar e Atmosfera (Portuguese Institute for the Sea and Atmosphere), Portugal. Available online: https://www.researchgate.net/publication/329151792_Gurnards_species_landings%27_composition_in_ICES_Division_279a?channel=doi&linkId=5bf80643299bf1a0202dc8b7&showFulltext=true (accessed on 6 December 2024). [CrossRef]
- Tserpes, G.; Fiorentino, F.; Levi, D.; Cau, A.; Murenu, M.; Zamboni, A.; Papaconstantinou, C. Distribution of Mullus barbatus and M. surmuletus (Osteichthyes: Perciformes) in the Mediterranean continental shelf: Implications for management. Sci. Mar. 2002, 66 (Suppl. 2), 39–54. [Google Scholar] [CrossRef]
- Yalçin, E.; Gurbet, R. Modelling spatio-temporal distribution of red mullet Mullus barbatus L., 1758, İzmir Bay. Ege J. Fish. Aquat. Sci. 2012, 29, 9–13. [Google Scholar] [CrossRef]
- Eryilmaz, L.; Meriç, N. Some Biological Characteristics of the Tub Gurnard, Chelidonichthys lucernus (Linnaeus, 1758) in the Sea of Marmara. Turk. J. Vet. Anim. Sci. 2005, 29, 27. [Google Scholar]
- Işmen, A.; İnceoğlu, H.; İhsanoğlu, M.A.; Yığın, C.Ç.; Çardak, M.; Daban, B.; Öktener, A. Length-weight relationships and abundance distribution of Triglidae species caught by beam-trawl in the Sea of Marmara. Çanakkale Onsekiz Mart Univ. J. Mar. Sci. Fish. 2018, 1, 13–19. [Google Scholar]
- Uçkun, D. Investigation of the age and growth characteristics of the species belonging to the family Triglidae in Edremit Bay. Ege Univ. J. Fish. Aquat. Sci. 2005, 22, 363–369. [Google Scholar]
- Ünsal, N. A Study on the Identification of the Species of the Family of Triglidae Living in the North of the Marmara Sea. İstanbul Üniv. Su Ürünleri Derg. 1988, 2.2, 175–178. (In Turkish) [Google Scholar]
- GFCM. GFCM Data Collection Reference Framework (DCRF); Version: 23.2; FAO: Rome, Italy, 2018. [Google Scholar]
- Beşiktepe, Ş.T.; Sur, H.İ.; Özsoy, E.; Latif, M.A.; Oğuz, T.; Ünlüata, Ü. The circulation and hydrography of the Marmara Sea. Prog. Oceanogr. 1994, 34, 285–334. [Google Scholar] [CrossRef]
- Özsoy, E.; Altıok, H. A review of hydrography of the Turkish Straits System. In The Sea of Marmara–Marine Biodiversity, Fisheries, Conservation and Governance; Turkish Marine Research Foundation (TÜDAV): Istanbul, Türkiye, 2016; Volume 42, pp. 13–42. [Google Scholar]
- Özsoy, E.; Ünlüata, Ü. Oceanography 5 of the Black Sea: A review of some recent results. Earth-Sci. Rev. 1997, 42, 231–272. [Google Scholar] [CrossRef]
- Tarkan, A.S.; Gaygusuz, Ö.; Acıpınar, H.; Gürsoy, Ç.; Özuluğ, M. Length–weight relationship of fishes from the Marmara Region (NW-Turkey). J. Appl. Ichthyol. 2006, 22, 271–273. [Google Scholar] [CrossRef]
- Öztürk, B. The Marmara Sea, a link between the Mediterranean and the Black Sea. In Invasive Aquatic Species of Europe, Distribution, Impacts and Management; Leppäkoski, E., Gollasch, S., Olenin, S., Eds.; Kluwer Academic Publishers: Amsterdam, The Netherlands, 2002; pp. 337–340. [Google Scholar]
- Demirel, N. Ecological Changes in the Sea of Marmara: Indicator-Based Assessment of Fishing Impact on the Sea of Marmara Ecosystem; Isinibilir, M., Kideys, A., Malej, A., Eds.; Istanbul University Publication No: 5359; Istanbul University: Istanbul, Türkiye, 2024; ISBN 978-605-07-1633-7. [Google Scholar] [CrossRef]
- Yıldız, T.; Karakulak, F.S. Traditional fishing in the Sea of Marmara: From the past to the present. In The Sea of Marmara, Marine Biodiversity, Fisheries, Conservation and Governance; Özsoy, E., Çağatay, M.N., Balkıs, N., Öztürk, B., Eds.; Turkish Marine Research Foundation (TUDAV), Publication No: 42; Turkish Marine Research Foundation (TUDAV): Istanbul, Türkiye, 2016; pp. 697–709. [Google Scholar]
- Bilecenoğlu, M. Diversity of fishes along the coasts of Türkiye. Turk. J. Zool. 2024, 48, 589–616. [Google Scholar] [CrossRef]
- Mantıkçı, M.; Örek, H.; Yücel, M.; Uysal, Z.; Arkın, S.; Salihoğlu, B. Current oxygen status of the Sea of Marmara and the effect of mucilage. In Proceedings of the Symposium “The Marmara Sea 2022”; Öztürk, B., Ergül, H.A., Yalçıner, A.C., Salihoğlu, B., Eds.; Turkish Marine Research Foundation: İstanbul, Türkiye, 2022; Publication no 63; pp. 18–24. [Google Scholar]
- Bilecenoğlu, M.; Taşkavak, E.; Kunt, K.B. Checklist of the marine fishes of Turkey. Zootaxa 2006, 1134, 1–194. [Google Scholar] [CrossRef]
- Turkish Statistical Institute (TUIK). TURKSTAT. 2023. Available online: https://data.tuik.gov.tr/Bulten/Index?p=Su-Urunleri-2020-37252 (accessed on 24 July 2024).
- Cook, R.M.; Heath, M.R. Population trends of bycatch species reflect improving status of target species. Fish. Fish. 2018, 19, 455–470. [Google Scholar] [CrossRef]
- Sparre, P.; Venema, S.C. Introduction to tropical fish stock assessment, Part 1: Manual. FAO Fish. Technol. Pap. 1992, 306/1, 376. [Google Scholar]
- Maravelias, C.D.; Tsitsika, E.V.; Papakonstantinou, C. Environmental influences on the spatial distribution of European hake Merluccius merluccius and red mullet Mullus barbatus in the Mediterranean. Ecol. Res. 2007, 22, 678–685. [Google Scholar] [CrossRef]
- Yalçin, E.; Gurbet, R. Environmental influences on the spatio-temporal distribution of European hake Merluccius merluccius in Izmir Bay, Aegean Sea. Turk. J. Fish. Aquat. Sci. 2016, 16, 1–14. [Google Scholar] [CrossRef]
- Ayón, P.; Swartzman, G.; Espinoza, P.; Bertrand, A. Long-term changes in zooplankton size distribution in the Peruvian Humboldt Current System: Conditions favouring sardine or anchovy. Mar. Ecol. Prog. Ser. 2011, 422, 211–222. [Google Scholar] [CrossRef]
- Liu, H. Generalized Additive Model; Department of Mathematics and Statistics, University of Minnesota Duluth: Duluth, MN, USA, 2008; p. 55812. [Google Scholar]
- Espeland, S.H.; Olsen, E.M.; Knutsen, H.; Gjøsæter, J.; Danielssen, D.; Stenseth, N.C. New perspectives on fish movement: Kernel and GAM smoothers applied to a century of tagging data on coastal Atlantic cod. Mar. Ecol. Prog. Ser. 2008, 372, 231–241. [Google Scholar] [CrossRef]
- Hastie, T.; Tibshirani, R. Generalized Additive Models; Chapman & Hall: London, UK, 1990; 335p. [Google Scholar]
- R Development Core Team. R: A Language and Environment for Statistical Computing; R Foundation for Statistical Computing: Viena, Austria, 2024; Available online: http://www.R-project.org (accessed on 11 October 2024).
- Craven, P.; Wahba, G. Smoothing noisy data with spline functions: Estimating the correct degree of smoothing by the method of generalized cross validation. Numer. Math. 1979, 31, 377–403. [Google Scholar] [CrossRef]
- Wood, S.N. Generalized Additive Models: An Introduction with R; CRC Press: London, UK, 2006; 410p. [Google Scholar]
- Hastie, T.J. Generalized additive models. In Statistical Models in S.; Chambers, J.M., Hastie, T.J., Eds.; Wadsworth and Brooks: Pacific Grove, CA, USA, 1992; pp. 249–304. [Google Scholar]
- Hammer, Ø.; Harper, D.A.T.; Paul, D.R. Past: Paleontological Statistics Software Package for Education and Data Analysis. Palaeont. Electr. 2001, 4, 1–9. Available online: http://palaeo-electronica.org/2001_1/past/issue1_01.htm (accessed on 7 December 2024).
- Gilbert, R.O. Statistical Methods for Environmental Pollution Monitoring; Van Nostrand Reinhold: New York, NY, USA, 1987; 320p. [Google Scholar]
- Parab, S.; Bhalerao, S. Choosing statistical test. Int. J. Ayurveda Res. 2010, 1, 187–191. [Google Scholar] [CrossRef]
- FAO. The State of Mediterranean and Black Sea Fisheries, Special Edition; General Fisheries Commission for the Mediterranean: Rome, Italy, 2023; 38p. [Google Scholar]
- Akoglu, E.; Salihoglu, B.; Libralato, S.; Oguz, T.; Solidoro, C. An indicator-based evaluation of Black Sea food web dynamics during 1960–2000. J. Mar. Syst. 2014, 134, 113–125. [Google Scholar] [CrossRef]
- Papantoniou, G.; Giannoulaki, M.; Stoumboudi, M.T.; Lefkaditou, E.; Tsagarakis, K. Food web interactions in a human dominated Mediterranean coastal ecosystem. Mar. Environ. Res. 2021, 172, 105507. [Google Scholar] [CrossRef]
- Dimarchopoulou, D.; Tsagarakis, K.; Sylaios, G.; Tsikliras, A.C. Ecosystem trophic structure and fishing effort simulations of a major fishing ground in the northeastern Mediterranean Sea (Thermaikos gulf). Estuar. Coast. Shelf Sci. 2022, 264, 107667. [Google Scholar] [CrossRef]
- FAO. The State of Mediterranean and Black Sea Fisheries; General Fisheries Commission for the Mediterranean: Rome, Italy, 2020; 172p. [Google Scholar]
- Sidell, B.D.; Brien, K.M. When bad things happen to good fish: The loss of hemoglobin and myoglobin expression in Antarctic icefishes. J. Exp. Biol. 2006, 209, 1791–1802. [Google Scholar] [CrossRef]
- Roberts, N.; Thompson, I. Impacts of Fish Behavior on Aquatic Ecosystem Dynamics. Ecol. Rev. 2021, 27, 405–418. [Google Scholar]
- Barletta, M.; Barletta-Bergan, A.; Saint-Paul, U.; Hubold, G. The Role of Salinity in Structuring the Fish Assemblages in Tropical Estuary. J. Fish Biol. 2005, 66, 45–72. [Google Scholar] [CrossRef]
- Jobling, M. Temperature effects on fish growth and metabolism: A review of the contemporary literature. J. Fish Biol. 2010, 77, 592–611. [Google Scholar]
- McCormick, S.D. Effects of salinity on growth and metabolism in teleosts. Rev. Fish Biol. Fish. 2011, 21, 463–480. [Google Scholar]
- Breitburg, D.; Levin, L.A.; Oschlies, A.; Grégoire, M.; Chavez, F.P.; Conley, D.J.; Garçon, V.; Gilbert, D.; Gutiérrez, D.; Isensee, K.; et al. Declining oxygen in the global ocean and coastal waters. Science 2018, 359, eaam7240. [Google Scholar] [CrossRef]
- Wedemeyer, G.A.; Yasutake, W.T. Clinical Methods for the Assessment of the Effect of Environmental Stress on Fish Health; US Fish and Wildlife Service: Washington, DC, USA, 1977; 89p. [Google Scholar]
- Keskin, C.; Ordines, F.; Guijarro, B.; Massuti, E. Comparison of fish assemblages between the Sea of Marmara and the Aegean Sea (north-eastern Mediterranean). J. Mar. Biol. Assoc. United Kingd. 2011, 91, 1307–1318. [Google Scholar] [CrossRef]
- López-López, L.; Preciado, I.; Velasco, F.; Olaso, I.; Gutiérrez-Zabala, J.L. Resource partitioning amongst five coexisting species of gurnards (Scorpaeniforme: Triglidae): Role of trophic and habitat segregation. J. Sea Res. 2011, 66, 58–68. [Google Scholar] [CrossRef]
- Nilsson, G.E.; Hobbs, J.P.; Munday, P.L.; Ostlund-Nilsson, S. Coward or braveheart: Extreme habitat fidelity through hypoxia tolerance in a coral-dwelling goby. J. Exp. Biol. 2004, 207, 33–39. [Google Scholar] [CrossRef]
- Colloca, F.; Milisenda, G.; Capezzuto, F.; Cau, A.; Garofalo, G.; Jadaud, A.; Kiparissis, S.; Micaleff, R.; Montanini, S.; Thasitis, I.; et al. Spatial and temporal trend in the abundance and distribution of gurnards (Pisces: Triglidae) in the northern Mediterranean Sea. Sci. Mar. 2019, 83, 101–116. [Google Scholar] [CrossRef]
- JICA. Report of Demersal Fisheries Resources Survey in the Republic of Turkey; JICA: Ankara, Turkey, 1993; 579p. (In Turkish) [Google Scholar]
- Gözenç, S.; Kurter, A.; Okuş, E.; Yüksek, A.; Uysal, A.; Adatepe, F.M.; Orhon, S.; Kıratlı, N.; Demirel, S.; Çimen, N.; et al. The stock determination of demersal fish of the Marmara Sea. In TUBITAK Project Final Report; (Project Number: DEBAG-75/G; DEBAG-116/G); TUBITAK Publication: Istanbul, Turkey, 1997; 253p. [Google Scholar]
- Karakulak, F.S.; Öztürk, B.; Topaloğlu, B.; Özgür, E. The Status of the Demersal Fishing Resources in the Marmara Sea; CIESM, The Mediterranean Science Commission: Monaco, MC, USA, 2004; Volume 37. [Google Scholar]
- Daban, İ.B.; İşmen, A.; Şirin, M.; Yığın, C.Ç.; Arslan İhsanoğlu, M. Analysis of demersal fish fauna off the Sea of Marmara, Turkey. Çanakkale Onsekiz Mart Univ. J. Mar. Sci. Fish. 2021, 4, 20–31. [Google Scholar] [CrossRef]
- Guidetti, P.; Fanelli, G.; Fraschetti, S.; Terlizzi, A.; Boero, F. Coastal fish indicate human-induced changes in the Mediterranean littoral. Mar. Environ. Res. 2002, 53, 77–94. [Google Scholar] [CrossRef] [PubMed]
- Jennings, S.; Greenstreet, S.P.R.; Reynolds, J.D. Structural changes in an exploited fish community: A consequence of differential fishing effects on species with contrasting life histories. J. Anim. Ecol. 1999, 68, 617–627. [Google Scholar] [CrossRef]
- Labropoulou, A.; Papaconstantinou, C. Effects of fishing on community structure of demersal fish assemblages. Belg. J. Zool. 2005, 135, 191–197. [Google Scholar]
- Keister, J.E.; Houde, E.D.; Breitburg, D.L. Effects of bottom layer hypoxia on abundances and depth distributions of organisms in Patuxent River, Chesapeake Bay. Mar. Ecol. Prog. Ser. 2000, 205, 43–59. [Google Scholar] [CrossRef]
- Pauly, D.; Christensen, V.; Dalsgaard, J.; Froese, R.; Torres, F.C., Jr. Fishing down marine food webs. Science 1998, 279, 850–863. [Google Scholar] [CrossRef]
- Coker, T.; Turkoglu, M.; Satilmis, H.H. Seasonal distribution of Sea of Marmarae fish eggs and larvae, and potential contribution of Sea of Marmarae large scale pelagic fish Species in Saros Bay, Turkey. In Canakkale Values Symposiums (CIDS), Gelibolu Bulletin Book, 27–28 August 2008; Canakkale Onsekiz Mart University Press: Canakkale, Turkey, 2008; pp. 329–330. [Google Scholar]
- Taşdemir, Y. The Marmara Sea: Pollutants And Environment Related Precautions. J. Uludag Univ. Fac. Eng. Archit. 2002, 7, 39–45. (In Turkish) [Google Scholar]
- Kabasakal, H.; Sakınan, S.; Lipej, L.; Ivajnšič, D. A preliminary life history traits analysis of sharks in the Sea of Marmara (Türkiye), where deoxygenation and habitat deterioration are raising concerns. Aquat. Res. 2023, 6, 72–82. [Google Scholar] [CrossRef]
- Ulman, A.; Zengin, M.; Demirel, N.; Pauly, D. The lost fish of Turkey: A recent history of disappeared species and commercial fishery extinctions for the Turkish Marmara and Black Seas. Front. Mar. Sci. 2020, 7, 650. [Google Scholar] [CrossRef]
- Serena, F.; Baino, R.; Voliani, A. Distribuzione dei Triglidi (Osteichthyes, Scorpaeniformes) nell’AltoTirreno. [Distibution of Triglidae (Osteichthyes, Scorpaeniformes) from north Tyrrenhyan Sea. Oebalia Suppl. 1990, 16, 269–278. (In Italian) [Google Scholar]
- Kabasakal, H.; Uzer, U.; Karakulak, F.S. Impact of Fishing Capacity. Ann. Ser. Hist. Nat. 2024, 34, 257–272. [Google Scholar] [CrossRef]
- Dulčić, J.; Kraljević, M. Influence of environmental factors on fish assemblages in the Kornati National Park (Adriatic Sea, Croatia). Mar. Biol. 1996, 126, 117–125. [Google Scholar]
- Hureau, J.C. Fishes of the North-Eastern Atlantic and the Mediterranean; Nielsen, J., Tortonese, E., Eds.; UNESCO, University of London: London, UK, 1986; ISBN 92-3-002215-2. [Google Scholar]
- IUCN. The IUCN Red List of Threatened Species. 2024. Version 2024-2. Available online: https://www.iucnredlist.org (accessed on 16 November 2024).


| Station | Latitude | Longitude | Depth (m) | N |
|---|---|---|---|---|
| MD1 | 40.86305° N | 29.16417° E | 83.9 | 205 |
| MD2 | 40.87603° N | 29.03711° E | 69.8 | 195 |
| MD3 | 40.32128° N | 29.39347° E | 94.7 | 4 |
| MD4 | 40.78083° N | 29.26221° E | 85.9 | 99 |
| MD5 | 40.94250° N | 29.40250° E | 62.1 | 152 |
| MD6 | 40.58356° N | 28.83618° E | 139.5 | 57 |
| MD7 | 40.93639° N | 29.41667° E | 85.2 | 67 |
| MD8 | 40.82806° N | 29.49528° E | 44.6 | 335 |
| MD9 | 40.95035° N | 28.98361° E | 30.9 | 189 |
| MD10 | 41.01758° N | 28.61443° E | 52.9 | 109 |
| Abundance | Biomass | Mean TL | ||||
|---|---|---|---|---|---|---|
| Station | Z | P (Trend) | Z | P (Trend) | Z | P (Trend) |
| MD1 | 26 | 0.0029 * | 26 | 0.0029 * | 8 | 0.238 |
| MD2 | 23 | 0.023 * | 21 | 0.036 * | −10 | 0.136 |
| MD4 | 13 | 0.0083 * | 11 | 0.028 * | −7 | 0.136 |
| MD5 | −17 | 0.078 | 1 | 0.5 | ||
| MD7 | 4 | 0.242 | 2 | 0.408 | −2 | 0.408 |
| MD8 | 16 | 0.06 | 10 | 0.179 | −22 | 0.012 * |
| MD9 | 11 | 0.028 * | 9 | 0.068 | 9 | 0.068 |
| MD10 | −7 | 0.191 | 5 | 0.281 | 11 | 0.068 |
| Season/Year | 2014 | 2015 | 2016 | 2017 | 2018 | 2019 | 2020 | 2021 | 2022 | 2023 | 2024 |
|---|---|---|---|---|---|---|---|---|---|---|---|
| Winter | 70.30 | 65.48 | 49.54 | 83.31 | 156.08 | ||||||
| Spring | 54.78 | 26.56 | 28.90 | 67.07 | 31.54 | 133.31 | |||||
| Summer | 180.18 | 74.34 | 57.64 | 70.31 | 20.51 | 39.45 | 51.99 | 155.81 | |||
| Autumn | 51.80 | 32.68 | 50.36 | 64.01 | 104.39 |
| Model | Models | Sig | DE | UBRE | AIC | R2 |
|---|---|---|---|---|---|---|
| M1 | s(SBT) | *** | 21 | 192,943 | 1488 | 0.1759 |
| M2 | s(O) | *** | 0.3 | 228,987 | 1505 | −0.007 |
| M3 | s(pH) | *** | 5.2 | 222,137 | 1502 | 0.0326 |
| M6 | s(Depth) | *** | 18 | 211,171 | 1496 | 0.1221 |
| M5 | Lat | *** | 0.7 | 229,616 | 1505 | −0.006 |
| M4 | Lon | *** | 0.5 | 228,584 | 1505 | −0.006 |
| M7 | s(SBT) + s(O) | *** | 21 | 196,754 | 1489 | 0.1691 |
| M8 | s(SBT) + Lat | *** | 21 | 196,855 | 1489 | 0.1684 |
| M9 | s(SBT) + s(pH) | *** | 26 | 189,614 | 1486 | 0.209 |
| M10 | s(SBT) + Lon | *** | 21 | 196,732 | 1489 | 0.1684 |
| M11 | s(pH) + Lat | *** | 5.4 | 226,423 | 1504 | 0.0242 |
| M12 | s(pH) + Lon | *** | 5.5 | 225,966 | 1503 | 0.026 |
| M13 | s(SBT) + s(O) + s(pH) | *** | 27 | 192,353 | 1487 | 0.2122 |
| M14 | s(SBT) + s(O) + s(pH) + Lon | *** | 27 | 196,555 | 1489 | 0.2033 |
| M15 | s(Depth) + s(pH) | *** | 20 | 210,689 | 1496 | 0.1369 |
| M16 | s(Depth) + Lon | *** | 18 | 215,421 | 1498 | 0.1131 |
| M17 | s(Depth) + s(pH) + Lon | *** | 20 | 214,983 | 1498 | 0.1273 |
Disclaimer/Publisher’s Note: The statements, opinions and data contained in all publications are solely those of the individual author(s) and contributor(s) and not of MDPI and/or the editor(s). MDPI and/or the editor(s) disclaim responsibility for any injury to people or property resulting from any ideas, methods, instructions or products referred to in the content. |
© 2025 by the author. Licensee MDPI, Basel, Switzerland. This article is an open access article distributed under the terms and conditions of the Creative Commons Attribution (CC BY) license (https://creativecommons.org/licenses/by/4.0/).
Share and Cite
Uzer, U. Influence of Environmental Parameters on the Abundance of Tub Gurnard, Chelidonichthys lucerna, in the Eastern Sea of Marmara. Fishes 2025, 10, 127. https://doi.org/10.3390/fishes10030127
Uzer U. Influence of Environmental Parameters on the Abundance of Tub Gurnard, Chelidonichthys lucerna, in the Eastern Sea of Marmara. Fishes. 2025; 10(3):127. https://doi.org/10.3390/fishes10030127
Chicago/Turabian StyleUzer, Uğur. 2025. "Influence of Environmental Parameters on the Abundance of Tub Gurnard, Chelidonichthys lucerna, in the Eastern Sea of Marmara" Fishes 10, no. 3: 127. https://doi.org/10.3390/fishes10030127
APA StyleUzer, U. (2025). Influence of Environmental Parameters on the Abundance of Tub Gurnard, Chelidonichthys lucerna, in the Eastern Sea of Marmara. Fishes, 10(3), 127. https://doi.org/10.3390/fishes10030127