Article

Effects of Glutamate on Growth Performance, Gut Digestion and Antioxidant Capacity in Juvenile Little Yellow Croaker

1
Key Laboratory of Applied Marine Biotechnology by the Ministry of Education, School of Marine Sciences, Ningbo University, Ningbo 315211, China
2
State Key Laboratory for Managing Biotic and Chemical Threats to the Quality and Safety of Agro-Products, Institute of Hydrobiology, Zhejiang Academy of Agricultural Sciences, Desheng Middle Road 298, Hangzhou 310021, China
*
Authors to whom correspondence should be addressed.
Fishes 2025, 10(4), 188; https://doi.org/10.3390/fishes10040188
Submission received: 10 March 2025 / Revised: 9 April 2025 / Accepted: 12 April 2025 / Published: 21 April 2025
(This article belongs to the Special Issue Application of Protein and Amino Acid in Aquaculture Feed)

Abstract

:
This study is to explore the alleviating effects of glutamate on intestinal damage in cultured little yellow croaker. A total of 900 juvenile fish at a weight of 30.68 ± 0.12 g were randomly separated into six groups with three replicates each, and were fed a basic diet (protein at 44.42% and lipid at 12.48%) with additional glutamate at 0.00%, 0.40%, 0.80%, 1.2%, 1.60%, and 2.00%. Each replica group consisted of 50 fish in a breeding barrel (radius 1.0 m, height 1.5 m), and the experiment lasted for 54 days. The results showed that supplementation with 0.4–1.2% glutamate significantly improved the survival rate, which increased from 75.56% to 91.11%, reduced the feed conversion rate from 1.75 to 1.57, and increased the protein efficiency ratio from 1.55 to 1.85 (p < 0.05). In the intestines, the addition of 0.40–1.2% glutamate increased muscle thickness and villus height (p < 0.05), as well as the activities of pepsin, trypsin, α-amylase, and lipase (p < 0.05). Enzyme activity analysis indicated that the addition of 0.4–1.2% glutamate in the feed significantly enhanced the activities of serum Total Superoxide Dismutase (T-SOD), catalase (CAT), and glutathione peroxidase (GPx) antioxidant enzymes (p < 0.05). Transcriptome analysis of the 1.2% and 0% groups revealed that differentially expressed genes were enriched in glutathione synthesis, nutrient absorption and metabolism, and viral protein interaction with cytokine and cytokine receptor pathways. qPCR experiments verified that the addition of 1.2% glutamate significantly up-regulated the expression of antioxidant-related genes, including glutathione synthetase and Nrf2. In conclusion, the addition of glutamate can enhance growth performance, increase intestinal digestive capacity, activate intestinal glutathione synthesis to alleviate intestinal damage, and maintain intestinal health.
Key Contribution: The purpose of this study was to investigate the effects of different glutamate additions on the growth and the intestines of little yellow croaker, and to determine if the addition of 1.2% glutamate can effectively maintain the intestinal integrity of little yellow croaker and promote the absorption of nutrients in little yellow croaker, thus improving the growth performance of little yellow croaker.

1. Introduction

Traditionally, glutamate has been classified as a non-essential amino acid due to its endogenous biosynthetic capacity in organisms [1,2]. In addition to serving as the basic unit of peptide chains and proteins, glutamate (Glu) is converted into pyruvate through deamination and participates in the tricarboxylic acid cycle (TCA cycle), making it one of the important substrates for cellular energy metabolism [1]. For intestinal cells, glutamate provides energy for cell growth and active transport by being converted into glutamine [2]. Moreover, glutamate can also participate in the synthesis of glutathione (GSH), which helps to eliminate reactive oxygen species [3]. In organisms, glutamate is an effective exogenous antioxidant that plays a role in the removal of reactive oxygen species [4]. So, glutamate plays a considerable role in maintaining normal growth and intestinal functions in fish.
Fish growth is closely related to their nutrient digestion and absorption abilities [5]. Previous research has indicated that incorporating 1.5–4.0% glutamate in feed promotes the growth performance of fish species [6,7,8,9]. This enhancement is primarily observed in the stimulation of protein metabolism and muscle structure development [10]. However, beyond a certain inclusion level, the addition of glutamate does not significantly impact growth performance and may even reduce it [11]. Therefore, the effects of varying supplementation levels may vary among different fish species and developmental stages.
The little yellow croaker (Larimichthys polyactis) is an important economic fish species in the coastal areas of Northeast Asia, widely distributed in China, Japan, South Korea, etc. [12,13]. However, in intensive aquaculture, changes in factors such as high temperature, hypoxia, and noise can easily cause stress in little yellow croaker, adversely affecting their growth performance [14,15,16]. In high-density aquaculture environments, the intestines of fish are more susceptible to damage, leading to a decline in gut health [17,18]. Gut health is a critical reason for fish growth [19]. The addition of glutamate helps to maintain gut health [20,21].
Currently, efficient utilization of protein resources and reducing the use of fishmeal are important trends in the development of the aquaculture industry [22,23]. However, the protein requirement of little yellow croaker is approximately 47%, with a protein efficiency within the range of 1.37–1.60% [24,25]. Therefore, supplementing the diet with the required amino acids or peptides can effectively reduce the protein intake needed by aquatic animals [26].
This study aims to evaluate the impact of adding free glutamate to feed on the intestinal health and growth performance of little yellow croaker under reduced feed protein content. It provides ideas for reducing the use of fishmeal in little yellow croaker feed and improving the success rate and growth performance of farmed little yellow croaker.

2. Materials and Methods

2.1. Experimental Diet Preparation and Feeding Trial

All fish were fed at Experiment Xiangshan Port Bay Aquatic Seedling Co., Ltd. of Ningbo, China. In this study, which focused on the diet of juvenile little yellow croaker, we selected approximately 900 individuals with a body weight of 30.68 ± 0.12 g. These individuals were randomly divided into six groups and housed in a breeding barrel (Radius 1.0 m, height 1.5 m), with three replicates per group and 50 individuals per replicate. The fish were fed compounded feeds supplemented with varying concentrations of glutamate (0.0% 0.4%, 0.8%, 1.2%, 1.6%, and 2.0%). The composition of the feed is provided in Table 1. Conducted during the autumn at temperatures of 19 to 22 °C, pH of 8.03–8.35, dissolved oxygen level of 3.82–6.4 mg/L, and salinity of 25% under natural photoperiods system in Breeding barrel. About 100–150% of the water volume was renewed daily during a trial period of 54 days. All juvenile little yellow croakers were fed at fixed times (twice daily; morning and evening), with each feeding session allowing for satiation, initial weight (IW), final weight (FW), and feed intake to be recorded. Rearing was conducted in a breeding barrel using filtered and purified natural seawater with a salinity of 25‰. The feeding period lasted for 54 days, followed by a 24 h fasting period before sampling on the 55th day. Experimental protocols, fish management, and rearing procedures adopted in the feeding trial were approved in advance by the Institutional Animal Care and Use Committee of the Zhejiang Academy of Agriculture Science. Approval Code: 25ZALAS13; Approval Date: 17 March 2025.

2.2. Sample Collection

Following the procedure described by Young [27], at the end of the feeding experiment, all the survival fish from each treatment group were anesthetized using MS222 (35 mg/L) (1:10,000) (Purity 99%, Shanghai Reagent, Shanghai, China) and weighed, after which the specific growth rate (SGR), feed conversion ratio (FCR), average feed intake (FI), etc., were calculated. A section of the intestines from six fishes per group, extending 1 mm anterior and posterior to the midpoint was snap-frozen in liquid nitrogen and stored at −80 °C for subsequent mRNA extraction and analysis. This meticulous approach ensured a detailed investigation of the effects of dietary glutamate on growth performance, nutrient utilization, and potential impacts on intestinal health and function at the molecular level.

2.3. Histological Analysis

Six little yellow croakers from each group were randomly selected; a 1 mm portion of the middle intestine was removed, the contents were eliminated, and the portion was fixed with paraformaldehyde. The sample was fixed, dehydrated, embedded in paraffin, and sliced. Then, the sections were stained with hematoxylin and eosin (H&E) and examined under an optical microscope (Leica DM4B) (Leica, Tokyo, Japan). On each intestinal slide, 15 villi and muscle thickness were randomly selected and observed using a microscope.

2.4. Antioxidant Enzyme Activity Assays

On the 55th day, blood samples were collected from the caudal veins (from groups of 10 fish) and immediately centrifuged at 3000 r/min for 10 min at 4 °C to obtain serum, which was then stored at 4 °C for further analysis according to his methods [28]. The concentrations of serum glutathione peroxidase (GSH-Px), superoxide dismutase (SOD), malondialdehyde (MDA), and catalase (CAT) were determined using commercial kits from Nanjing Jiancheng Bioengineering Institute (Nanjing, China), with measurements obtained on a UV-5200 spectrophotometer.

2.5. Digestive Enzyme Activity Assays

Samples from the midgut (n = 6 per tissue type) were flash-frozen in liquid nitrogen and stored at −80 °C, then 9 times the volume of 4 °C physiological saline was added placed in a cryogenic grinding instrument (JXFSTPRP-CLN, Shanghai Jingxin, Shanghai, China) for homogenization at 4 °C (vibration frequency 65 Hz, 15 s/time, interval 10 s, for 6 consecutive times). After thorough homogenization, the samples were centrifuged at 4 °C, 2500 r/min for 10 min, and the supernatant was collected for analysis of intestinal enzyme activities. The activities of α-amylase, lipase, and trypsin were all determined by colorimetric methods, and the corresponding kits were purchased from Shanghai Enzyme-linked Biotechnology Research Institute Co., Ltd. (Shanghai, China).

2.6. Plasma Biochemical Analysis

The blood samples were taken from ten fish per group. Blood samples were collected from the caudal veins. The blood samples were then subjected to centrifugation at 4 °C with a speed of 3000 revolutions per minute (r/min) for a duration of 10 min. Following centrifugation, the supernatant serum was carefully harvested and stored at −80 °C for future analysis. Plasma biochemical parameters were determined according to the method described by Nanjing Jiancheng Bioengineering Institute. The concentrations of total protein (TP), blood sugar (BG), triglyceride (TG), calcium (Ca), and phosphorus (P) were analyzed by an automatic biochemical analyzer (CHEMIX800, Kobe, Japan).

2.7. Transcriptomic Analysis

Total RNA from intestinal and tissue samples was extracted using an RNeasy kit (Qiagen, Hilden, Germany). mRNAs with poly (A) structures in the total RNA were enriched using oligo (dT) magnetic beads. The RNA was fragmented ionically to approximately 300 bp in length. This specific selection of length was due to the fixed length of the sequencing adapters; shorter fragments lead to a greater proportion of adapter sequences, reducing the proportion of useful data, while longer fragments are detrimental to the formation of clusters during the sequencing process. Using RNA as a template, the first strand of cDNA was synthesized with random 6-base primers and reverse transcriptase, followed by the synthesis of the second cDNA strand using the first strand as a template.
Upon completion of library construction, PCR amplification was performed to enrich the library fragments. The library was then selected based on fragment size, aiming for a library size of approximately 450 bp. Quality control of the library was conducted using an Agilent 2100 Bioanalyzer (Santa Clara, Agilent Technologies, CA, USA), followed by measurements of the total library concentration and the effective library concentration. Libraries containing different index sequences (each sample is tagged with a unique index, allowing for the differentiation of data from each sample after sequencing) were mixed in proportion according to their effective concentrations and the required data volume for each library. The mixed libraries were uniformly diluted to 2 nM and were denatured with alkali to form single-stranded libraries. After RNA extraction, purification, and library preparation, the libraries were sequenced using paired-end (PE) sequencing via next-generation sequencing (NGS) technology, which is based on the Illumina sequencing platform. We used the ClusterProfiler R package (4.15.1) to test the statistical enrichment of DEGs in Kyoto Encyclopedia of Genes and Genomes (KEGG) pathways. All enrichment analyses in this study were conducted using the following methods. TopGo was used for Gene Ontology (GO) enrichment analysis, and the significantly enriched GO terms were calculated using the hypergeometric distribution method (the standard for significant enrichment was p < 0.05). Cluster Profiler software (3.20) was used for KEGG pathway enrichment analysis, with a focus on pathways with p < 0.05.

2.8. Quantitative Real-Time PCR Analysis

Total RNA was extracted from juvenile little yellow croaker intestinal samples using TRIzol reagent (Invitrogen, Waltham, MA, USA), and RNA integrity was assessed on a 1.2% denaturing agarose gel. RNA was treated with RNase-free DNase (Takara, Shiga, Japan) to remove DNA contaminants and reverse transcribed into cDNA using a PrimeScript™ RT reagent Kit (Takara, Shiga, Japan) following the manufacturer’s instructions. Quantitative real-time PCR analysis was performed on a real-time fluorescence quantitative PCR instrument (CFX96, Bio-Rad, Hercules, CA, USA). The primer sequences are listed in Table 2.

2.9. Calculations and Statistical Analyses

The calculation formula used was as follows:
Survival rate (SR) (%) = (NFNI) × 100
Specific growth rate (SGR) (% day−1) = (LnWF − LnWI) × 100/d
Weight gain rate (WGR) (%) = (WFWI) × 100/WI
Feed conversion rate (FCR) = Wf/(WFWI)
Daily feed intake (DFI) (g tail−1 day−1) = Wf/NF/d
Protein efficiency ratio (PER) = (WFWI) × 100/Wp
where NF is the final number of the little yellow croaker, WF is the final weight, WI is the initial weight, d is the experimental period in days, Wf is the weight of consumed feed, and NI is the initial number. Wp is the weight of consumed feed protein.
All tests were performed in triplicates, and data were reported as means ± standard deviation, with a cage mean (n = 5) and a population mean (n = 3 cages). The relationship between WGR, SGR, PER, FCR, and dietary glutamate was examined by regression analysis, respectively. Variance and significant differences among means were tested through one-way ANOVA using (GraphPad Prism 8.0, La Jolla, CA, USA). All significant differences are represented by p < 0.05.

3. Results

3.1. Growth Performance

As depicted in Table 3, WGR, SGR, PER, and DFI exhibited an initial increase followed by a decrease with increasing glutamate levels. When the addition of glutamate reached 1.2%, the SR increased from 75.56% to 91.11% (p < 0.05). Compared to the 0% group, the addition of 1.2% glutamate reduced the FER from 1.75 to 1.57 and increased the PER from 1.55 to 1.85 (p < 0.05). The FCR also showed a significant decrease in the 1.2% group. However, further increasing the glutamate content did not significantly improve the growth indices (WGR, SGR, PER, FCR, and DFI).
The relationships between dietary glutamate and WGR, SGR, FCR, and PER are described in Figure 1. The WGR, SGR, and FCR can be described with the broken line model. According to the line chart analysis with WGR, the evaluation index, the optimal glutamate requirement for growth was 1.29% and WGR was 48.26% (Figure 1a). When the GC was more than 1.23%, the SGR was 0.46 day −1 (Figure 1b). And the optimal glutamate for FCR and PER was 1.01%, with the lowest FCR at 1.38, and the highest PER at 1.89 (Figure 1c,d).

3.2. Intestinal Morphology

The results of the histological examination of intestinal tissue samples from the six experimental groups are shown in Figure 2. From histological sections, the edges of the villi in the 0% group of little yellow croaker were observed to be rough and short. After the addition of glutamate, the villi had longer, smoother, and more complete edges. The shape and length of the villi are shown in Table 4. As shown in Table 4, after supplementation with 0.8–1.6% glutamate, the villus length increased to 186.08–273.55 μm (p < 0.05). The intestinal muscle layer thickness in the 0% group was 53.83 μm, which increased to 56.64–62.16 μm after supplementation with 0.8–1.6% glutamate.

3.3. Plasma Biochemistry

The plasma biochemical indices of little yellow croaker fed different experimental diets are presented in Figure 3. Compared with the fish in the other groups, the fish in the 1.2% glutamate group had significantly greater plasma BG and TP levels (p < 0.05). There was no significant difference in TG, Ca, and P levels among the different treatment groups.

3.4. Antioxidant Activity

As shown in Table 5, the activities of catalase (CAT), total superoxide dismutase (T-SOD), and glutathione peroxidase (GSH-Px) with increasing glutamate levels initially increased and then decreased after reaching a peak at 1.2% supplementation. In contrast, malondialdehyde (MDA) content demonstrated an inverse trend, decreasing with higher glutamate concentrations. Specifically, T-SOD activity in the 1.2% group was significantly elevated compared to the 2.0% group (p < 0.05). Glutamate supplementation at 0.4–2.0% significantly enhanced CAT activity, while concentrations of 0.8–1.2% markedly improved GSH-Px activity. Additionally, 1.2% glutamate supplementation significantly reduced MDA content compared to the 0% control group.
Figure 3. Effects of Glu on serum biochemical indices of juvenile L. polyactis fed different dietary glutamate levels diets: (a) Effect of glutamate on serum biochemical of Total Protein (TP). (b) Effect of glutamate on serum biochemical of Inorganic Phosphorus (P). (c) Effect of glutamate on serum biochemical of Blood Glucose (BG). (d) Effect of glutamate on serum biochemical of Triglyceride (TG). (e) Effect of glutamate on serum biochemical of Calcium (Ca). Note: values not sharing a common superscript, p < 0.05. (n = 3 cages).
Fishes 10 00188 g003
Table 5. Effect of Glutamate on total superoxide dismutase (T-SOD), catalase (CAT), glutathione peroxidase (GPx), and malondialdehyde (MDA) of juvenile L. polyactis.
Item0.0%0.4%0.8%1.2%1.6%2.0%
T-SOD (U/mL)53.8 ± 3.50 ab56.64 ± 6.24 ab58.20 ± 4.65 ab62.16 ± 4.24 a52.90 ± 3.90 ab51.46 ± 3.15 b
MDA (nmol/mL)7.56± 0.90 a6.64 ±1.13 a5.65 ± 0.95 a5.19 ± 0.58 b6.49 ± 0.43 a6.39 ±1.42 a
GSH-PX (U/mL)643.81 ± 7.91 b655.00 ± 8.17 b678.5 ± 8.85 a688.05 ± 12.13 a639.70 ± 12.88 b620.35 ± 3.83 c
CAT (U/mL)4.00 ± 0.63 c6.30 ± 0.71 ab7.40 ± 0.86 ab8.42 ± 0.92 a5.74 ± 1.64 ab4.52 ±0.96 b
Note: values not sharing a common superscript, p < 0.05 (n = 3 cages).

3.5. Digestive Enzyme

The results are shown in Table 6. Compared to the 0% group, the activities of pepsin, trypsin, and α-amylase were significantly improved in the 1.2% group. Additionally, the activities of lipase, pepsin, trypsin, and α-amylase showed a trend of first increasing and then decreasing with the increasing content of glutamate. Lipase activities in the intestines were the highest for fish fed the 1.60% Glu diet (p < 0.05). The digestive capacity in the intestinal tract was notably enhanced through optimal Glu administration, particularly evident in the 1.2% Glu treatment group, which achieved maximal enzymatic activation for pepsin, trypsin, and α-amylase.

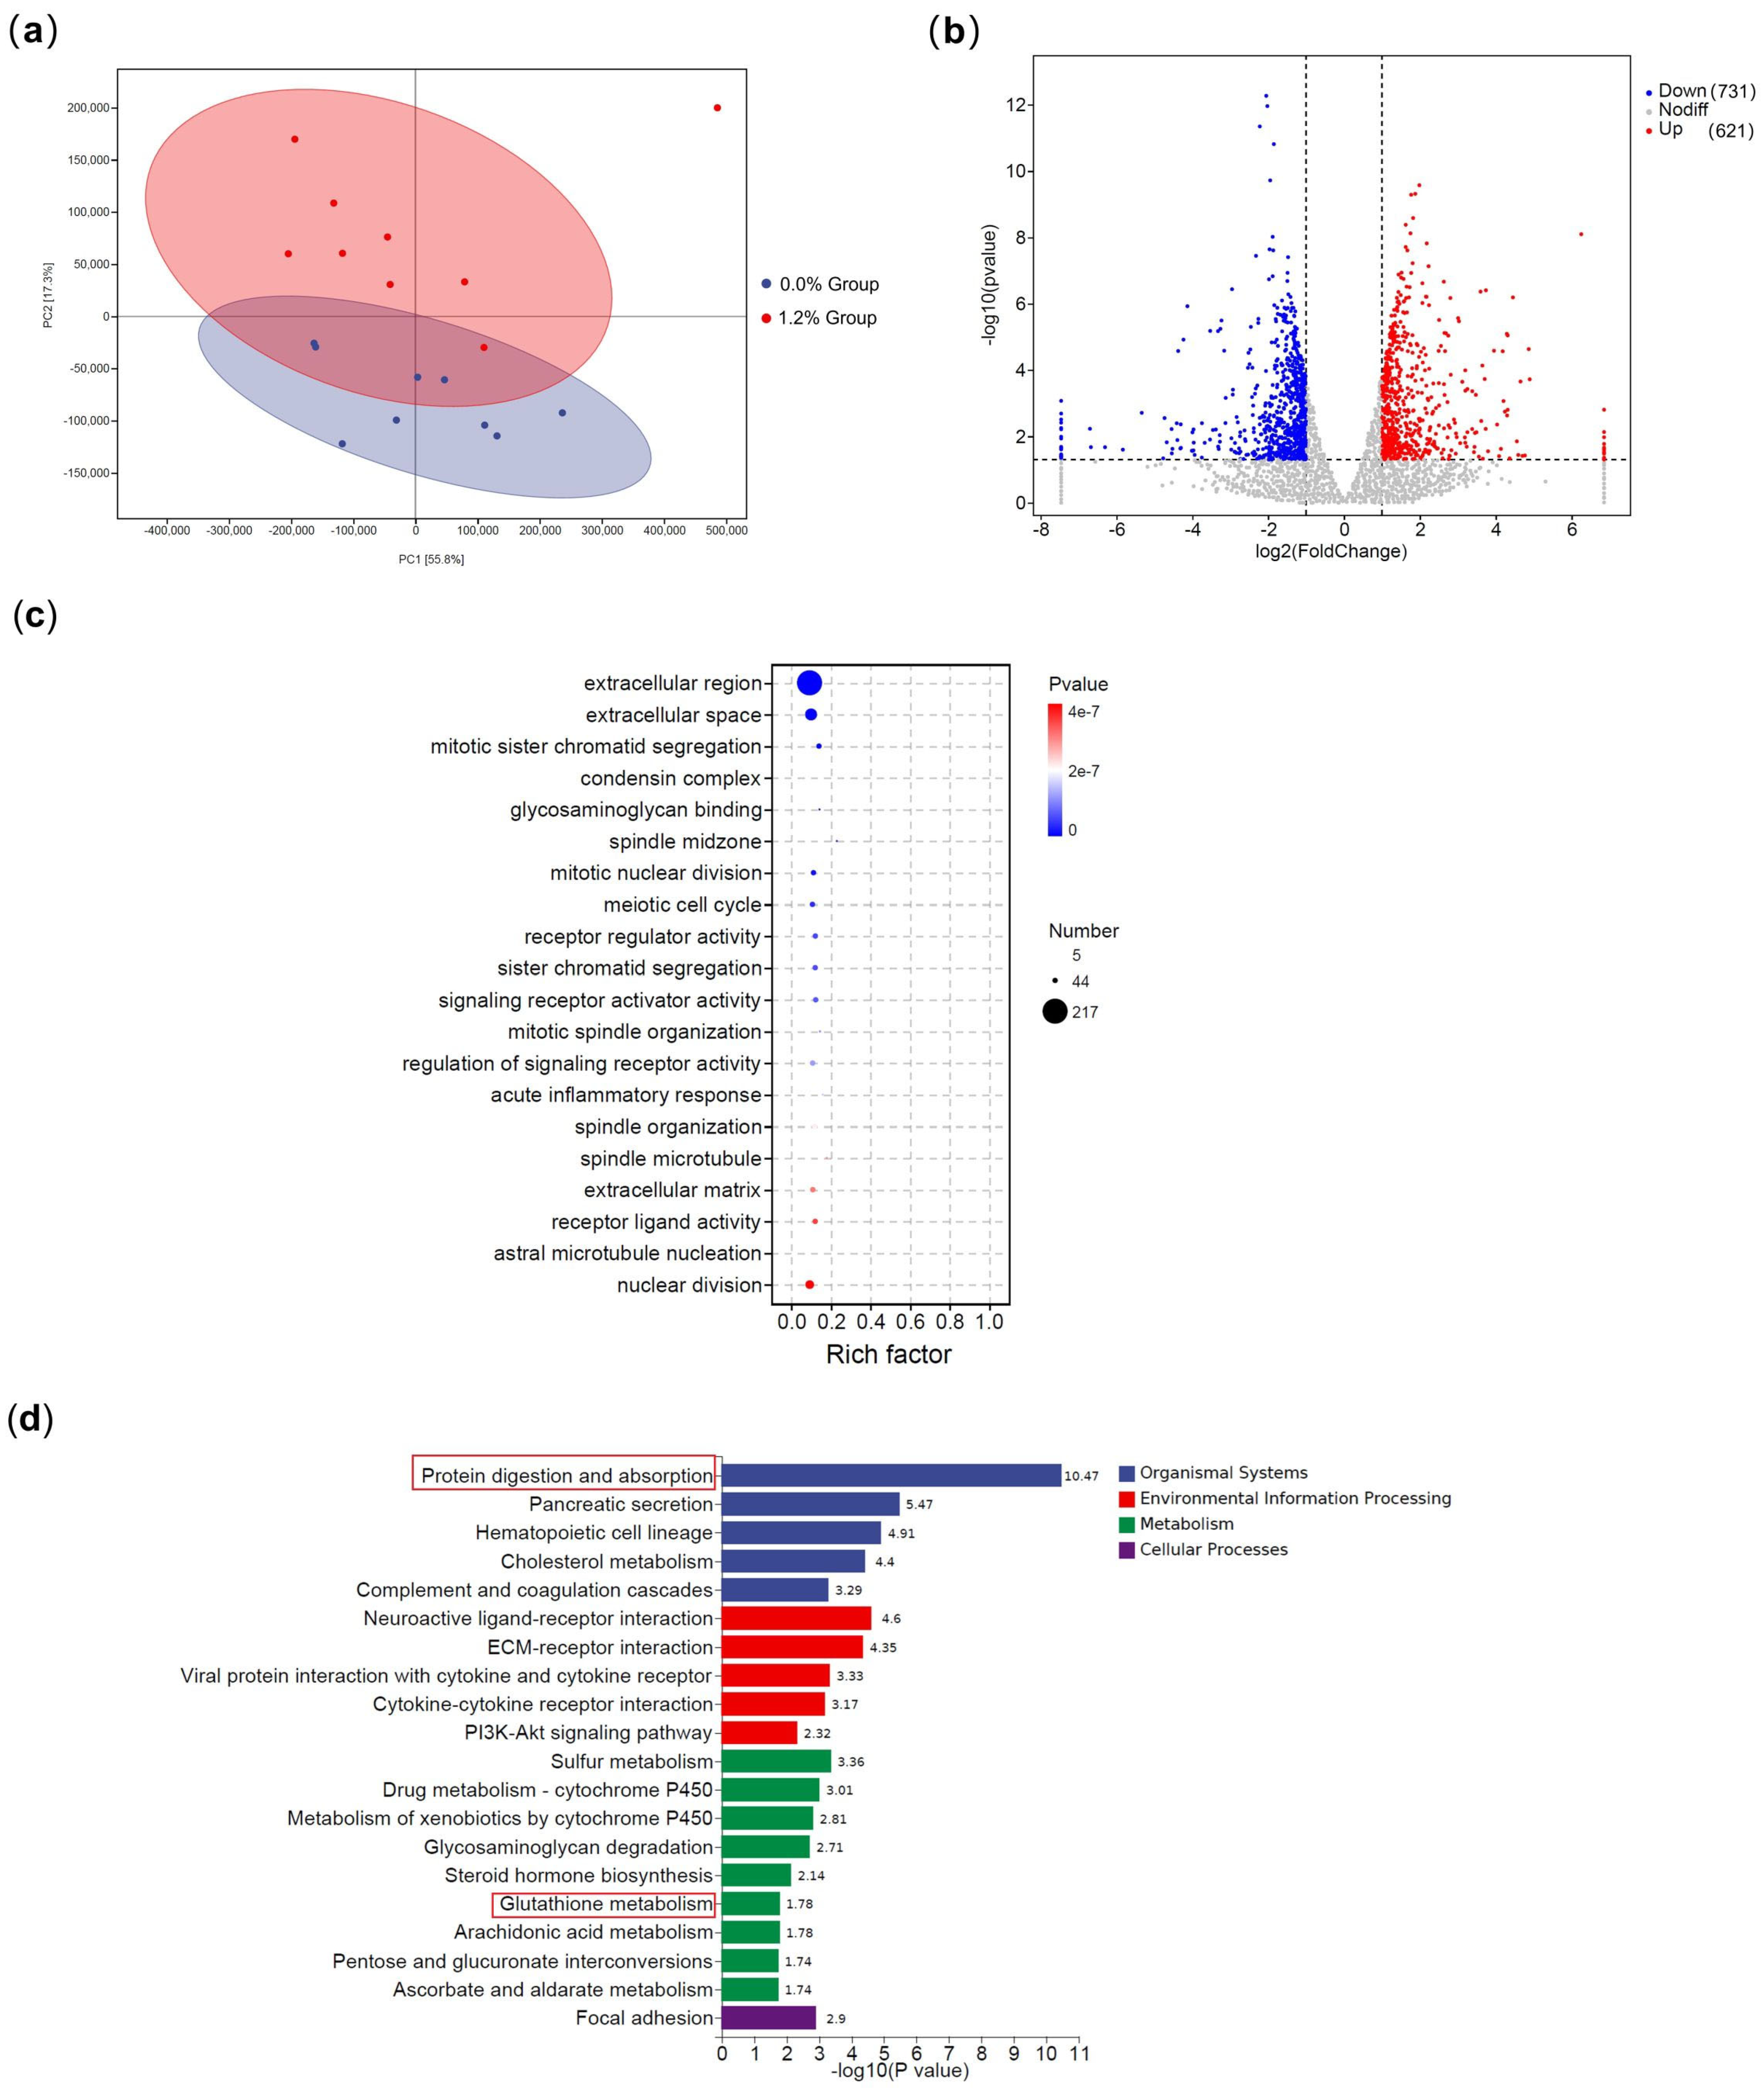
3.6. Transcriptomic Differences Between Groups Fed Diets with Varying Dietary Glutamate Levels

As shown in Table 7 and Figure 3, complete transcriptomic sequencing of all samples was performed, and differential expression analysis was performed using DESeq software. We find different gene functions in Table 7. All datas come from https://www.uniprot.org/uniprotkb/Q764M9/entry (accessed on 11 April 2025) in Table 7 [29].
PCA analysis of different samples showed significant differences between the intestinal tissue samples of the 0% glutamate group and the 1.2% glutamate group (Figure 4a). According to Figure 4b, 614 genes were up-regulated and 620 genes were down-regulated. From the GO analysis, the genes obtained were classified as being enriched in pathways related to biological processes, cellular components, or molecular functions (Figure 4c). There were 10 subclasses involved in biological processes, and the associated Differentially Expressed Genes (DEGs) were significantly enriched in categories such as reproduction, reproductive processes, biological rhythms, and cellular processes. There were a total of six subclasses associated with cellular components, and the associated DEGs were significantly enriched in organelles, cell membrane parts, and cell parts. The experimental group and control group were compared pairwise, and compared to the 0% group; the 1.2% glutamate group had approximately 217 DEGs enriched in extracellular metabolic activity (Figure 4d). There were four subclasses involved in molecular functions, and the DEGs were significantly enriched in glycosaminoglycan binding and receptor regulator activity, signaling receiver activator activity, and receiver light activity. According to the KEGG analysis, the DEGs were annotated to 32 pathways. The DEGs were significantly enriched in signaling pathways such as glutathione metabolism, intestinal protein digestion and absorption, and inflammatory factor receptors. The raw RNA sequencing data were submitted to the NCBI for the Biotechnology Information SRA database (accession numbers of samples: SAMN43755356, SAMN43755357, SAMN43755358, SAMN43755359, SAMN43755360, SAMN43755361, SAMN43755374, SAMN43755375, SAMN43755376, SAMN43755377, SAMN43755378, SAMN43755379).

3.7. Relative mRNA Expression of Little Yellow Croaker

As shown in Figure 5, supplementation with glutamate significantly increased the mRNA expression levels of Cyclic AMP-responsive element-binding protein 1 (Creb1), Glutamine synthetase (GS) activity, Interleukin 10 (IL-10) and B-cell lymphoma-2 (Bcl-2) genes (p < 0.05), which are related to inhibiting apoptosis and. Meanwhile, the mRNA levels of proinflammatory factor Interleukin 6 (IL-6) and its receptor increased with increasing glutamate levels. When the glutamate content reached 1.2%, it was found that dietary glutamate supplementation had a significant effect on the expression of antioxidative genes. gamma-glutamyltranspeptidase (GGT), glutathione hydrolase (GST), and Nuclear factor erythroid 2-related factor 2 (Nrf2) mRNA expression obviously increased when the glutamate content was 1.2% (p < 0.05), while kelch-like ECH-associated protein 1 (Keap1) expression significantly decreased (p < 0.05).

4. Discussion

4.1. Glutamate Improves Growth Performance

Glutamate can enhance the growth performance of fish, with an effective concentration range of 0.8% to 4.0% in species such as tilapia, Jian carp, and Atlantic cod [30,31,32]. The results of this study indicate that a glutamate concentration of 0.4% to 1.2% significantly increased the feed intake, specific growth rate, and survival rate of juvenile little yellow croaker, while reducing the feed conversion rate. Moreover, our research found that the addition of 1.2% glutamate effectively enhanced the activity of lipase, trypsin, pepsin, and α-amylase in the intestines. This is consistent with the feeding effects of glutamate in rainbow trout and Jian carp [7,33]. During the juvenile stage, the digestive system of fish is not fully developed, and digestive enzymes can break down nutrients from their complex polymeric structures into smaller, more digestible components [34,35,36]. Therefore, the intake of glutamate may enhance the activity of digestive enzymes, increase intestinal digestive capacity, and thereby improve growth performance. Studies in other fish have also shown that glutamate catabolism contributes to about 80% of ATP production in the proximal intestine [37,38]. Glutamine is an important intermediate in the metabolism of glutamate to produce ATP. In our study, it was found that the addition of 1.2% glutamate in the diet significantly increased the expression of the glutamine synthetase (glutamine synthetase, GS) gene, which may synthesize more glutamine to supply the growth and development of cells [39,40]. Studies have also found that glutamate can bind to taste receptor family 1 member 1 (T1R1) and T1R3 on the tongue and in the intestines, increasing the feeding of fish [41,42,43]. However, we also found that excessive glutamate reduced growth. The result is consistent with studies in fish, mammals, and poultry [30,44,45,46]. For a long time, excessive intake of glutamate has been considered to cause metabolic disorders, obesity, decreased immune capacity, and damage to the kidneys and liver in humans and animals [47,48,49]. This may explain why 2.0% glutamate leads to reduced growth performance. The specific reasons need further argumentation.

4.2. Glutamate Improved Intestinal Morphology

The structural integrity of the intestines directly affects the nutrient absorption of juvenile little yellow croaker [50,51,52]. Previous studies have shown that excessive reduction in dietary protein levels can cause intestinal damage in fish [18,53,54]. In this study, it was found that the intestines of the 0% group little yellow croaker showed obvious damage, with rough intestinal edges and shortened villi. After the addition of 1.2% glutamate to the diet, the height of the intestinal villi and the muscle thickness of the little yellow croaker were significantly improved. Our investigation revealed pronounced intestinal pathology in the 0% glutamate cohort, characterized by mucosal surface irregularities, villus truncation, and compromised structural organization. Dietary supplementation with 1.2% glutamate significantly enhanced key morphological parameters, including villus height and muscularis layer thickness, indicating trophic effects on the intestinal mucosa. In the transcriptome results, it was found that the supplementation of 1.2% glutamate reduced the expression of pro-inflammatory factor IL-6 and its receptor, up-regulated the expression of anti-inflammatory factor IL-10, anti-apoptotic gene Bcl-2, and cell growth-promoting gene Creb1. Previous studies have found that glutamate can improve the expression of inflammatory factors in animals such as grass carp [55,56], but the effects on Bcl-2 and Creb1 are not clear. Ma’s study found that the expression of anti-apoptotic protein Bcl-2 in mouse hippocampal HT22 nerve cells treated with glutamate was significantly increased, alleviating cell apoptosis [57]. It has also been found that glutamate can affect the phosphorylation state of creb1 through metabotropic glutamate receptors (mGluRs) [58]. This study suggests that glutamate may affect the morphology of fish intestines by influencing the expression of Creb1 and Bcl-2.

4.3. Glutamate Increases Antioxidative Capability

Enhancing the activity of antioxidant enzymes is beneficial in alleviating intestinal damage [38,59]. In the study of grass carp, the addition of 0.8–1.6% Glu in the diet can increase the activity of CAT, T-SOD, and GSH in the intestines, and reduce MDA [60]. When the content of MDA is low, the intestines can absorb GSH from other organs to protect the body from oxidative damage [61]. This study shows that the supplementation of 0.40–1.60% glutamate can enhance the activity of antioxidant enzymes in juvenile little yellow croaker, with the most significant increase at 1.2%. The optimal concentration may be lower than that used in Zhao’s study because the grass carp used by Zhao were adult fish. In our study, it was also found that the supplementation of 1.20% glutamate could effectively up-regulate the expression of gamma-glutamyltranspeptidase/glutathione hydrolase (γ-glutamyl transpeptidase, GGT), glutathione hydrolase (glutathione hydrolase, GST) and Nrf2 genes, and down-regulate the expression of Keap1 gene, indicating that glutamate can activate the antioxidant capacity of the intestines. Nrf2-Keap1 is a key factor in regulating antioxidants [62]. When there are too many oxygen free radicals, the binding of Keap1 and Nrf2 is destroyed, and Nrf2 enters the cell nucleus to activate the expression of SOD, CAT, and GSH-related enzymes [63]. GGT can promote the synthesis and decomposition of GSH. GST is the key enzyme that initiates the GSH conjugation reaction, which can catalyze the combination of GSH with a variety of electrophilic compounds, thereby protecting cells from oxidative damage [64,65]. Therefore, the addition of 1.2% glutamate can effectively activate the genes in the Nrf2 antioxidant pathway to enhance the antioxidant capacity of little yellow croaker intestines. This is similar to the results of Jiang’s previous study. The enhancement of antioxidant enzyme encoding gene expression by glutamate may be partly due to the activation of the Nrf2 signaling pathway by inhibiting the expression of the Keap1 gene, thereby promoting the nuclear translocation of Nrf2 and activating the Nrf2 signaling pathway.

5. Conclusions

The present study found that the addition of 1.2% glutamate significantly enhanced the growth performance, antioxidant capacity, and digestive ability of juvenile little yellow croaker under a 44% protein diet. Additionally, it was observed that feeding with 1.2% glutamate up-regulated the expression of GGT and GST in the intestines of little yellow croaker, thereby promoting the synthesis of GSH and alleviating intestinal cell apoptosis. Future research will further investigate the effects of glutamate on intestinal function at the cellular level.

Author Contributions

R.L.: Investigation, Conceptualization, Methodology, Formal analysis, Writing—original draft, Project administration, Writing—review & editing. Y.Z. and X.L.: Investigation, Data curation, Writing—original draft, Visualization. B.L. and J.Z.: Supervision, Funding acquisition, Writing—review & editing. All authors have read and agreed to the published version of the manuscript.

Funding

This study was financially supported by the Key Technologies R&D Program of Ningbo, China (2021Z081).

Institutional Review Board Statement

Institutional Review Board Statement: Experimental protocols, fish management, and rearing procedures adopted in the feeding trial were approved in advance by the Institutional Animal Care and Use Committee of the Zhejiang Academy of Agriculture Science. Approval Code: 25ZALAS13; Approval Date: 17 March 2025.

Data Availability Statement

Data are contained within the article.

Conflicts of Interest

The authors declare no conflicts of interest.

References

  1. Mangia, S.; Giove, F.; Dinuzzo, M. Metabolic Pathways and Activity-Dependent Modulation of Glutamate Concentration in the Human Brain. Neurochem. Res. 2012, 37, 2554–2561. [Google Scholar] [CrossRef] [PubMed]
  2. Zhu, M.; Lai, W.; Yao, L.; Xu, E.; Chen, X.; Zhang, Y.Y.; Li, X.G. Glutamine Regulates Gene Expression Profiles to Increase the Proliferation of Porcine Intestinal Epithelial Cells and the Expansion of Intestinal Stem Cells. Animals 2023, 13, 2917. [Google Scholar] [CrossRef] [PubMed]
  3. Carvalho, P.L.P.F.; Xavier, W.d.S.; Guimarães, M.G.; Rodrigues, E.J.D.; Furuya, W.M.; Yamamoto, F.Y.; Pezzato, L.E.; Gatlin, D.M.; Barros, M.M. Dietary Glutamine Improves Growth and Intestinal Morphology of Juvenile Gift Tilapia (Oreochromis niloticus) but Has Limited Effects on Innate Immunity and Antioxidant Capacity. Aquaculture 2023, 563, 738976. [Google Scholar] [CrossRef]
  4. Jomova, K.; Raptova, R.; Alomar, S.Y.; Alwasel, S.H.; Nepovimova, E.; Kuca, K.; Valko, M. Reactive Oxygen Species, Toxicity, Oxidative Stress, and Antioxidants: Chronic Diseases and Aging. Arch. Toxicol. 2023, 97, 2499–2574. [Google Scholar]
  5. Gisbert, E.; Giménez, G.; Fernández, I.; Kotzamanis, Y.; Estévez, A. Development of Digestive Enzymes in Common Dentex Dentex Dentex During Early Ontogeny. Aquaculture 2008, 287, 381–387. [Google Scholar] [CrossRef]
  6. Zhao, Y.; Li, J.-Y.; Yin, L.; Feng, L.; Liu, Y.; Jiang, W.-D.; Wu, P.; Zhao, J.; Chen, D.-F.; Zhou, X.-Q.; et al. Effects of Dietary Glutamate Supplementation on Flesh Quality, Antioxidant Defense and Gene Expression Related to Lipid Metabolism and Myogenic Regulation in Jian Carp (Cyprinus carpio var. Jian). Aquaculture 2019, 502, 212–222. [Google Scholar] [CrossRef]
  7. Zhelyazkov, G.; Stratev, D. Effect of Monosodium Glutamate on Growth Performance and Blood Biochemical Parameters of Rainbow Trout (Oncorhynchus mykiss W.). Vet. World 2019, 12, 1008–1012. [Google Scholar] [CrossRef]
  8. Caballero-Solares, A.; Viegas, I.; Salgado, M.C.; Siles, A.M.; Sáez, A.; Metón, I.; Baanante, I.V.; Fernández, F. Diets Supplemented with Glutamate or Glutamine Improve Protein Retention and Modulate Gene Expression of Key Enzymes of Hepatic Metabolism in Gilthead Seabream (Sparus aurata) Juveniles. Aquaculture 2015, 444, 79–87. [Google Scholar] [CrossRef]
  9. Oehme, M.; Grammes, F.; Takle, H.; Zambonino-Infante, J.-L.; Refstie, S.; Thomassen, M.S.; Rørvik, K.-A.; Terjesen, B.F. Dietary Supplementation of Glutamate and Arginine to Atlantic Salmon (Salmo Salar L.) Increases Growth During the First Autumn in Sea. Aquaculture 2010, 310, 156–163. [Google Scholar] [CrossRef]
  10. Dong, B.; Wu, L.; Wang, Y.; Han, D.; Liu, H.; Zhu, X.; Yang, Y.; Xie, S.; Liu, Z.; Jin, J. Glutamate Improves Flesh Quality and Muscle Growth of Triploid Crucian Carp. Aquac. Rep. 2023, 33, 101832. [Google Scholar] [CrossRef]
  11. Zhao, B.; Zhao, J.; Liu, H.; Zhang, H.; Shan, H.; Zong, J.; Cao, Q.; Jiang, J. Impact of Dietary Glutamate on Growth Performance and Flesh Quality of Largemouth Bass. Fishes 2025, 10, 151. [Google Scholar] [CrossRef]
  12. Song, X.; Hu, F.; Xu, M.; Zhang, Y.; Jin, Y.; Gao, X.; Liu, Z.; Ling, J.; Li, S.; Cheng, J. Spatiotemporal Distribution and Dispersal Pattern of Early Life Stages of the Small Yellow Croaker (Larimichthys polyactis) in the Southern Yellow Sea. Diversity 2024, 16, 521. [Google Scholar] [CrossRef]
  13. Song, D.; Xiong, Y.; Kang, Z.; Liang, L.; Wu, X.; Li, D.; Liu, D. Population Connectivity of Small Yellow Croaker (Larmichthys polyactis) in the Southern Yellow Sea: Implications from Multiple Otolith-Based Approaches. Fish. Res. 2024, 276, 107064. [Google Scholar] [CrossRef]
  14. Wang, J.; Wang, L.; Liu, Y.; Du, C.; Hou, C.; Xie, Q.; Tang, D.; Liu, F.; Lou, B.; Zhu, J. Change to the Transcriptomic Profile, Oxidative Stress, Apoptotic and Immunity in the Liver of Small Yellow Croaker (Larimichthys polyactis) under Hypoxic Stress. Aquaculture 2023, 576, 739854. [Google Scholar] [CrossRef]
  15. Chu, T.; Liu, F.; Qin, G.; Zhan, W.; Wang, M.; Lou, B. Transcriptome Analysis of the Larimichthys polyactis under Heat and Cold Stress. Cryobiology 2020, 96, 175–183. [Google Scholar] [CrossRef]
  16. Zhang, X.; Tang, X.; Xu, J.; Zheng, Y.; Lin, J.; Zou, H. Transcriptome Analysis Reveals Dysfunction of the Endoplasmic Reticulum Protein Processing in the Sonic Muscle of Small Yellow Croaker (Larimichthys polyactis) Following Noise Exposure. Mar. Environ. Res. 2024, 194, 106299. [Google Scholar] [CrossRef]
  17. Sumithra, T.G.; Sharma, S.R.K.; Suresh, G.; Suja, G.; Prasad, V.; Gop, A.P.; Patil, P.K.; Gopalakrishnan, A. Gut Microbes of a High-Value Marine Fish, Snubnose Pompano (Trachinotus blochii) Are Resilient to Therapeutic Dosing of Oxytetracycline. Sci. Rep. 2024, 14, 27949. [Google Scholar] [CrossRef]
  18. Alfonso, S.; Mente, E.; Fiocchi, E.; Manfrin, A.; Dimitroglou, A.; Papaharisis, L.; Barkas, D.; Toomey, L.; Boscarato, M.; Losasso, C.; et al. Growth Performance, Gut Microbiota Composition, Health and Welfare of European Sea Bass (Dicentrarchus labrax) Fed an Environmentally and Economically Sustainable Low Marine Protein Diet in Sea Cages. Sci. Rep. 2023, 13, 21269. [Google Scholar] [CrossRef]
  19. Liu, C.; Zhao, L.P.; Shen, Y.Q. A Systematic Review of Advances in Intestinal Microflora of Fish. Fish Physiol. Biochem. 2021, 47, 2041–2053. [Google Scholar] [CrossRef]
  20. Luise, D.; Correa, F.; Chalvon-Demersay, T.; Galosi, L.; Rossi, G.; Lambert, W.; Bosi, P.; Trevisi, P. Supplementation of Mixed Doses of Glutamate and Glutamine Can Improve the Growth and Gut Health of Piglets During the First 2 Weeks Post-Weaning. Sci. Rep. 2022, 12, 14533. [Google Scholar] [CrossRef]
  21. Yvon, S.; Beaumont, M.; Dayonnet, A.; Eutamène, H.; Lambert, W.; Tondereau, V.; Chalvon-Demersay, T.; Belloir, P.; Paës, C. Effect of Diet Supplemented with Functional Amino Acids and Polyphenols on Gut Health in Broilers Subjected to a Corticosterone-Induced Stress. Sci. Rep. 2024, 14, 1032. [Google Scholar] [CrossRef] [PubMed]
  22. Fantatto, R.R.; Mota, J.; Ligeiro, C.; Vieira, I.; Guilgur, L.G.; Santos, M.; Murta, D. Exploring Sustainable Alternatives in Aquaculture Feeding: The Role of Insects. Aquac. Rep. 2024, 37, 102228. [Google Scholar] [CrossRef]
  23. Vodounnou, J.V.; Iko, R.; Okou, G.; Kpogue, D.; Ahouansou Montcho, S.; Micha, J.-C. Complete Substitution of Fish Meal with Black Soldier Flies Hermetia illucens (L. 1758) Larvae Meal at Varying Incorporation Rates for Feeding Oreochromis niloticus Raised in Captivity. Aquac. Sci. Manag. 2025, 2, 1. [Google Scholar] [CrossRef]
  24. Ma, B.; Wang, L.; Lou, B.; Tan, P.; Xu, D.; Chen, R. Dietary Protein and Lipid Levels affect The Growth Performance, Intestinal Digestive Enzyme Activities and Related Genes Expression of Juvenile Small Yellow Croaker (Larimichthys polyactis). Aquac. Rep. 2020, 17, 100403. [Google Scholar] [CrossRef]
  25. Yu, Z.; Xiao, L.; Wei, Z.; Mingming, H.; Feng, L.; Qingping, X.; Dandan, G.; Lin, C.; Bao, L. Effects of Dietary Protein Levels on Growth Performance, Muscle Composition and Fiber Recruitment of Juvenile Small Yellow Croaker (Larimichthys polyactis). Aquac. Rep. 2022, 27, 101335. [Google Scholar]
  26. Li, X.; Zheng, S.; Cheng, K.; Ma, X.; Wu, G. Use of Alternative Protein Sources for Fishmeal Replacement in the Diet of Largemouth Bass (Micropterus salmoides). Part II: Effects of Supplementation with Methionine or Taurine on Growth, Feed Utilization, and Health. Amino Acids 2021, 53, 49–62. [Google Scholar] [CrossRef]
  27. Young, T.; Walker, S.P.; Alfaro, A.C.; Fletcher, L.M.; Murray, J.S.; Lulijwa, R.; Symonds, J. Impact of Acute Handling Stress, Anaesthesia, and Euthanasia on Fish Plasma Biochemistry: Implications for Veterinary Screening and Metabolomic Sampling. Fish Physiol. Biochem. 2019, 45, 1485–1494. [Google Scholar] [CrossRef]
  28. Flores, C.F.Y.; de Las Mercedes Hurtado Pineda, Á.; Bonilla, V.M.C.; Sáenz-Flor, K. Sample Management: Stability of Plasma and Serum on Different Storage Conditions. Ejifcc 2020, 31, 46–55. [Google Scholar]
  29. Q764M9 CXCR4_PIG. Available online: https://www.uniprot.org/uniprotkb/Q764M9/entry (accessed on 9 March 2025).
  30. Wang, M.; Li, E.; Huang, Y.; Liu, W.; Wang, S.; Li, W.; Chen, L.; Wang, X. Dietary Supplementation with Glutamate Enhanced Antioxidant Capacity, Ammonia Detoxification and Ion Regulation Ability in Nile Tilapia (Oreochromis niloticus) Exposed to Acute Alkalinity Stress. Aquaculture 2025, 594, 741360. [Google Scholar] [CrossRef]
  31. Ingebrigtsen, I.A.; Berge, G.M.; Ruyter, B.; Kjær, M.A.; Mørkøre, T.; Sørensen, M.; Gjøen, T. Growth and Quality of Atlantic Cod (Gadus morhua) Fed with High and Low Fat Diets Supplemented with Glutamate. Aquaculture 2014, 433, 367–376. [Google Scholar] [CrossRef]
  32. Li, X.; Zheng, S.; Wu, G. Nutrition and Metabolism of Glutamate and Glutamine in Fish. Amino Acids 2020, 52, 671–691. [Google Scholar] [CrossRef] [PubMed]
  33. Zhao, Y.; Zhang, T.-R.; Li, Q.; Feng, L.; Liu, Y.; Jiang, W.-D.; Wu, P.; Zhao, J.; Zhou, X.-Q.; Jiang, J. Effect of Dietary L-Glutamate Levels on Growth, Digestive and Absorptive Capability, and Intestinal Physical Barrier Function in Jian Carp (Cyprinus carpio var. Jian). Anim. Nutr. 2020, 6, 198–209. [Google Scholar] [CrossRef] [PubMed]
  34. Cahu, C.; Zambonino Infante, J. Substitution of Live Food by Formulated Diets in Marine Fish Larvae. Aquaculture 2001, 200, 161–180. [Google Scholar] [CrossRef]
  35. García-Meilán, I.; Ordóñez-Grande, B.; Valentín, J.M.; Fontanillas, R.; Gallardo, Á. High Dietary Carbohydrate Inclusion by Both Protein and Lipid Replacement in Gilthead Sea Bream. Changes in Digestive and Absorptive Processes. Aquaculture 2020, 520, 734977. [Google Scholar] [CrossRef]
  36. Ullah, S.; Feng, F.; Zhao, M.; Zhang, J.; Shao, Q. Effect of Dietary Supplementation of Lauric Acid on Growth Performance, Digestive Enzymes, Serum Immune and Antioxidant Parameters, and Intestinal Morphology in Black Sea Bream. Fish Physiol. Biochem. 2025, 51, 43. [Google Scholar] [CrossRef]
  37. Sichao, J.; Xinyu, L.; Shixuan, Z.; Guoyao, W. Amino Acids Are Major Energy Substrates for Tissues of Hybrid Striped Bass and Zebrafish. Amino Acids 2017, 49, 2053–2063. [Google Scholar]
  38. Xinyu, L.; Zheng, S.; Sichao, J.; Fei, S.; Chuanpeng, Z.; Guoyao, W. Oxidation of Energy Substrates in Tissues of Largemouth Bass (Micropterus salmoides). Amino Acids 2020, 52, 1017–1032. [Google Scholar]
  39. Xuan, D.T.M.; Wu, C.C.; Wang, W.J.; Hsu, H.P.; Ta, H.D.K.; Anuraga, G.; Chiao, C.C.; Wang, C.Y. Glutamine Synthetase Regulates the Immune Microenvironment and Cancer Development through the Inflammatory Pathway. Int. J. Med. Sci. 2023, 20, 35–49. [Google Scholar] [CrossRef]
  40. Hu, T.; Wu, J.; Lin, Z.; Lin, Y.; Lin, L.; Wei, W.; Wei, D. The Impact of Glutamine Synthetase Pbgsa on the Growth, Conidiation and Mycophenolic Acid Production of Penicillium Brevicompactum. Fungal Genet. Biol. 2024, 175, 103941. [Google Scholar] [CrossRef]
  41. Simon, B.R.; Learman, B.S.; Parlee, S.D.; Scheller, E.L.; Mori, H.; Cawthorn, W.P.; Ning, X.; Krishnan, V.; Ma, Y.L.; Tyrberg, B.; et al. Sweet Taste Receptor Deficient Mice Have Decreased Adiposity and Increased Bone Mass. PLoS ONE 2014, 9, e86454. [Google Scholar] [CrossRef]
  42. Xie, S.Z.; Yang, G.; Jiang, X.M.; Qin, D.Y.; Li, Q.M.; Zha, X.Q.; Pan, L.H.; Jin, C.S.; Luo, J.P. Polygonatum Cyrtonema Hua Polysaccharide Promotes Glp-1 Secretion from Enteroendocrine L-Cells through Sweet Taste Receptor-Mediated Camp Signaling. J. Agric. Food Chem. 2020, 68, 6864–6872. [Google Scholar] [CrossRef] [PubMed]
  43. Toda, Y.; Hayakawa, T.; Itoigawa, A.; Kurihara, Y.; Nakagita, T.; Hayashi, M.; Ashino, R.; Melin, A.D.; Ishimaru, Y.; Kawamura, S.; et al. Evolution of the Primate Glutamate Taste Sensor from a Nucleotide Sensor. Curr. Biol. 2021, 31, 4641–4649.e5. [Google Scholar] [CrossRef] [PubMed]
  44. Jiang, J.; Shi, D.; Zhou, X.Q.; Yin, L.; Feng, L.; Liu, Y.; Jiang, W.D.; Zhao, Y. Effects of Glutamate on Growth, Antioxidant Capacity, and Antioxidant-Related Signaling Molecule Expression in Primary Cultures of Fish Enterocytes. Fish Physiol. Biochem. 2015, 41, 1143–1153. [Google Scholar] [CrossRef] [PubMed]
  45. Rezaei, R.; Knabe, D.A.; Tekwe, C.D.; Dahanayaka, S.; Ficken, M.D.; Fielder, S.E.; Eide, S.J.; Lovering, S.L.; Wu, G. Dietary Supplementation with Monosodium Glutamate Is Safe and Improves Growth Performance in Postweaning Pigs. Amino Acids 2013, 44, 911–923. [Google Scholar] [CrossRef]
  46. Maruyama, K.; Sunde, M.L.; Harper, A.E. Is L-Glutamic Acid Nutritionally a Dispensable Amino Acid for the Young Chick? Poult. Sci. 1976, 55, 45–60. [Google Scholar] [CrossRef]
  47. Zanfirescu, A.; Ungurianu, A.; Tsatsakis, A.M.; Nițulescu, G.M.; Kouretas, D.; Veskoukis, A.; Tsoukalas, D.; Engin, A.B.; Aschner, M.; Margină, D. A Review of the Alleged Health Hazards of Monosodium Glutamate. Compr. Rev. Food Sci. Food Saf. 2019, 18, 1111–1134. [Google Scholar] [CrossRef]
  48. Acikel-Elmas, M.; Algilani, S.A.; Sahin, B.; Bingol Ozakpinar, O.; Gecim, M.; Koroglu, K.; Arbak, S. Apocynin Ameliorates Monosodium Glutamate Induced Testis Damage by Impaired Blood-Testis Barrier and Oxidative Stress Parameters. Life 2023, 13, 822. [Google Scholar] [CrossRef]
  49. Kayode, O.T.; Bello, J.A.; Oguntola, J.A.; Kayode, A.A.A.; Olukoya, D.K. The Interplay between Monosodium Glutamate (Msg) Consumption and Metabolic Disorders. Heliyon 2023, 9, e19675. [Google Scholar] [CrossRef]
  50. Jiao, F.; Zhang, L.; Limbu, S.M.; Yin, H.; Xie, Y.; Yang, Z.; Shang, Z.; Kong, L.; Rong, H. A Comparison of Digestive Strategies for Fishes with Different Feeding Habits: Digestive Enzyme Activities, Intestinal Morphology, and Gut Microbiota. Ecol. Evol. 2023, 13, e10499. [Google Scholar] [CrossRef]
  51. Sitjà-Bobadilla, A.; Gil-Solsona, R.; Estensoro, I.; Piazzon, M.C.; Martos-Sitcha, J.A.; Picard-Sánchez, A.; Fuentes, J.; Sancho, J.V.; Calduch-Giner, J.A.; Hernández, F.; et al. Disruption of Gut Integrity and Permeability Contributes to Enteritis in a Fish-Parasite Model: A Story Told from Serum Metabolomics. Parasites Vectors 2019, 12, 486. [Google Scholar] [CrossRef]
  52. Painefilú, J.C.; Bianchi, V.A.; Krock, B.; De Anna, J.S.; Kristoff, G.; Luquet, C.M. Effects of Paralytic Shellfish Toxins on the Middle Intestine of Oncorhynchus mykiss: Glutathione Metabolism, Oxidative Status, Lysosomal Function and Atp-Binding Cassette Class C (Abcc) Proteins Activity. Ecotoxicol. Environ. Saf. 2020, 204, 111069. [Google Scholar] [CrossRef] [PubMed]
  53. Zheng, X.; Liu, B.; Wang, N.; Yang, J.; Zhou, Q.; Sun, C.; Zhao, Y. Low Fish Meal Diet Supplemented with Probiotics Ameliorates Intestinal Barrier and Immunological Function of Macrobrachium rosenbergii Via the Targeted Modulation of Gut Microbes and Derived Secondary Metabolites. Front. Immunol. 2022, 13, 1074399. [Google Scholar] [CrossRef] [PubMed]
  54. Serra, V.; Pastorelli, G.; Tedesco, D.E.A.; Turin, L.; Guerrini, A. Alternative Protein Sources in Aquafeed: Current Scenario and Future Perspectives. Vet. Anim. Sci. 2024, 25, 100381. [Google Scholar] [CrossRef] [PubMed]
  55. Zheng, X.; Zhu, Y.; Zhao, Z.; Chu, Y.; Yang, W. The Role of Amino Acid Metabolism in Inflammatory Bowel Disease and Other Inflammatory Diseases. Front. Immunol. 2023, 14, 1284133. [Google Scholar] [CrossRef]
  56. Jiang, J.; Yin, L.; Li, J.-Y.; Li, Q.; Shi, D.; Feng, L.; Liu, Y.; Jiang, W.-D.; Wu, P.; Zhao, Y.; et al. Glutamate Attenuates Lipopolysaccharide-Induced Oxidative Damage and Mrna Expression Changes of Tight Junction and Defensin Proteins, Inflammatory and Apoptosis Response Signaling Molecules in the Intestine of Fish. Fish Shellfish Immunol. 2017, 70, 473–484. [Google Scholar] [CrossRef]
  57. Ma, Y.-M.; Ibeanu, G.; Wang, L.-Y.; Zhang, J.-Z.; Chang, Y.; Dong, J.-D.; Li, P.A.; Jing, L. Selenium Suppresses Glutamate-Induced Cell Death and Prevents Mitochondrial Morphological Dynamic Alterations in Hippocampal Ht22 Neuronal Cells. BMC Neurosci. 2017, 18, 15. [Google Scholar] [CrossRef]
  58. Wang, L.; Tang, X.; Liang, P.; Zhou, C.; Sun, Y.; Liang, Y. Correlation between Variants of the Creb1 and Grm7 Genes and Risk of Depression. BMC Psychiatry 2023, 23, 3. [Google Scholar] [CrossRef]
  59. Taysı, M.R. Assessing the Effects of Cadmium on Antioxidant Enzymes and Histological Structures in Rainbow Trout Liver and Kidney. Sci. Rep. 2024, 14, 27453. [Google Scholar] [CrossRef]
  60. Zhao, Y.; Hu, Y.; Zhou, X.-Q.; Zeng, X.-Y.; Feng, L.; Liu, Y.; Jiang, W.-D.; Li, S.-H.; Li, D.-B.; Wu, X.-Q.; et al. Effects of Dietary Glutamate Supplementation on Growth Performance, Digestive Enzyme Activities and Antioxidant Capacity in Intestine of Grass Carp (Tenopharyngodon idella). Aquac. Nutr. 2015, 21, 935–941. [Google Scholar] [CrossRef]
  61. Wang, Y.; Chen, Y.; Zhang, X.; Lu, Y.; Chen, H. New Insights in Intestinal Oxidative Stress Damage and the Health Intervention Effects of Nutrients: A Review. J. Funct. Foods 2020, 75, 104248. [Google Scholar] [CrossRef]
  62. Banerjee, P.; Wang, Y.; Carnevale, L.N.; Patel, P.; Raspur, C.K.; Tran, N.; Zhang, X.; Natarajan, R.; Roberts, A.J.; Baran, P.S.; et al. diAcCA, a Pro-Drug for Carnosic Acid That Activates the Nrf2 Transcriptional Pathway, Shows Efficacy in the 5xFAD Transgenic Mouse Model of Alzheimer’s Disease. Antioxidants 2025, 14, 293. [Google Scholar] [CrossRef] [PubMed]
  63. Yu, C.; Xiao, J.H. The Keap1-Nrf2 System: A Mediator between Oxidative Stress and Aging. Oxid. Med. Cell. Longev. 2021, 2021, 6635460. [Google Scholar] [CrossRef] [PubMed]
  64. Bartolini, D.; Stabile, A.M.; Migni, A.; Gurrado, F.; Lioci, G.; De Franco, F.; Mandarano, M.; Svegliati-Baroni, G.; Di Cristina, M.; Bellezza, G.; et al. Subcellular Distribution and Nrf2/Keap1-Interacting Properties of Glutathione S-Transferase P in Hepatocellular Carcinoma. Arch. Biochem. Biophys. 2024, 757, 110043. [Google Scholar] [CrossRef] [PubMed]
  65. Britten, R.A.; Green, J.A.; Warenius, H.M. Cellular Glutathione (Gsh) and Glutathione S-Transferase (Gst) Activity in Human Ovarian Tumor Biopsies Following Exposure to Alkylating Agents. Int. J. Radiat. Oncol. Biol. Phys. 1992, 24, 527–531. [Google Scholar] [CrossRef]
Figure 1. The relationships between dietary glutamate content (GC) and weight gain rate (WGR), specific growth rate (SGR), feed conversion rate (FCR), and protein efficiency ratio (PER): (a) The relationships between dietary GC and WGR. The regression equation was described as WGR = −16.34GC2 + 38.39GC + 17.37 (0.0 ≤ GC ≤ 2.0, R2 = 0.4847). (b) The relationships between dietary GC and SGR. The regression equation was described as SGR = −0.2291GC2 + 0.5354GC + 0.2709 (0.0 ≤ GC ≤ 2.0, R2 = 0.8613). (c) The relationships between dietary GC and FCR. The regression equation was described as FCR = 0.1261GC2 − 0.2926GC+ 1.773 (0.0 ≤ GC ≤ 2.0, R2 = 0.8615), FCR = 0.01409PL + 0.6704 (46.40 < PL ≤ 52.50, R2 = 0.9845). (d) The relationships between dietary GC and PER. The regression equation was described as PER = −0.2732GC2 + 0.5523GC + 1.540 (R2 = 0.8478) (n = 3 cages).
Fishes 10 00188 g001
Figure 2. Effects of different content Glu on the intestine tissue structure of juvenile L. polyactis. Intestine sample of 0.0–2.0% at 100×, Bar = 100 μm.
Fishes 10 00188 g002
Figure 4. Transcriptome analysis results in intestines of juvenile L. polyactis: (a) PCA analysis between Group 0%_VS_1.2%. (b) Gene ontology (GO) annotation analysis of differentially expressed genes (DEGs). (c) GO enrichment analyses of DEGs. The names of the GO categories are listed along the Y-axis, and the horizontal axis indicates the number of genes. (d) KEGG pathway enrichment analysis of the DEGs. The horizontal axis indicates the number of genes, and the Y-axis represents the enriched pathways. The length of the bar signifies the number of DEGs, and the depth of the bar color represents the p-value in the corresponding pathway, with p < 0.05 considered as significant enrichment.
Fishes 10 00188 g004
Figure 5. Relative expression level of genes of juvenile L. polyactis fed different dietary glutamate levels diets: (a) The relative mRNA expression level of GS in the group 0.0% and 1.2%. (b) The relative mRNA expression level of IL-6, IL-6R, and IL-10 in the group 0.0% and 1.2%. (c) The relative mRNA expression level of Bcl-2 and Creb1 in the group 0.0% and 1.2%. (d) The relative mRNA expression level of GST and GGT in the group 0.0% and 1.2%. (e) The relative mRNA expression level of Nrf2, and Keap1, in the group 0.0% and 1.2%. Note: values not sharing a common superscript, p < 0.05. (n = 3 cages).
Fishes 10 00188 g005
Table 1. Formulation and proximate compositions of the experimental diets.
Item0.0%0.4%0.8%1.2%1.6%2.0%
Ingredients (%)
Fish meal34.6534.6534.6534.6534.6534.65
Krill meal666666
Squid meal555555
Wheat gluten13.613.613.613.613.613.6
SPC111111111111
Fish oil4.024.024.024.024.024.02
Soybean oil4.024.024.024.024.024.02
Soybean lecithin1.51.51.51.51.51.5
Vitamin premix 10.40.40.40.40.40.4
Mineral premix 20.30.30.30.30.30.3
Choline chloride (60%)0.30.30.30.30.30.3
Bile acid0.10.10.10.10.10.1
Ca(H2PO4)20.50.50.50.50.50.5
Glutamate00.40.81.21.62
α-starch13.113.113.113.113.113.1
Microcrystalline cellulose5.515.114.714.313.913.51
Proximate analysis (% air dry matter)
Crude protein44.2644.5144.3644.2044.9344.04
Crude lipid12.6412.2212.8212.2112.4112.60
Moisture10.4510.8511.129.819.6811.01
Crude ash10.2810.139.859.6710.569.83
Gross energy (kJ g−1)18.0218.118.1118.0818.0618.03
Glutamate8.178.508.829.159.489.80
1 Vitamin premix (mg kg−1 diet): vitamin A, 35; vitamin E, 150; vitamin D, 55; menadione, 5.1; vitamin C, 200; pyridoxine HCl, 25; cyanocobalamin, 0.1; biotin, 1.2; calcium pantothenate, 60; folic acid, 20; niacin, 200; inositol, 800. All ingredients were diluted with α-starch to 1 kg. 2 Mineral premix (mg kg−1 diet): MgSO47H2O, 1800; FeSO4H2O, 120; ZnSO4H2O, 80; MnSO4H2O, 40; CuSO45H2O, 1; NaCl, 100; KH2PO4, 250; NaH2PO4, 150. All ingredients were diluted with α-starch to 1 kg.
Table 2. List of the primers used for the real-time PCR analysis.
GeneForward Sequence (5′-3′)Reverse Sequence (5′-3′)Tm (°C)PCR Products (bp)
18SGGAGGCATGGTGGTGGATAAAACTGGACCTGGTTGGAAA60142
β-actinGTTATGCCCTGCCCCATGTGTCACGCACGATTTCCCT56132
Bcl-2ACCGCAGGTGGACAACATCCAGCCATACCGAAGACCGT60173
Keap1GCCAAACGCATCATAACACGGCCACTCCAGCACCCAGAC60100
Nrf2TGAGAAGAGCCAGAACACCACAATGCGAGGAACAAGGAAGAT60169
GSTGTTCTGCCTCCCTCTGTCACGGCGTATATCTGTCGGGCAA60180
GGTGTGTTTGGGTGTGGTGCATCCCTCTGAGCATACCTGGCAC60198
GSGGGACATCGTAGAGTGCCACGCCTGTAACTGGTTTGGGGT60218
IL-6RGCCTCACAAAGTGCCACATCCCAAAGGTCACCAGAGCCTG60207
IL-6GCCAAGGGCCTGTTCACTTAGTGGGTGTGTCGATGTTCCT60198
IL-10ACAAGTCCAGTGTGCGTCAAAATGCTGTTGATGGCGTGAC60195
Creb1GGTGGTCATGGCTTCATCCTCCTTCTTCTTCCTGCGACA60126
Note: Bcl-2, B-cell lymphoma-2; Keap1, Kelch-1ike ECH-associated protein l; Nrf2, Nuclear factor erythroid-derived 2-like; GST, glutathione hydrolase; GGT, γ-glutamyl transpeptidase; GS, Glutamine synthetase; IL-10, Interleukin 10; IL-6, Interleukin 6; IL-6R, Interleukin 6 receptor; Creb1, cyclic-AMP response.
Table 3. Growth performance of juvenile L. polyactis fed different dietary glutamate levels diets.
Item0.0%0.4%0.8%1.2%1.6%2.0%
SR (%)75.56 ± 4.16 b84.47 ± 3.14 ab85.56 ± 1.57 ab91.11 ± 3.14 a83.33 ± 2.72 ab82.22 ± 4.16 ab
IW (g)30.93 ± 0.04 a30.59 ± 0.15 a30.45 ± 0.27 a30.64 ± 0.09 a30.83 ± 0.06 a30.43 ± 0.10 a
FW (g)36.56 ± 1.14 b39.85 ± 1.14 b41.58 ± 0.77 ab45.43 ± 1.07 a41.44 ± 2.26 ab39.66 ± 2.00 b
WGR (%)18.24 ± 3.68 c30.31 ± 3.96 bc36.57 ± 3.49 ab48.26 ± 3.53 a34.41 ± 7.31 ab30.16 ± 6.83 b
SGR (% day −1)0.28 ± 0.05 b0.44 ± 0.05 ab0.52 ± 0.04 ab0.66 ± 0.04 a0.49 ± 0.10 ab0.44 ± 0.10 b
DFI (g tail −1 day −1)0.16 ± 0.04 b0.27 ± 0.04 ab0.31 ± 0.04 a0.38 ± 0.03 a0.30 ± 0.06 ab0.22 ± 0.04 b
PER1.55 ± 0.08 c1.69 ± 0.04 b1.76 ± 0.02 ab1.85 ± 0.03 a1.75 ± 0.04 ab1.53 ± 0.04 c
FCR1.75 ± 0.03 a1.72 ± 0.05 a1.61 ± 0.03 ab1.57 ± 0.03 b1.65 ± 0.05 ab1.69 ± 0.08 ab
Note: values not sharing a common superscript, p < 0.05. (n = 3 cages).
Table 4. Intestinal morphometric indices of juvenile L. polyactis fed different content glutamate diets.
Item0%0.4%0.8%1.2%1.6%2.0%
Muscle thickness (μm)53.83 ± 3.50 b56.64 ± 6.24 a58.20 ± 4.65 a62.16 ± 4.24 a52.90 ± 3.90 a51.46 ± 3.15 b
Villus height (μm)153.71 ± 28.96 b186.08 ± 14.69 b237.62 ± 31.81 a273.55 ± 27.82 a248.26 ± 34.20 a199.58 ± 18.89 ab
Note: values not sharing a common superscript, p < 0.05. (n = 3 cages). (n = 6).
Table 6. Effects of glutamate on intestinal digestive enzyme activity of juvenile L. polyactis.
Item0%0.4%0.8%1.2%1.6%2.0%
Lipase (U/mg) 6.80 ± 0.31 bc7.71 ± 0.69 b9.70 ± 0.39 a10.04 ± 0.55 a10.40 ± 1.00 a6.07 ± 0.40 c
Trypsin (U/mg) 15.52 ± 1.96 b19.62 ± 0.67 a20.80 ± 1.38 a22.57 ± 2.95 a20.33 ± 1.30 a16.87 ± 1.85 b
Pepsin (U/mg) 6.14 ± 0.40 d7.09 ± 0.40 c7.23 ± 0.41 c12.32 ± 0.40 a10.12 ± 0.41 b5.73 ± 0.40 d
α-Amylase (U/mg) 0.67 ± 0.05 d0.74 ± 0.07 d0.92 ± 0.07 c1.05 ± 0.05 ab1.07 ± 0.06 a0.40 ± 0.07 e
Note: Values with different superscripts in a row differ significantly, p < 0.05 (n = 3 cages).
Table 7. Gene functional annotations were found in 7 functional databases (Name, id, p value, KEGG, Length, and Swiss-Prot).
NameIdp ValueFold ChangeKEGGLengthSwiss-Prot
pepsin Aevm.TU.Scaffold1008.1050.0303.287K06002528sp|P00792|GN = Pepsin A
trypsinevm.TU.Scaffold47.690.00013.382K013121307sp|P70059|GN = Trypsin
collagen type I alphaevm.TU.Scaffold22.600.0122.627K062364582sp|P02452|GN = CO1A1_HUMAN Collagen alpha-1(I)
neprilysinevm.TU.Scaffold69.3030.6580.916K013895214sp|Q61391|GN = Neprilysin
carboxypeptidase Bevm.TU.Scaffold11.3570.0006.274K012911239sp|P19223|GN = CBPB1_RAT Carboxypeptidase B
potassium large conductance calcium-activated channel subfamily M alpha member 1evm.TU.Scaffold63.1510.0060.192K049361239sp|Q12791|KCMA1_HUMAN Calcium-activated potassium channel subunit alpha-1 OS = Homo sapiens OX = 9606 GN = KCNMA1 PE = 1 SV = 2
solute carrier family 4 (anion exchanger), member 2evm.TU.Scaffold22.70.0450.209K138553316sp|O95477|ABCA1_HUMAN Phospholipid-transporting ATPase ABCA1 OS = Homo sapiens OX = 9606 GN = ABCA1 PE = 1 SV = 3
potassium large conductance calcium-activated channel subfamily M alpha member 1evm.TU.Scaffold63.1510.0060.192K049366627sp|P53760|LCAT_CHICK Phosphatidylcholine-sterol acyltransferase (Fragment) OS = Gallus gallus OX = 9031 GN = LCAT PE = 1 SV = 1
ATP-binding cassette, subfamily A (ABC1), member 1evm.TU.Scaffold236.2880.0000.489K056412290sp|O14841|OPLA_HUMAN 5-oxoprolinase OS = Homo sapiens OX = 9606 GN = OPLAH PE = 1 SV = 3
lecithin-cholesterol acyltransferaseevm.TU.Scaffold843.270.0342.120K006502250sp|P78417|GSTO1_HUMAN Glutathione S-transferase omega-1 OS = Homo sapiens OX = 9606 GN = GSTO1 PE = 1 SV = 2
5-oxoprolinase (ATP-hydrolysing)evm.TU.Scaffold123.350.0004.749K01469720sp|O12990|JAK1_DANRE Tyrosine-protein kinase JAK1 OS = Danio rerio OX = 7955 GN = jak1 PE = 1 SV = 1
glutathione S-transferaseevm.TU.Scaffold63.1860.0003.965K0079912,123sp|Q9IB11|SOMA_SCIOC Somatotropin OS = Sciaenops ocellatus OX = 76340 GN = gh PE = 2 SV = 2
Janus kinase 1evm.TU.Scaffold81.610.0080.805K11217768sp|P22105|TENX_HUMAN Tenascin-X OS = Homo sapiens OX = 9606 GN = TNXB PE = 1 SV = 5
growth hormoneevm.TU.scaffold66s1.40.0191.630K054385009sp|Q1LVF0|LAMC1_DANRE Laminin subunit gamma-1 OS = Danio rerio OX = 7955 GN = lamc1 PE = 2 SV = 2
tenascinevm.TU.scaffold20s1.380.0473.112K062526185sp|Q28178|TSP1_BOVIN Thrombospondin-1 OS = Bos taurus OX = 9913 GN = THBS1 PE = 2 SV = 2
laminin, gamma 1evm.TU.scaffold1079s1.2_evm.TU.scaffold1079s1.30.3741.313K056353471sp|Q06274|ITA5_XENLA Integrin alpha-5 OS = Xenopus laevis OX = 8355 GN = itga5 PE = 2 SV = 1
thrombospondin 1evm.TU.Scaffold754.1520.4740.199K168572970sp|Q5EBF6|SDF1_XENTR Stromal cell-derived factor 1 OS = Xenopus tropicalis OX = 8364 GN = cxcl12 PE = 3 SV = 1
integrin alpha 5evm.TU.Scaffold804.200.0002.192K064842661sp|Q5EBF6|SDF1_XENTR Stromal cell-derived factor 1 OS = Xenopus tropicalis OX = 8364 GN = cxcl12 PE = 3 SV = 1
C-X-C motif chemokine 12evm.TU.Scaffold310.3280.0000.357K100311914sp|Q764M9|CXCR4_PIG C-X-C chemokine receptor type 4 OS = Sus scrofa OX = 9823 GN = CXCR4 PE = 2 SV = 1
B-cell lymphoma-2evm.TU.Scaffold38.5080.8490.440k02470222sp|P02478|GN = bcl-2-like protein
Disclaimer/Publisher’s Note: The statements, opinions and data contained in all publications are solely those of the individual author(s) and contributor(s) and not of MDPI and/or the editor(s). MDPI and/or the editor(s) disclaim responsibility for any injury to people or property resulting from any ideas, methods, instructions or products referred to in the content.

