Abstract
The WAC Bennett Dam was completed in 1968 and impounded the Upper Peace River to form the Williston Reservoir in north central British Columbia. In 1990, an enhancement project was initiated to stock Columbia River Kokanee (non-anadromous Sockeye Salmon; Oncorhynchus nerka) from southeastern British Columbia into tributary streams that drained into regions of the reservoir that were accessible by anglers. The current distribution of spawning Columbia-origin Kokanee in the Williston Reservoir watershed, however, does not reflect the locations where these fish were initially stocked and suggests extensive straying. Whether or not Kokanee will develop fidelity to specific spawning locations is not known, but it is important information to effectively manage these introduced fish. We used otolith microchemistry to estimate fidelity to natal streams by Columbia-origin Kokanee in the Williston Reservoir. Otolith elemental signatures for the region of the otolith that formed during the larval period and characterized the natal redd environment showed considerable variation among samples. Natal signatures tended to cluster for each river but not for all spawners, suggesting elemental signatures from other rivers. Homing to one of the four natal streams we examined was classified to be 73% based on linear discriminant analysis, although variation in the elemental signatures within each group suggests that homing by Kokanee to specific natal streams may be as low as 55%. Based on similarity of water elemental signatures for tributaries within large rivers, however, the proportion of fish that returned to their general region was likely higher and estimated to be approximately 83%. The result of regional homing could be reproductive isolation and adaptation to local conditions. It is unclear, however, if the current estimated level of straying will limit genetic differentiation and prevent local adaptation.
1. Introduction
Homing to natal streams for spawning is an important life history characteristic for Pacific salmon within the genus Oncorhynchus to ensure success of their progeny [1]. A location that historically served for successful incubation of embryonic and larval fish is likely to provide the greatest potential for survival for the next generation. Consequently, salmonids often show fidelity to specific spawning locations within a watershed—even at the microhabitat scale [2,3]. Selection of a spawning site is crucial because the highest rates of mortality in salmonids generally occur during the incubation period [1], and this mortality is closely related to the features of the spawning and incubation site. Intragravel variables influence spawning site selection at the microhabitat scale [4,5]—particularly temperature, where intragravel water temperature is less variable than surface water [6]. Colonization of new habitat and range expansion, however, is also important as the area of spawning habitat is linked to effective population size—an indicator of population resilience to stochasticity [7].
A major stocking program of Kokanee (non-anadromous Sockeye Salmon; Oncorhynchus nerka) to the Williston Reservoir provided us with an opportunity to assess fidelity to spawning locations for fish introduced to a novel environment. The Williston Reservoir was formed in 1968 following the construction of the WAC Bennett Dam in the canyon near Hudson’s Hope, British Columbia, Canada. The Dam impounded the headwaters of the Peace River and lower reaches of the Parsnip River, Finlay River, and many major tributary rivers, creating the largest lentic freshwater system in British Columbia. Kokanee were among the assemblage of species that naturally colonized the Williston Reservoir from headwater lakes when it formed and increased in numbers over time [8]. To increase angling opportunities and provide a prey source for large piscivorous fish species, a stocking program was initiated into five tributaries of the Williston Reservoir that were more accessible to anglers using Kokanee from the Columbia River [8,9,10]. An aerial enumeration study conducted from 2002 to 2006 found that the distribution and abundance of Kokanee in tributaries to the Williston Reservoir poorly reflected the stocking patterns from the 1990s. By 2006, Kokanee were reported to spawn in at least 68 rivers and streams from the Parsnip River watershed to the Finlay River watershed [10]. More recent aerial surveys indicate that these patterns have changed even further in the past decade [11,12]. The spawning Kokanee in tributary streams possessed bright red bodies and emerald green heads typical of Columbia origin fish rather than the rusty reddish brown coloration of mature native Williston Kokanee [13]. It is possible that the locations where Columbia origin Kokanee were introduced did not contain preferred habitat for the species, although small numbers of spawning Kokanee still return to some of the tributary streams where they were stocked [10,11,12]. Kokanee have shown a strong potential for straying following initial stocking into the Williston Reservoir watershed, but whether they have now selected specific habitat locations for spawning or continue to stray is not known.
Recently, we have shown that natal stream elemental signatures in otoliths of Coho Salmon (O. kisutch) were specific to spawning locations [3]. Otolith microchemistry, therefore, has strong potential to define natal location in adult Kokanee spawners and determine if fish are homing or straying. Kokanee migrate from lakes to tributary streams to spawn from July to November in British Columbia depending on latitude [14]. Fertilized eggs develop in redds until hatch and alevin remain in the gravel, and until the yolk is fully absorbed, usually emerging in May. Fry for most populations migrate downstream into the lake immediately after emergence to begin exogenous feeding [14]. Time within the natal streams is usually restricted to just the life history stage within the redd environment and the intragravel water defines the natal water elemental signature. Elemental signatures in streams are based on differences in the underlying bedrock, which varies with location [15]. Bedrock geology differs between the east and west sides of the Williston Reservoir, as well as between the north and south [16], and bedrock formations in the upper Peace River watershed were formed during different time periods and are composed of materials that have variable chemical composition [17]. The distinctive chemical signatures that vary among freshwater streams and rivers also correlate with elemental ratios in otoliths of freshwater species (Atlantic Salmon Salmo salar [15]; Cutthroat Trout O. clarkii [18]; Arctic Grayling Thymallus arcticus [19]; Coho Salmon [20]). Consequently, elemental signatures in otoliths of fish have been used to assess habitat shifts, population structure, and location of origin, but also have been used to trace the extent and pattern of movement of individual fish. Earlier work on differences in elemental signature for otoliths from Arctic Grayling [19] and Slimy Sculpin Cottus cognatus [21] captured among tributaries to the Williston Reservoir indicated large differences in elemental chemistry within the watershed. We used otolith microchemistry, therefore, to identify whether an introduced population of Kokanee exhibit homing and return to natal streams to spawn or stray from their natal locations.
2. Materials and Methods
2.1. Water Chemistry
To assess spatial variation in water chemistry signatures, we collected water samples from major rivers in the Williston Reservoir watershed where Columbia origin Kokanee have been observed to spawn: Omineca River, Ingenika River, Finlay River, and Ospika River (Figure 1). Chemical signatures of intragravel water where embryos and alevin develop (natal redd signatures) did not differ significantly from surface waters at multiple locations where Coho Salmon spawned in the Coldwater River, BC [3]. Consequently, we used surface water elemental signatures to assess differences among rivers and spawning locations within the Williston Reservoir watershed. We also collected water from nearby tributaries to assess spatial variation within each river system and from locations in the reservoir. Water samples were collected using the methods outlined by [22] as modified by [19]. Bottles and syringes were rinsed with ultrapure water, then soaked for 5 days in a 2% solution of high-purity nitric acid. Water samples were collected in duplicate during the period of summer river low flows, from 7 to 11 August 2020 and from 21 to 22 August 2021, when groundwater represents a large proportion of river water. Water samples collected when flows are low better represent the elemental signatures present as there is minimal dilution from overland surface water runoff [23].
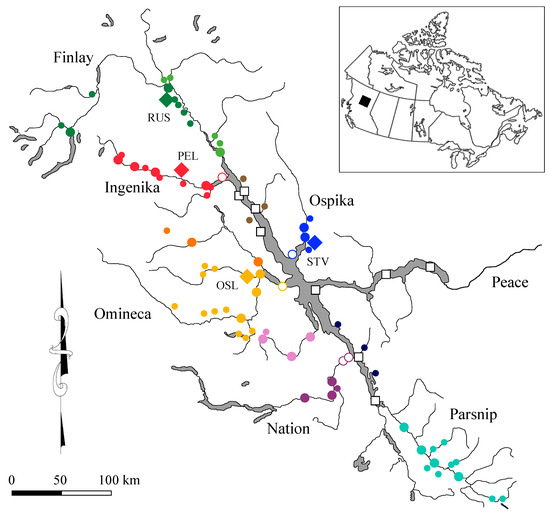
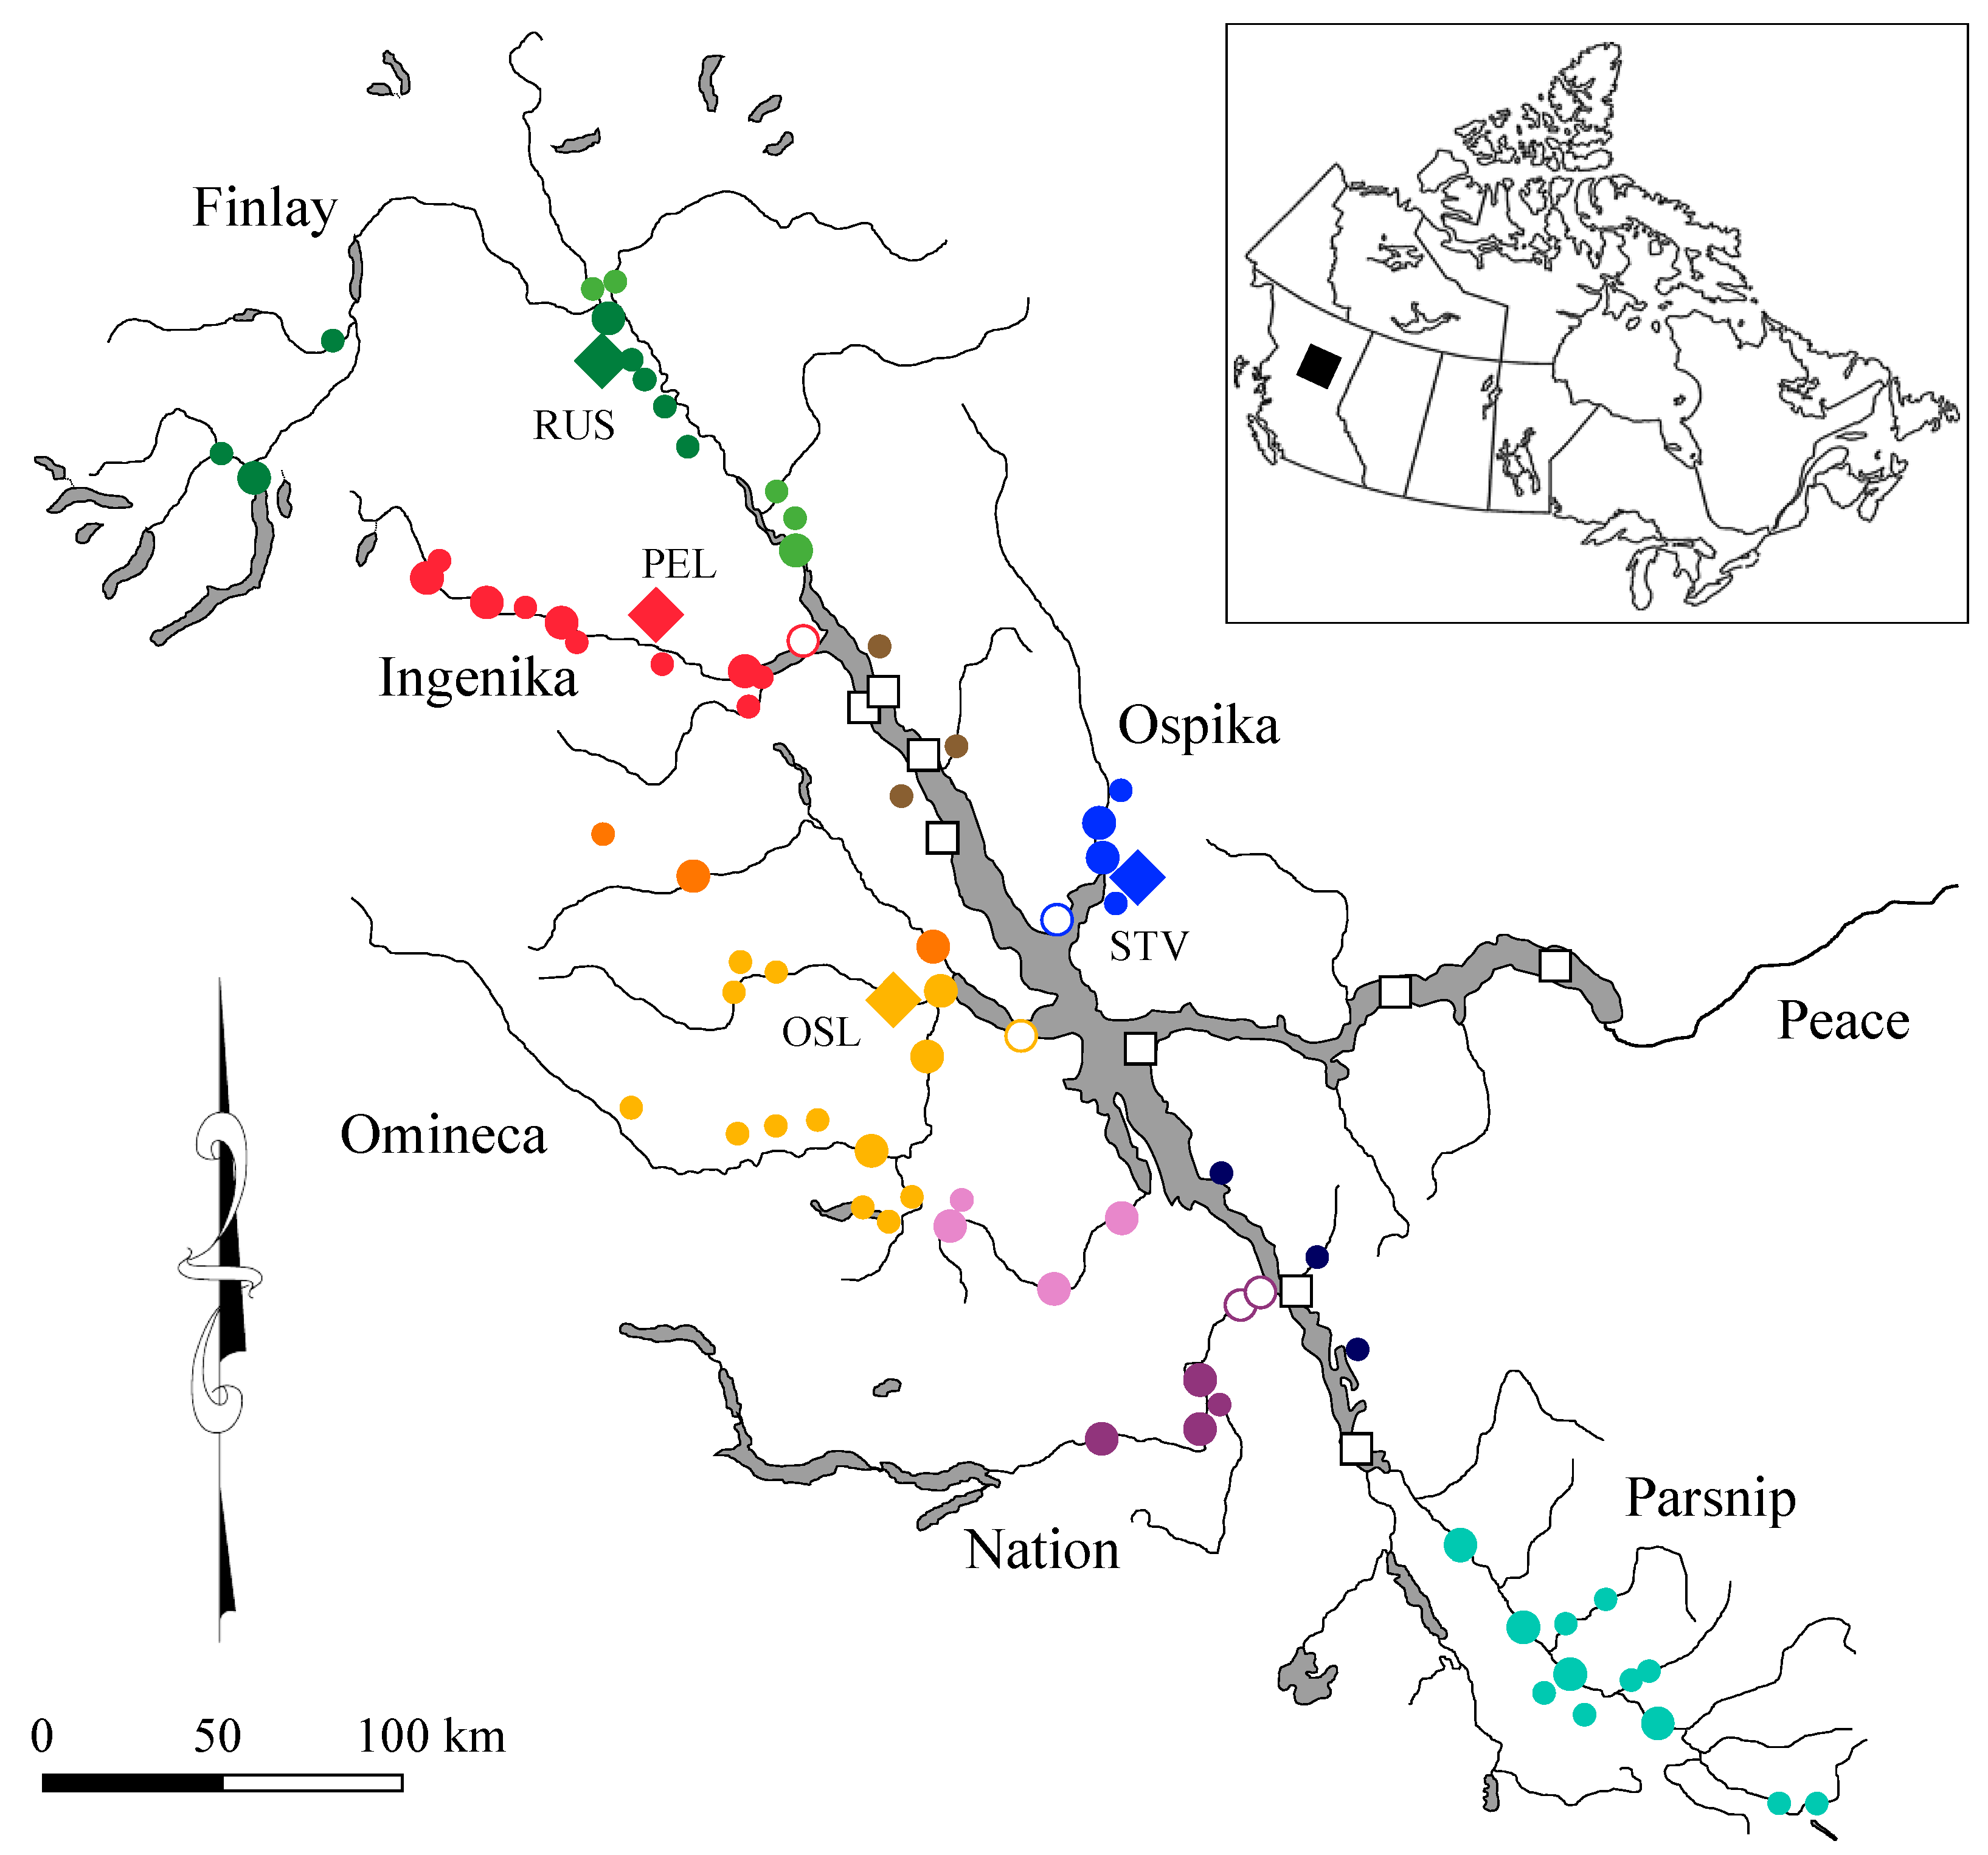
Figure 1.
Sampling sites in the Williston Reservoir watershed where water samples and mature Kokanee spawners were collected. Water sampling sites are indicated as large, closed circles from mainstem rivers, small, closed circles from tributary streams, open large circles from embayments with color defining the regional groups, and open squares for samples collected from different locations in the reservoir. Locations where Kokanee were collected are shown as solid diamonds: Russel Creek (RUS), Pelly Creek (PEL), Osilinka River (OSL), and Stevenson Creek (STV).
Water samples were filtered and preserved in the field with 600 μL of HNO3 added to a 30 mL water sample. An inductively coupled plasma-optical emission spectrometer (ICP-OES) (model 5100 Agilent Technologies, Santa Clara, CA, USA) was used to analyze water samples for calcium (Ca), manganese (Mn), strontium (Sr), and barium (Ba). Elemental values are ratios to Ca but expressed as the individual element.
Concentrations of elements vary seasonally with discharge, but the ratio of each element to Ca shows greater consistency seasonally and among years [24,25]. We incorporated published and unpublished data from earlier work, therefore, to assess temporal stability in water chemistry signatures. Samples collected in 2002 [25], 2003 and 2004 [19], 2011 (AD Clarke, unpublished data), and 2017 (MD Stamford, unpublished data) were also included in the analysis.
Discriminant function analysis (DFA) using jack-knife resampling was used to assess geographic separation of water chemistry data for Sr and Ba to Ca elemental ratios from watersheds where Columbia origin Kokanee are known to spawn or where native populations of Kokanee exist (SYSTAT version 7). Mn was not used as it was below detection for some locations. Water chemistries were obtained from both the tributaries and the mainstem river of each watershed, and over multiple years for some locations. Jack-knife re-sampling was used to validate the robustness of the discriminant functions.
2.2. Otolith Analysis
Spawning locations for Kokanee used to assess homing to natal streams were chosen based on the difference in stream elemental signatures from the signature of the reservoir and availability of archived otoliths. Mature Kokanee spawners sampled from Russel Creek in 2006 and 2018, Pelly Creek in 2006 and 2018, Osilinka River in 2016, and Stevenson Creek in 2016 and 2017 (Figure 1) were frozen prior to otolith extraction. All fish used in our study were genotyped and identified to be Columbia origin Kokanee [26]. Otoliths were removed from Kokanee carcasses after they were partially thawed.
Otoliths were mounted in epoxy, then polished with lapping papers with 320, 600, and 1200 grit sizes. After final sanding, samples were rinsed with clean distilled water prior to ablation. Elemental analysis on otoliths was conducted at two labs: School of Earth & Ocean Sciences (University of Victoria) and TrichAnalytics (Saanichton, BC, Canada). Material was extracted from the otoliths with a VG Elemental PQ II S + high sensitivity ICP-MS (Thermo Electron Corporation, Waltham, MA, USA) coupled to a Merchantek UV laser ablation system (New Wave Research, Fremont, CA, USA) at UVic. The laser system was operated with an output of 266 nm that had a maximum energy output of 4 mJ. Optimization was conducted using standard reference material (NIST 613). Material was extracted from otoliths using an NWR 213 laser ablation (LA) module (Elemental Scientific Instruments, Omaha, NE, USA) coupled to an iCAP RQ inductively coupled plasma mass spectrometer (ICP-MS) (Thermo Fisher Scientific, Waltham, MA, USA) at 60% power at TrichAnalytics. An internal reference standard for calcium (Ca) of 40% was used during otolith ablation. The LA-ICP-MS machine was calibrated with a reference standard (NIST 612).
The otolith ablation diameter for both methods was set at 30 μm and tracked across the laser at 5 μm s−1. Isotopes measured in the otoliths were 43Ca, 55Mn, 66Zn, 88Sr, and 137Ba. Elemental concentrations were calculated by correcting the sample signal intensity to the background signal, then to the average intensity standard of the selected element, followed by correcting to the recovery of the internal standard (Ca) in the sample relative to the external standard. All data, therefore, are expressed as a ratio of the element to Ca, but just reported as the individual element. Otolith data were smoothed with a running average for every 5 μm. For natal elemental signatures, data were examined from the line scan approximately 200 μm on either side of the otolith core. Each line was visually assessed for symmetry of elemental signatures and the large spike in Mn at the core. Once the core center was determined, we assessed Sr, Ba, and Mn at a distance greater than 50 μm from the core to limit the potential influence of reservoir-derived maternal signatures, and less than 250 μm to capture elemental signatures for alevin prior to gravel emergence, thus representing the incubation environment [3,27,28]. These three elements were used due to differences characterized among rivers in the Williston watershed [19,20]. Strong relationships also existed between water elemental signatures and otolith microchemistry for Sr and Ba, however, the relationship for Mn was not as strong [19,20].
We calculated average Sr, Ba, and Mn signatures for a 25 μm section of otolith in the region that represented the elemental signature for the intragravel environment post yolk absorption, but prior to feeding and reservoir environmental influence; approximately between 120 μm and 170 μm as derived by [28]. The absolute location where we calculated the natal redd environment signature varied depending on the size of the otolith and cross-sectional length of the line scan. Average values for Sr, Ba, and Mn were calculated for the two sides of the ablation path from the otolith core, but 7 of 64 samples were not symmetrical and only one side was used. Eight samples were excluded as the core was missed. Zinc to calcium was also plotted to estimate age as elemental ratios showed annual oscillations that vary seasonally [21].
Discriminant function analysis using jack-knife resampling was used to estimate fidelity to spawning locations and potential straying among watersheds where Columbia origin Kokanee spawn (SYSTAT version 7). A multivariate combination of Sr, Ba, and Mn to Ca elemental ratios was used to discriminate locations using otolith elemental signatures for the intragravel environment. Jack-knife re-sampling was used to validate the robustness of the discriminant functions. To provide a visualization of the elemental differences for the sections of otoliths prior to emergence from redds, the first two discriminant scores were plotted for each spawning location.
3. Results
3.1. Water Chemistry
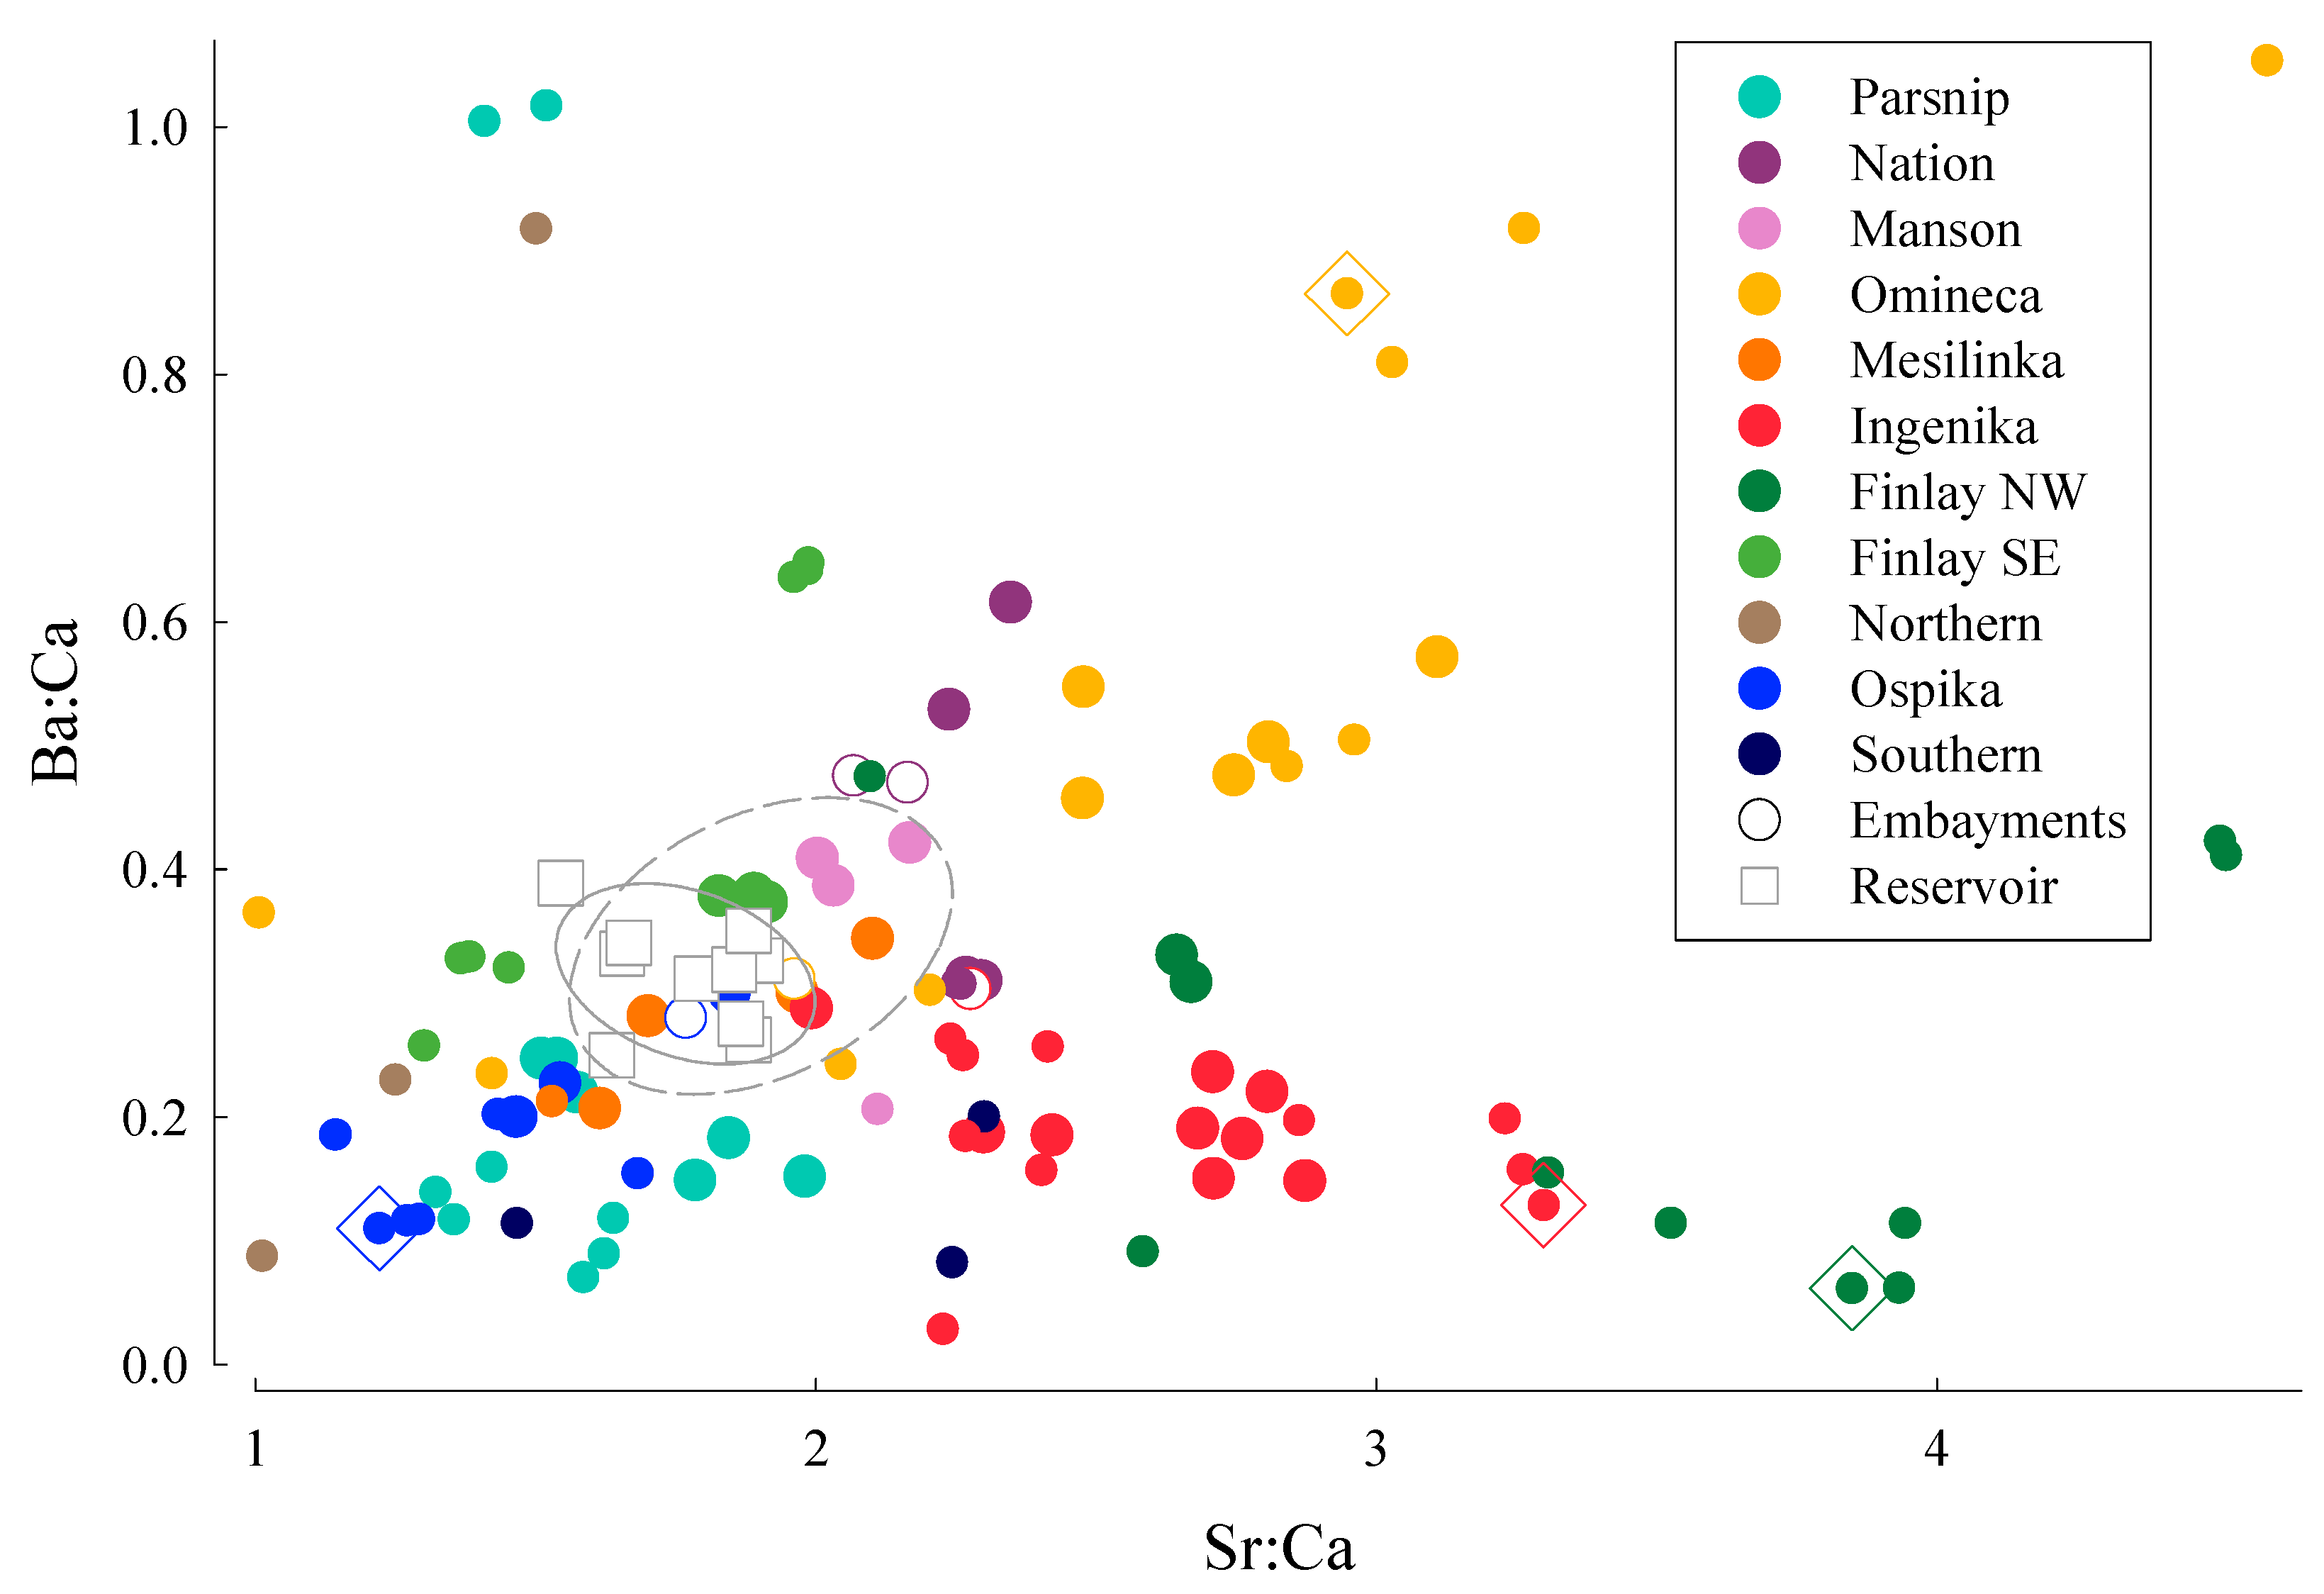
Considerable differences existed in water chemistry among the rivers, but also many of the water samples differed from water collected from the Williston Reservoir (Figure 2). Differences within samples collected from an individual river system reflect changes in water chemistry between the headwaters and mouth of the rivers, and differences in elemental signatures for inflowing tributary streams for each river. General patterns were that Sr values were lower for rivers and streams draining the eastern and southern parts of the watershed, and higher for rivers and streams draining the western and northern parts of the watershed. For Ba and Mn, values were generally higher for rivers and streams draining the western parts of the watershed, but not all. Values for Ba were also higher in tributaries to the headwater of the Finlay River, the northernmost region of the watershed. Values for Mn were below detection in many of the tributaries to the Ospika and Finlay Rivers. Another general pattern observed among the larger rivers and their tributaries was a clustering of values for samples from the mainstem, with more variation in signatures from tributary streams and the headwaters.
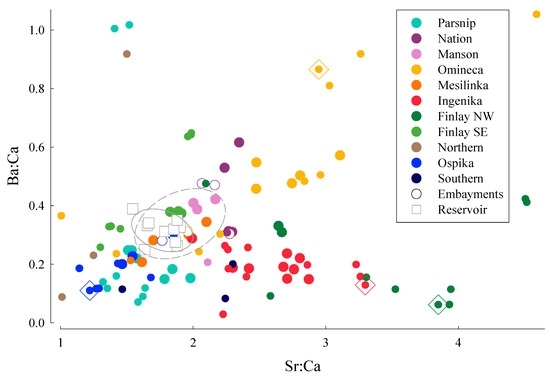
Figure 2.
Elemental ratios of Sr and Ba to Ca for water samples collected from rivers and tributaries within the Williston Reservoir watershed. Locations for samples from each watershed are shown in Figure 1. Mainstem rivers are indicated as large, closed circles, tributary streams are indicated as small, closed circles, embayments are indicated as open, large circles with color defining the mainstem river, and samples collected from different locations in the reservoir are indicated as open squares. Ellipses drawn around reservoir (solid line) and embayment (dashed line) data define 95% confidence intervals for elemental signatures for each location. Small, closed circles inside open diamonds indicate water chemistries from tributary streams where mature Kokanee spawners were sampled.
Discriminant function analysis indicated that samples collected from many of the rivers failed to be classified to the correct location. The total number of cases classified correctly using jack-knife validation was only 35% (Table 1). The five groups with the highest percentage of correctly classified samples were the Omineca River and tributaries (60%), Ingenika River and tributaries (53%), northwestern locations on the Finlay River and tributaries (64%), Ospika River and tributaries (80%), and samples collected from the reservoir (40%). Water chemistry signatures from tributaries within each of these mainstem river systems that showed good separation from the reservoir water chemistry were Stevenson Creek in the Ospika River watershed, Osilinka River in the Omineca River watershed, Pelly Creek in the Ingenika River watershed, and Russel Creek in the lower Finlay River watershed (Figure 1 and Figure 2).

Table 1.
The percentage of correct classification determined by discriminant function analysis (DFA) for water samples collected from watersheds within the Williston Reservoir catchment.
3.2. Otolith Analysis
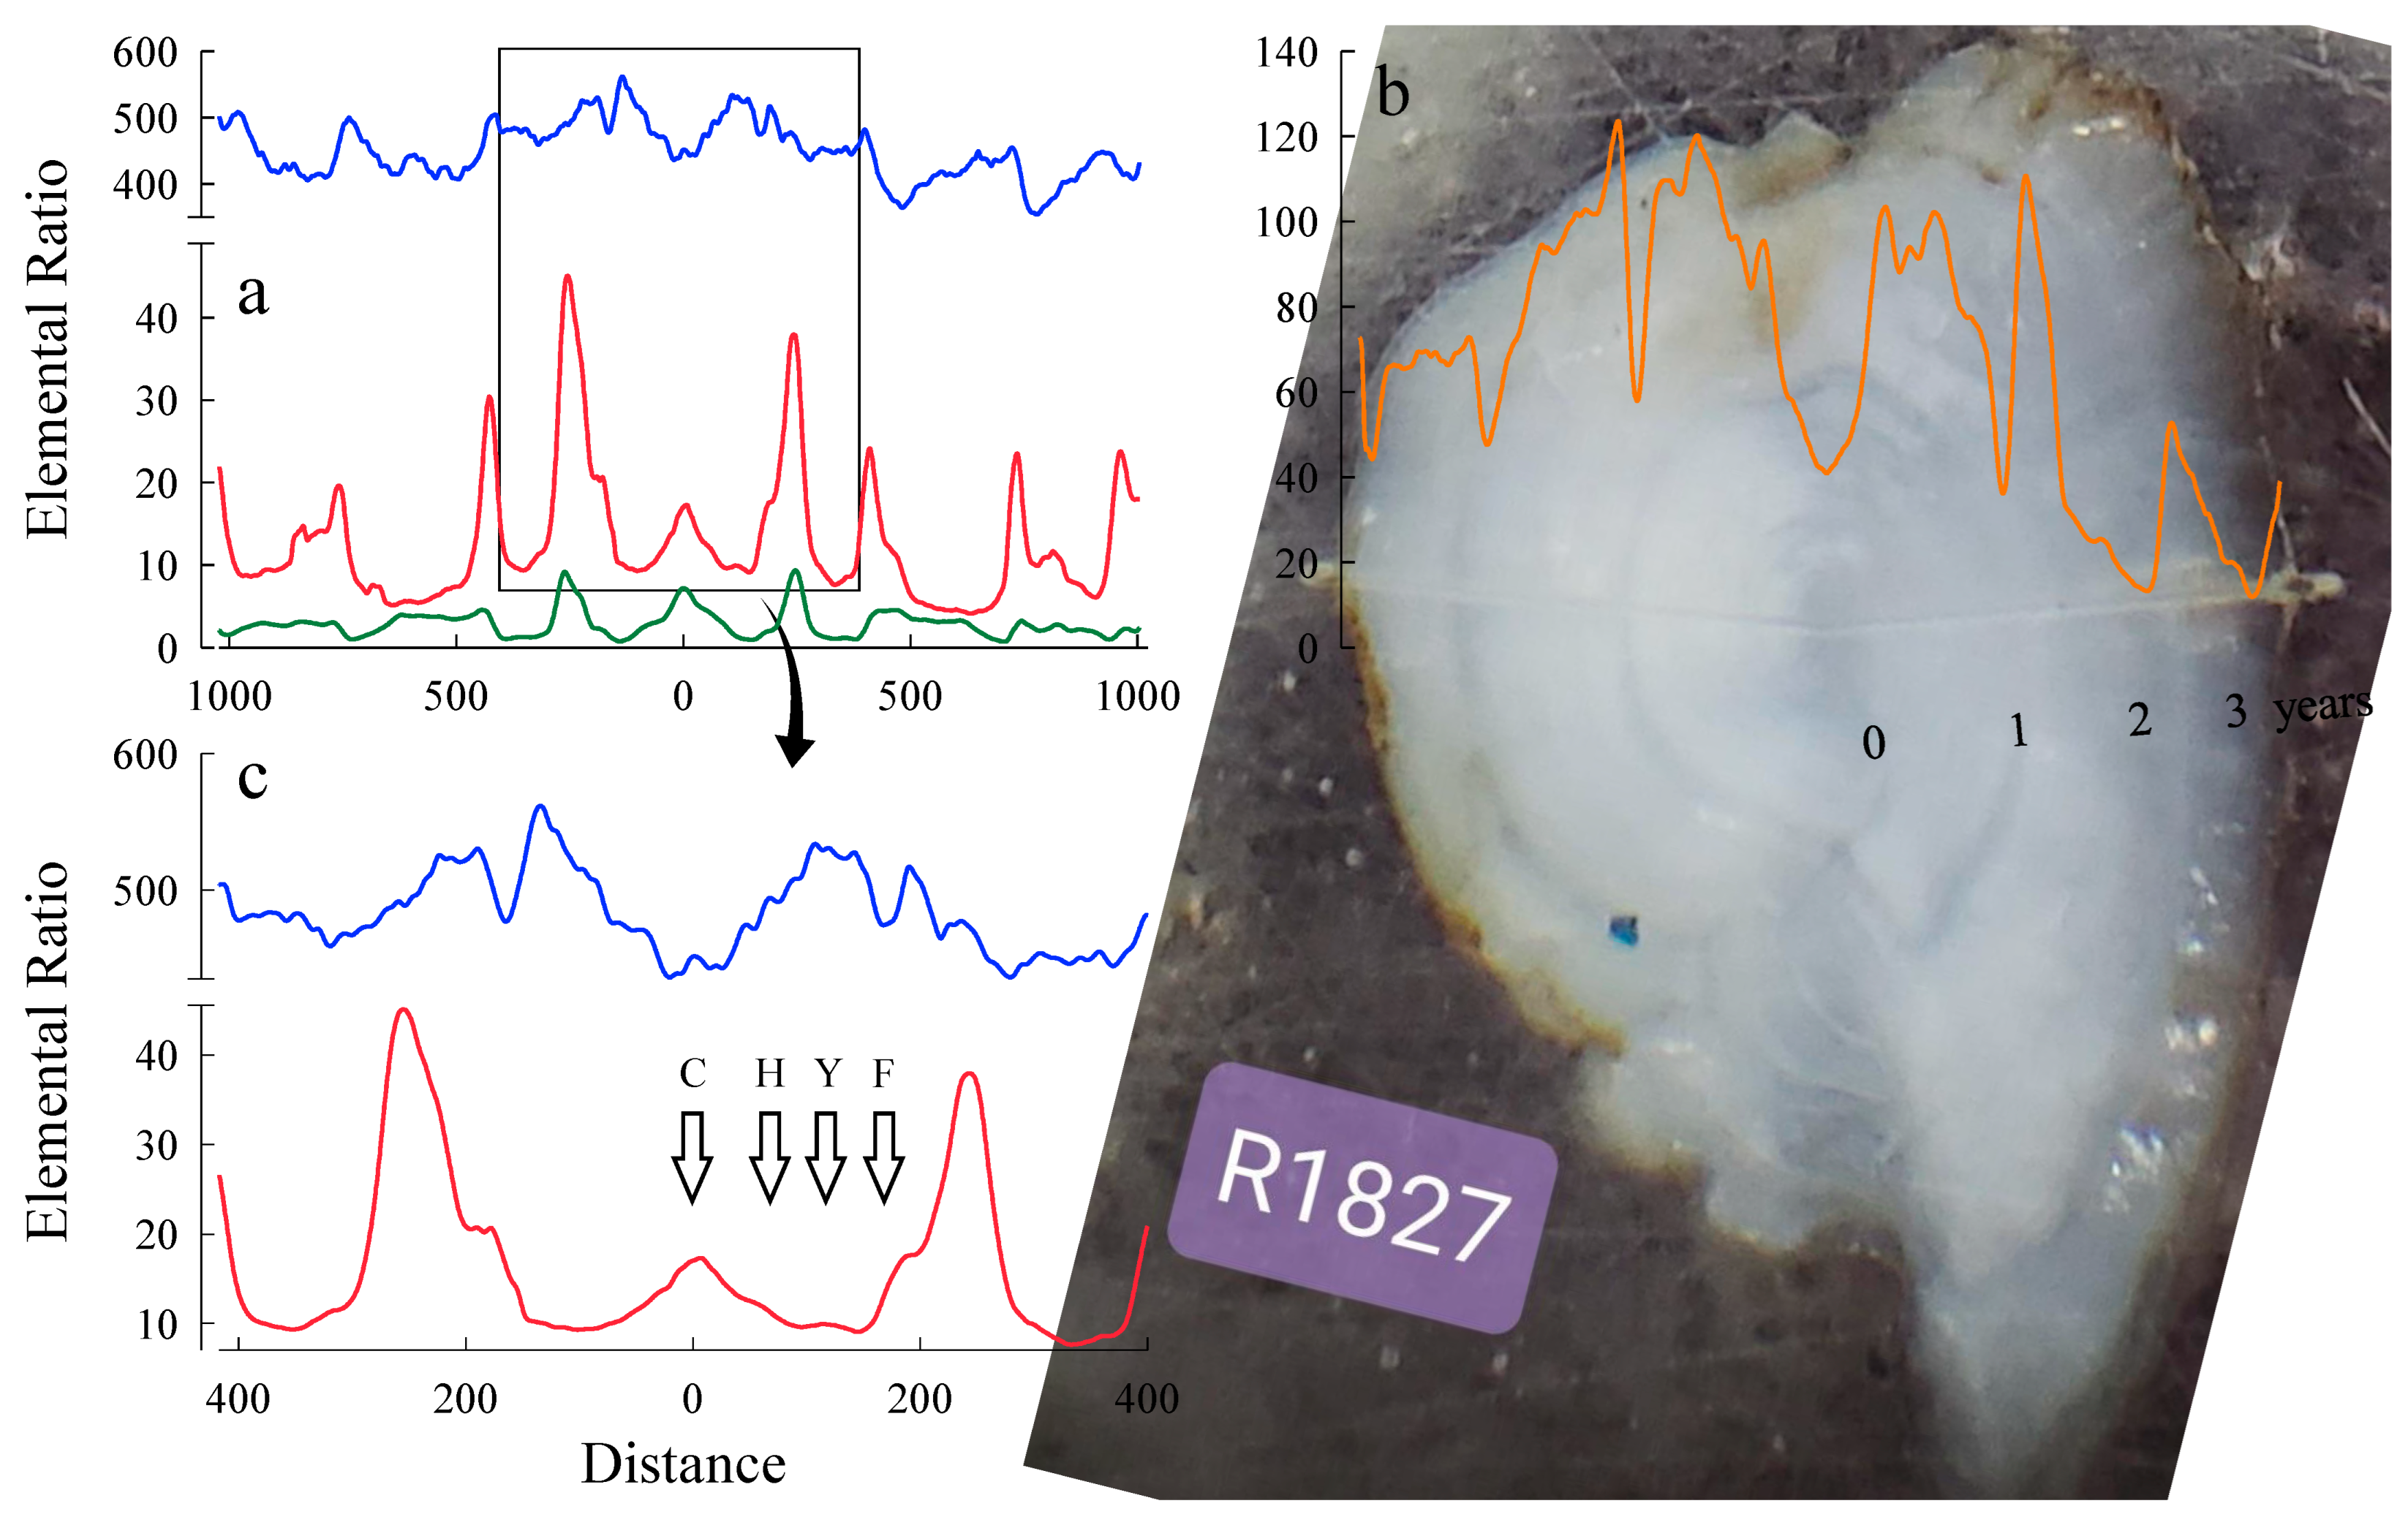
Elemental line scans of otoliths from mature Kokanee spawners showed considerable variation in Sr, Ba, and Mn elemental ratios to Ca across the otolith. A male spawner from Russell Creek is shown in Figure 3. A distinctive spike in Mn is characteristic of the otolith core, with Ba also high at the core and Sr low at the core. As the embryo developed and hatched, the influence of maternally derived chemical signatures from the reservoir declined, particularly after hatch and ionic uptake by the alevin was increasingly influenced by the water within the redd environment. After emergence and migration downstream to the reservoir, elements incorporated into the otolith reflected water and sources of food from the reservoir. The line scan values beyond the region defined by “F” in Figure 3 likely represent movement to locations with different elemental signatures following emergence from the gravel. There was considerable variation in Sr, Ba, and Mn throughout the life history of Kokanee after emergence, suggesting movement to habitats that appear to differ in elemental composition.
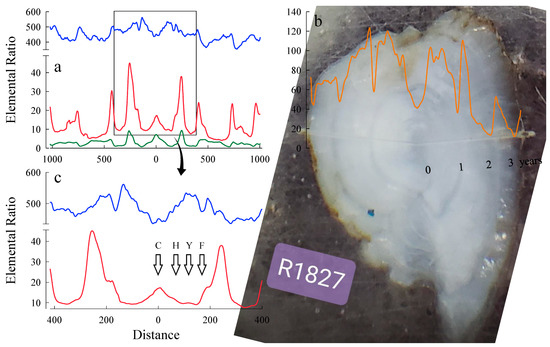
Figure 3.
Elemental signatures for an otolith from an adult Kokanee spawner collected in Russell Creek (22.5 cm [LF] and 99.8 g [M]) on 19 September 2018: (a) Elemental signatures from the line scan show changes in Sr (blue), Ba (red), and Mn (green) over the entire life history of the fish; (b) Image of otolith showing laser ablation burn to determine elemental composition of the structure. Changes in Zn signatures are superimposed on the image to show how the oscillations align with otolith annuli (photograph courtesy of Jennie Christensen, Trich Analytics, Saanichton, BC, Canada); (c) Natal section expanded to show the changes in line scans for Sr (blue) and Ba (red) corresponding to distances defined by [28] from the core on the otolith. The core (C), hatch (H), yolk absorption (Y), and feeding (F) stages for early development stages in Kokanee. Otolith core center is indicated by 0 on the X-axis.
Elemental signatures from the section of the otolith that defined the natal redd environment showed considerable variation among samples, but some general patterns were evident. Elemental ratios for Sr, Ba, and Mn were lowest on average for fish from Stevenson Creek; 374.5 ± 64.4 mmol mol−1, 14.7 ± 4.3 mmol mol−1, and 2.33 ± 1.46 mmol mol−1 for Sr, Ba, and Mn, respectively. Fish sampled from the Osilinka River had the highest Ba and Mn levels (24.9 ± 9.6 mmol mol−1 and 5.97 ± 3.66 mmol mol−1) and intermediate Sr levels (466.1 ± 39.7 mmol mol−1). Pelly Creek spawners had high values of Sr (511.4 ± 61.5 mmol mol−1), but low Ba (13.2 ± 3.1 mmol mol−1) and Mn (2.66 ± 1.18 mmol mol−1). Russell Creek fish had the highest levels of Sr in the natal section of otolith line scan which was on average (556.0 ± 51.2 mmol mol−1), and the lowest Ba and Mn values on average; 13.1 ± 2.6 mmol mol−1 and 2.26 ± 0.72 mmol mol−1, respectively. Significant relationships were found between the natal otolith signatures and surface water chemistry from the spawning streams examined in our study for Sr (F1,62 = 94.22, p = 4.656 × 10⁻¹⁴, R2 = 0.603) and Ba (F1,62 = 48.41, p = 2.548 × 10⁻⁹, R2 = 0.438). Regression analysis was not conducted for Mn as water concentrations for Russel and Stevenson Creeks were below detection. Results from the linear regression for Sr were:
and for Ba were:
Srotolith = 69.06 · Srwater + 282.5
Baotolith = 14.70 · Bawater + 12.15
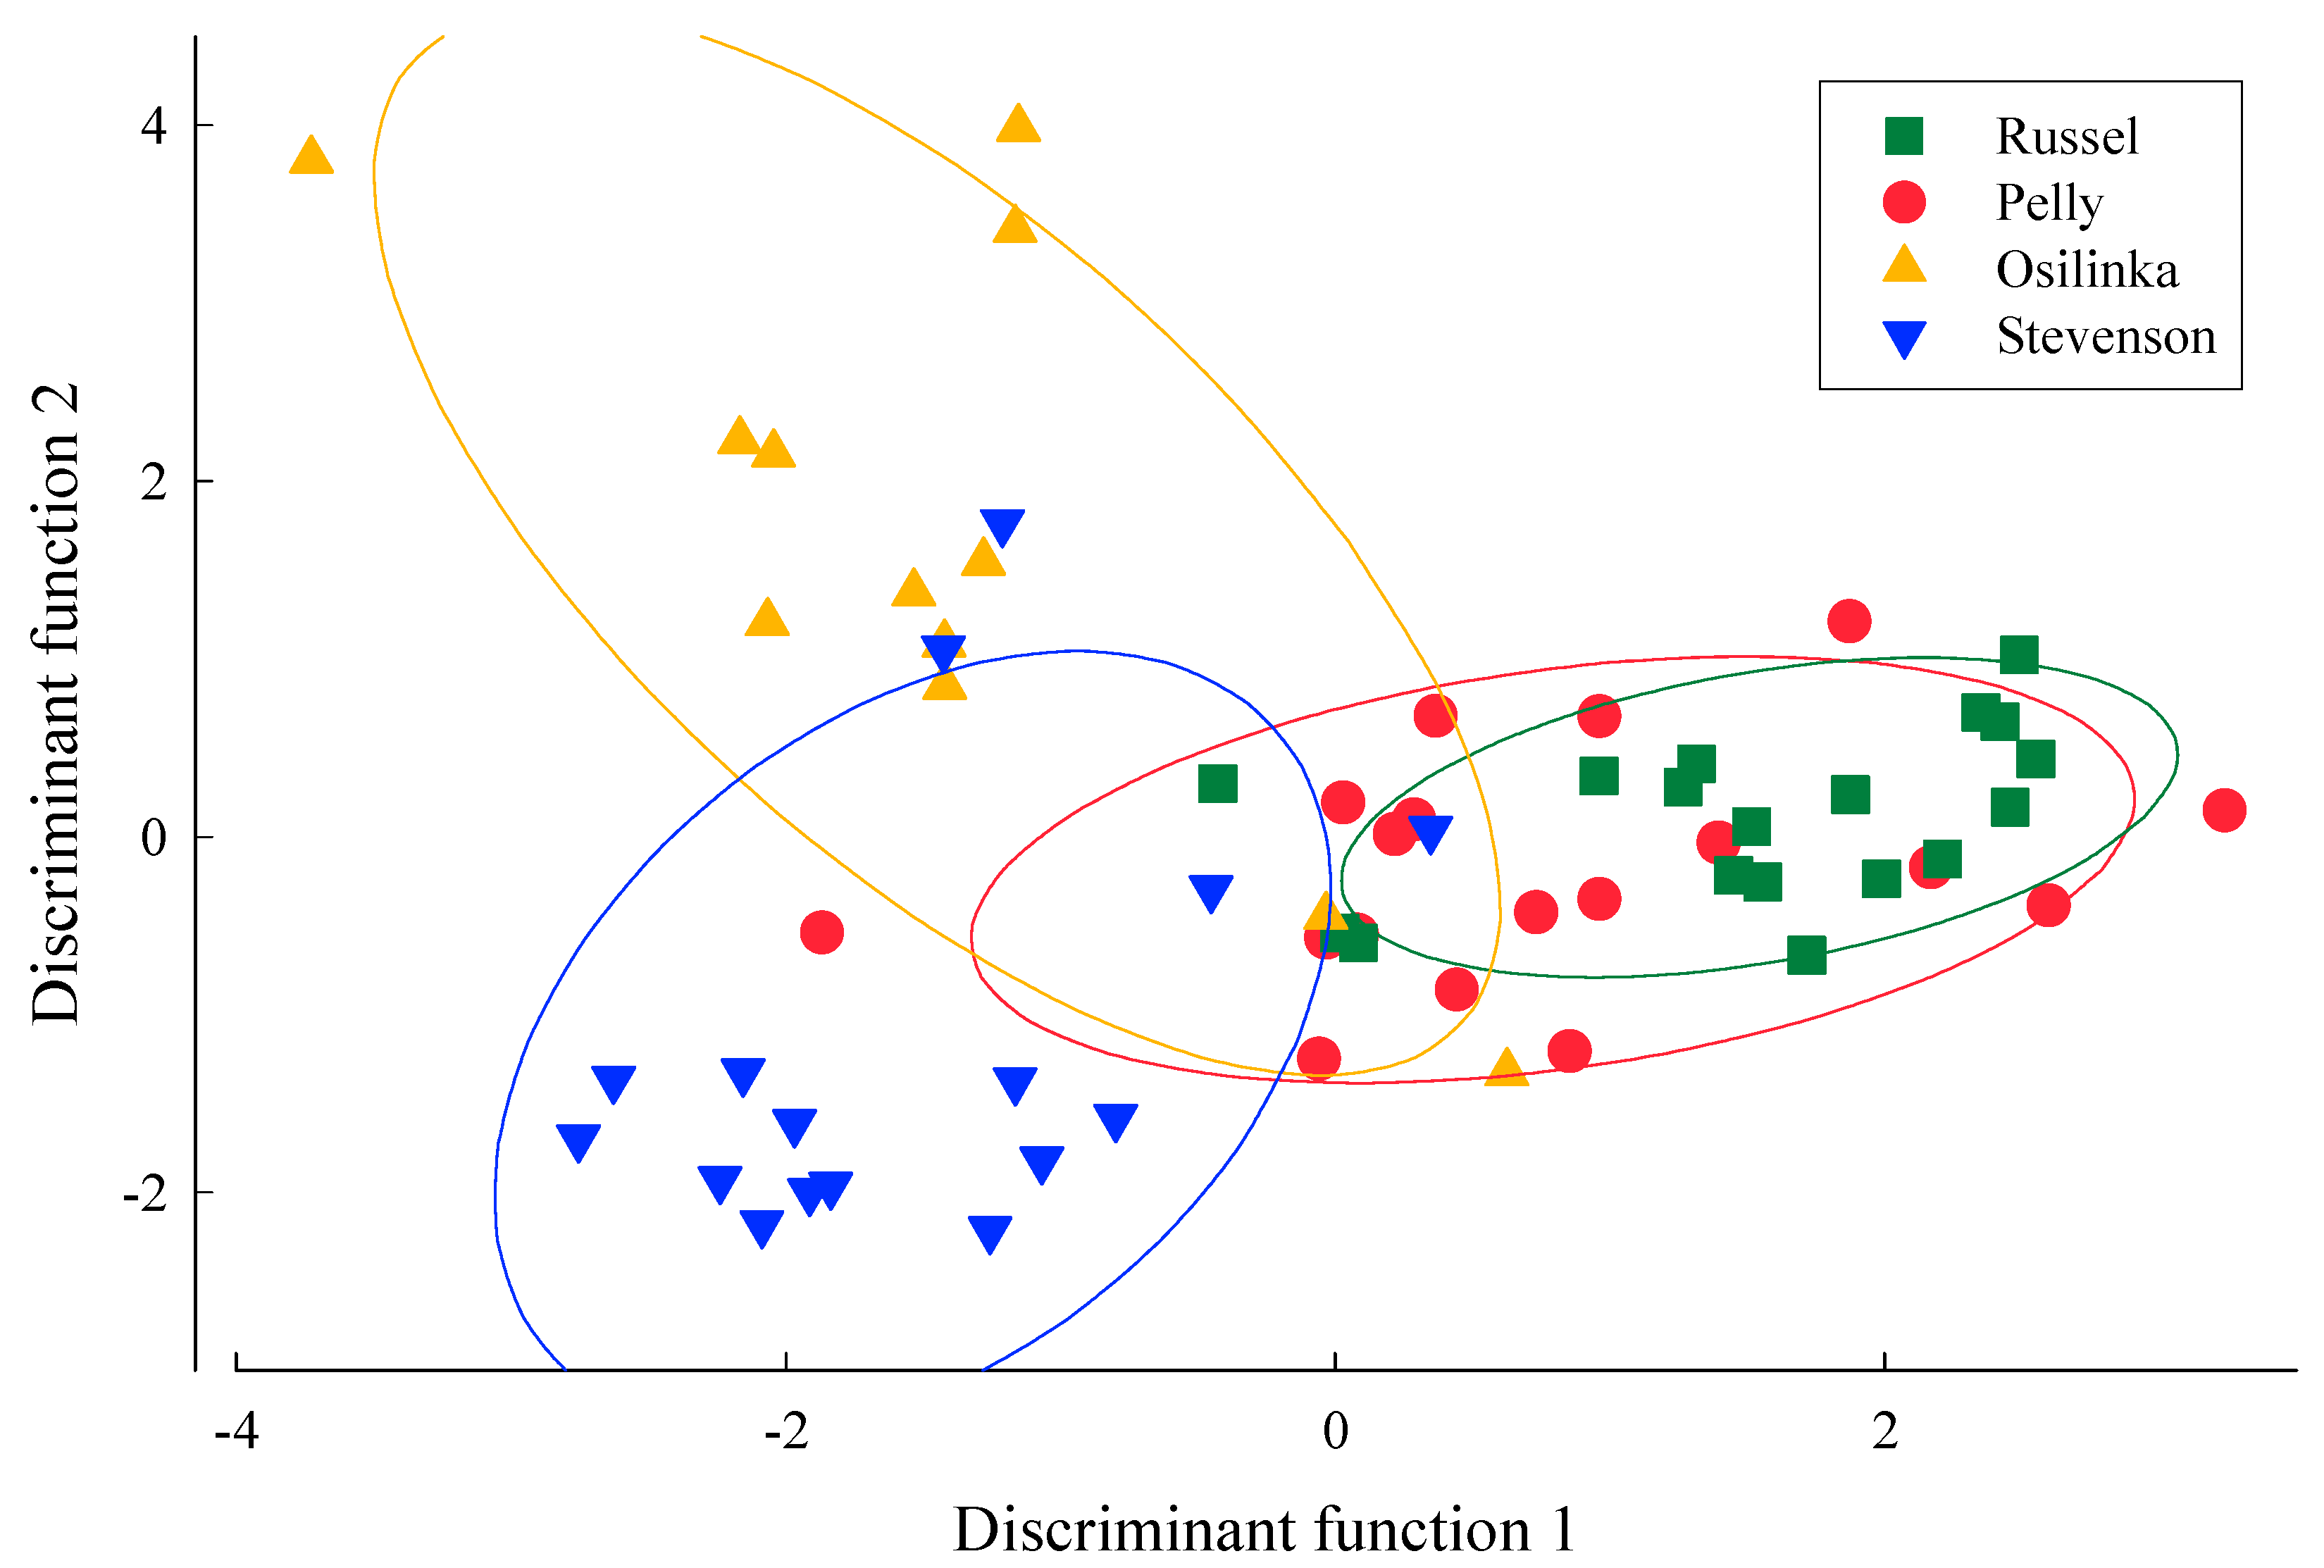
Discriminant function analysis using jack-knife resampling for natal otolith signatures used the linear combination of the predictor variables and revealed reasonable separation between spawning locations. The percentage of correct classification for each location indicated that the total number of cases classified correctly using jack-knife validation was 73% (Table 2)—suggesting approximately 27% rate of straying. The rate of straying might be higher as some fish were assigned to groups even though elemental signatures did not cluster well with other spawner signatures from that stream. Although elemental signatures showed strong relationships with spatial spawning sites, there was considerable overlap in the confidence ellipses for the discriminant scores of the natal otolith elemental signatures for the four locations where Kokanee spawners were sampled (Figure 4). Discriminant scores tended to cluster for each river system but were not at the center of the ellipse due to values that departed from the cluster suggesting elemental signatures from other river systems.
Table 2.
The percentage of correct classification determined by discriminant function analysis (DFA) for otolith elemental signatures characteristic of natal redd environments for Kokanee spawners sampled from Pelly Creek (PEL), Russel Creek (RUS), Osilinka River (OSL), and Stevenson Creek (STV) within the Williston Reservoir watershed.

Figure 4.
Discriminant function analysis using jack-knife resampling for elemental signatures from sections of otoliths that are characteristic of natal redd environments from spawning Kokanee collected from Pelly Creek, Russel Creek, Osilinka River, and Stevenson Creek. Elemental ratios included in the model were Sr, Ba, and Mn to Ca.
For Pelly Creek and Russel Creek, we also had otolith samples collected in 2006 and 2018. There were 6 Kokanee spawners sampled in 2006 that were not assigned to stream of capture out of 20 samples, suggesting a straying rate of 30%. There were 5 Kokanee spawners sampled in 2018 that were not assigned to stream of capture out of 16 samples, suggesting a straying rate of 31%. Straying did not appear, therefore, to show any temporal difference.
4. Discussion
Determining fidelity to specific locations within the Williston Reservoir by Kokanee for spawning is important to effectively manage this species. We used otolith microchemistry to estimate the proportion of mature Kokanee spawners that home to natal locations and estimated spawning site fidelity to be 73% among the four spawning locations. The success of our study, however, was dependent on several factors. First, spatial variability in water chemistry had to be high. Second, temporal variability in water chemistry had to be low. Third, the section of the otolith corresponding to the embryonic and larval life history period had to be easily distinguished.
4.1. Spatial Variation in Water Elemental Signatures
Our choice of tributaries where Kokanee spawn was based on spatial separation and likelihood of differences in elemental signatures in redd environments, but also availability of archived otoliths from Kokanee spawners collected for multiple cohorts. Elemental signatures differed among tributary streams and from the Williston Reservoir [19,25]. Elemental ratios for Sr, Ba and Mn to Ca were high on the western side of the reservoir and low on the eastern side of the reservoir. Elemental signatures generally varied with latitude, but differences also existed at smaller geographic scales.
Water chemistries from streams on the east side of the reservoir tended to be low in Sr, Ba, and Mn. The Ospika River and tributaries also had the highest cross-validation accuracy (80%). Stevenson Creek had elemental signatures that were lower and differed from the reservoir water samples more than the mainstem of the Ospika River and other Ospika River tributary streams that were sampled. Additionally, we had archived otoliths from Kokanee sampled from Stevenson Creek in 2016 and 2017. Water chemistries from the Omineca River watershed had Sr, Ba, and Mn to Ca ratios higher than values in the reservoir for most locations, but not all (Figure 2). Elemental signatures from water samples collected from the Osilinka River approximately 8 km above the confluence with the Omineca River were much higher in Sr, Ba, and Mn than the reservoir, thereby maximizing potential differences between the maternal and natal otolith signatures. We also had archived otoliths from spawners collected at this location in 2016. There is the potential for Kokanee to migrate above this location on the Osilinka River to spawn along the mainstem or upper Osilinka River tributary streams. Consequently, variability in elemental signatures for Kokanee sampled in the Osilinka River may represent signatures for multiple locations in the Osilinka River watershed. Pelly Creek Sr and Mn signatures were greater than the reservoir, and Ba signatures were lower than the reservoir. The elemental concentrations provided an opportunity to detect differences between the maternal signatures from the reservoir and natal redd signatures. We also had archived otoliths from Kokanee spawners collected from Pelly Creek in 2006 and 2018 available for both spatial and temporal comparisons. Although water chemistry for samples from the lower Finlay River were similar to that of the reservoir, Sr for tributaries differed from the reservoir, particularly Russel Creek where Sr was greater than the reservoir and Ba was slightly lower than the reservoir; Mn was below detection. Other lower Finlay River tributaries draining from the west also had higher levels of Sr than the reservoir. Streams draining from the east, however, had much lower Sr and were similar to the reservoir. We also had archived otoliths from Russel Creek Kokanee spawners collected in 2006 and 2018. Clear separation in water chemistries among the study streams and differences from the reservoir, therefore, provided an opportunity to define natal redd chemistries and assess fidelity to spawning locations in tributary streams to the Williston Reservoir. Stability of water elemental signatures is also necessary to use otolith microchemistry to assess spawner fidelity to natal streams.
4.2. Temporal Stability and Spatial Variation of Water Elemental Signatures
Water stability was important for our study, as large temporal variation in stream chemistry would ultimately confound our ability to differentiate among study locations. While fluctuations in mean elemental concentrations occur seasonally, elemental ratios remain remarkably constant [25]. Elemental ratios were slightly lower during spring freshet (high flow conditions) for the tributaries examined by [25], however, this was of limited concern as most growth for bony structures of fish occurs during base flow conditions [29]—usually summer for temperate regions, but also during winter when larval salmonids are developing. Consistency of elemental signatures within rivers has also been well described by [24]. This finding was also supported by [18], who determined that stream chemistries were stable seasonally and over a two-year duration. Water chemistry was also found to be consistent over two years (2006 and 2007) in the Coldwater River watershed, BC [20]. Water chemistry measured from samples collected at some of the same Coldwater River locations in 2017 indicated that the elemental signatures were consistent after a decade [3].
We also collected water samples in 2020 and 2021 from many of the same locations sampled in 2002 [25]. Water samples collected from Manson River, Omineca River, Osilinka River, Ingenika River, Swannel River, Pelly Creek, and Finlay River at the same locations showed an absolute average difference between the years of 0.156 ± 0.109 mmol mol−1, 0.0291 ± 0.0262 mmol mol−1, and 0.0436 ± 0.0356 mmol mol−1, for Sr, Ba, and Mn, respectively. Chemical signatures, therefore, appear to have been stable over decades for comparisons made for the tributaries sampled in the Williston Reservoir watershed in 2002, 2020, and 2021.
Our work also depended on spatial differences observed in surface waters corresponding to the chemical composition of the intragravel environment, and that the elemental composition of the water would influence the composition of the otolith during the embryonic and alevin stages. In northern areas where freezing occurs, salmon seek areas with upwelling groundwater for spawning [1], which influence the water chemistry within the redd environment. Upwelling groundwater and intragravel permeability within the hyporheic zone results in no significant difference between surface water chemistry and intragravel water [3]. Consequently, the surface water chemistry measurements collected from earlier work and our study adequately represent signatures within the redd environment.
4.3. Distinguishing Natal Otolith Elemental Signatures
Otoliths provide a chronological record of the environmental conditions that fish are exposed to over their lifetime [30,31]. Otoliths are metabolically inert, grow continuously over the lifetime of the fish, and will not be reabsorbed [31]. Elements incorporated into otoliths are also directly proportional to elemental uptake from the surrounding water [19,20,30]. Elemental signatures from the cores of adult otoliths, therefore, are informative of environmental conditions in redds during the early life history of larval salmon. Otolith composition of larval fish, however, is also influenced by maternal nutrients [32]. Determining the end of the maternal signature and the start of the juvenile signature is difficult and complex [27] but can be used to identify natal spawning locations [28] and potential straying among salmonids [3]. Annual otolith increments are wider near the core and become narrower with age. The fixed width of the laser scan, therefore, averages a shorter temporal signature for the natal region of the otolith. Consequently, our ability to detect variation in elemental signatures is greatest near the core of the otolith. The short period of time that post-emergent Kokanee spend in their natal tributaries before migrating downstream to the reservoir, therefore, did not limit the effectiveness of our approach.
4.4. Reliability of Estimates for Fidelity to Spawner Sites
We determined spawning site fidelity to be, on average, 73% among the four spawning locations, but putative homing varied from 61 to 83%. Linear discriminant analysis, however, assigned fish to the best group—even if the elemental signatures did not cluster closely together. Consequently, some of the Kokanee spawners may have been misassigned as they were not from any of the four spawning locations for which we had archived otoliths.
For Stevenson Creek, fidelity was estimated to be 75% with 12 of 16 fish classified to their river of capture. Of the fish assigned to Stevenson Creek, 8 Kokanee spawners clustered with low discriminant function 1 and 2 scores. The other 4 spawners had higher scores, likely due to Sr values similar to the reservoir, but not high enough to cluster with one of the other study streams. Consequently, a more accurate estimate of homing to Stevenson Creek may be 50%. It is likely, however, that these 4 spawners that were assigned to Stevenson Creek but did not cluster with most of the other fish may have been from other Ospika River tributaries that also had low Sr, such as Aley Creek, which has had high escapement [11,12]. Gauvreau Creek is another Ospika River tributary where Kokanee spawn (L. Anderson, personal communication); however, the similarity of water chemistry for Gauvreau Creek to Stevenson Creek made it hard to differentiate these two streams. A more robust interpretation of homing to Stevenson Creek, therefore, may be 50% and an estimate of 25% straying from nearby Ospika River tributaries. The remaining 25% of the spawners likely strayed from spawning locations outside of the Ospika River and potentially from watersheds on the western side or northern region of the reservoir.
Mature Osilinka River Kokanee were intercepted at a site on the mainstem, likely below most of the spawning locations, but 83% of the natal otolith elemental signatures were classified to be from the Osilinka River (10 of 12 fish). Of these 10 fish, however, only 7 clustered tightly and the other 3 were included due to the large size of the confidence ellipse. The high Ba signatures for each of these fish suggest that they likely originated in the Osilinka River watershed, but potentially from an upper tributary or higher in the mainstem. The remaining 2 Kokanee sampled from the Osilinka River had much lower natal Ba signatures and were classified as Pelly Creek fish, although given the overlap of values, there is not much confidence in the assignment. Consequently, homing to the Osilinka River may be as low as 58%.
For Pelly Creek, fidelity was estimated to be 61% (11 of the 18 spawners were correctly assigned). These 11 fish formed a cluster with similar discriminant function scores and likely represent Kokanee homing to Pelly Creek. Homing percentage of 61%, therefore, appears likely for the Pelly Creek spawners. The remaining fish were assigned to Russel Creek (6) and Stevenson Creek (1). The fish assigned to Russel Creek had higher Sr levels and low Ba and Mn levels, which are characteristic of Finlay River tributaries, but we lacked the resolution to define specific natal stream origin. The fish assigned to Stevenson Creek were unlikely to have originated from the Ospika River watershed, due to the magnitude of the Sr and Ba values, and stream origin was unclear for this fish; they may have strayed from other Ingenika River tributaries or even the Ingenika River mainstem.
Russel Creek Kokanee spawners appeared to show high fidelity to a spawning location, 78%. All 4 fish sampled from Russel Creek that were not assigned to the location of capture were classified to Pelly Creek. Two of the fish classified as Pelly Creek clustered with the fish that putatively homed to Pelly Creek and may therefore represent fish straying from Pelly Creek or the Ingenika River watershed more generally. One of the fish classified as Pelly Creek, however, appeared to cluster with the Russel Creek fish, but had the lowest value of Sr of these fish. Based on the similarity of Sr and Ba values for this fish, it likely also homed to Russel Creek. If these fish were assigned to Russel Creek, classification would be 83%. Tributary streams to the Finlay Reach and Omineca Reach have had the highest escapement of Kokanee spawners for aerial enumerations conducted over the last 24 years [10,11,12], indicating the importance of rivers in this part of the watershed for Kokanee spawning. Five of the Kokanee classified as Russel Creek spawners, however, had Sr values that were higher than those that clustered together. The higher natal Sr signatures for these 5 spawners suggests they did not home to Russel Creek, but likely strayed from other tributaries to the Finlay River—likely tributaries higher in the Finlay River watershed based on patterns observed. Homing percentage of 61% (11 of 18), therefore, appears likely for the Russel Creek spawners—although historically, Russel Creek has had some of the highest escapements based on aerial enumerations [10,11,12].
4.5. Post-Emergence Movement Patterns
Elemental signatures across the otolith provide information on water composition throughout the life of the fish. Changes in elemental ratios of Sr and Ba to Ca have been useful to define freshwater movement patterns in juvenile Chinook Salmon (O. tshawytscha), Coho Salmon [20], Slimy Sculpin, and Arctic Grayling [21]. Although rivers and streams in the Williston Reservoir watershed showed considerable differences in water chemistry, water samples collected from various locations in the reservoir showed consistent elemental signatures. After emergence from their natal redds, Kokanee fry are presumed to migrate immediately downstream and into the reservoir. It was expected, therefore, that line scans would show little variation after equilibrating with waters in the reservoir—but this was not the case. Extensive variation in Sr and Ba along the length of the line scan suggest Kokanee are exploiting aquatic habitat with elemental signatures that differ from the reservoir. Although water is the predominant source of elements to the otolith, other factors, such as dietary shifts, can account for 2 to 41% of elements incorporated into the otolith [33]; however, seasonal or ontogenic patterns would then be expected and these were not observed.
4.6. Factors Affecting Homing/Straying
Columbia origin Kokanee were extensively stocked into tributaries of the Williston Reservoir watershed in the Peace and Parsnip Reaches starting in 1990. The number of returning mature Kokanee to the streams where they were stocked has historically been low. Environmental features of streams or social interactions with conspecifics, however, may have greater influence on spawning site selection than homing [34]. Aerial escapement estimates revealed that Columbia origin Kokanee dispersed rapidly after introduction and colonized to more than 68 new watersheds to streams that were greater than 200 km from the locations where they were stocked [10]. Although the original stocking program anticipated that stocking Kokanee eggs and fry would result in fish homing to natal streams [8], rapid dispersal and exploitation of new habitat following the introduction of a species is common [35]. Colonization of new streams through straying does not follow the typical paradigm for Pacific salmon homing to their natal streams [36], but examples of salmon straying over long distances are quite common. Most fish that stray have been recovered close to their natal streams, often within 25 km, which suggests straying within a watershed [37], but much more extensive straying has been recorded. Recovery of tagged Chinook Salmon from streams over distances up to 480 km has been reported [38]. Chinook Salmon introduced to the South Island of New Zealand colonized rivers 200 km north of the initial transplant site in less than 14 years, or approximately 3 generations [33]. Similar rates of dispersal have been found for Chinook Salmon in South America [39].
Population size, habitat availability, and disturbance contribute to dispersal of fish. Larger populations function as sources for fish that colonize new habitat [40]. The extensive stocking into the watershed of over 3.3 million Columbia origin Kokanee in the 1990s from Hill Creek and then Meadow Creek, created a large population and a source for dispersal [9]. Additionally, by 2008, it was estimated that the Kokanee population in the pelagic zone of the Williston Reservoir was up to 9 million fish [41], with escapement in some years up to 250,000 spawners within a single river [10]. The large population size, therefore, would favor range expansion and colonization of new rivers. There are also numerous tributaries to the reservoir that appear well suited for salmonids to spawn. Consequently, habitat was available, although Kokanee have selected tributaries in the Williston watershed that flow into the northwestern portion of the reservoir—not the regions originally stocked. Higher straying rates have also been reported for altered river systems. High rates of straying in Lower Columbia River Chinook Salmon have been found in response to disturbance [42]. Creation of the Williston Reservoir was clearly a disturbance to the watershed, but at the time of the Kokanee stocking program, productivity was high [43]. Changes associated with flooding the watershed even decades after formation, therefore, would also favor dispersal.
Although rates of straying in the first few generations after transplanting salmon to a novel environment are high, lower rates of straying appear to occur after the populations have been established [35]. Reduced straying and fidelity to spawning locations would create reproductively isolated populations and lead to genetic differentiation. The size of the watershed is clearly large enough for population level differences to exist (see [44] for work done on Arctic Grayling in the Williston Reservoir watershed). Columbia Kokanee, however, have only been in the watershed since 1990 at the earliest, which may not be enough time to establish differences. In an earlier study, we found no indication of genetic differences among the tributary spawning Kokanee of Columbia origin [26]. Although there have been few generations to establish genetic structure, the large scale of the watershed makes this somewhat surprising. The large number of Kokanee stocked [9] and the dynamic nature of the reservoir may continue to favor dispersal over homing to natal streams.
5. Conclusions
Our data indicated that, on average, 54.7% of Columbia origin Kokanee returned to their natal stream, suggesting a high rate of straying. The proportion of fish that returned to the watershed of their origin, however, was higher: 82.8%, suggesting that most fish return to their general region and spawn within a single river system and tributaries. The result of homing to natal streams is reproductive isolation and local adaptation. Local adaptation is beneficial, as locally adapted populations perform better when reared in their own environment compared to being transplanted to different environments [45]. Fine-scale local adaptation at the tributary level, however, will be limited by gene flow [46]. The most likely result of increased levels of migration would be local adaptation at a watershed level rather than a single tributary stream [47]. Our otolith microchemistry results indicated that local adaption might develop in the Williston Reservoir at a regional scale. Such local adaptation may also be maintained due to reduced fitness of migrants. For example, Sockeye Salmon that dispersed from similar habitat types (stream-spawners) had similar reproductive success to those that spawned in their natal stream, whereas Sockeye Salmon that dispersed from lake spawning habitats produced fewer offspring [48].
There are benefits to regional homing rather than stream-specific spawning fidelity. Natural stochastic events or over-exploitation may deplete local populations, but recovery may be facilitated with colonization from nearby donor populations [49]. Additionally, low levels of straying may benefit local adaptation to increase effective population size and maintain genetic variability—something that may be particularly important for small populations [50]. Range expansion of Columbia origin Kokanee continues to be a concern [51]. Whether expansion will continue or whether the fish have defined their “home” ranges will continue to be important to determine.
Author Contributions
Conceived and designed the experiment, J.M.S., P.W.B. and L.A.T.; collected the samples, J.M.S. and P.W.B.; analyzed the data, J.M.S. and L.A.T.; interpreted the results, J.M.S., P.W.B. and L.A.T.; wrote the manuscript, J.M.S.; writing—review and editing, J.M.S., P.W.B. and L.A.T.; project administration and funding acquisition, J.M.S., P.W.B. and L.A.T. All authors have read and agreed to the published version of the manuscript.
Funding
This project was funded by the Fish and Wildlife Compensation Program (FWCP), grant number PEA-F21-F-3176. The FWCP is a partnership between BC Hydro, the Province of BC, Fisheries and Oceans Canada, First Nations, and public stakeholders to conserve and enhance fish and wildlife in watersheds impacted by BC Hydro dams.
Institutional Review Board Statement
The study was conducted following the guidelines for experimental procedures in animal research from the Animal Care and Use Committee of the University of Northern British Columbia, protocols 2016-05, 2017-06, and 2018-10.
Data Availability Statement
Data from this study are available from the corresponding author upon request (J.M.S.; mark.shrimpton@unbc.ca).
Acknowledgments
We thank Chelsea Coady (FWCP), Matt Casselman (BC Hydro), Carmen Richter (Saulteau First Nations), Nikolaus Gantner (BCMoF), Randy Zemlak (BC Hydro), and Kristen Peck (DFO) for technical advice on the project, Arne Langston and Randy Zemlak (BC Hydro) for collecting fish in 2006, Lindi Anderson and Mike Tilson (Chu Cho Environmental) for collecting fish in 2016 and 2017, Andrew McDermot-Fouts and Jesse Laframboise (DWB Consulting) for collecting fish in 2018 under contract to BC MoFLNRORD funded by FWCP—Peace Region, Mike Stamford (Stamford Environmental) for providing unpublished water chemistry data and collecting water samples, Adrian Clarke (FFSBC) for providing unpublished water chemistry data, Claire Shrimpton and Phillip Shrimpton for assistance in collecting water samples, Erwin Rehl and Charles Bradshaw (Northern Analytical Lab Services) for ICP-OES analysis of water samples, Jody Spence and Nicole LaForge (UVic) for LA-ICP-MS analysis of otolith samples, Jennie Christensen and Dwayne Smith (TrichAnalytics) for LA-ICP-MS analysis of otolith samples, and two anonymous reviewers for their constructive comments.
Conflicts of Interest
The authors declare no conflict of interest.
References
- Quinn, T.P. The Behavior and Ecology of Pacific Salmon and Trout; UBC Press: Vancouver, BC, Canada, 2005. [Google Scholar]
- Quinn, T.P.; Stewart, I.J.; Boatright, C.P. Experimental evidence of homing to site of incubation by mature sockeye salmon, Oncorhynchus nerka. Anim. Behav. 2006, 72, 941–949. [Google Scholar] [CrossRef]
- Turcotte, L.A.; Shrimpton, J.M. Assessment of spawning site fidelity in Interior Fraser River Coho Salmon Oncorhynchus kisutch using otolith microchemistry, in British Columbia, Canada. J. Fish. Biol. 2020, 97, 1833–1841. [Google Scholar] [CrossRef] [PubMed]
- Baxter, C.V.; Hauer, F.R. Geomorphology, hyporheic exchange, and selection of spawning habitat by bull trout (Salvelinus confluentus). Can. J. Fish. Aquat. Sci. 2000, 57, 1470–1481. [Google Scholar] [CrossRef]
- McRae, C.J.; Warren, K.D.; Shrimpton, J.M. Spawning site selection in Interior Fraser River coho salmon (Oncorhynchus kisutch): An imperiled population of anadromous salmon from an interior, snow-dominated watershed. Endang. Species Res. 2012, 16, 249–260. [Google Scholar] [CrossRef]
- Tuor, K.M.F.; Shrimpton, J.M. Differences in water temperatures experienced by embryo and larval Coho Salmon (Oncorhynchus kisutch) across their geographic range in British Columbia. Environ. Biol. Fish. 2019, 102, 955–967. [Google Scholar] [CrossRef]
- Shrimpton, J.M.; Heath, D.D. Census vs. effective population size in chinook salmon: Large- and small-scale environmental perturbation effects. Mol. Ecol. 2003, 12, 2571–2583. [Google Scholar] [CrossRef] [PubMed]
- Blackman, B.G.; Jesson, D.A.; Ableson, D.; Down, T. Williston Lake Fisheries Compensation Program Management Plan; Peace/Williston Fish & Wildlife Compensation Program Report No. 58; BC Hydro: Prince George, BC, Canada, 1990; 38p. [Google Scholar]
- Langston, A.R.; Murphy, E.B. The History of Fish Introductions (to 2005) in the Peace/Williston Fish and Wildlife Compensation Program Area; Peace/Williston Fish and Wildlife Compensation Program Report No. 325; BC Hydro: Prince George, BC, Canada, 2008; 59p. [Google Scholar]
- Langston, A.R. Williston Watershed Kokanee Spawner Distribution and Enumeration Surveys (2002–2006); Fish and Wildlife Compensation Program–Peace Region Report No. 357; BC Hydro: Prince George, BC, Canada, 2012; 11p. [Google Scholar]
- McDermot-Fouts, A. Williston Watershed Kokanee Spawner Distribution and Aerial Enumeration Surveys (2018); FWCP Project No. PEA-F19-F-2895-DC-103364; DWB Consulting Services Ltd.: Prince George, BC, Canada, 2019; 23p. [Google Scholar]
- Robinson, M. Williston Watershed Kokanee Spawner Distribution and Aerial Enumeration Surveys (2019); FWCP Project No. PEA-F20-F-3359-DC-106374; DWB Consulting Services Ltd.: Prince George, BC, Canada, 2020; 34p. [Google Scholar]
- Langston, A.R.; Zemlak, R.J. Williston Reservoir Stocked Kokanee Spawning Assessment, 1994; Peace/Williston Fish and Wildlife Compensation Program, Report No. 176; BC Hydro: Prince George, BC, Canada, 1998; 13p. [Google Scholar]
- Burgner, R.L. Life history of sockeye salmon (Oncorhynchus nerka). In Pacific Salmon Life Histories; Groot, C., Margolis, L., Eds.; UBC Press: Vancouver, BC, Canada, 1991; pp. 3–101. [Google Scholar]
- Kennedy, B.P.; Blum, J.D.; Folt, C.L. Natural isotope markers in salmon. Nature 1997, 387, 766–767. [Google Scholar] [CrossRef]
- Rutter, N.W. Multiple Glaciations in the Area of Williston Lake, British Columbia; Geological Survey of Canada Bulletin no. 273; Energy, Mines and Resources Canada: Ottawa, ON, Canada, 1976; 31p. [Google Scholar]
- Armstrong, A.T. 1979 Report of Exploration Activities on North Carbon Creek Coal Property; Utah Mines Ltd., Exploration Division: Vancouver, BC, Canada, 1979; 23p. [Google Scholar]
- Wells, B.K.; Rieman, B.E.; Clayton, J.L.; Horan, D.L.; Jones, C.M. Relationships between water, otolith, and scale chemistries of westslope cutthroat trout from the Coeur d’Alene River, Idaho: The potential application of hard-part chemistry to describe movements in freshwater. Tran. Am. Fish. Soc. 2003, 132, 409–424. [Google Scholar] [CrossRef]
- Clarke, A.D.; Telmer, K.H.; Shrimpton, J.M. Using natural elemental signatures to determine habitat use and population structure for a fluvial species, the Arctic grayling, in a watershed impacted by a large reservoir. J. Appl. Ecol. 2007, 44, 1156–1165. [Google Scholar] [CrossRef]
- Shrimpton, J.M.; Warren, K.D.; Todd, N.L.; McRae, C.J.; Glova, G.J.; Telmer, K.H.; Clarke, A.D. Freshwater movement patterns in juvenile Pacific salmon Oncorhynchus spp. before they migrate to the ocean: Oh the places you’ll go! J. Fish Biol. 2014, 85, 987–1004. [Google Scholar] [CrossRef]
- Clarke, A.D.; Telmer, K.H.; Shrimpton, J.M. Movement patterns of fish revealed by otolith microchemistry: A comparison of putative migratory and resident species. Environ. Biol. Fish. 2015, 98, 1583–1597. [Google Scholar] [CrossRef]
- Shiller, A.M. Syringe filtration methods for examining dissolved and colloidal trace element distribution in remote field locations. Environ. Sci. Technol. 2003, 37, 3953–3957. [Google Scholar] [CrossRef] [PubMed]
- Freeze, R.A.; Cherry, J.A. Groundwater; Prentice-Hall: Englewood Cliffs, NJ, USA, 1979. [Google Scholar]
- Taylor, B.R.; Hamilton, H.R. Comparison of methods for determination of total solutes in flowing waters. J. Hydrol. 1994, 154, 291–300. [Google Scholar] [CrossRef]
- Clarke, A.D.; Telmer, K.; Shrimpton, J.M. Discrimination of Habitat Use by Slimy Sculpin (Cottus cognatus) in Tributaries of the Williston Reservoir Using Natural Elemental Signatures; Peace/Williston Fish and Wildlife Compensation Program Report No. 288; BC Hydro: Prince George, BC, Canada, 2004; 33p. [Google Scholar]
- Wilson, P.N.; Shrimpton, J.M. Genetic Population Structure and Demographics of Kokanee Introduced to the Williston Reservoir; Fish & Wildlife Compensation Program—Peace Region Project Report PEA-F29-F-3143-DCA; BC Hydro: Prince George, BC, Canada, 2021; 41p. [Google Scholar]
- Hegg, J.C.; Kennedy, B.P.; Chittaro, P. What did you say about my mother? The complexities of maternally derived chemical signatures in otoliths. Can. J. Fish. Aquat. Sci. 2019, 76, 81–94. [Google Scholar] [CrossRef]
- Janak, J.M.; Linley, T.J.; Harnish, R.A.; Shen, S.D. Partitioning maternal and exogenous diet contributions to otolith 87Sr/86Sr in Kokanee Salmon (Oncorhynchus nerka). Can. J. Fish. Aquat. Sci. 2021, 78, 1146–1157. [Google Scholar] [CrossRef]
- Kennedy, B.P.; Folt, C.L.; Blum, J.D.; Nislow, K.H. Using natural strontium isotopic signatures as fish markers: Methodology and application. Can. J. Fish. Aquat. Sci. 2000, 57, 2280–2292. [Google Scholar] [CrossRef]
- Campana, S.; Thorrold, S. Otoliths, increments, and elements: Keys to a comprehensive understanding of fish populations? Can. J. Fish. Aquat. Sci. 2001, 58, 30–38. [Google Scholar] [CrossRef]
- Campana, S.E. Chemistry and composition of fish otoliths: Pathways, mechanisms and applications. Mar. Ecol. Prog. Ser. 1999, 188, 263–297. [Google Scholar] [CrossRef] [Green Version]
- Volk, E.C.; Blakley, A.; Schroder, S.L.; Kuehner, S.M. Otolith chemistry reflects migratory characteristics of Pacific salmonids: Using otolith core chemistry to distinguish maternal associations with sea and freshwaters. Fish. Res. 2000, 46, 251–266. [Google Scholar] [CrossRef]
- Doubleday, Z.; Izzo, C.; Gillanders, B.; Woodcock, S. Relative contribution of water and diet to otolith chemistry in freshwater fish. Aquat. Biol. 2013, 18, 271–280. [Google Scholar] [CrossRef] [Green Version]
- Dittman, A.H.; May, D.; Larson, D.A.; Moser, M.L.; Johnston, M.; Fast, D. Homing and spawning site selection by supplemented hatchery- and natural-origin Yakima River Chinook Salmon. Trans. Am. Fish. Soc. 2010, 139, 1014–1028. [Google Scholar] [CrossRef]
- Quinn, T.P.; Kinnison, M.T.; Unwin, M.J. Evolution of chinook salmon (Oncorhynchus tshawytscha) populations in New Zealand: Pattern, rate, and process. Genetica 2001, 112–113, 493–513. [Google Scholar] [CrossRef]
- Groot, C.; Margolis, L. Pacific Salmon Life Histories; UBC Press: Vancouver, BC, USA, 1991. [Google Scholar]
- Hard, J.J.; Heard, W.R. Analysis of straying variation in Alaskan hatchery chinook salmon (Oncorhynchus tshawytscha) following transplantation. Can. J. Fish. Aquat. Sci. 1999, 56, 578–589. [Google Scholar] [CrossRef]
- Candy, J.R.; Beacham, T.D. Patterns of homing and straying in southern British Columbia coded-wire tagged chinook salmon (Oncorhynchus tshawytscha) populations. Fish. Res. 2000, 47, 41–56. [Google Scholar] [CrossRef]
- Correa, C.; Gross, M.R. Chinook salmon invade southern South America. Biol. Invasions 2008, 10, 615–639. [Google Scholar] [CrossRef]
- Palstra, F.P.; O’Connell, M.F.; Ruzzante, D.E. Population structure and gene flow reversals in Atlantic salmon (Salmo salar) over contemporary and long-term temporal scales: Effects of population size and life history. Mol. Ecol. 2007, 16, 4504–4522. [Google Scholar] [CrossRef]
- Sebastian, D.; Andrusak, G.; Scholten, G.; Langston, A. Peace Project Water Use Plan Williston Fish Index, GMSMON-13. An Index of Fish Distribution and Abundance in Peace Arm of Williston; Ministry of Environment: Victoria, BC, Canada, 2009; 58p. [Google Scholar]
- Quinn, T.P.; Nemeth, R.S.; McIsaac, D.O. Homing and straying patterns of fall chinook salmon in the lower Columbia River. Trans. Am. Fish. Soc. 1991, 120, 150–156. [Google Scholar] [CrossRef]
- Sebastian, D.C.; Scholten, G.H.; Woodruff, P.E. Williston Reservoir Fish Assessment: Results of Hydroacoustic, Trawl and Gill Net Surveys in August 2000; Stock Management Report No. 16; Ministry of Water Land and Air Protection: Victoria, BC, Canada, 2003; 34p. [Google Scholar]
- Stamford, M.D.; Taylor, E.B. Population subdivision and genetic signatures of demographic changes in Arctic grayling (Thymallus arcticus) from an impounded watershed. Can. J. Fish. Aquat. Sci. 2005, 62, 2548–2559. [Google Scholar] [CrossRef]
- Fraser, D.J.; Weir, L.K.; Bernatchez, L.; Hansen, M.M.; Taylor, E.B. Extent and scale of local adaptation in salmonid fishes: Review and meta-analysis. Heredity 2011, 106, 404–420. [Google Scholar] [CrossRef] [Green Version]
- Hendry, A.P.; Taylor, E.B.; McPhail, J.D. Adaptive divergence and the balance between selection and gene flow: Lake and stream stickleback in the Misty system. Evolution 2002, 56, 1199–1216. [Google Scholar] [CrossRef]
- Vähä, J.-P.; Erkinaro, J.; Niemelä, E.; Primmer, C.R. Temporally stable genetic structure and low migration in an Atlantic salmon population complex: Implications for conservation and management. Evol. Applic. 2008, 1, 137–154. [Google Scholar] [CrossRef] [PubMed]
- Peterson, D.A.; Hilborn, R.; Hauser, L. Local adaptation limits lifetime reproductive success of dispersers in a wild salmon metapopulation. Nat. Commun. 2014, 5, 3696. [Google Scholar] [CrossRef] [PubMed] [Green Version]
- Heath, D.D.; Busch, C.; Kelly, J.; Atagi, D.Y. Temporal change in genetic structure and effective population size in steelhead trout (Oncorhynchus mykiss). Mol. Ecol. 2002, 11, 197–214. [Google Scholar] [CrossRef] [PubMed]
- Walter, R.P.; Aykanat, T.; Kelly, D.W.; Shrimpton, J.M.; Heath, D.D. Gene flow increases temporal stability of Chinook salmon (Oncorhynchus tshawytscha) populations in the Upper Fraser River, British Columbia, Canada. Can. J. Fish. Aquat. Sci. 2009, 66, 167–176. [Google Scholar] [CrossRef] [Green Version]
- Pearce, T.; Morgan, J.; Case, S. First Nations Information Gathering on Kokanee, Bull Trout and Arctic Grayling: Kwadacha Nation; Fish & Wildlife Compensation Progrm—Peace Region Project No. PEA-F19-F-2866; BC Hydro: Prince George, BC, Canada, 2019; 18p. [Google Scholar]
Publisher’s Note: MDPI stays neutral with regard to jurisdictional claims in published maps and institutional affiliations. |
© 2022 by the authors. Licensee MDPI, Basel, Switzerland. This article is an open access article distributed under the terms and conditions of the Creative Commons Attribution (CC BY) license (https://creativecommons.org/licenses/by/4.0/).