Article

Environmental DNA Metabarcoding Reflects Fish DNA Dynamics in Lentic Ecosystems: A Case Study of Freshwater Ponds

1
Key Laboratory of Freshwater Fish Reproduction and Development (Ministry of Education), School of Life Sciences, Southwest University, Chongqing 400715, China
2
College of Fisheries, Southwest University, Rongchang 402460, China
*
Author to whom correspondence should be addressed.
These authors contributed equally to this work.
Fishes 2022, 7(5), 257; https://doi.org/10.3390/fishes7050257
Submission received: 20 August 2022 / Revised: 18 September 2022 / Accepted: 21 September 2022 / Published: 26 September 2022

Abstract

:
Environmental DNA (eDNA) is a good indicator of fish diversity and distribution in aquatic environments. This study used metabarcoding to assess fish diversity and distribution in two connected ponds during two sampling periods. The eDNA analysis of surface samples displayed differences in the fish communities between the two connected ponds, while within each sampling site the species detected across the two time points were not always the same. These results revealed poor horizontal transport of eDNA between the two connected ponds alongside poor mixing of eDNA for a single pond’s stocked fish. Additionally, water temperature, pH, and total nitrogen were the key environmental factors affecting fish eDNA spatial and temporal distribution. These findings have important implications for designing eDNA sampling strategies in lentic ecosystems; for example, complete fish diversity in a lentic ecosystem cannot be detected by collecting only surface samples and in only one sampling period.

1. Introduction

Environmental DNA (eDNA) analysis has been demonstrated to be a rapid and effective tool in fish monitoring and management for species detection, abundance estimation, and biodiversity assessment [1,2]. This tool utilizes DNA directly extracted from environmental samples (e.g., water) to detect the presence of target organisms without capturing them, and thus is non-invasive, cost-effective, and more sensitive compared to conventional monitoring methods [3,4,5]. eDNA metabarcoding employs polymerase chain reaction (PCR) based on universal primers and high-throughput sequencing to increase species detection efficiency. This technique can simultaneously identify multiple fish species from a single water sample along with estimating the relative abundance of fish species according to sequence counts [6].
Standardized long-term fishery management depends on the dynamic knowledge of the spatial and temporal distribution of fish communities. Recently, eDNA metabarcoding has been successfully used to monitor spatial and temporal changes in fish communities in both freshwater and marine ecosystems [7,8,9,10]. Stoeckle et al. (2017) [8] demonstrated that the habitat preference and seasonal distribution of marine fish detected with eDNA corresponded to that determined by conventional monitoring, which indicates the potential of eDNA to accurately reflect the spatio-temporal dynamics of fish communities. However, the causes of spatial and seasonal variations in eDNA detection vary among diverse aquatic ecosystems. In lotic ecosystems (such as rivers, streams and estuaries), spatial differences in fish communities among sites detected with eDNA have been revealed to be related to fish habitat preferences [8] and eDNA downstream transport [11]. Seasonal changes in fish assemblages in the open water are known to be related to abiotic environmental factors (e.g., month phase and salinity regime of estuaries and temporal water flow of rivers and streams) and fish movements (e.g., the spawning activity of anadromous fish) [9,10,12,13]. Although several studies have shown the spatiotemporal dynamics of fish eDNA in lentic ecosystems (such as ponds and lakes) [14,15,16], it was only a case study that revealed that water stratification is the reason for temporal and spatial variations in lake fish eDNA detection [17]. These studies illustrated that the species detection probability using DNA in aquatic environments is highly affected by the spatio-temporal heterogeneity of eDNA distribution. Therefore, the characterization of the spatio-temporal heterogeneity of eDNA is of great importance for the knowledge of eDNA dynamics in aquatic ecosystems [18] and for designing appropriate sampling strategies for dynamic fish monitoring [19,20].
In this study, we detected the species composition and relative abundance of fish communities in two connected ponds in July and November 2019 using metabarcoding. Our objective was to investigate whether fish eDNA detection differs across space and time and thereby reveal the spatio-temporal distribution patterns of eDNA in lentic ecosystems. Additionally, we attempted to explore the reasons leading to spatial and temporal differences in fish DNA in ponds, including the relationship between environmental factors and fish eDNA distributions. We attempt to provide an appropriate sampling strategy for accurate fish diversity monitoring in lentic ecosystems.

2. Materials and Methods

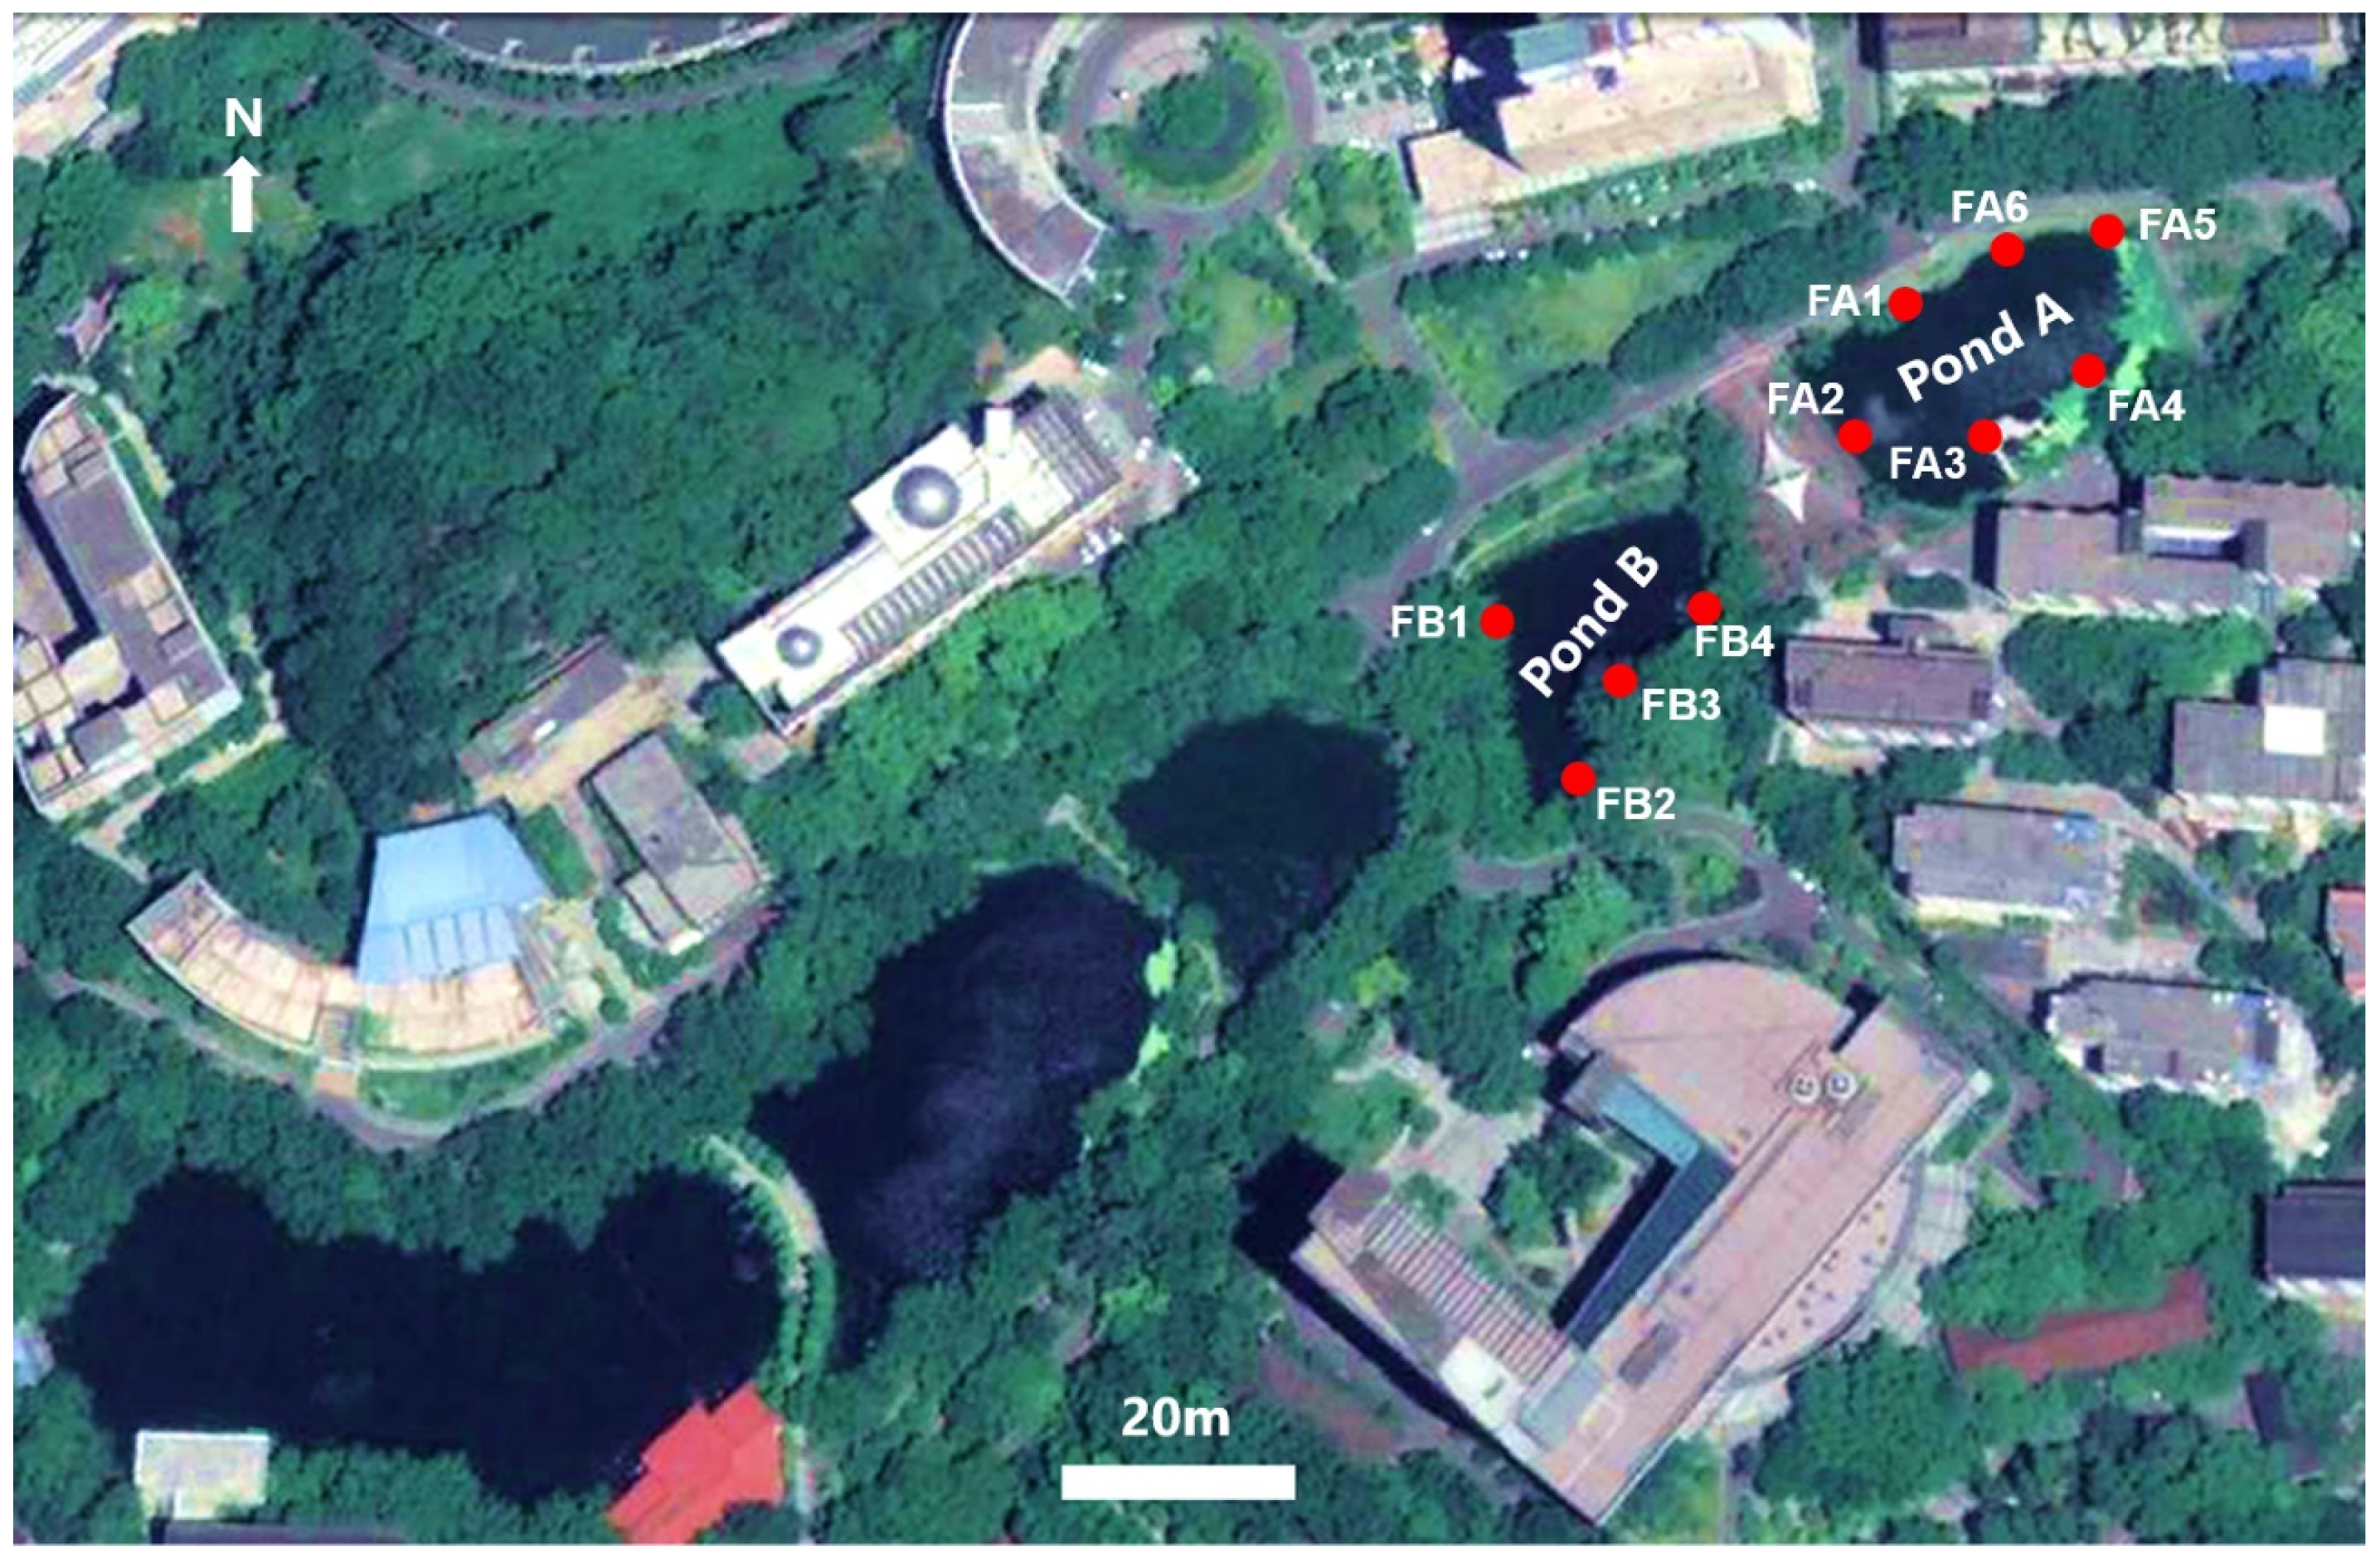
2.1. Study Sites and Field Sampling Protocol

A total of ten sampling sites were investigated in two artificial ponds (Pond A and Pond B; Figure 1) at Southwest University (Beibei, Chongqing, China) in July and November 2019. Sampling sites were separated by 20–30 m in each pond. The surface area was approximately 2000 m2 for Pond A and 1100 m2 for Pond B, and the water depth was approximately 2 m for both ponds. The ponds are fed from rainfall with no stream water inflow. They are connected by a pipe allowing water to flow from the higher pond (Pond A) to the lower pond (Pond B). Because of an interception net with 1 mm mesh netting in the pipe, fish larvae are generally unable to transfer between the two ponds. Using sterile plastic bottles at each site, 1 L surface water samples were collected in triplicate. To check for contamination during the sampling process, 1 L of double-distilled H2O (ddH2O) was included in each pond sampling. For each sampling, a total of 32 water samples, including two negative controls, were stored on ice then immediately brought to the laboratory and filtered using 0.45 µm mixed cellulose acetate and nitrate filters (Whatman, Maidstone, UK). To avoid cross-contamination, all equipment was bleached and rinsed after every filtration for each triplicate sample, and 1 L of ddH2O was filtered to test for contamination during filtration. All filters were subsequently stored at −20 °C until DNA extraction.
Prior to eDNA collection, conventional surveys were conducted using two methods, i.e., visual observation and an umbrella fish trap (i.e., 134 cm3 crayfish traps with 16 conical funnel entrances fitted with 5 mm mesh netting), to determine fish assemblages in the two ponds. Umbrella fish traps were set at a depth of approximately 80 cm at 4 sites near the shore per pond. The trappings were carried out 4 times, and each trapping lasted two days in May 2019.
Additionally, environmental factors including water temperature (WT), pH, dissolved oxygen (DO), total nitrogen (TN), nitrate (NO3N), total phosphorus (TP), ammonium (NH4N), chemical oxygen demand (COD), and phosphate (PO4P) were measured from 50 mL water samples collected in triplicate at each site between July and November (Table S1). WT and DO were determined using a thermometer and a portable dissolved oxygen meter (HACH, Loveland, CO, USA), respectively. pH values were measured using a pH tester (SevenExcellenceTM, Mettler Toledo, Switzerland). Nutritive salts for pond water were characterized using water quality analysis kits (HACH, Loveland, CO, USA; Merck, Darmstadt, Germany).

2.2. eDNA Extraction, Amplification, and Illumina Sequencing

eDNA was isolated from the filters using the PowerWater DNA Isolation Kit (MoBio Qiagen Laboratories Inc., Carlsbad, CA, USA) following the manufacturer’s protocol. To control for contamination during DNA extraction, a blank filter was included in each set of extractions. All eDNA extracts were stored at −20 °C until PCR amplification.
We used the fish universal primers Mifish-U to amplify the eDNA templates. These primers are designed for a 163–185 bp fragment of the high variation region of the mitochondrial 12S rRNA gene [21], which has been widely used in eDNA metabarcoding analysis of fish [22]. All PCR amplifications were performed in triplicate with 25 μL total volume, which included 1.0 μL of DNA template, 1.0 μL each of the forward and reverse primers, and 22 μL of 1.1 × T3 Super PCR Mix (Tsingke, Beijing, China). The thermal cycling profile was as follows: 98 °C for 2 min; 35 cycles of 98 °C for 10 s, 59 °C for 10 s, and 72 °C for 10 s; 72 °C for 2 min. To determine contamination during PCR procedures, 1 μL of ddH2O was used as the template for each PCR blank. PCR products were examined using 2% agarose gel electrophoresis and then purified using an AxyPrep™ Mag PCR Clean-Up Kit (Axygen, Hangzhou, China). The negative controls were not analyzed further because no target DNA was amplified from the negative controls.
Finally, Illumina Paired-End libraries were constructed from PCR products using a TruSeq Nano DNA HT Library Prep Kit (Illumina, San Diego, CA, USA) and then sequenced using an Illumina NovaSeq 6000 S4 Reagent Kit for paired-end 2 × 150 bp (Illumina, San Diego, CA, USA).

2.3. Metabarcoding Analysis

The quality of raw reads was evaluated by FastQC [23], and low-quality (Phred score < 20 by default) tails were trimmed. The paired-end reads were assembled using Flash [24]. Merged reads that contained ambiguous bases or were too short (target sequence length > 100 bp by default) were removed. Operational taxonomic units (OTUs) were clustered as identical sequences (97% sequence similarity, E-value = 10−5) using UCLAST [25]. Taxonomic assignment of OTUs was performed using a BLAST search [26] on the National Center for Biotechnology Information (NCBI) GenBank database. BLAST results with >97% similarity across 100% of read lengths were used for further analysis. To avoid sequencing errors, annotated sequences in which the proportion of read counts in a real sample was less than 0.3% were discarded [27]. Read numbers of each eDNA sample were standardized based on the smallest total number of reads observed among all samples to ensure that the read numbers per taxa among sites and sampling replicates were comparable. For each sampling, the read numbers of taxa detected from the three replicate water samples per site were averaged for statistical analyses.

2.4. Statistical Analysis

Berger et al. (2020) [19] indicated that sequence abundance measured by eDNA metabarcoding with the MiFish-U primer set can be used as a fair proxy to estimate fish relative abundance in nature. Thus, this study uses eDNA reads to infer fish relative abundance. To demonstrate the species composition of fish communities detected via eDNA in two sampling replicates from the two ponds, a bar histogram was plotted using the barplot function within the base package in R v3.5.3 [28], based on the average reads of each species determined from all sampling sites per pond per sampling replicate. The spatial and temporal differences in fish eDNA detection in the ponds were estimated in nonmetric multidimensional scaling (NMDS) analysis. NMDS analysis was performed on the Bray–Curtis distance matrix based on the average reads of species in each triplicate sample using the Vegan package in R, and the fish assemblage structure based on relative sequence abundances was plotted by a two-dimensional sorting graph. Differences in β-diversities based on the Bray–Curtis dissimilarity indexes between samples were tested using the permutational multivariate analysis of variance (PERMANOVA) in the Vegan package. We then performed redundancy analysis (RDA) on log-transformed read abundances for each species in the Vegan package to analyze the explanatory power of environmental factors on the eDNA distributions from spatial and temporal differences.

3. Results

3.1. Fish Diversity

During July and November, 22.73 million high-quality reads were generated for all samples in the two ponds, which were then clustered into 402 OTUs. After excluding non-fish and unidentified sequences, 103 fish OTUs remained. Then, multiple representative OTU sequences were aligned to one species/taxon if there was >97% sequence identity across 100% of read lengths. Finally, 14 taxa were identified based on 103 fish OTUs from samples collected across two sampling replicates in the ponds. These fish taxa corresponded to eleven identified at the species level, two at the genus level, and one at the family level (Table 1). The average number of standardized reads for each fish taxon detected from the three replicate water samples per site in two sampling replicates are presented in Table S2. According to the relative sequence abundance of fish (Figure 2), Carassius species, Hypophthalmichthys nobilis, H. molitrix, Gambusia affinis, and Pseudorasbora parva were the dominant fish species in the ponds during July and November. Fish species observed and trapped at Pond A and Pond B in May 2019 are displayed in Table S3. A total of 10 fish species in two ponds were confirmed with conventional methods and historical records.

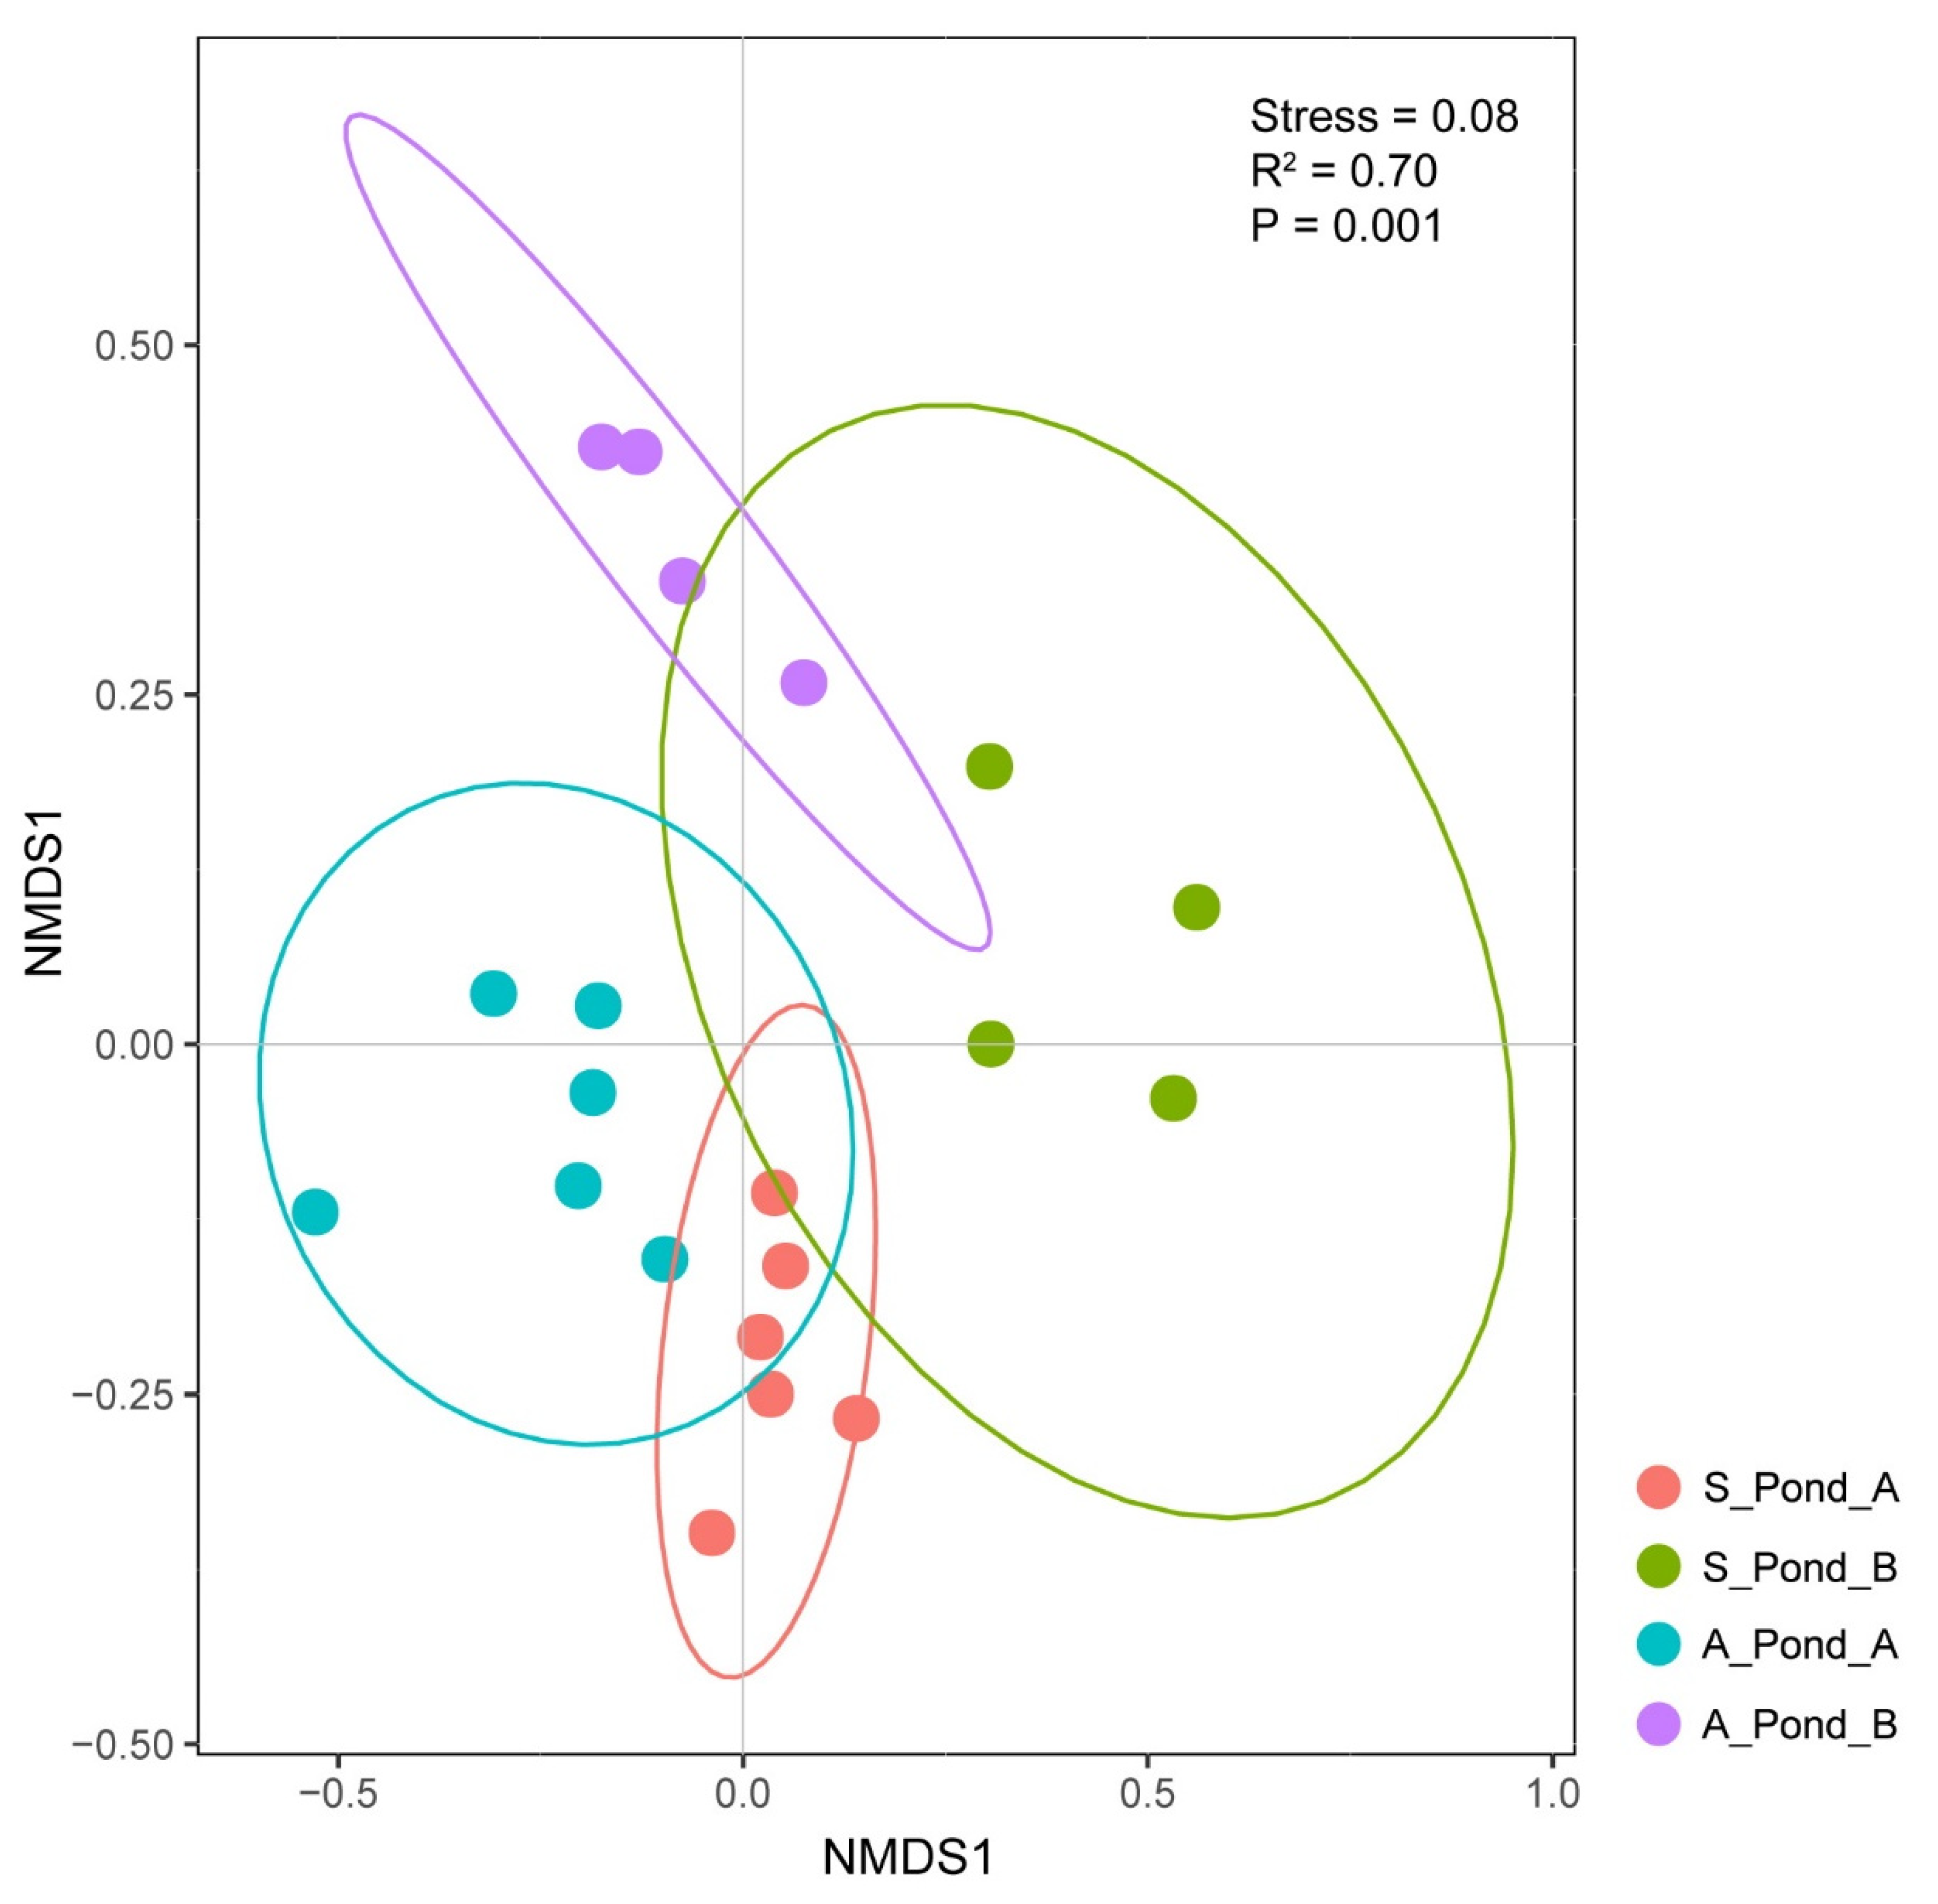
3.2. Differences in Spatial and Temporal Fish eDNA Detections

Although the water can flow from Pond A into Pond B, there were variations in fish diversity assessed using eDNA between the two ponds. A total of 13 species were detected in Pond A, which did not include Rhodeus ocellatus, which was present in Pond B, while 11 species were detected in Pond B, which did not include Monopterus albus, Mylopharyngodon piceus, and Rhinogobius cliffordpopei, which were present in Pond A (Table 2). Temporal differences in eDNA detection were also found per pond between July and November. For Pond A, M. albus and M. piceus were only detected in July, whereas the cobitid fish was only detected in November. For Pond B, C. idella was only detected in July, whereas the cobitid fish, C. carpio, Oreochromis, and Rhinogobius giurinus were only detected in November (Table 1).
Spatial and temporal assemblage structures based on relative sequence abundances were illustrated in a two-dimensional sorting graph using NMDS analysis (Figure 3). The test statistics between samples for the PERMANOVA analysis are displayed in Table S4. In July, there were significant differences in fish eDNA distributions between Pond A and Pond B (R2 = 0.56, p < 0.01). In November, significant variations were also detected between Pond A and Pond B (R2 = 0.55, p < 0.01). Additionally, fish compositions based on read abundances were significantly different between the two sampling periods (S_Pond_A vs. A_Pond_A, R2 = 0.44, p = 0.001; S_Pond_B vs. A_Pond_B, R2 = 0.64, p < 0.05). These results indicated that the fish assemblages detected with eDNA differed significantly between the two ponds over the two sampling periods.
Figure 2. Fish composition detected by eDNA metabarcoding in two ponds for two sampling periods. Bar charts displaying the species richness and relative reads abundance for spatial and temporal samples. The sample abbreviations are samples collected from Pond A in July 2019 (S_Pond_A), samples collected from Pond B in July 2019 (S_Pond_B), samples collected from Pond A in November 2019 (A_Pond_A), and samples collected from Pond B in November 2019 (A_Pond_B).
Fishes 07 00257 g002

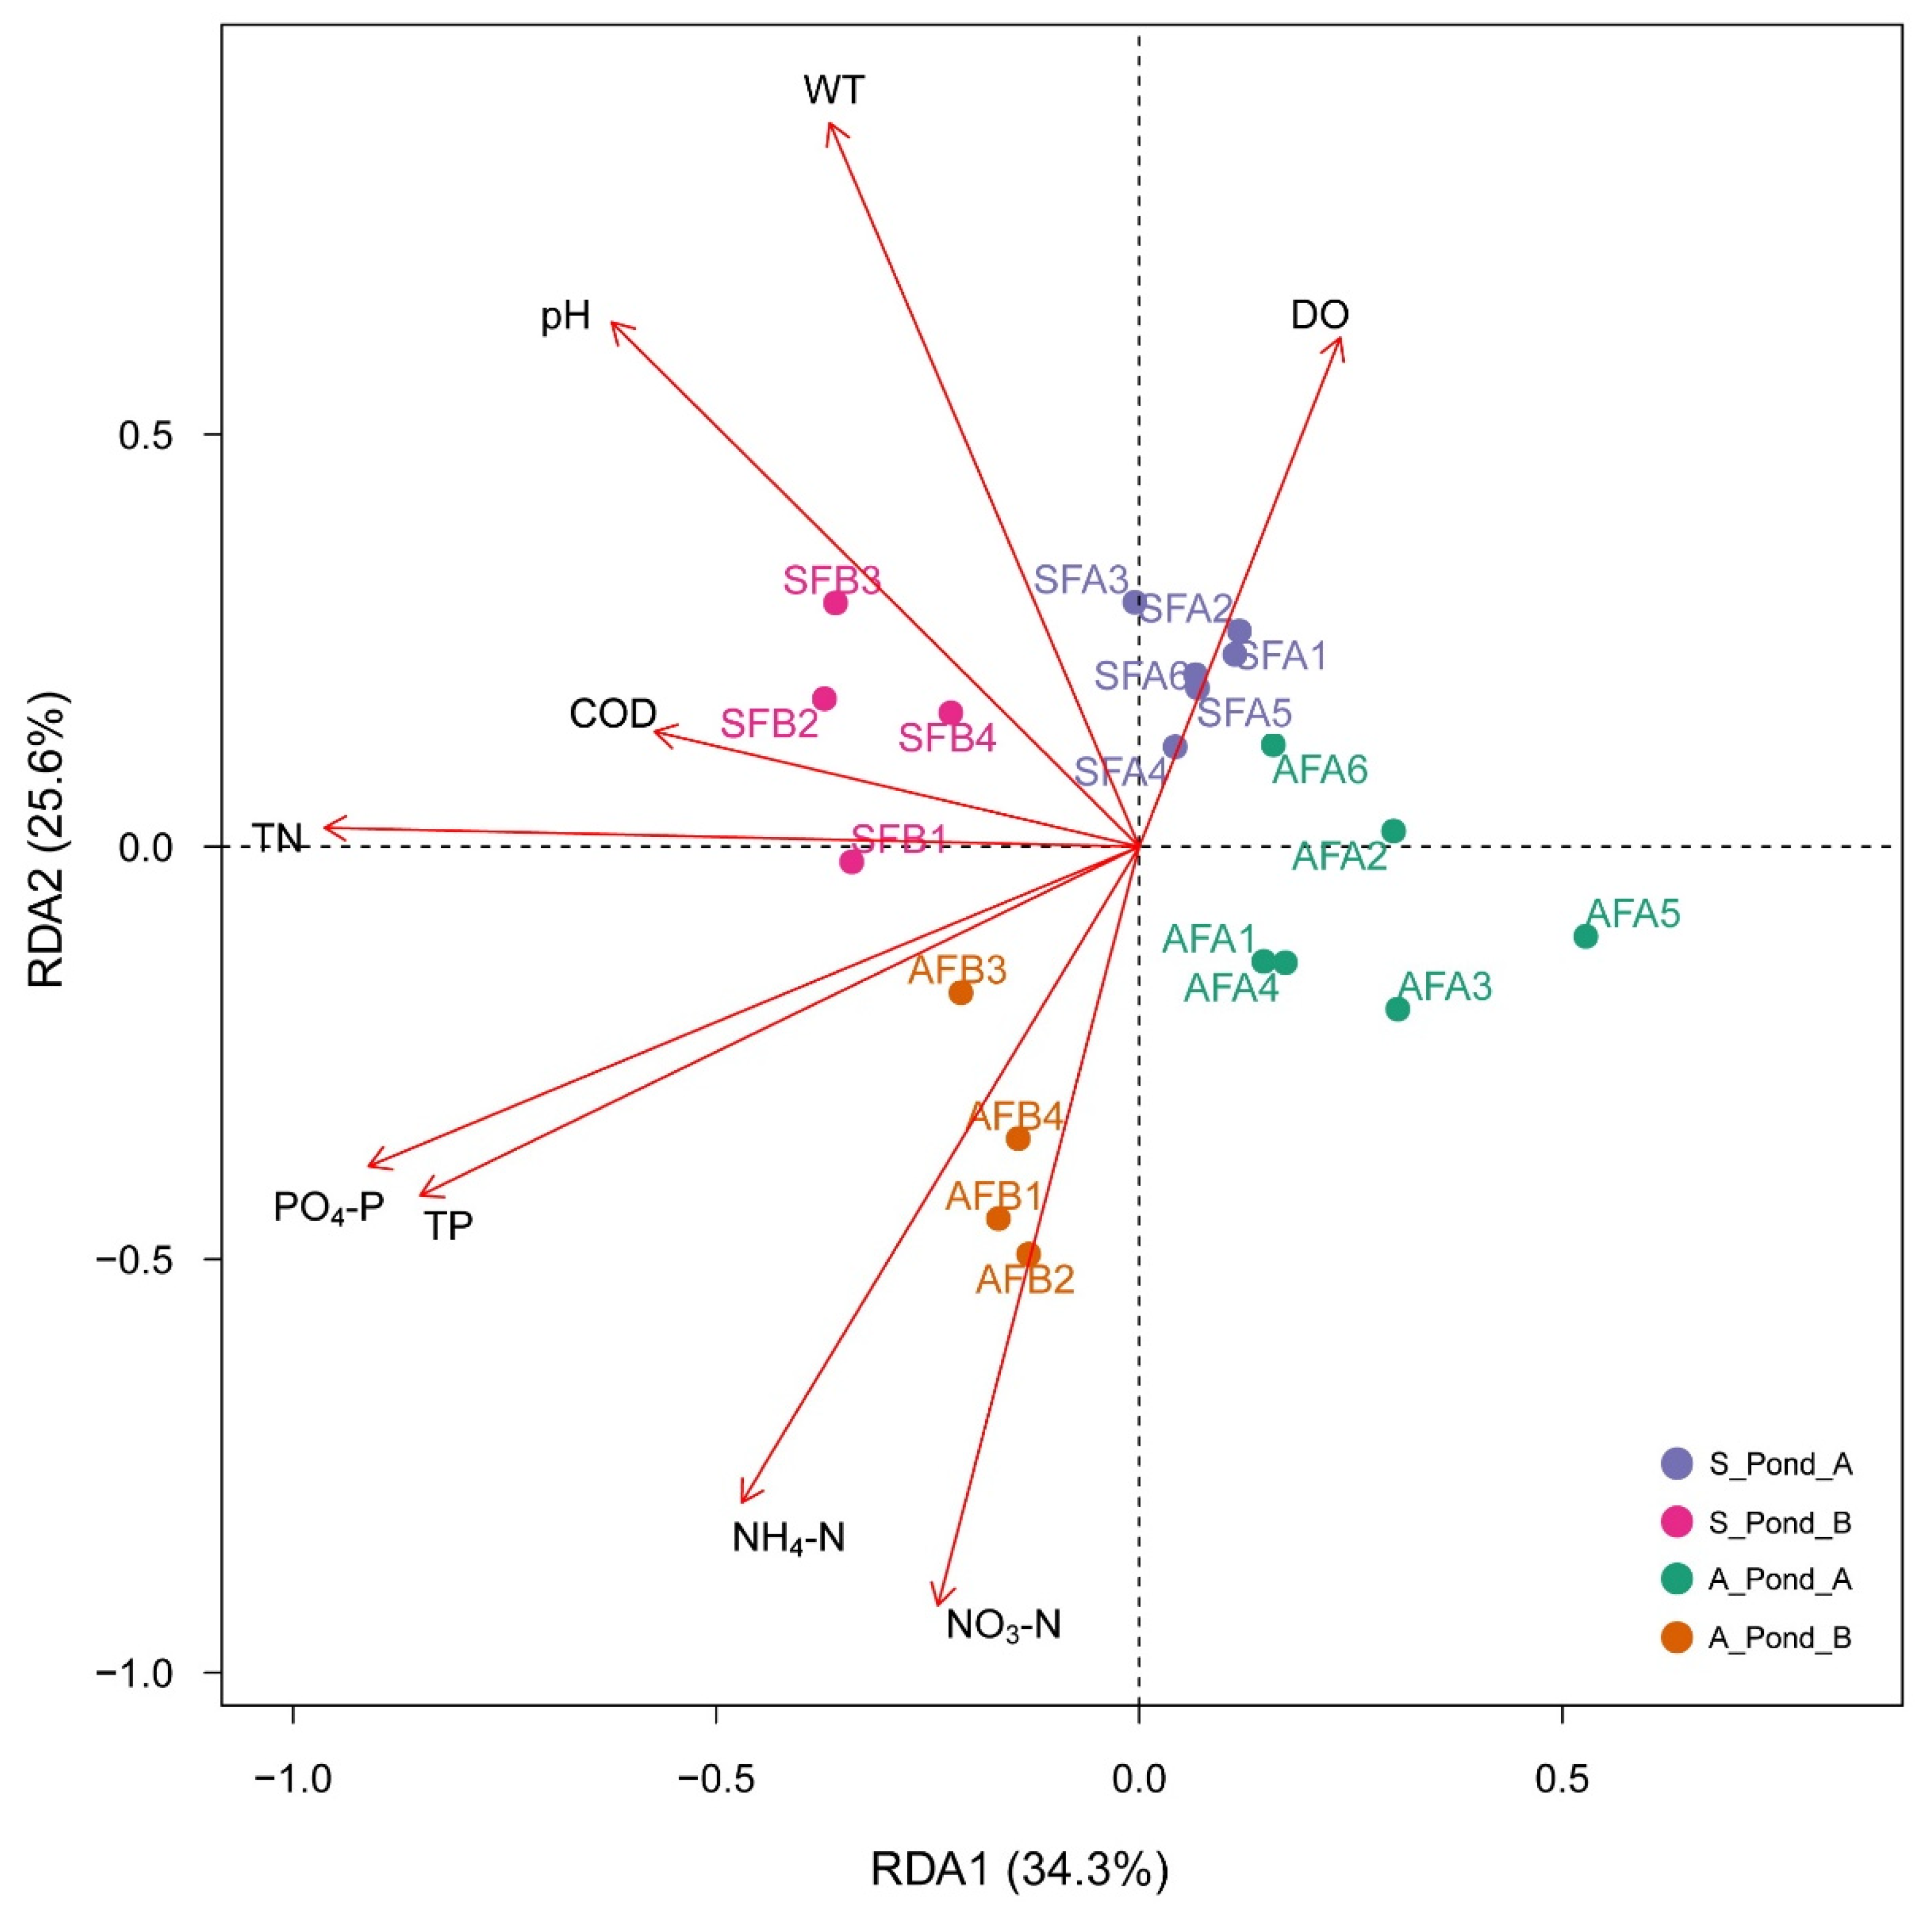
3.3. Correlations between Environmental Factors and Fish eDNA Distributions

WT, pH, and TN had significant effects on the fish eDNA distributions of spatial and temporal differences (Table 3; p < 0.01). The RDA plot of fish assemblages based on read abundances illustrated that the four group samples were dispersed (Figure 4). On the first axis, the fish assemblages of Pond A and Pond B demonstrated a strong relationship with TN, while the differences in pond fish assemblages between July and November were best explained by WT and pH (Figure 4).

4. Discussion

This study demonstrated the effectiveness and sensitivity of eDNA for fish detection in two ponds. The MiFish-U primer for the metabarcoding analysis identified 14 fish taxa in ponds, although three taxa were unable to be assigned at the species level. Moreover, we used metabarcoding to explore spatio-temporal changes in the distribution of fish eDNA in ponds, which is essential for understanding eDNA dynamics (e.g., eDNA transport) in lentic ecosystems [17,18]. Fish eDNA revealed significant differences in fish assemblages between ponds and sampling replicates. Additionally, the RDA indicated that WT, pH, and TN were the main environmental factors impacting the spatial and temporal fish community structures.

4.1. Potential of eDNA Metabarcoding and Limitations of the Primers

Traditional survey results and historical records indicate that a total of nine species were present in each pond and which were also detected via eDNA ( Table S3). R. ocellatus was only present in Pond B and R. cliffordpopei was only present in Pond A, which was consistent with eDNA detection results. Oreochromis and Cobitidae species were not found in either of the two ponds by traditional surveys but were detected with eDNA. M. albus and M. piceus were not found in Pond A by traditional surveys but were detected with eDNA. Therefore, eDNA metabarcoding detected all species reported from conventional surveys and historical records and four additional non-recorded species, including M. albus, M. piceus, Oreochromis, and Cobitidae species. M. albus was detected only once at a unique location with a rare sequence abundance (119 reads in the SFA1 site of Pond A). This may be linked to false positive detection of non-local fish DNA transported from bird feces, thus this species was not involved in subsequent discussions. M. piceus, Oreochromis, and Cobitidae species were not found via visual observation and fish traps in May 2019 but were detected with eDNA in July and/or November 2019, which indicated that eDNA detection is more sensitive to rare species at low abundances than traditional methods [4,5,29,30]. Moreover, the non-invasive sampling of eDNA approaches minimizes the destruction of fish and their habitats, making it appropriate for use in surveys of endangered or threatened species [31,32,33]. In this case, the differences of species detected between eDNA and conventional surveys may also be caused by the different time periods of the two sampling methods. Thus, future studies should maintain a consistency of sampling time between the two methods.
Many studies have used eDNA metabarcoding to assess species richness, relative abundances, and spatio-temporal distributions of fish communities in aquatic ecosystems in a cost-efficient manner [8,34,35]. The use of sequence read counts detected by eDNA metabarcoding for fish abundance estimation has remained controversial, as they are influenced by biotic, abiotic, and technical factors [35]. However, a growing body of studies has demonstrated that sequence read abundance consistently correlates with rank abundance estimates from conventional surveys, which indicates that eDNA metabarcoding can be of great potential to estimate fish relative abundance in nature [19]. However, a problem with eDNA metabarcoding is that universal primers generally amplify relatively short genetic markers that lack the resolution to identify certain taxa at the species level [15,36,37,38]. Using the MiFish-U primer for metabarcoding analysis, this study was unable to distinguish C. auratus and C. gibelio of Carassius, O. aureus and O. niloticus of Oreochromis, and Misgurnus anguillicaudatus and Paramisgurnus dabryanus of the family Cobitidae. Yamamoto et al. (2017) [38] found that the MiFish-U primer could not assign the OTUs of the genera Sebastes and Takifugu to the species level. Zhang et al. (2019) [15] utilized the Tele02 primer to detect 49 fish taxa, but 12 fish taxa were not identified at the species level. To increase the taxonomic resolution of eDNA metabarcoding, utilizing multiple genetic markers is a common solution [22], such as using both the 12S and 16S markers [30,39]. Considering the uncertainty of eDNA detection, we highlight that conventional monitoring cannot be replaced by eDNA techniques, which is still necessary as a confirmation tool.

4.2. eDNA Spatio-Temporal Dynamics in Lentic Ecosystems

Pond A and Pond B were connected via a pipe with an interception net that only allowed water transfer instead of fish. The community variations between the two ponds detected with eDNA were consistent with those surveyed using fish traps, in which R. cliffordpopei was only found in Pond A, while R. ocellatus was only found in Pond B. This reflected the low level of horizontal transport of eDNA in still water in that the fish DNA in Pond A was difficult to transport to Pond B. This finding further corroborates several studies which demonstrate that eDNA is horizontally transported less than approximately 100 m from target fishes in lentic ecosystems, but more than a few meters to kilometers from target fishes in lotic ecosystems [18,40,41,42]. Thus, lentic systems generally lack downstream transport, which makes false positive downstream detections of eDNA unlikely. Additionally, Turner et al. (2015) [43] found that carp eDNA demonstrated higher concentrations and longer persistence in sediment than in the surface water of ponds, which implies that eDNA in lentic systems prefers to settle rather than diffuse away from where the DNA release took place.
In this study, not all surface water samples within the same pond found the same species. A total of 8 of the 13 species detected from Pond A and 6 of the 11 species detected from Pond B, with a higher relative sequence abundance, were found at nearly all sampling sites during July and November. Several fishes with a lower read abundance within one pond, including the cobitid fish, C. idella, C. carpio, M. piceus, Oreochromis, and R. giurinus, were only detected at one location or several sites in one sampling replicate/two sampling replicates and are potentially rare species in a pond. Lentic ecosystems usually present a relatively closed environment without complex hydrology, especially in ponds and reservoirs [18,44]. For the two ponds, the pond managers usually release the fry in the spring and catch the adults in the early winter. Theoretically, no temporal changes of actual fish diversity were present in Pond A and Pond B, excluding the influences of anthropogenic factors and fish disease mortality. Here, temporal changes in fish communities detected via eDNA potentially implied the randomness of detection within any one sample for rare species; thus, increasing the number of sampling periods is recommended to improve the detection probabilities of rare species at each sampling site. Moreover, collecting only surface water samples at a fine-scale is unable to reveal the entire fish diversity in lentic systems, because of the heterogeneity in fish habitat use within ponds. Handley et al. (2019) [17] found that spatial heterogeneity of lake fish communities resulted in deep-dwelling fish being only detected in bottom water samples. In the present study, the cobitid fish, C. carpio and M. piceus, are all benthic fishes, and surface samples were unable to detect all of them in random sites and periods.

4.3. Effects of Water Temperature, pH, and Total Nitrogen on Fish eDNA Dynamics

RDA results indicated that water temperature and pH are two key factors affecting temporal fish assemblages detected with eDNA in a pond. This reflects that the results of eDNA detections in the field environment can be affected by environmental factors. Higher water temperature (30.20–31.10 °C) in July can promote metabolism and activity levels of fish to increase the DNA release [45], resulting in the positive detection of rare species (such as M. piceus within Pond A). Conversely, a higher pH (7.56–7.86) in July can increase eDNA decay rates [46], potentially resulting in the false negative detection of rare species (such as Cobitidae species and C. carpio within Pond B). Furthermore, RDA results revealed that total nitrogen is a critical factor causing spatial differences in fish assemblages between Pond A and Pond B. Previous studies [10,47] have indicated that nutritive salts have an important role in the distribution and abundance of ichthyoplankton in aquatic environments, which affect primary productivity and related food chains, thereby indirectly affecting fish community structures.

5. Conclusions

This study demonstrated that eDNA metabarcoding is a promising tool for fish diversity monitoring in lentic systems. In a case study of two ponds, the metabarcoding analysis indicated that fish eDNA demonstrates a poor downstream transport between the two ponds and a poor eDNA mixing within ponds for rare species and benthic species. Therefore, a mixed collection of diverse water layers for each sample point, including at least upper and bottom water, is recommended to reduce sampling bias for complete fish diversity detection in lentic systems. Additionally, for rare species detection, increasing the number of sampling periods is needed to improve their detection probabilities. This study is a preliminary exploration of using eDNA to reveal the spatial and temporal distribution changes of fish in lentic ecosystems. Further investigations of fine-scale environmental heterogeneity of fish eDNA in lentic ecosystems will promote accurate fish diversity assessment using eDNA technology.

Supplementary Materials

The following supporting information can be downloaded at: https://www.mdpi.com/article/10.3390/fishes7050257/s1, Table S1: The average values of environmental parameters at each sampling site of Pond A and Pond B during July and November 2019; Table S2: The average number of standardized reads for each species detected from the three replicate water samples per site in two sampling replicates; Table S3: Fish species observed and trapped at Pond A and Pond B in May 2019 and previously recorded by pond mangers; Table S4: The test statistics between samples for MANOVA analysis.

Author Contributions

Conceptualization, Z.P.; validation, S.C. and L.S.; formal analysis, S.C. and L.S.; investigation, S.C. and P.L.; data curation, S.C.; writing—original draft preparation, L.S. and S.C.; writing—review and editing, Z.P. and P.L.; visualization, S.C. and L.S.; supervision, Z.P.; project administration, Z.P.; funding acquisition, Z.P. All authors have read and agreed to the published version of the manuscript.

Funding

This work was supported by the grant from the National Key Research and Development Program of China (No. 2018YFD0900805) and the Chongqing Graduate Student Research and Innovation Project (CYB20093).

Institutional Review Board Statement

Not applicable.

Data Availability Statement

The raw sequence data are available on the NCBI Sequence Read Archive (SRA) database (Accession Number: SRR13576090-SRR13576149).

Acknowledgments

We thank Jiayan Lin and Yuan Xu for their help with field sampling and laboratory work.

Conflicts of Interest

The authors declare no conflict of interest.

References

  1. Coble, A.A.; Flinders, C.A.; Homyack, J.A.; Penaluna, B.E.; Cronn, R.; Weitemier, K. eDNA as a tool for identifying freshwater species in sustainable forestry: A critical review and potential future applications. Sci. Total Environ. 2018, 649, 1157–1170. [Google Scholar] [CrossRef] [PubMed]
  2. Tsuji, S.; Takahara, T.; Doi, H.; Shibata, N.; Yamanaka, H. The detection of aquatic macroorganisms using environmental DNA analysis—A review of methods for collection, extraction, and detection. Environ. DNA 2019, 1, 99–108. [Google Scholar] [CrossRef]
  3. Taberlet, P.; Coissac, E.; Hajibabaei, M.; Rieseberg, L.H. Environmental DNA. Mol. Ecol. 2012, 21, 1789–1793. [Google Scholar] [CrossRef] [PubMed]
  4. Evans, N.T.; Shirey, P.D.; Wieringa, J.G.; Mahon, A.R.; Lamberti, G.A. Comparative Cost and Effort of Fish Distribution Detection via Environmental DNA Analysis and Electrofishing. Fisheries 2017, 42, 90–99. [Google Scholar] [CrossRef]
  5. McDevitt, A.D.; Sales, N.G.; Browett, S.S.; Sparnenn, A.O.; Mariani, S.; Wangensteen, O.S.; Coscia, I.; Benvenuto, C. Environmental DNA metabarcoding as an effective and rapid tool for fish monitoring in canals. J. Fish Biol. 2019, 95, 679–682. [Google Scholar] [CrossRef]
  6. Ruppert, K.M.; Kline, R.J.; Rahman, S. Past, present, and future perspectives of environmental DNA (eDNA) metabarcoding: A systematic review in methods, monitoring, and applications of global eDNA. Glob. Ecol. Conserv. 2019, 17, e00547. [Google Scholar] [CrossRef]
  7. Sigsgaard, E.E.; Nielsen, I.B.; Carl, H.; Krag, M.A.; Knudsen, S.W.; Xing, Y.; Holm-Hansen, T.H.; Møller, P.R.; Thomsen, P.F. Seawater environmental DNA reflects seasonality of a coastal fish community. Mar. Biol. 2017, 164, 128. [Google Scholar] [CrossRef]
  8. Stoeckle, M.Y.; Soboleva, L.; Charlop-Powers, Z. Aquatic environmental DNA detects seasonal fish abundance and habitat preference in an urban estuary. PLoS ONE 2017, 12, e0175186. [Google Scholar] [CrossRef]
  9. Milhau, T.; Valentini, A.; Poulet, N.; Roset, N.; Jean, P.; Gaboriaud, C.; Dejean, T. Seasonal dynamics of riverine fish communities using eDNA. J. Fish Biol. 2019, 98, 387–398. [Google Scholar] [CrossRef]
  10. Zhang, H.; Yoshizawa, S.; Iwasaki, W.; Xian, W. Seasonal Fish Assemblage Structure Using Environmental DNA in the Yangtze Estuary and Its Adjacent Waters. Front. Mar. Sci. 2019, 6, 515. [Google Scholar] [CrossRef]
  11. Deiner, K.; Altermatt, F. Transport Distance of Invertebrate Environmental DNA in a Natural River. PLoS ONE 2014, 9, e88786. [Google Scholar] [CrossRef] [PubMed]
  12. Antognazza, C.M.; Britton, J.R.; Potter, C.; Franklin, E.; Hardouin, E.A.; Roberts, C.G.; Aprahamian, M.; Andreou, D. Environmental DNA as a non-invasive sampling tool to detect the spawning distribution of European anadromous shads (Alosa spp.). Aquat. Conserv. Mar. Freshw. Ecosyst. 2018, 29, 148–152. [Google Scholar] [CrossRef]
  13. Bracken, F.S.A.; Rooney, S.M.; Kelly-Quinn, M.; King, J.J.; Carlsson, J. Identifying spawning sites and other critical habitat in lotic systems using eDNA “snapshots”: A case study using the sea lamprey Petromyzon marinus L. Ecol. Evol. 2018, 9, 553–567. [Google Scholar] [CrossRef] [PubMed]
  14. Valdez-Moreno, M.; Ivanova, N.V.; Elías-Gutiérrez, M.; Pedersen, S.L.; Bessonov, K.; Hebert, P.D.N. Using eDNA to biomonitor the fish community in a tropical oligotrophic lake. PLoS ONE 2019, 14, e0215505. [Google Scholar] [CrossRef] [PubMed]
  15. Zhang, S.; Lu, Q.; Wang, Y.; Wang, X.; Zhao, J.; Yao, M. Assessment of fish communities using environmental DNA: Effect of spatial sampling design in lentic systems of different sizes. Mol. Ecol. Resour. 2019, 20, 242–255. [Google Scholar] [CrossRef] [PubMed]
  16. Brys, R.; Haegeman, A.; Halfmaerten, D.; Neyrinck, S.; Staelens, A.; Auwerx, J.; Ruttink, T. Monitoring of spatiotemporal occupancy patterns of fish and amphibian species in a lentic aquatic system using environmental DNA. Mol. Ecol. 2021, 30, 3097–3110. [Google Scholar] [CrossRef] [PubMed]
  17. Handley, L.L.; Read, D.S.; Winfield, I.J.; Kimbell, H.; Johnson, H.; Li, J.; Hahn, C.; Blackman, R.; Wilcox, R.; Donnelly, R.; et al. Temporal and spatial variation in distribution of fish environmental DNA in England’s largest lake. Environ. DNA 2019, 1, 26–39. [Google Scholar] [CrossRef]
  18. Li, J.; Handley, L.J.L.; Harper, L.R.; Brys, R.; Watson, H.V.; Di Muri, C.; Zhang, X.; Hänfling, B. Limited dispersion and quick degradation of environmental DNA in fish ponds inferred by metabarcoding. Environ. DNA 2019, 1, 238–250. [Google Scholar] [CrossRef]
  19. Berger, C.S.; Hernandez, C.; Laporte, M.; Côté, G.; Paradis, Y.; Kameni, T.D.W.; Normandeau, E.; Bernatchez, L. Fine-Scale environmental heterogeneity shapes fluvial fish communities as revealed by eDNA metabarcoding. Environ. DNA 2020, 2, 647–666. [Google Scholar] [CrossRef]
  20. West, K.M.; Stat, M.; Harvey, E.S.; Skepper, C.L.; DiBattista, J.D.; Richards, Z.T.; Travers, M.J.; Newman, S.J.; Bunce, M. eDNA metabarcoding survey reveals fine-scale coral reef community variation across a remote, tropical island ecosystem. Mol. Ecol. 2020, 29, 1069–1086. [Google Scholar] [CrossRef]
  21. Miya, M.; Sato, Y.; Fukunaga, T.; Sado, T.; Poulsen, J.Y.; Sato, K.; Minamoto, T.; Yamamoto, S.; Yamanaka, H.; Araki, H.; et al. MiFish, a set of universal PCR primers for metabarcoding environmental DNA from fishes: Detection of more than 230 subtropical marine species. R. Soc. Open Sci. 2015, 2, 150088. [Google Scholar] [CrossRef] [PubMed]
  22. Shu, L.; Ludwig, A.; Peng, Z. Standards for Methods Utilizing Environmental DNA for Detection of Fish Species. Genes 2020, 11, 296. [Google Scholar] [CrossRef] [PubMed]
  23. Babraham Bioinformatics-FastQC a Quality Control Tool for High throughput Sequence Data. Available online: https://www.bioinformatics.babraham.ac.uk/projects/fastqc/ (accessed on 20 January 2020).
  24. Magoč, T.; Salzberg, S.L. FLASH: Fast length adjustment of short reads to improve genome assemblies. Bioinformatics 2011, 27, 2957–2963. [Google Scholar] [CrossRef]
  25. Edgar, R.C.; Haas, B.J.; Clemente, J.C.; Quince, C.; Knight, R. UCHIME improves sensitivity and speed of chimera detection. Bioinformatics 2011, 27, 2194–2200. [Google Scholar] [CrossRef] [PubMed]
  26. Camacho, C.; Coulouris, G.; Avagyan, V.; Ma, N.; Papadopoulos, J.; Bealer, K.; Madden, T.L. BLAST+: Architecture and applications. BMC Bioinform. 2009, 10, 421. [Google Scholar] [CrossRef] [PubMed]
  27. Li, J.; Hatton-Ellis, T.W.; Handley, L.J.L.; Kimbell, H.S.; Benucci, M.; Peirson, G.; Hänfling, B. Development of an environmental DNA method for monitoring fish communities: Ground truthing in diverse lakes with characterised fish faunas. bioRxiv 2018. bioRxiv: 394718. [Google Scholar]
  28. Team R, C. R: A Language and Environment for Statistical Computing; R Foundation for Statistical Computing: Vienna, Austria, 2019. [Google Scholar]
  29. Thomsen, P.F.; Kielgast, J.; Iversen, L.L.; Møller, P.R.; Rasmussen, M.; Willerslev, E. Detection of a Diverse Marine Fish Fauna Using Environmental DNA from Seawater Samples. PLoS ONE 2012, 7, e41732. [Google Scholar] [CrossRef]
  30. Olds, B.P.; Jerde, C.L.; Renshaw, M.A.; Li, Y.; Evans, N.T.; Turner, C.R.; Deiner, K.; Deiner, A.R.; Brueseke, M.A.; Shirey, P.D.; et al. Estimating species richness using environmental DNA. Ecol. Evol. 2016, 6, 4214–4226. [Google Scholar] [CrossRef]
  31. Maruyama, A.; Sugatani, K.; Watanabe, K.; Yamanaka, H.; Imamura, A. Environmental DNA analysis as a non-invasive quantitative tool for reproductive migration of a threatened endemic fish in rivers. Ecol. Evol. 2018, 8, 11964–11974. [Google Scholar] [CrossRef]
  32. Harper, L.R.; Griffiths, N.P.; Handley, L.L.; Sayer, C.D.; Read, D.S.; Harper, K.J.; Blackman, R.C.; Li, J.; Hänfling, B. Development and application of environmental DNA surveillance for the threatened crucian carp (Carassius carassius). Freshw. Biol. 2018, 64, 93–107. [Google Scholar] [CrossRef]
  33. Akamatsu, Y.; Kume, G.; Gotou, M.; Kono, T.; Fujii, T.; Inui, R.; Kurita, Y. Using environmental DNA analyses to assess the occurrence and abundance of the endangered amphidromous fish Plecoglossus altivelis ryukyuensis. Biodivers. Data J. 2020, 8, e39679. [Google Scholar] [CrossRef] [PubMed] [Green Version]
  34. Valentini, A.; Taberlet, P.; Miaud, C.; Civade, R.; Herder, J.; Thomsen, P.F.; Bellemain, E.; Besnard, A.; Coissac, E.; Boyer, F.; et al. Next-generation monitoring of aquatic biodiversity using environmental DNA metabarcoding. Mol. Ecol. 2016, 25, 929–942. [Google Scholar] [CrossRef] [PubMed]
  35. Ushio, M.; Murakami, H.; Masuda, R.; Sado, T.; Miya, M.; Sakurai, S.; Yamanaka, H.; Minamoto, T.; Kondoh, M. Quantitative monitoring of multispecies fish environmental DNA using high-throughput sequencing. bioRxiv 2017. bioRxiv: 113472. [Google Scholar] [CrossRef]
  36. Kelly, R.P.; Port, J.A.; Yamahara, K.M.; Crowder, L.B. Using Environmental DNA to Census Marine Fishes in a Large Mesocosm. PLoS ONE 2014, 9, e86175. [Google Scholar] [CrossRef] [PubMed]
  37. Thomsen, P.F.; Møller, P.R.; Sigsgaard, E.E.; Knudsen, S.; Jorgensen, O.A.; Willerslev, E. Environmental DNA from Seawater Samples Correlate with Trawl Catches of Subarctic, Deepwater Fishes. PLoS ONE 2016, 11, e0165252. [Google Scholar] [CrossRef]
  38. Yamamoto, S.; Masuda, R.; Sato, Y.; Sado, T.; Araki, H.; Kondoh, M.; Minamoto, T.; Miya, M. Environmental DNA metabarcoding reveals local fish communities in a species-rich coastal sea. Sci. Rep. 2017, 7, 40368. [Google Scholar] [CrossRef] [PubMed]
  39. Shaw, J.L.; Clarke, L.J.; Wedderburn, S.D.; Barnes, T.C.; Weyrich, L.S.; Cooper, A. Comparison of environmental DNA metabarcoding and conventional fish survey methods in a river system. Biol. Conserv. 2016, 197, 131–138. [Google Scholar] [CrossRef]
  40. Eichmiller, J.J.; Bajer, P.G.; Sorensen, P.W. The Relationship between the Distribution of Common Carp and Their Environmental DNA in a Small Lake. PLoS ONE 2014, 9, e112611. [Google Scholar] [CrossRef]
  41. Jane, S.F.; Wilcox, T.M.; McKelvey, K.S.; Young, M.K.; Schwartz, M.K.; Lowe, W.H.; Letcher, B.H.; Whiteley, A.R. Distance, flow and PCR inhibition: eDNA dynamics in two headwater streams. Mol. Ecol. Resour. 2015, 15, 216–227. [Google Scholar] [CrossRef]
  42. Murakami, H.; Yoon, S.; Kasai, A.; Minamoto, T.; Yamamoto, S.; Sakata, M.K.; Horiuchi, T.; Sawada, H.; Kondoh, M.; Yamashita, Y.; et al. Dispersion and degradation of environmental DNA from caged fish in a marine environment. Fish. Sci. 2019, 85, 327–337. [Google Scholar] [CrossRef]
  43. Turner, C.R.; Uy, K.L.; Everhart, R.C. Fish environmental DNA is more concentrated in aquatic sediments than surface water. Biol. Conserv. 2015, 183, 93–102. [Google Scholar] [CrossRef] [Green Version]
  44. Evans, N.T.; Li, Y.; Renshaw, M.A.; Olds, B.P.; Deiner, K.; Turner, C.R.; Jerde, C.L.; Lodge, D.M.; Lamberti, G.A.; Pfrender, M.E. Fish community assessment with eDNA metabarcoding: Effects of sampling design and bioinformatic filtering. Can. J. Fish. Aquat. Sci. 2017, 74, 1362–1374. [Google Scholar] [CrossRef]
  45. Jo, T.; Murakami, H.; Yamamoto, S.; Masuda, R.; Minamoto, T. Effect of water temperature and fish biomass on environmental DNA shedding, degradation, and size distribution. Ecol. Evol. 2018, 9, 1135–1146. [Google Scholar] [CrossRef]
  46. Lance, R.; Klymus, K.; Richter, C.; Guan, X.; Farrington, H.; Carr, M.; Thompson, N.; Chapman, D.; Baerwaldt, K. Experimental observations on the decay of environmental DNA from bighead and silver carps. Manag. Biol. Invasions 2017, 8, 343–359. [Google Scholar] [CrossRef]
  47. Bagley, M.; Pilgrim, E.; Knapp, M.; Yoder, C.; Domingo, J.S.; Banerji, A. High-Throughput environmental DNA analysis informs a biological assessment of an urban stream. Ecol. Indic. 2019, 104, 378–389. [Google Scholar] [CrossRef]
Figure 1. Maps of two ponds sampled in Southwest University of Beibei, Chongqing, China. Red circles indicate shoreline sites of water collection for eDNA metabarcoding. There are six sampling sites for Pond A and four sampling sites for Pond B, separately.
Fishes 07 00257 g001
Figure 3. Nonmetric multidimensional scaling (NMDS) ordination of spatial and temporal samples. NMDS analysis using Bray–Curtis matrix based on species read counts for individual sampling sites of two ponds during two sampling periods. Red spots indicate sample collected from Pond A in July 2019 (S_Pond_A), green spots indicate samples collected from Pond B in July 2019 (S_Pond_B), blue spots indicate samples collected from Pond A in November 2019 (A_Pond_A), and purple spots indicate samples collected from Pond B in November 2019 (A_Pond_B). The ellipses indicate a 95% similarity level within each community type in ordinations. NMDS analysis demonstrates a high credibility of ordination results (Stress = 0.08) and significant differences among samples (R2 = 0.70, p = 0.001).
Fishes 07 00257 g003
Figure 4. Plot of redundancy analysis (RDA) illustrating relationships among water temperature (WT), pH, dissolved oxygen (DO), total nitrogen (TN), nitrate (NO3N), total phosphorus (TP), ammonium (NH4N), chemical oxygen demand (COD), and phosphate (PO4P) and fish communities. Different colors represent sample sites with different spatial and temporal characteristics: purple spots indicate samples collected from Pond A in July 2019 (S_Pond_A), red spots indicate samples collected from Pond B in July 2019 (S_Pond_B), green spots indicate samples collected from Pond A in November 2019 (A_Pond_A) and orange spots indicate samples collected from Pond B in November 2019 (A_Pond_B).
Fishes 07 00257 g004
Table 1. Taxonomic classification of fish detected in two ponds for two sampling replicates via eDNA metabarcoding.
OrderFamilyGenusSpeciesJuly 2019November 2019
CypriniformesCobitidae +
CyprinidaeCarassius ++
CtenopharyngodonC. idella++
CyprinusC. carpio +
HypophthalmichthysH. molitrix++
H. nobilis++
MylopharyngodonM. piceus+
PseudorasboraP. parva++
RhodeusR. ocellatus++
CyprinodontiformesPoeciliidaeGambusiaG. affinis++
PerciformesCichlidaeOreochromis ++
GobiidaeRhinogobiusR. cliffordpopei++
R. giurinus++
SynbranchiformesSynbranchidaeMonopterusM. albus+
Total a1212
Note: The blank of Genus and Species means the highest resolution not reached in this taxon level; “+” represents the fish taxon detected at the sampling replicates; a the number of detected species at each sampling replicate in two ponds.
Table 2. Fish taxon detected at each site of Pond A and Pond B during July and November 2019 via eDNA metabarcoding.
FishJuly 2019November 2019
Pond APond BPond APond B
SFA 1SFA 2SFA 3SFA 4SFA 5SFA 6SFB 1SFB2SFB3SFB4AFA1AFA2AFA3AFA4AFA5AFA6AFB1AFB2AFB3AFB4
Carassius+++++++ +++++++++++
Cobitidae ++++ ++++
Ctenopharyngodon idella+ ++ + ++
Cyprinus carpio + +++++
Gambusia affinis++++++++++++++++++++
Hypophthalmichthys molitrix++++++++++++++++++++
Hypophthalmichthys nobilis++++++++++++++++++++
Monopterus albus+
Mylopharyngodon piceus+ ++
Oreochromis++++++ ++++++ + +
Pseudorasbora parva++++++++++++++++++++
Rhinogobius cliffordpopei+ ++++ ++++++
Rhinogobius giurinus++++++ ++++++++++
Rhodeus ocellatus +++ ++++
Note: “+” represents the fish taxon detected at this site. The abbreviations refer to samples collected per site in Pond A in July (SFA1-SFA6) and November (AFA1-AFA6); samples collected per site in Pond B in July (SFB1-SFB4) and November (AFB1-AFB4).
Table 3. Conditional effects and correlations of environmental factors by RDA.
FactorRDA1RDA2R2p
WT−0.36570.87770.20250.001
pH−0.62340.63590.19970.001
DO0.23750.61720.09590.018
TN−0.96260.02300.28500.001
NO3N−0.2380−0.91850.19670.546
TP−0.8497−0.42260.25480.784
NH4N−0.4696−0.79370.20220.496
COD−0.57280.13970.07920.764
PO4P−0.9107−0.38720.28600.644
Publisher’s Note: MDPI stays neutral with regard to jurisdictional claims in published maps and institutional affiliations.

