Abstract
Despite the global contribution of aquaculture as an important pillar for food and nutritional security, its rapid growth has been hampered by inadequate and poor-quality seed due to inbreeding, hybridization of related stocks, and poor-quality broodstock. Phenotypic and genotypic characterization of Nile tilapia in natural water bodies of Uganda has been studied but research gaps remain on the morphometric characterization of farmed O. niloticus in Uganda, which hinders selective breeding initiatives. This study characterized O. niloticus from various farmers in Uganda’s Southwestern Highland Agro-Ecological Zone using their morphometric traits. In this study, 8 morphometric traits were taken on each of the 258 fish samples collected with at least 30 samples sampled from each pond system in the zone. The morphometric data generated were analyzed using multivariate analysis. In order to delineate the populations from the different ponds, Discriminant Function analysis (DFA) was performed on the dataset and distribution plots generated to test on the purity of the strains. There were significant differences in the morphometric traits among the populations with the Victoria fish population having the highest standard length while the Kyoga population had the highest weight. Morphometric characterization grouped the fish into three clusters, indicative that fish farms in the zone possibly had different sources of fish seed. The condition factor, which is a measure of wellbeing of the fish, showed that all the populations displayed an isometric growth which is indicative of the fish growing in length as it is in weight. The results of this study provide evidence that local O. niloticus from different farms display differences in body shape as a result of using fish seed from different sources. This aspect can be applied in selective breeding programs after establishing the genetic structure of the farmed Nile tilapia stock.
Key Contribution:
The manuscript contributes morphometric baseline information required for Nile tilapia selective breeding program. Furthermore, the knowledge generated is key while designing conservation measures of the Nile tilapia in aquatic ecosystems.
1. Introduction
Aquaculture is the world’s fastest growing agricultural and food processing sector, and serves a critical role in developing economies through its value chain linkages in promoting food and nutrition security, rural development, and poverty alleviation [1]. Tilapia is the world’s second most cultured fish species, after carp [2,3], and is currently cultured in more than 140 countries [4]. China, the Philippines, Taiwan, Indonesia, Thailand, and Egypt are the leading suppliers of this agro-food product, with an estimated global production of 179 million metric tons [5].
Nile tilapia is considered as the ideal fish species for aquaculture mainly due to its rapid growth, high fecundity, ability to resist poor water quality, and good performance under sub-optimal nutritional conditions [6,7,8]. Additionally, the fish possesses adaptive life history characteristics especially fast growth, high fecundity, and large egg sizes that have few predators, as well as high dietary overlap across size class, habitat, and season [9,10]. Its omnivorous nature further prompts it to utilize the available resources, making it easy and affordable to grow even for small-scale farmers. Apart from being a model aquaculture species, the expansion of tilapia culture globally is also fueled by high genetic diversity in the available natural tilapia germplasm [6] which makes it a good candidate for genetic manipulations for product improvement and thereafter the expansion of profit margins. Besides the economic returns from aquaculture, tilapiines have also been adopted for use as control agents for aquatic vegetation and elimination of unwanted aquatic fauna such as snails and mosquitoes [8].
The Nile tilapia (Oreochromis niloticus Linnaeus, 1758) is native to African freshwater systems and the Middle East, with its natural range encompassing the Nile River Basin, from the headwaters in East Africa to the Nile Delta in Egypt and lakes and streams connected to these drainages [11]. In East Africa, O. niloticus is native to Lakes; George, Edward, Albert, Kivu, Tanganyika, Turkana, and Baringo, and to River Nile [11], and the species has been introduced to almost every tropical country in the world for aquaculture purposes [12].
The fisheries sector in Uganda is the second largest exchange earner for the country after coffee and contributes 12% to the agricultural gross domestic product (GDP) and about 3.0% to the National GDP. The investment in the sector is estimated at $200 million with employment of over 700,000 people [13]. Uganda has more than 350 fish species; Nile perch and Tilapia remain the most important, making up to 46% and 38%, respectively, of the total fisheries production [13]. Aquaculture production stands at around 111,000 tons, of which Largemouth African catfish and Nile tilapia contribute over 90% in the country [14]. The sector has experienced a significant increase in production attributed to the commercialization of the fisheries sub-sector which has witnessed an increase in the number of people venturing into fish farming [5].
Despite the aquaculture subsector being identified as an important pillar for food and nutritional security in the country, the rapid growth of the subsector is curtailed by inadequate quality seed with most hatcheries being plagued by inbreeding, hybridization of related stocks, and poor-quality broodstock [15,16]. In the context of farmed Nile tilapia, many studies on the domestication of this fish species have shown phenotypic variations in the subsequent generations with respect to the pure Tilapia strains of the brood stock [8,14,16,17]. This may be attributed to speciation due to change in the environment or formation of hybrids as a result of species interbreeding.
Consequently, there are questions on the possible deviations in the genetic and morphometric features of the organisms after several generations of recycling. Furthermore, without a clear known origin of the brood stock, the fish are most likely sourced from stocks suffering from genetic founder effects, as is common among farmed tilapia sources globally [18], a practice that is difficult to avoid under farm conditions. Consequently, the fish suffer from high levels of inbreeding, which is frequently exacerbated by hybridization because tilapias are prolific breeders in culture conditions. Inbreeding leads to loss of genetic variability [19] and inbreeding depression associated with lower growth rates, reduced fitness, low survival, and low fecundity [19].
Morphometric and meristic methods remain the simplest and most direct way of species identification and can be used as a measure of delineating fish species into strains/types [12]. Characterization of O. niloticus based on morphometric and meristic traits have also been reported in several studies [6,8,12,17,20,21]. These studies report the existence of both genetic and morphometric differences in the cultured O. niloticus fish species from similar indigenous fish species in the wild.
While the population characteristics (biology, abundance, condition factors, and the reproductive biology) of O. niloticus in the three lakes have been fairly well studied by other researchers—L. Victoria [14,22,23], L. Albert [23,24], and L. Kyoga [22,23]—research work on the morphometric characterization of farmed O. niloticus sourced from the natural water bodies in Uganda is still understudied and this hinders development of selective breeding programs. Therefore, this study focused on comparing the possible morphometric variations between O. niloticus populations from isolated pond systems with strains from three lake systems that had been isolated for two years and compared them with strains of O. niloticus cultured by farmers in the region. The study hypothesized that the morphometric traits would show no significant differences among the populations investigated. This study is significant as it will generate and contribute baseline information for strain improvement of the O. niloticus breed in East Africa. The study will further provide a broader diversity of knowledge on the phenotypic characteristics of the different O. niloticus strains in aquatic systems that could be used when designing conservation measures.
2. Materials and Methods
2.1. The Study Area
The fish samples in this study were collected from different farms located in South Western Highland Agro-Ecological Zone (SWHAEZ) in the districts of Kanungu and Kabale (Figure 1). SWHAEZ, formerly known as the Kigezi sub-region, consists of five districts; Kabale, Rubanda, Kisoro, Kanungu, Rukungiri, and Rukiga, located in southwestern Uganda. The zone lies between altitudes of 1262 and 3883 m above sea level. The zone experiences a bimodal rainfall pattern that ranges from 1000 to 1500 mm per annum. Kanungu and Rukungiri districts have analogous annual temperature in the range of 20.56 °C to 30.56 °C, while other districts in the region have an annual temperature range of 13.00 °C to 23.21 °C [25]. Therefore, these districts (Kabale and Kanungu) were selected owing to varying climatic conditions and as representation of the other districts in the zone. Both private and government fish farms were incorporated in the study. The private farms included; Butare, Rwabirundo and Nyamabare in Kabale district; Masya and Kambuga in Kanungu district (Figure 1). These farms were selected on account of their vast experience in fish farming and business for more than 10 years. Moreover, fish stocking data and farm history availed by the district fisheries officers and farmers in the respective districts indicated that stocking dates of the preferred farms were in a very close range; therefore, it was assumed that the fish sampled were in the same age bracket. At the time of sampling, all the fish in distinct localities had spent seven months under captive management.
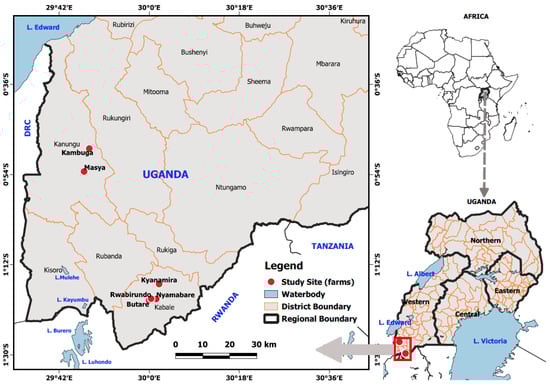
Figure 1.
Map showing the sampling fish farms.
Furthermore, Kyanamira aquaculture fish facility, located in the Kabale district, was also included in the study area. The facility is superintended by Kachwekano Zonal Agricultural Research and Development Institute of National Agricultural Research Organization. Most pertinently, the fish populations at Kyanamira facility were stocked and raised in independent pond systems with the native brood stock originating from three freshwater lakes in Uganda, namely, L. Victoria (Central Uganda), L. Kyoga (Central Uganda), and L. Kayumbu (South Western Uganda). The pond systems at the facility have a surface area of 800 m2 with a stocking rate of 4.0 fish/m−3. The water temperature in the ponds is maintained in a range of 21.13 °C to 23.03 °C while the dissolved oxygen (DO) level ranges between 4.24 and 5.76 mg/L. All the chosen fish farms were closely monitored where monthly sampling was performed to facilitate fish grading and sorting for invariable growth patterns.
2.2. Research Design
This study was conducted by taking nine different body measurements of O. niloticus fish samples collected from three ponds systems between February and April, 2022. The fish samples were obtained from Kyanamira fish facility ponds holding the fish populations of three lakes, Kyoga, L. Victoria, and L. Kayumbu. Additionally, samples were obtained from five randomly selected farmers from Kabale and Kanungu districts in the region. The selected fish were those at maturity, swollen stomachs for the females and males with tapered shapes with well-developed external reproductive organs. A total of 258 specimens were obtained and morphometric measurements were taken onsite. The fish populations were analyzed as a whole and populations were compared without discriminating the sex. Any variations that would arise from sexual dimorphism in tilapia were catered for by applying the same data collection criteria for the fish across populations from the different lakes and farms. Morphometric traits were measured using a centimeter scale to the nearest 0.1 cm except for body weight (BW) which was measured to the nearest 0.1 g using a digital balance. The morphometric traits were: Total Length (TL), Standard Length (SL), Body Width (WID), Caudal fin Length (CL), Head Length (HL), Dorsal Length (DL), Pectoral fin Length (PEC), and Pelvic fin Length (PEL) (Figure 2). Additionally, the body weight of the fish samples was also measured separately. These morphometric traits were chosen because they are easily measured longitudinal traits and normally present moderate to high heritability (10, 26). The body characters viz. TL, HL, DL, BD, CL, PEC, and PEL were expressed as percent to Standard Length of the fish to correct size dependent variation in morphometric characters [26].
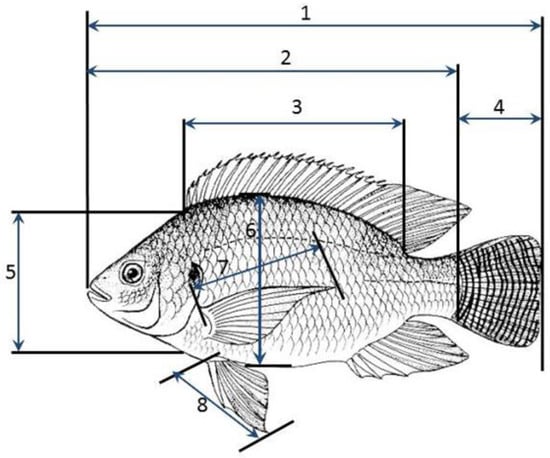
Figure 2.
Morphometric measurements of O. niloticus: 1. Total length, 2. Standard Length, 3. Dorsal fin length, 4. Caudal fin length, 5. Head length, 6. Body width, 7. Pectoral fin length, 8. Pelvic fin length (Source: Author photo).
2.3. Data Analysis
All statistical analyses were performed using IBM SPSS Statistics for Windows, Version 23.0. IBM Corp (Armonk, NY, USA) developed by IBM for data management and Microsoft Excel. One-way Analysis of Variance (ANOVA) followed by Tukey post hoc test was used to test the significance of differences in the morphometric traits between populations (p < 0.05). Prior to the analyses, normal distributions were investigated using Kolmogorov–Smirnov test and homogeneity of variances was checked with Levene’s test. Morphological trait values were taken as dependent variables and populations as explanatory variables.
Morphometric variation among the eight populations of O. niloticus was used to test for the presence of stock structuring using discriminant function analysis (DFA) [27,28]. Stepwise DFA on morphometric data was used to select all of the traits. A univariate analysis of seven measurements expressed as percentages of the standard length of fish was run to estimate the importance of the morphometric measurements for species identification.
The length–weight relationship of the fish was calculated using the equation by [29] in the form of: W = aL^b to estimate the length–weight relationship of the fish in each population. The length–weight relationship of the collected fish samples was calculated based on the logarithmic transformation of the data. When analyzing the length–weight relationships between the fish samples, the data were logarithmically transformed to stabilize the variance that could result from size-dependent weight measurements [30]. Fish body weight and standard length were used in this analysis.
W = body weight of fish in grams,
L = Standard length in centimeters,
“a” is the intercept,
“b” is the slope of the regression line,
The fish Condition Factor (K); Relative condition [30] factor which is an expression of the degree of the wellbeing of fishes in their habitat was calculated as
K = W/W’ where:
W = Actual weight of Fish
W’ = Calculated weight of the fish.
3. Results
3.1. Morphometric Traits of the O. niloticus Populations
One-way analysis of variance to test the significant differences in the morphometric traits among the O. niloticus populations revealed significant differences in all traits among the populations. The morphometric traits: Standard length, Body weight, Total length, Dorsal length, Caudal fin length, Head length, Body width, Pectoral fin length, and Pelvic fin length were significantly different among the populations (p < 0.05) (Table 1).

Table 1.
Mean ± SD for the different morphometric characters of O. niloticus population (significantly different (p < 0.05) (SL = Standard Length, BW = Body weight, TL = Total Length, DL = Dorsal fin Length, CL = Caudal fin Length, HL = Head Length, WID = Body Width, PEC = Pectoral fin Length, PEL = Pelvic fin Length).
The O. niloticus population from Victoria had the highest mean standard-length value (18.98 ± 2.161) followed by Kyoga (18.68 ± 3.19) while Rwabirundo (15.69 ± 0.76) had the least mean standard-length value. Post hoc using Tukey HSD showed that the mean values for standard length between; Kyoga and Kayumbu, Kyoga and Rwabirundo, Kayumbu and Victoria, Kayumbu and Masya, Kayumbu and Nyamabare, Kayumbu and Butare, Victoria and Kambuga, Victoria and Rwabirundo, Kambuga and Rawbirundo, Masya and Rwabirundo, Rwabirundo and Nyamabare were significantly different (p = 0.00) while other populations’ standard length were not significantly different (p = 0.05) (Table 1).
Body weight among the populations was significantly different at p < 0.05 level [df (791,365.55), f = 17.84, p = 0.00] (Table 1). The population from Kyoga had the highest mean body weight (283.19 ± 91.41) followed by Victoria (281.69 ± 89.73), while Rwabirundo (143.18 ± 21.10) had the least mean body weight value. Body weight among the populations indicated that Kyoga and Kayumbu, Kyoga and Rwabirundo, Kyoga and Kyamabare, Kyoga and Butare, Kayumbu and Victoria, Kayumbu and Kambuga, Kayumbu and Masya, Victoria and Rwabirundo, Victoria and Nyamabare, Kambuga and Rwabirundo, Kambuga and Nyamabare, Masya and Rwabirundo, and Masya and Nyamabare were significantly different (p = 0.00), while other populations did not show any significant differences (p = 0.05).
3.2. Length–Weight Relationship and Condition Factor
The O. niloticus populations from Kyoga had a higher mean standard length and body weight (18.68 ± 3.19 cm and 283.20 ± 130.41 g, respectively) followed by Victoria with 18.98 ± 2.16 cm and 281.69 ± 89.73 g, respectively, while Rwabirundo had the least mean values (15.69 ± 0.76 cm and 143.18 ± 21.10 g, respectively) (Table 2). The parameter ‘b’ of the fish samples ranged from a minimum of 1.14 to a maximum of 2.91, with a mean value of 2.24 (Table 2). Populations from Kayumbu, Kyoga, and Butare showed isometric growth with values of regression slope b; 2.91, 2.65, and 2.54, respectively, (b = 3) while other populations (Victoria, Kambuga, Masya, Rwabirundo, and Nyamabare) showed negative allometric growth pattern recording values of b < 3 (Table 2, Figure 3).
Table 2.
Length–weight relationships of the different populations.
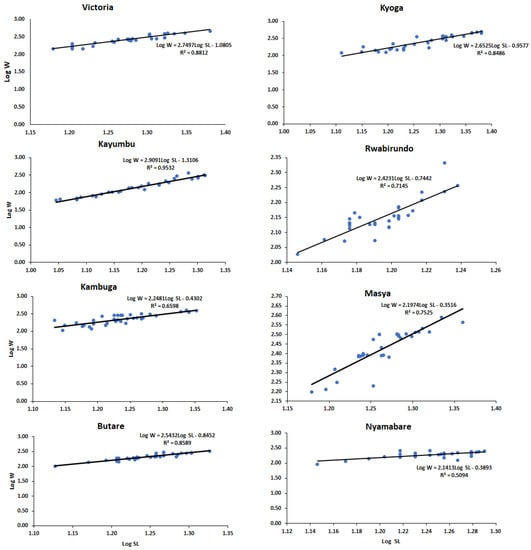
Figure 3.
Length–weight relationships of the population of O. niloticus in the sampling sites.
Relative Condition Factor (K) for the O. niloticus did not differ significantly among the populations (p > 0.05) [df (8,279), F = 0.27, p = 0.98] (Figure 4). All the populations had an average condition factor (K = 1) (Figure 4).
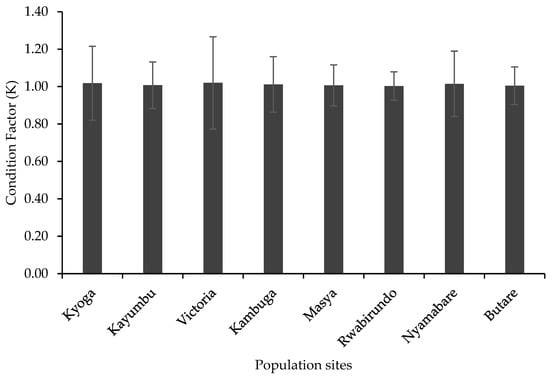
Figure 4.
Relative condition factor of the different populations.
3.3. Similitude in the Morphometric Traits among the Oreochromis niloticus Populations
3.3.1. Discriminant Function Analysis (DFA) of different Oreochromis niloticus populations
In this study, all the traits were selected by stepwise DFA on morphometric data. The analysis of the morphometric variables produced seven significant discriminants functions (Table 3). The first function accounted for 40.5% of the variance and the second function 24.2% for the traits (Table 3). According to the canonical discriminant function coefficients obtained for morphometric data, the most influential variables for function 1 were standard length, total length, caudal fin length, and head length, while body weight and pectoral fin length were influential in function 2. Total length was more influential at function 3 while pelvic fin length was more influential at function 5. The canonical discriminant function 1 and canonical discriminant function 2 were plotted to allow visual examination of the distribution of each sample in the populations. Populations of Kambuga, Masya, and Rwabirundo were very distinct and highly isolated while populations of Victoria, Nyamabare, Butare, Kyoga, and Kayumbu were overlapping and distributed in the study (Figure 5).
Table 3.
Standardized Canonical Discriminant Function Coefficients for Morphological characters of O. niloticus populations.
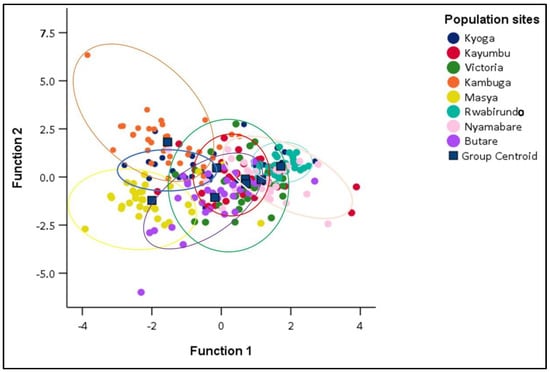
Figure 5.
Canonical Discriminant Functions for different populations.
The overall random assignment of individuals into their original group was 65.5% (Table 4) with Victoria and Rwabirundo having a higher correct classification 90.6 and 90.0%, respectively, while Kayumbu had the least classification (43.8%) (Table 4). The proportion of individuals correctly classified into their original group, i.e., Kyoga, Kayumbu, Victoria, Kambuga, Masya, Rwabirundo, Nyamabare, and Butare was 43.8%, 40.6%, 90.6%, 77.7%, 84.8%, 90.0%, 50.0%, and 47.1%, respectively.
Table 4.
Classification Results for all the populations.
Three distinct groups were observed among the Kabale sub populations with a few samples overlapping (Figure 6). Few samples from Nyamabare were overlapping in the populations of Rwabirundo and Butare. Of the samples, 83.0% were randomly assigned into their groups (Figure 6). The proportion of individuals correctly classified into their original group, in Butare, Rwabirundo, and Nyamabare, were 88.2%, 96.7%, and 63.3%, respectively (Table 5).
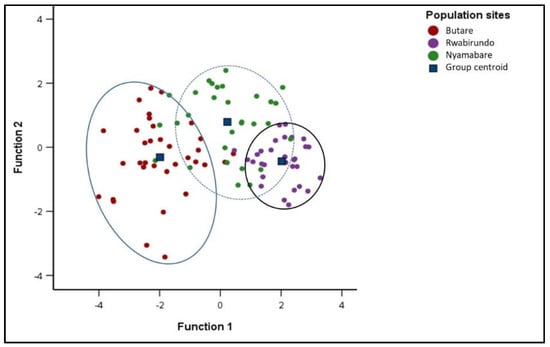
Figure 6.
Canonical Discriminant Functions for the sub populations of Kabale.
Table 5.
Classification Results for Kabale sub populations.
The population of Kayumbu in Kyanamira farm was very distinct and highly isolated from populations of Victoria and Kyoga. Additionally, more than 60% of the populations of Kyoga and Victoria were also distinct. Some samples were shared among the populations (Figure 7). The overall random assignment of individuals into their original group was high (81.1%) (Table 6). The proportion of individuals correctly classified into their original group, i.e., Victoria, Kayumbu, and Kyoga was 80.0%, 81.3%, and 81.8%, respectively (Table 6).
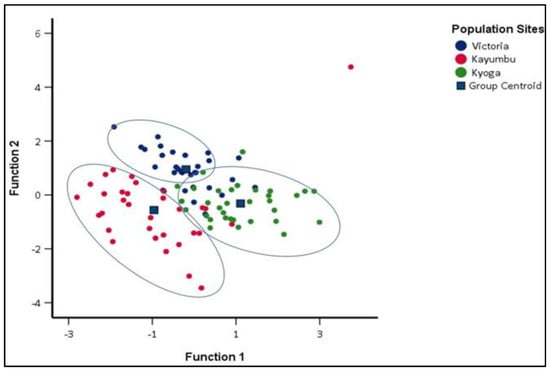
Figure 7.
Canonical Discriminant Functions for the sub populations of Kyanamira.
Table 6.
Classification Results of Kyanamira sub populations.
3.3.2. Hierarchical Cluster Analysis
Hierarchical cluster analysis performed on the sampled sites displayed two distinct clusters with Kyoga, Victoria, Kambuga and Masya populations of O. niloticus grouping together in one cluster. The second cluster consisted of two other sub-clusters that comprised one cluster with Kayumbu and Rwabirundo populations, while the other consisted of Nyamabare and Butare populations (Figure 8).
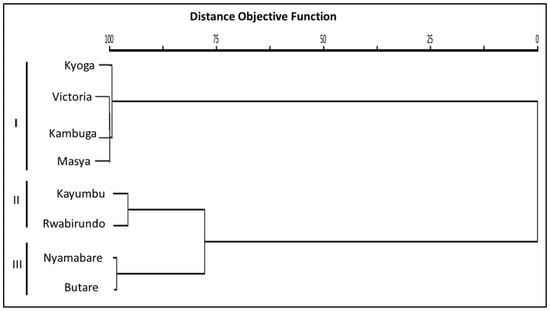
Figure 8.
Cluster dendogram of the O. niloticus populations. I. II and III are the clusters generated from the O. niloticus populations in the different sites.
4. Discussion
This work was carried out to evaluate the morphometric variations of O. niloticus strains cultured by various farmers in Uganda’s South Western Highland Agro-Ecological Zone (SWHAEZ). The results showed clear and distinct morphological differences between populations across the tested environments, thus negating the hypothesis set earlier that the morphometric traits would show no significant differences among the populations.
4.1. Morphometric Traits of the O. niloticus Populations
Recent studies [6,8,12,31] have documented the existence of morphological differences in the farmed O. niloticus populations and strains across a range of different environments. These studies align with the current findings which show clear and distinct morphological differences observed among populations obtained from different farms. The morphometric variabilities among populations of O. niloticus under culture have been reported to be influenced by genetic differentiations, food composition, depth, stocking density, farming method (pond or cage), habitats, and water quality [8,32]. Fish samples from the same gene pool, but cultured in different aquatic environments, have reported to show explicit differences in body shape [8,33].
The difference in the morphological traits in our study could be a factor of environmental variation as the farms were located within two districts (Kanungu and Kabale) of varying climatic conditions. In the current study, Rwabirundo, Butare, and Nyamabare populations, despite having been stocked with fish from the same source, exhibited morphological variations which can be attributed to environmental changes as a result of the location of the farm, as well as their culture and management conditions. Notably, the results of the Discriminant Function Analysis (DFA) showed a high level of differentiation and morphometric variability between the populations of Masya and Kambuga sampled sites (located in Kanungu) compared to other stations. The findings align with those of studies by [34] which report that the morphological differences observed in fish are strongly influenced by water quality and habitat conditions. These differences are strongly suspected to be as a result of environmental conditions such as temperature, which is higher in Kanungu district compared to Kabale district. Such temperature differences influence behavior feeding, metabolic rate, growth, and reproduction, thus affecting overall growth of fish directly.
4.2. Length–Weight Relationship and Condition Factor
The length–weight relationship provides useful information on fish growth and varies depending on the aquatic environment [32]. Such variations result from the differences in habitat/culture systems, gonad maturity, sex, nutritional content of the feeds, stomach fullness, health status of the fish, and differences in environmental conditions [6,32]. The value of the exponent ‘b’ in the parabolic equation (W = aL^b) describing the length–weight relationship in O. niloticus lies between 2.5 and 4 (30). Based on the deviations of b value, fish can be categorized into: (i) isometric (b = 3), where the body form of fish remains constant at different lengths; (ii) b < 3, when fish become slenderer as the length increases; and (iii) allometric (b > 3), when fish grow more stout with an increase in length [32].
In the current study, most of the populations did not obey cube law which assumes that the regression slope b = 3. Most of the fish showed negative allometric growth (b < 3) except for Kayumbu that showed isometric growth (b = 3), therefore obeying cube law [35]. This (b < 3) could mean that large fish had more an elongated body shape or that smaller fish were in better nutritional condition at the time of sampling [35]. The negative allometry in the length–weight relationship of fish was an indication that the population of the species in these sites had heterogeneous groups with body weights varying differently with the cube of total length. On the other hand, isometric growth shown by Kayumbu was an indication that the pond has homogenous fishes in their populations.
The condition factor (K) of fish is a measure of the species’ wellness and robustness, particularly the fish’s health status, sexual maturity, and feeding status, and it predicts the species’ adaptability by determining the individual’s status as weight at a given length. An overall fitness for fish species is assumed when relative condition factor values are equal or close to 1 [36]. In all the eight farms, the condition factor was not significantly different among the populations with the fish having K values above 1, which is an indication of the fish being in good condition. The condition factor of O. niloticus has been recorded to be around 1 in normally growing fish and increases when sexual maturation approaches [8,37]. The higher condition factor in the present study is an indication of proper management practices especially proper feeding, good water quality that enhance plankton production, use of quality and quantity feed, and proper stocking densities that limits competition among the fish. These factors have been reported to contribute significantly to the robustness in fish conditions as it lowers stress levels that would otherwise impact negatively on the K value [36].
4.3. Similitude in the Morphometric Traits among the Oreochromis niloticus Populations
Significant heterogeneity (p < 0.05) in morphology among the eight O. niloticus populations was revealed by univariate and multivariate (DFA) statistics. The results indicate the presence of morphologically distinct (Kambuga, Masya, and Rwabirundo) and overlapping (Victoria, Nyamabare, Butare, Kyoga, and Kayumbu) populations. The overlaps could indicate that there is a high possibility of these fish originating from the same source and, thus, have a similar genetic makeup. However, these farms are located in different locations and under different management conditions leading to the observed differences. This further points to the possibility of farmers keeping more than one strain, and, consequently, the possibility of interstrain hybridization. This has been reported in similar works such as those of [8,12,38] showing close genetic distances and morphometric similarities among populations sharing a common ancestry or lineage.
The sub-population clustering of Kyoga, Victoria, and Kayumbu populations indicates the closeness in the morphological characteristics between these populations. Similarly, the populations of Butare, Rwabirundo, and Nyamabare in Kabale district showed low-level scale overlaps. Their occurrence in one region could explain the similarities in morphometric characters and explains the overlaps as environmental influence has been reported to be of importance during the development of fish [39].
Results from cluster dendrogram revealed the existence of three distinct clusters with Kyoga, Victoria, Kambuga, and Masya forming one cluster, Kayumbu and Rwabirundo forming the second cluster, and, lastly, Butare and Nyamabare forming another cluster. The most remarkable closer morphotypes between Butare and Nyamabare might be linked with the source of the fry and genetic makeup. The farms under study obtained their foundation stock through government programs aimed at improving agricultural production. In this production system, fish would be supplied by a single supplier across an entire district, indicating that there is a high possibility of these fish originating from the same source and, thus, have a similar genetic makeup. A similar explanation is given for the close linkages in the populations of Kambuga and Masya. These farms are located in a different district and, thus, a possibility of a different supplier sourcing fish from one seed source and supplying these farms.
The broodstock populations of Kyoga, Kayumbu, and Victoria were sourced from the lakes, Kyoga, Kayumbu, and Victoria, respectively, and managed in independent ponds at Kyanamira fish facility. Notably, from the close linkage between Kambuga, Masya, and Victoria, it could be assumed that these fish can trace their foundation stock to Lake Victoria. Since the source of Victoria population is clearly known, it means Kambuga and Masya share some similar source with Victoria populations. The close linkage between Kyoga and Victoria, with no history of nativity of O. niloticus strains having been introduced into these lakes [40], can be explained by the fact that cases of fish translocations have taken place between these lakes thus increasing cases of admixtures. Similarly, the population in Rwabinduru was morphometrically closer to the population in Kayumbu. This points to the possibility of these populations being genetically linked and sourced from Lake Kayumbu.
5. Conclusions
In this study, we show the existence of morphological variations in the populations of O. niloticus in Uganda. This study delineated O. niloticus populations from eight pond systems stocked with fish from three different lakes in Uganda and five fish farms in the western region of Uganda based on morphometric measurements. Biotic and abiotic factors, geography and associated climatic conditions, anthropogenic activities, genetics, and their interactions are believed to be the main cause of the observed variations. Application of molecular genetic markers such as microsatellites, cytochrome c oxidase subunit 1 (CO 1) gene, and the displacement loop (D-loop) region would be effective methods of examining the discreteness of O. niloticus strains and facilitate the development of species-specific management strategies. Therefore, future work should include experiments such as progeny tests to clarify the influence of genetics, environment, and their interaction in the body shape of this species.
Author Contributions
G.K. conceived the study, designed the methods and study design, performed field work, performed data analysis, and drafted and edited the original manuscript. M.J.Y. performed data analysis, and drafted and edited the original manuscript. A.B. (Apulnal Beingana). and N.B. performed fieldwork, performed sample and data analysis, and commented and edited the manuscript. F.A. collected samples, entered raw data, performed the part of the analysis, and reviewed and edited the manuscript. A.B. (Alex Barekye) supervised the work, and commented on and edited the manuscript. H.M. and J.K.N. conducted thorough review, editing, and manuscript write up. All authors have read and agreed to the published version of the manuscript.
Funding
Financial support for this study was provided by the Austrian Partnership Programme in Higher Education and Research for Development (APPEAR) with the number: MPC-2021-01836. APPEAR is a program of the Austrian Development Cooperation (ADC) and implemented by the Austrian Agency for International Cooperation in Education and Research (OeAD-GmbH).
Institutional Review Board Statement
Not applicable. Ethical review and approval were waived for this study because field excursions were conducted together with respective authorities per district and therefore no special permission was required. Throughout the sampling regimes, fish were always bought from the farmers; thus, no special treatment for the animals was administered in the process.
Data Availability Statement
The data can be accessed via KG by emailing: gerald.kwikiriza@students.boku.ac.at.
Acknowledgments
The authors are grateful to Muhanguzi Isaac and Musinguzi Edgar for helping with the field sample collection and measurements. Mwesigwa Tony who supervised the growth of the separate populations of the O. niloticus reared in Kyanamira farm facility is highly acknowledged. The authors also are grateful to the aquaculture farmers from Kabale and Kanungu districts who allowed us to conduct our study in their farms and gave us access to their fish. We have great appreciation for Kachwekano Zonal Agricultural Research and Development Institute for hosting the on-station experiment at Kyanamira facility.
Conflicts of Interest
The authors declare no conflict of interest.
References
- Subasinghe, R.; Soto, D.; Jia, J. Global aquaculture and its role in sustainable development. Rev. Aquac. 2009, 1, 2–9. [Google Scholar] [CrossRef]
- IMARC Group. Tilapia Market: Global Industry Trends, Share, Size, Growth, Opportunity and Forecast 2021–2026. 2021. Available online: https://www.imarcgroup.com/tilapia-market (accessed on 23 June 2022).
- Miao, W.; Wang, W.E. Trends of aquaculture production and trade: Carp, tilapia, and shrimp. Asian Fish. Sci. 2020, 33, 1–10. [Google Scholar] [CrossRef]
- Zhang, T.; Sun, R.; Ding, M.; Tao, L.; Liu, L.; Tao, N.; Wang, X.; Zhong, J. Effect of extraction methods on the structural characteristics, functional properties, and emulsion stabilization ability of Tilapia skin gelatins. Food Chem. 2020, 328, 127114. [Google Scholar] [CrossRef]
- Food and Agriculture Organization. The State of the World Fisheries and Aquaculture; FAO: Rome, Italy, 2020; pp. 1–224. [Google Scholar]
- Hassanien, H.A.; Kamel, E.A.; Salem, M.A.; Dorgham, A.S. Multivariate analysis of morphometric parameters in wild and cultured Nile tilapia Oreochromis niloticus. J. Arab. Aquac. Soc. 2011, 6, 424–440. [Google Scholar]
- Opiyo, M.A.; Marijani, E.; Muendo, P.; Odede, R.; Leschen, W.; Charo-Karisa, H. A review of aquaculture production and health management practices of farmed fish in Kenya. Int. J. Vet. Sci. Med. 2018, 6, 141–148. [Google Scholar] [CrossRef]
- Tibihika, P.D.; Curto, M.; Alemayehu, E.; Waidbacher, H.; Masembe, C.; Akoll, P.; Meimberg, H. Molecular genetic diversity and differentiation of Nile tilapia (Oreochromis niloticus, L. 1758) in East African natural and stocked populations. BMC Evol. Biol. 2020, 20, 16. [Google Scholar] [CrossRef]
- Zengeya, T.A.; Booth, A.J.; Bastos, A.D.; Chimimba, C.T. Trophic interrelationships between the exotic Nile tilapia, Oreochromis niloticus and indigenous tilapiine cichlids in a subtropical African river system (Limpopo River, South Africa). Environ. Biol. Fishes 2011, 92, 479–489. [Google Scholar] [CrossRef]
- Nyirenda, S.M. Abudance, Growth and Reproductive Biology of Oreochromis niloticus (Linneaus, 1758) Compared with Tilapiines Indigenous to the Middle Zambezi. Ph.D. Thesis, The University of Zambia, Lusaka, Zambia, 2017. [Google Scholar]
- Trewavas, E. Tilapiine Fishes of the Genera Sarotherodon, Oreochromis, and Danakilia; British Museum (Natural History): London, UK, 1983. [Google Scholar]
- Makeche, M.C.; Muleya, W.; Nhiwatiwa, T. Characterization of Oreochromis niloticus strains of Lake Kariba culture fisheries using morphological and meristic methods. Am. Sci. Res. J. Eng. Technol. Sci. 2020, 74, 31–40. [Google Scholar]
- MAAIF. Essentials of Aquaculture Production, Management and Development in Uganda; Ministry of Agriculture, Animal Industry and Fisheries (MAAIF): Entebbe, Uganda, 2018.
- Mwanja, M.; Ondhoro, C.; Sserwada, M.; Achieng, P.; Ddungu, R.; Mwanja, W. Morphological variation of Nile tilapia populations from major water bodies of Uganda. Uganda J. Agric. Sci. 2016, 17, 21–32. [Google Scholar] [CrossRef]
- Kwikiriza, G.; Barekye, A.; Aheisibwe, A.R.; Byakora, E.; Tibihika, P.D. Comparative growth performance and proximate nutrient composition of three local strains of Nile tilapia (Oreochromis niloticus L.) collected from different locations in Uganda. Fish. Aquac. J. 2017, 8, 1–5. [Google Scholar]
- Samaddar, A. Recent trends on Tilapia cultivation and its major socioeconomic impact among some developing nations: A Review. Asian J. Fish. Aquat. Res. 2022, 8, 1–10. [Google Scholar] [CrossRef]
- Anane-Taabeah, G.; Frimpong, E.A.; Hallerman, E. Aquaculture-mediated invasion of the genetically improved farmed Tilapia (Gift) into the lower Volta Basin of Ghana. Diversity 2019, 11, 188. [Google Scholar] [CrossRef]
- Beardmore, J.A.; Mair, G.C.; Lewis, R.I. Monosex male production in finfish as exemplified by tilapia: Applications, problems, and prospects. Reprod. Biotechnol. Finfish Aquac. 2001, 1, 283–301. [Google Scholar]
- Brummett, R.E.; Ponzoni, R.W. Concepts, alternatives, and environmental considerations in the development and use of improved strains of tilapia in African aquaculture. Rev. Fish. Sci. 2009, 17, 70–77. [Google Scholar] [CrossRef]
- Deines, A.M.; Bbole, I.; Katongo, C.; Feder, J.L.; Lodge, D.M. Hybridisation between native Oreochromis species and introduced Nile tilapia O. niloticus in the Kafue River, Zambia. Afr. J. Aquat. Sci. 2014, 39, 23–34. [Google Scholar] [CrossRef]
- Bradbeer, S.J.; Harrington, J.; Watson, H.; Warraich, A.; Shechonge, A.; Smith, A.; Tamatamah, R.; Ngatunga, B.P.; Turner, G.F.; Genner, M.J. Limited hybridization between introduced and Critically Endangered indigenous tilapia fishes in northern Tanzania. Hydrobiologia 2019, 832, 257–268. [Google Scholar] [CrossRef]
- Fuerst, P.A.; Mwanja, W.W.; Kaufman, L. The genetic history of the introduced Nile tilapia of Lake Victoria (Uganda–E. Africa): The population structure of Oreochromis niloticus (Pisces: Cichlidae) revealed by DNA microsatellite markers. In Tilapia Aquaculture in the 21st Century Proceedings from the Fifth International Symposium on Tilapia in Aquaculture; Panorama da Aquicultura Magazine: Rio de Janeiro, Brazil, 2000; pp. 30–40. [Google Scholar]
- Natugonza, V.; Nyamweya, C.; Sturludóttir, E.; Musinguzi, L.; Ogutu-Ohwayo, R.; Bassa, S.; Mplaponi, E.; Tomasson, T.; Stefansson, G. Spatiotemporal variation in fishing patterns and fishing pressure in Lake Victoria (East Africa) in relation to balanced harvest. Fish. Res. 2022, 252, 106355. [Google Scholar] [CrossRef]
- Diedericks, G.; Maetens, H.; Van Steenberge, M.; Snoeks, J. Testing for hybridization between Nile tilapia (Oreochromis niloticus) and blue spotted tilapia (Oreochromis leucostictus) in the Lake Edward system. J. Gt. Lakes Res. 2021, 47, 1446–1452. [Google Scholar] [CrossRef]
- Bamwerinde, W.; Bashaasha, B.; Ssembajjwe, W.; Place, F. Determinants of land use in the densely populated Kigezi highlands of southwestern Uganda; No. 1004-2016-78549; Ag Econ. In Proceedings of the International Association of Agricultural Economists (IAAE) Conference, Gold Coast, QLD, Australia, 12–18 August 2006. [Google Scholar]
- Elliott, J.M.; Hurley, M.A. The functional relationship between body size and growth rate in fish. Funct. Ecol. 1995, 1, 625–627. [Google Scholar] [CrossRef]
- Langerhans, R.B.; DeWitt, T.J. Shared and unique features of evolutionary diversification. Am. Nat. 2004, 164, 335–349. [Google Scholar] [CrossRef]
- Rogers, S.M.; Bernatchez, L. The genetic architecture of ecological speciation and the association with signatures of selection in natural lake whitefish (Coregonus sp. Salmonidae) species pairs. Mol. Biol. Evol. 2007, 24, 1423–1438. [Google Scholar] [CrossRef] [PubMed]
- Schneider, J.C. Manual of Fisheries Survey Methods II: With Periodic Updates; Michigan Department of Natural Resources, Fisheries Division: Lansing, MI, USA, 2000.
- LeCren, E.D. The length-weight relationship and seasonal cycle in gonad weight and condition in the perch (Perca fluviatilis). J. Anim. Ecol. 1951, 1, 201–219. [Google Scholar]
- Jawad, L.A.; Ibáñez, A.L.; Kiki, M.; Gnohossou, P. Determination of body shape and meristic characters variations in wild and cultured populations of cichlid fish, Oreochromis niloticus, from the Republic of Benin, West of Africa. Fish. Aquat. Sci. 2020, 3, 23–28. [Google Scholar] [CrossRef]
- Asmamaw, B.; Tessema, M. Morphometric Variations of Nile tilapia (Oreochromis niloticus) (Linnaeus, 1758) (Perciformes, Cichlidae) collected from three rift valley Lakes in Ethiopia. JAFH 2021, 10, 341–355. [Google Scholar] [CrossRef]
- Vehanen, T.; Huusko, A. Brown trout Salmo trutta express different morphometrics due to divergence in the rearing environment. J. Fish Biol. 2011, 79, 1167–1181. [Google Scholar] [CrossRef]
- Tumwesigye, Z.; Tumwesigye, W.; Opio, F.; Kemigabo, C.; Mujuni, B. The effect of water quality on aquaculture productivity in Ibanda District, Uganda. Aquac. Res. 2022, 2, 23–36. [Google Scholar] [CrossRef]
- Froese, R. Cube law, condition factor and weight–length relationships: History, meta-analysis and recommendations. J. Appl. Ichthyol. 2006, 22, 241–253. [Google Scholar] [CrossRef]
- Datta, S.N.; Kaur, V.I.; Dhawan, A.; Jassal, G. Estimation of length-weight relationship and condition factor of spotted snakehead Channa punctata (Bloch) under different feeding regimes. SpringerPlus 2013, 2, 436. [Google Scholar] [CrossRef]
- Otieno, O.N.; Kitaka, N.; Njiru, J.M. Length-weight relationship, condition factor, length at first maturity and sex ratio of Nile tilapia, Oreochromis niloticus in Lake Naivasha, Kenya. Int. J. Fish. Aquat. 2014, 2, 67–72. [Google Scholar]
- Popoola, O.M.; Ebiwonjumi, A. Assessment of morphological variations in wild populations of Nile tilapia from South West Nigeria. J. Agric. Sci. Technol. 2021, 13, 1313–8820. [Google Scholar] [CrossRef]
- Jonsson, B.; Jonsson, N. Early environment influences later performance in fishes. J. Fish Biol. 2014, 85, 151–188. [Google Scholar] [CrossRef] [PubMed]
- Ogutu-Ohwayo, R. The decline of the native fishes of lakes Victoria and Kyoga (East Africa) and the impact of introduced species, especially the Nile perch, Lates niloticus, and the Nile tilapia, Oreochromis niloticus. Environ. Biol. Fishes 1990, 27, 81–96. [Google Scholar] [CrossRef]


Disclaimer/Publisher’s Note: The statements, opinions and data contained in all publications are solely those of the individual author(s) and contributor(s) and not of MDPI and/or the editor(s). MDPI and/or the editor(s) disclaim responsibility for any injury to people or property resulting from any ideas, methods, instructions or products referred to in the content. |
© 2023 by the authors. Licensee MDPI, Basel, Switzerland. This article is an open access article distributed under the terms and conditions of the Creative Commons Attribution (CC BY) license (https://creativecommons.org/licenses/by/4.0/).