Article

An Optimized Environmental DNA Method to Improve Detectability of the Endangered Sichuan Taimen (Hucho bleekeri)

1
Shaanxi Key Laboratory of Qinling Ecological Security, Shaanxi Institute of Zoology, Xi’an 710032, China
2
School of Ecology, Sun Yat-sen University, Guangzhou 510006, China
*
Author to whom correspondence should be addressed.
Fishes 2023, 8(7), 339; https://doi.org/10.3390/fishes8070339
Submission received: 6 May 2023 / Revised: 25 June 2023 / Accepted: 25 June 2023 / Published: 27 June 2023

Abstract

:
Environmental DNA (eDNA) techniques have emerged as a cost-effective and non-invasive strategy for monitoring the distribution of endangered aquatic species. Despite their numerous advantages, operational uncertainty at each step of the process represents a significant challenge that can impact the reliability of results. Hence, the optimization of the eDNA analytic protocol is of utmost importance. In this study, the rare and endangered fish species Sichuan taimen was chosen as the target species to evaluate the concordance between different approaches (tissue, pond, and field water samples) for eDNA detection. The results showed that membrane filtration, collection of a 2-L water sample, and utilization of the DNeasy Tissue and Blood DNA extraction kit were suitable for the analysis of DNA in water samples. Furthermore, the mtDNA D-loop region demonstrated potential as a specific molecular marker for the precise identification of Sichuan taimen. Our results indicated that TaqMan fluorescence PCR can serve as the optimal detection method for reliable identification of target DNA even at extremely low concentrations in the field. This study established an optimized eDNA analysis protocol for Sichuan taimen detection, which will provide the basis for future resource investigations aimed at protection of this endangered aquatic species.
Key Contribution: Focusing on the endangered species, Sichuan taimen, a set of eDNA analytic procedures for field water samples was optimized, including aspects of water sample collection, eDNA extraction, and PCR amplification. By utilizing this efficient and standardized experimental protocol, the accuracy of investigating the distribution of aquatic species is improved, providing crucial technical support for wider application of eDNA analysis technology in monitoring the distribution of this endangered species.

1. Introduction

Aquatic organisms are important parts of natural ecosystems and key components of global biodiversity conservation [1,2]. Compared to terrestrial habitats, aquatic ecosystems are complex and difficult to study, leading to a lack of basic biological data for many aquatic species, which hinders the development of aquatic conservation. Sichuan taimen (H. bleekeri), is a large and fierce carnivorous fish species, which lives as the top predator in the river and has important value for maintaining ecological balance. However, due to the fragmentation of habitats, the wild Sichuan taimen population has dramatically decreased, making it a national first-level protected animal in China [3]. Therefore, carrying out an effective environmental survey aimed for evaluation of Sichuan taimen’s population size, dynamics, geographical distribution, and other aspects of Sichuan taimen biology is a key threshold for determining conservation measures for this endangered species.
Currently, traditional population monitoring methods mainly use field collection of fish to identify species based on individual morphological characters. To accurately identify species during such surveys, participants need to have a good understanding of taxonomy and be able to distinguish between similar-looking species [4,5]. As a result, those methods are inefficient and difficult to standardize. Moreover, traditional surveys and monitoring methods can harm the target species at the survey site [6]. Hence, there is a necessity to develop a non-invasive, cost-effective, high-sensitivity, and time-efficient survey method specifically tailored for rare aquatic animals.
Recent progress in molecular biology, especially the advent of DNA barcoding technology, has resulted in development of environmental DNA (eDNA) based methods for monitoring of biological resources [7]. eDNA refers to genetic material extracted from natural media such as ancient sediments, soil, water, or snow, primarily derived from animal feces, urine, and epidermal cells [8,9]. Lately, this method has been applied to monitor a variety of rare amphibians [10], reptiles [11], and fishes [12,13] worldwide. To this date, multiple experimental protocols of eDNA analysis have been developed; however, only a few studies have compared their performance. The available information indicates that the detection rate of the target species can be affected by such factors as the in-water sampling technique, DNA extraction method, and sequencing approach [14,15,16]. Thus, it is important to carefully evaluate and optimize methods and procedures of water sample collection, DNA extraction, and PCR amplification, along with other relevant technologies, tailored to specific species.
In this study, the critically endangered Sichuan taimen was selected as the target species to develop a reliable method of eDNA analysis using water samples from aquaculture facilities and possible areas of the species’ occurrence in the wild. Through optimization and standardization of the water collection technique, DNA extraction method, and PCR protocol, a completely operable and reliable procedure for analyzing eDNA from stream water was established. The standardized experimental procedure of eDNA analysis methodology developed in this study will improve the efficiency of field surveys aimed at detecting aquatic species distribution by reducing its laboriousness and improving the reliability of obtained results. This study provides technical support for monitoring the population distribution of an endangered aquatic species.

2. Materials and Methods
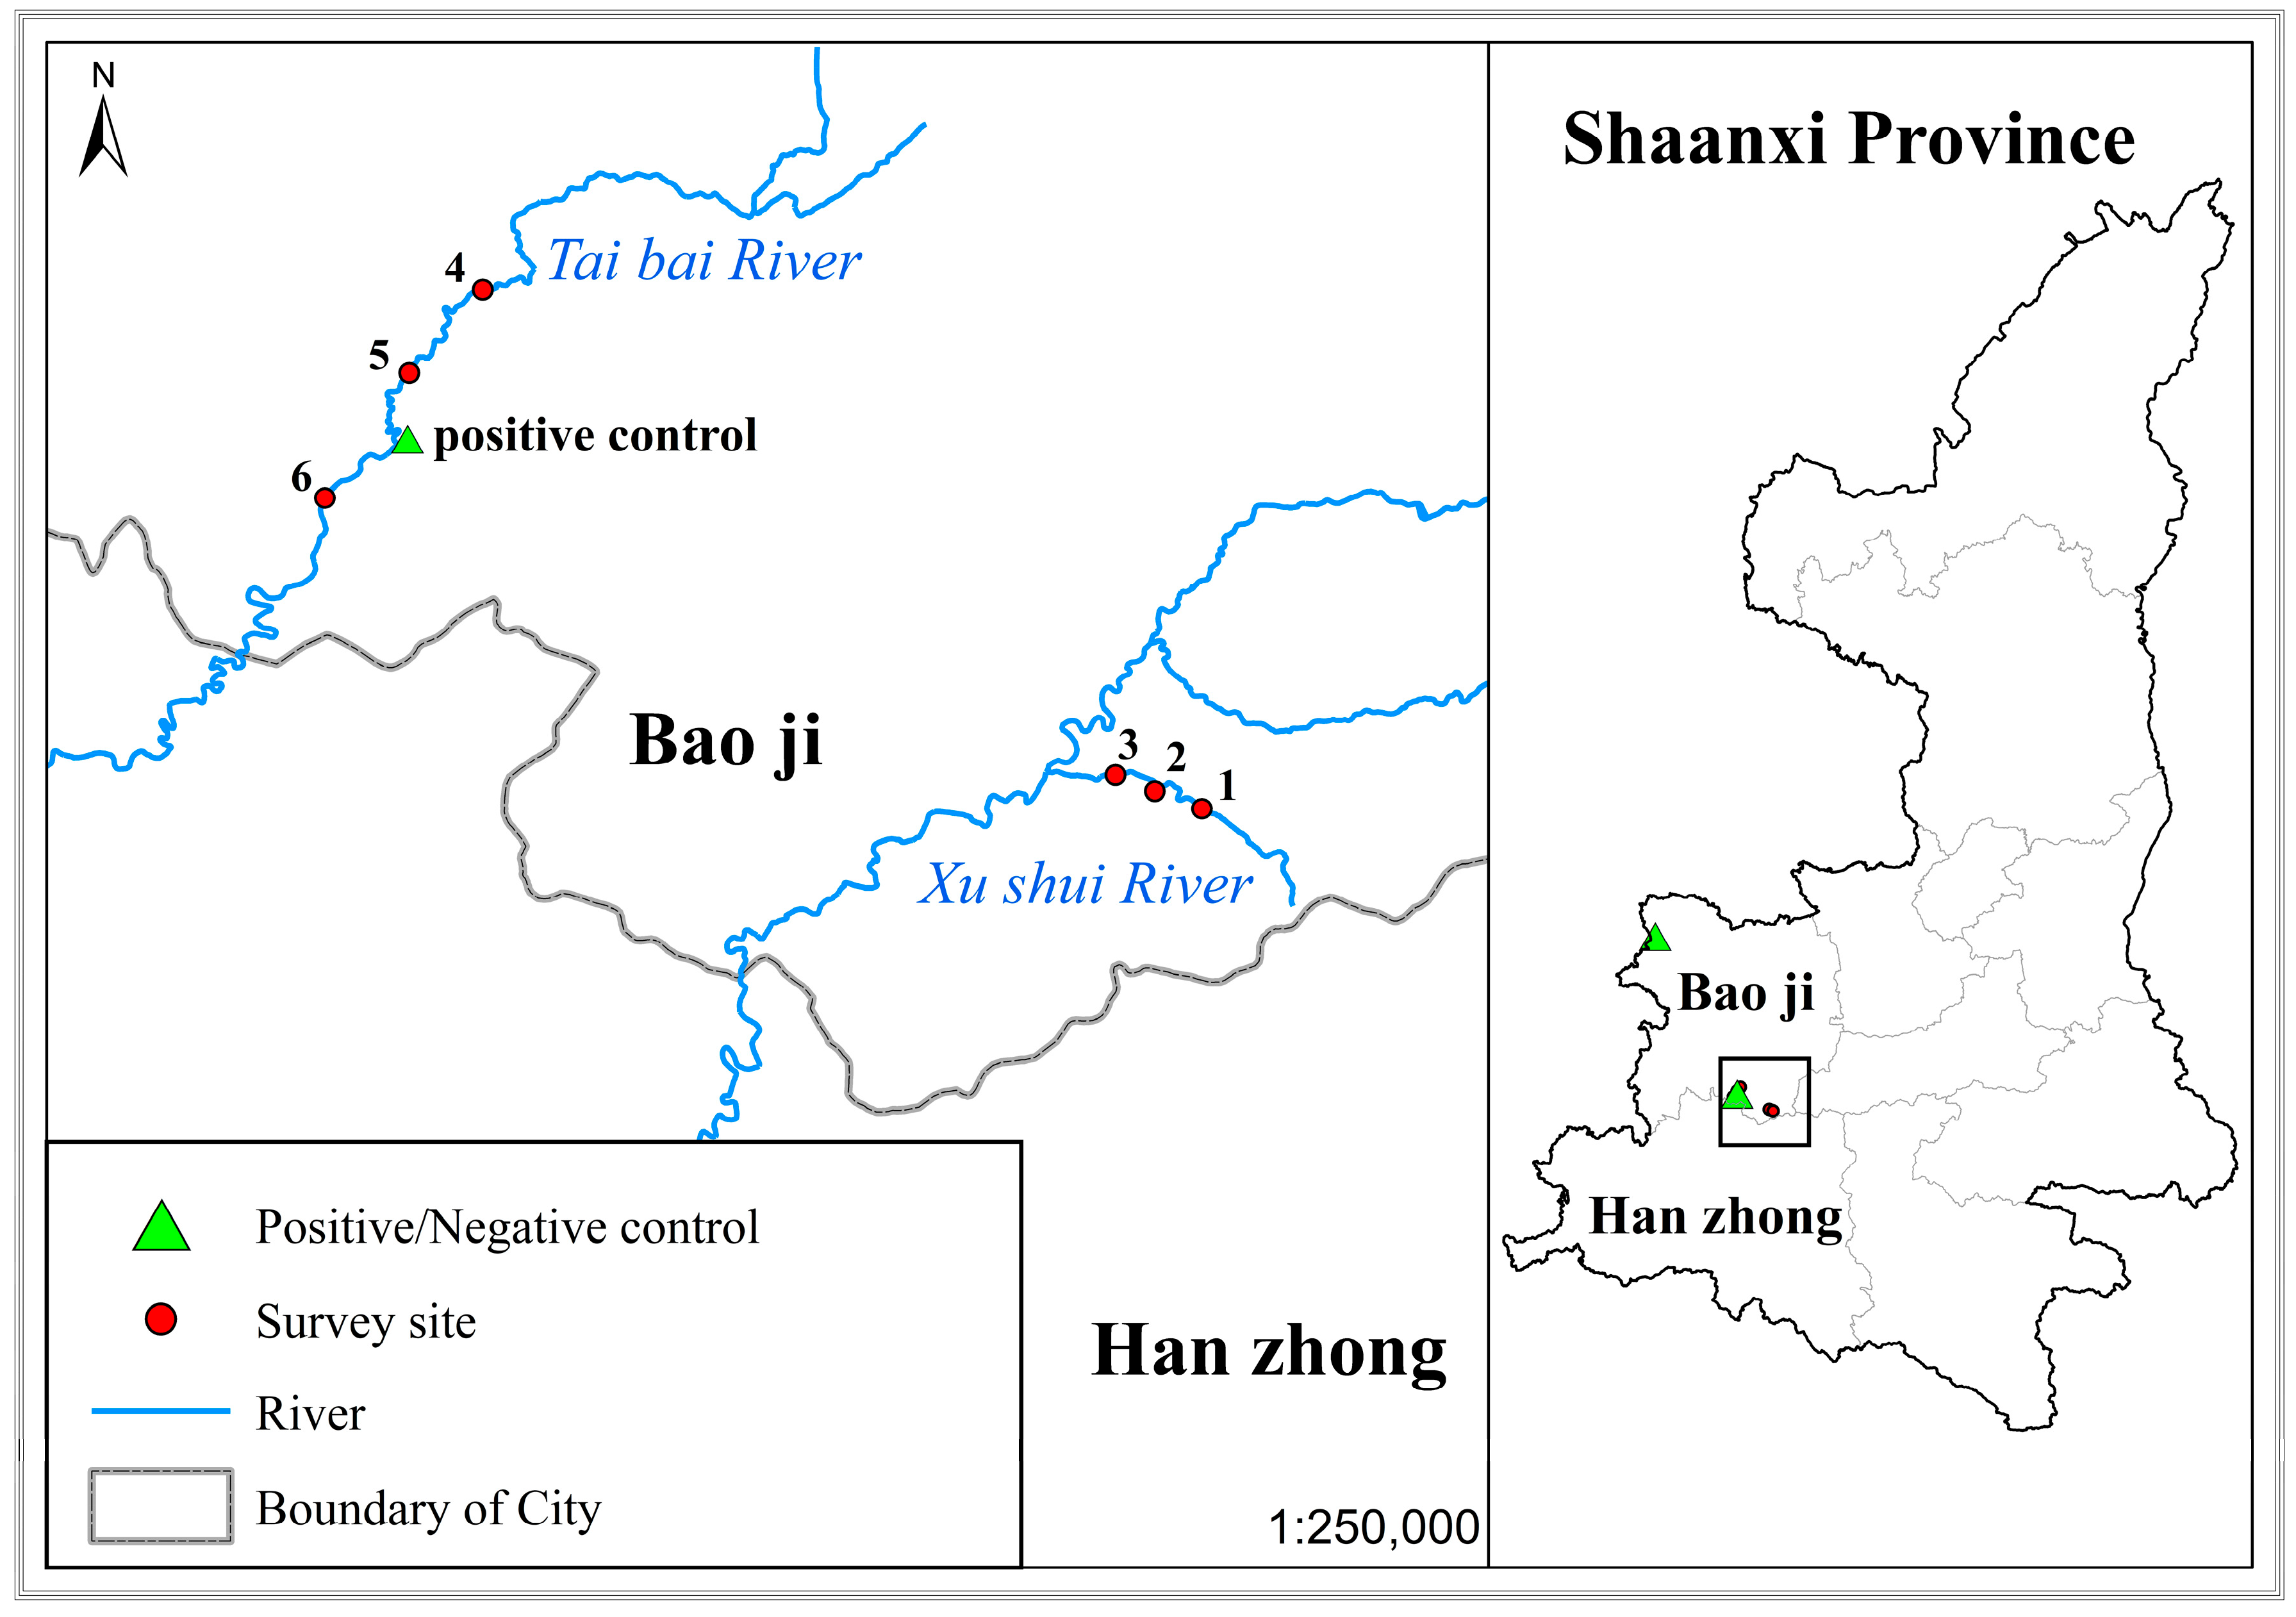
2.1. eDNA Sampling

For eDNA sampling, field water collection was conducted at six carefully selected stream sites, based on historical records of Sichuan taimen distribution in Shaanxi Province (Figure 1).
As a positive control, pond water collection was carried out at the Babaoshan Special Aquaculture Co., Ltd. in Taibai County, Shaanxi Province, China (33°50.366′ N, 107°13.996′ E). The sampled pond (25 m × 5 m × 1 m) was supplied with water originating from a natural mountain stream with an outlet velocity of 1 m/s. The pond housed approximately 10 adult Sichuan taimen individuals, with an average body weight of around 1 kg. Additionally, negative and blank control water samples were collected. Negative control included one site where Sichuan tainem does not occur but B. lenok tsinlingensis (another endangered salmonid, sharp-snouted lenok, whose distribution area partially overlaps with Sichuan taimen) does occur (Figure 1). Blank samples included enzyme-free water.
For pre-testing eDNA detection in the field, we collected 250 mL, 500 mL, 1 L, and 2 L water samples which were then filtered through a 0.45 μm aperture WCN nitrate fiber membrane (GE Healthcare UK, Ltd., Amersham, UK) to filter the water samples [17]. Two sterile tweezers were used to pick the membrane from the edge, and the membrane was transferred in anhydrous ethanol and stored it at −20 °C for later use. Each sample size collection was repeated three times.

2.2. Tissue DNA Collection and Extraction

Liver samples were collected from Sichuan taimen and Brachymystax lenok tsinlingensis. All fish used in this study succumbed to accidental deaths in the Qinling Mountains. Tissue DNA was extracted using the E.Z.N.A.® Tissue DNA Kit (Omega Bio-Tek Inc., Norcross, GA, USA), according to the manufacturers’ instructions. The quality of the isolated DNA in solution (5 μL) was assessed using 1% agarose gel electrophoresis. The remaining DNA solution was stored at −20 °C for later use.

2.3. eDNA Extraction

The filter membranes were removed and dried overnight at room temperature (20–25 °C). Then, two commercial DNA extraction kits, PowerWater DNA Isolation kit (MOBio Laboratories, Inc, Carlsbad, CA, USA) and DNeasy Tissue and Blood DNA Extraction Kit (Qiagen Inc., Germantown, MD, USA), were used to extract eDNA from water samples according to the manufacturer’s instructions [18,19]. Finally, the DNA was eluted with 50 μL of buffer (100 μL is recommended). The DNA solution (10 μL) was detected using 1% agarose gel electrophoresis and a nucleic acid analyzer. The remaining DNA solution was stored at −20 °C for later use.

2.4. Primer Design and Screening

Four pairs of PCR primers were designed to amplify the D-loop region of the mtDNA sequence of Sichuan taimen based on the information available from the National Center for Biotechnology Information (NCBI) database (GenBank NO: HM804473.1). Primers were designed using Primer Premier 5.0 and synthesized by Nanjing Jinsirui Biotechnology Co., Ltd. (Nanjing, China) (Table 1). Using the tissue DNA of Sichuan taimen as a template, PCR amplifications were performed using four pairs of primers at an appropriate annealing temperature. To enhance the detection protocol and differentiate the outgroup species B. lenok tsinlingensis (GenBank NO: JQ675732.1), quantitative PCR (qPCR) analysis with TaqMan fluorescent probes were employed.

2.5. Optimization of PCR Condition and Verification

Two DNA polymerases, Taq and Pfu, and two PCR reaction procedures, ordinary PCR and touchdown PCR, were combined into four methods, Pfu + PCR (Method 1), Taq + PCR (Method 2), Taq + touchdown PCR (Method 3), and Pfu + touchdown PCR (Method 4) for comparison.
The PCR reaction volume was 20 μL, including 10 μL 2 × Taq MasterMix, 2.0 μL template (tissue DNA of Sichuan taimen, which used to detect the specificity of primers, and eDNA of Sichuan taimen pond), and 10 μmol·L−1 forward and reverse primers. The PCR procedure [18] was as follows: 95 °C denaturation for 15 min, 37 cycles (94 °C, 1 min; 56 °C, 1 min; 72 °C, 1 min), and extension for 10 min at 72 °C. The touchdown PCR was conducted with the following procedure [20]: denaturation at 94 °C for 4 min and 10 cycles (94 °C, 30 s; 66 °C for 45 s; 72 °C, 90 s). The annealing temperature was reduced by 1 °C in each cycle, followed by 34 cycles (94 °C, 30 s; 56 °C, 45 s; 72 °C, 120 s) and extended for 30 min at 72 °C.
The products obtained from PCR amplifications were verified by 1.5% agarose gel electrophoresis, which was analyzed by NIH ImageJ software (Macintosh, CA, USA) according to instructions. To further validate the successful amplifications, a subset of positive samples was randomly chosen and sent for sequencing to Nanjing Jinsirui Biotechnology Co., Ltd., located in Nanjing, China. The sequence homology ratio was noted using BLASTN search of the NCBI data library.
The reaction volume for TaqMan fluorescent qPCR was 25 μL, consisting of 2 μL template DNA (tissue DNA of two species, eDNA of Sichuan taimen pond and eDNA from field), 12.5 μL premix Ex TaqTM (probe qPCR) (Takara, China), 10 μmol·L−1 forward primer and 10 μmol·L−1 reverse primer, 2 μL probe (5 μM), and 8.5 μL ddH2O. The reaction procedure was: 95 °C for 30 s, 40 cycles (95 °C 5 s; 55 °C for 10 s; 72 °C 20 s), and 72 °C, 5 min for final extension. In addition, each amplification was carried out with a blank control, negative control, and positive control.

3. Results

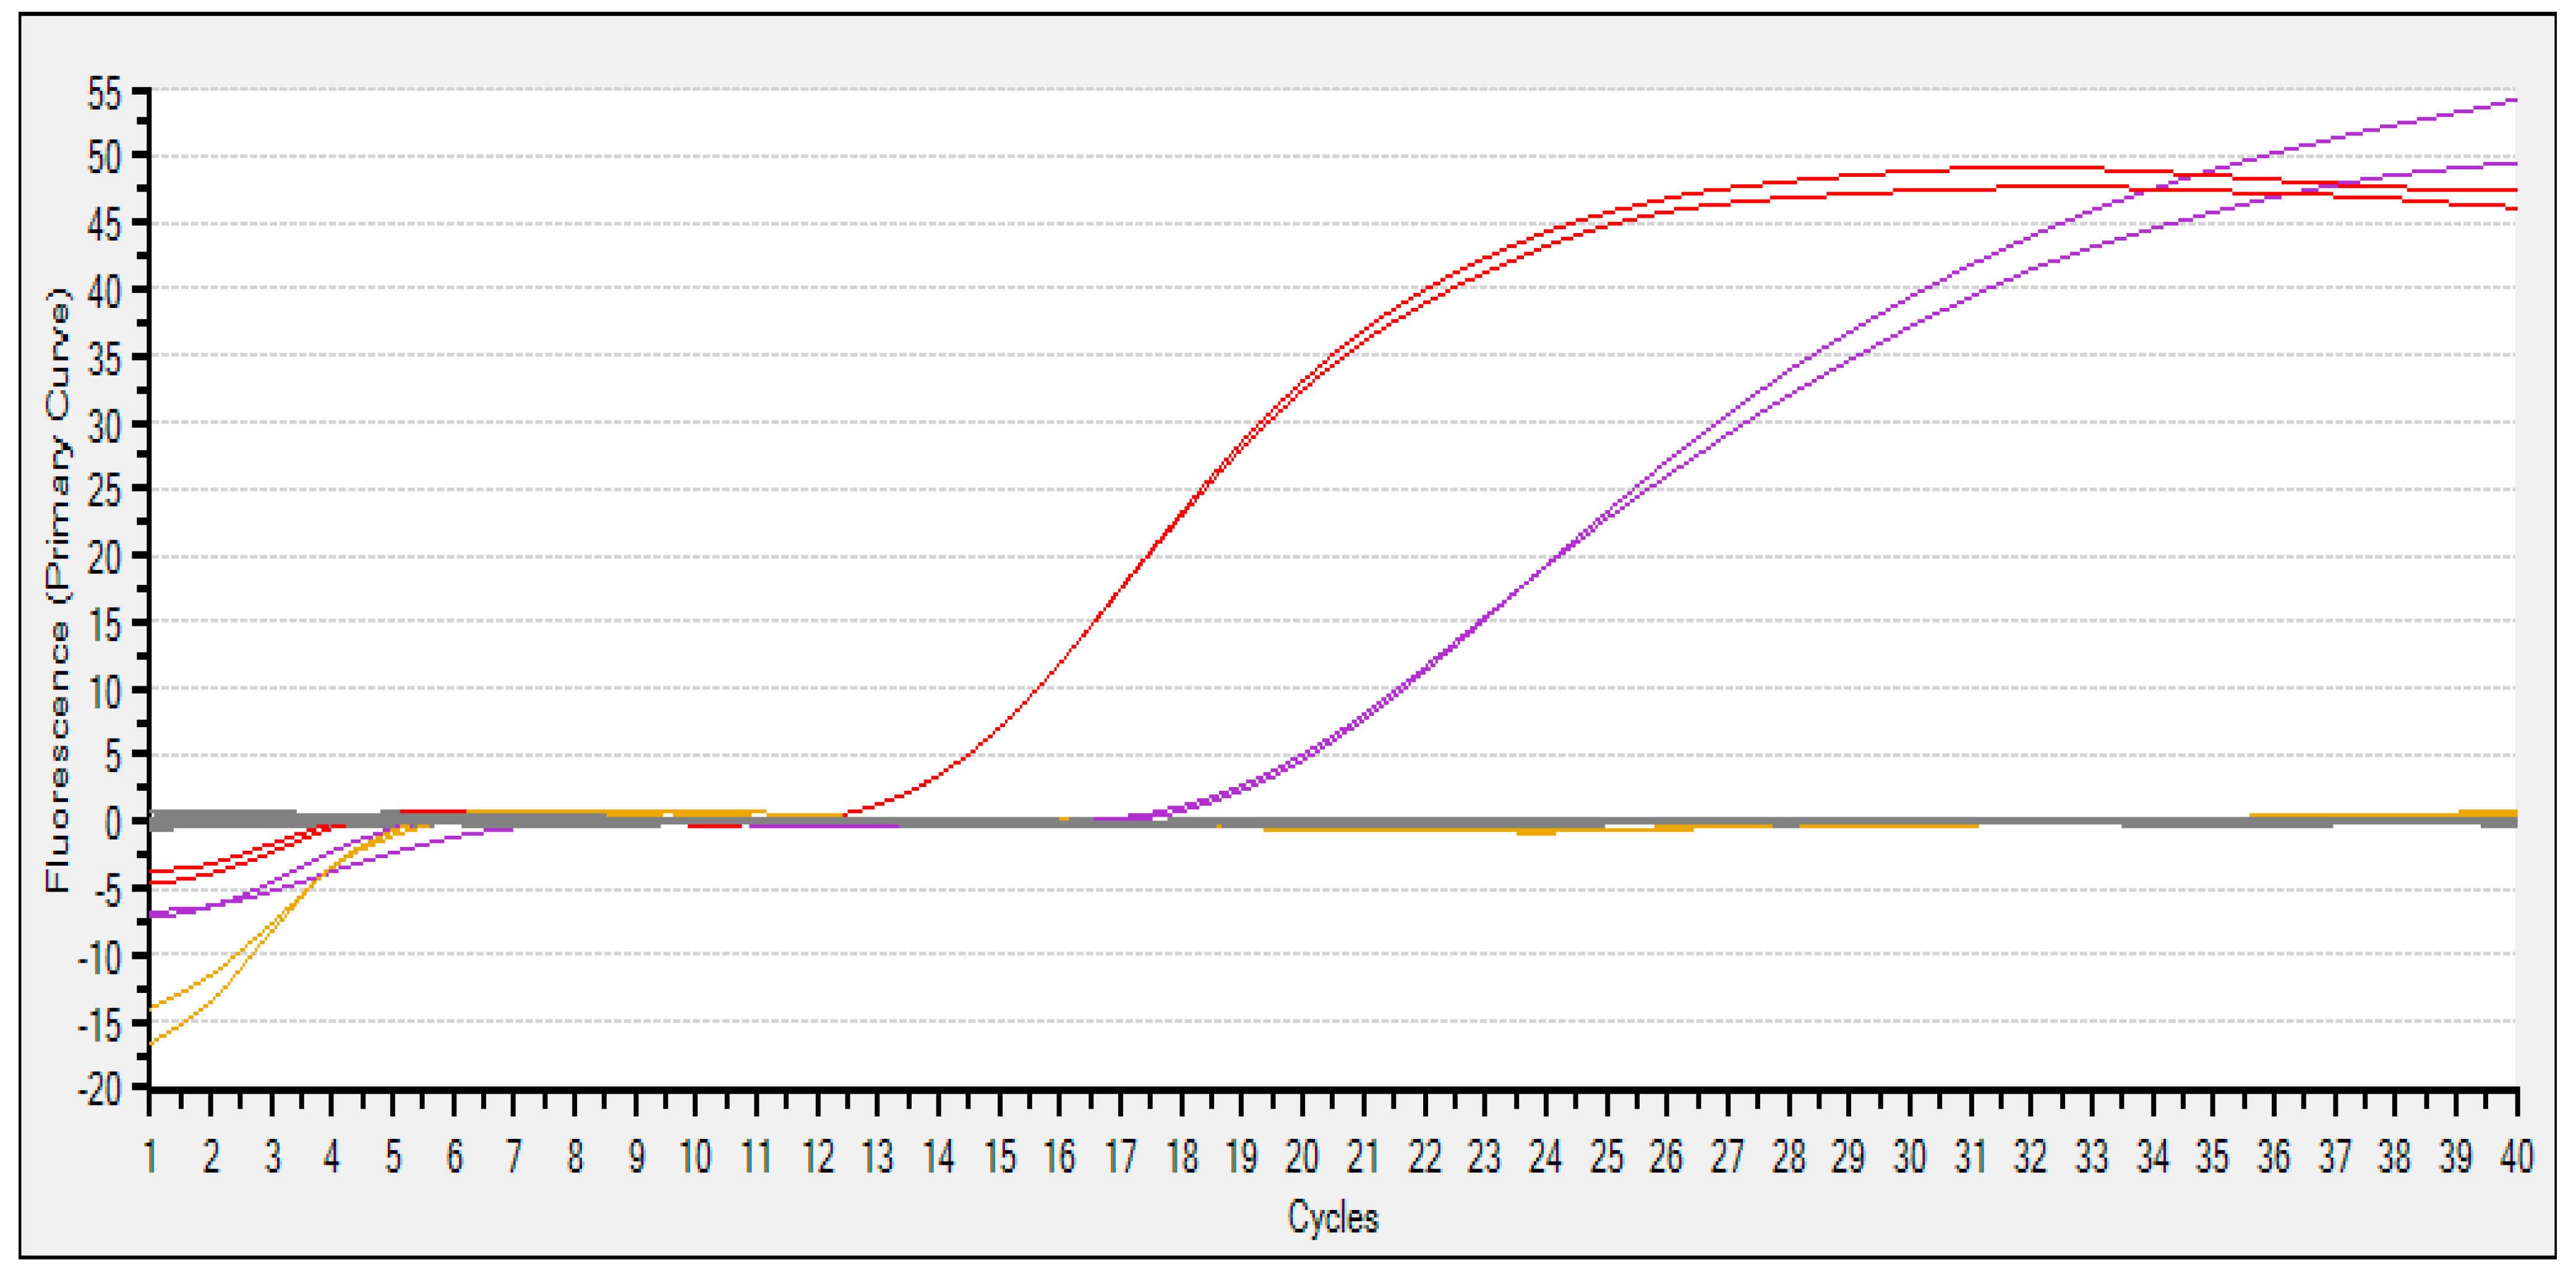
3.1. Primer Testing and PCR Amplification Optimization

Using DNA of Sichuan taimen as a template, four pairs of primers were used for amplification. The sizes of the PCR products were consistent with our expectations (Figure 2). The PCR amplification fragment of primer P1 was <250 bp; the target band was single and bright, indicating high efficiency of PCR amplification. Thus, this pair of primers was selected for further work.
Among the amplification methods tested, Method 2 displayed the best performance, where 100% detection rate of the target gene was observed. Moreover, the amplified DNA product bands were all bright and specific. Method 3 exhibited the second-best amplification. The detection rate of the target gene was 100%, but there were more non-specific bands, and their brightness was higher than that of the target band. The amplification effect of Method 1 was poor; the detection rate of the target gene was only 33%, and there were more non-specific bands. Comparison showed that the detection rate of the target gene was 100% when using Taq amplification, which was higher than the detection effect of Pfu (33%) while the normal PCR reaction (67%) was higher than that of the touchdown PCR (50%) (Figure S1).

3.2. Comparison of eDNA Isolation Methods from Water Samples

Based on the preliminary results, using primer P1 and Method 2 as reaction conditions and using eDNA extracted by the two commercial kits from culture pond water of Sichuan taimen as template, PCR amplification was performed. The results showed that extraction from PowerWater DNA Isolation kit was poor, and no bands were amplified, while the PCR products using the DNeasy Tissue and Blood DNA Extraction Kit were bright, indicating that the extracted DNA was of good purity (Figure S2).

3.3. Selection of Sample Volume

The PCR amplification results of eDNA isolated from water samples of various volumes exhibited variations. The eDNA amplification of 1-L and 2-L water samples was good; the target bands were clear, and there were no non-specific bands, indicating that 2-L water samples should be appropriate (Figure S3).

3.4. Quantitative PCR (qPCR) Analysis Using TaqMan Probes
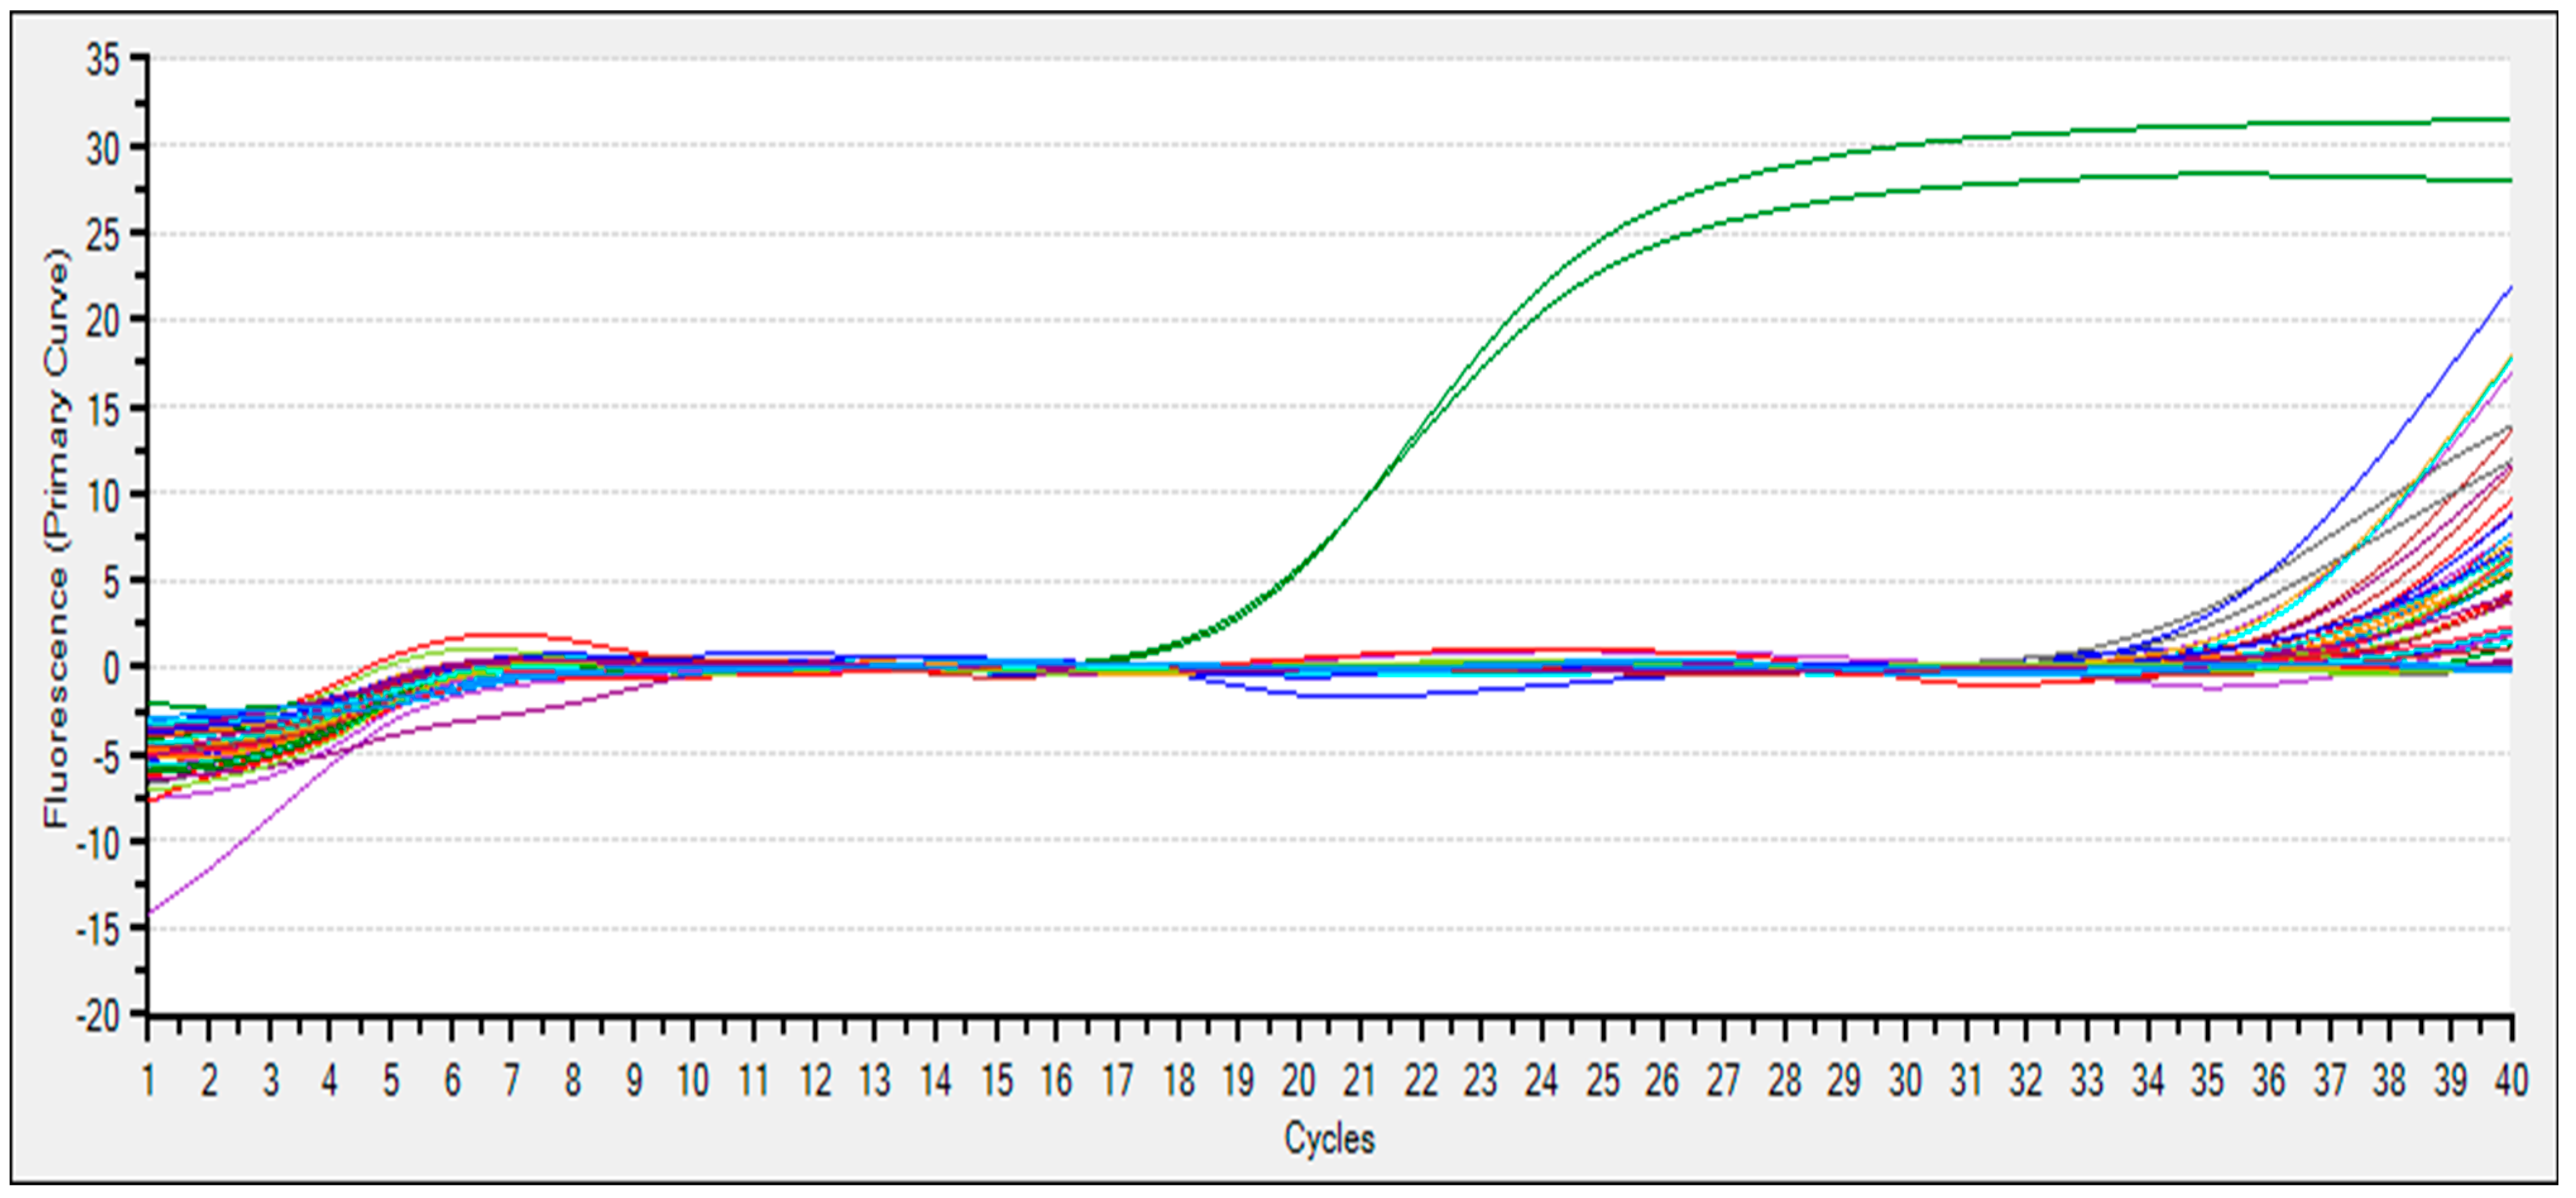
Although the common PCR amplification method can obtain bright and single target bands for the detection of culture water samples, there were several non-specific bands in the electrophoretic image when eDNA was amplified from stream water samples. Therefore, a more sensitive TaqMan qPCR amplification procedure was optimized for eDNA detection.
Using DNA derived from the tissues of Sichuan taimen and Brachymystax lenok tsinlingensis as templates, TaqMan qPCR was used to test the specific of probes for quantitative fluorescence analysis. The findings showed that (1) the detection results of no-enzyme H2O were completely negative and (2) the amplified Ct values of the DNA template of Sichuan taimen and Brachymystax lenok tsinlingensis were 14.09 and 19.57, respectively (Figure 3 and Table 2). The difference in the Ct values was 5.48, and the concentration difference was approximately 16 times. Theoretically, if the ratio of the molecular concentration of the two species is less than 16, the difference between the species can be effectively determined.

3.5. eDNA Detection

The TaqMan primers/probe listed in Table 1 were used to detect eDNA of Sichuan taimen using eDNA obtained from aquaculture samples as templates. The results showed that Ct values were 21.40 ± 0.22, and the amplification results of the blank control showed no amplification, indicating that the primer could effectively detect extremely trace amounts of mtDNA in water samples from pond, even though the DNA content was very low and contained large amounts of humus and other impurities.
Subsequently, TaqMan fluorescence quantitative assays were used to detect Sichuan taimen eDNA in stream samples. No amplification was observed in the blank control. The amplified Ct values of the positive control ranged from 18.83 to 21.66, with an average of 19.84 ± 1.12 (Figure 4). The Ct values of the negative control ranged from 34.29 to 35.37, with an average of 34.83 ± 0.45, indicating no amplification. Among the six water samples tested in this study, water from only one sample site in the Taibai River Basin showed effective amplification, and the Ct value of this investigation site was under the negative threshold, with a range from 32.66 to 32.53 (Table 3). The results showed that, although the population density of the target species was very low, the TaqMan probe could still effectively detect eDNA in the stream samples.

4. Discussion

Due to the drastic reduction of habitats, the Sichuan taimen is currently classified as a critically endangered species by the International Union for Conservation of Nature (IUCN) [21,22]. Wild population distribution surveys are effective for planning conservation actions to protect endangered species. Compared with traditional fish survey methods, eDNA analysis has the advantages of being low cost, highly sensitive, and less influenced by natural factors such as weather and of involving non-destructive sampling and so is especially suitable for investigating the distribution of endangered aquatic species [23,24]. The complete process of eDNA analysis includes three basic steps: water sample collection and preservation, DNA extraction, and DNA detection and analysis [25]. Different methods and combinations of methods can directly affect the detection rate of the target species and can even produce opposite test results. Therefore, screening and optimization of eDNA protocols are particularly important for investigating endangered species.
Obtaining high-quality total eDNA from water samples is a key step in eDNA analysis. Precipitation and filtration are the two commonly used methods for eDNA collection. The amount of eDNA collected by precipitation was higher than that collected by filtration [26], which is advantageous for monitoring species occurrence. However, the success rate for detection of specific species was lower than that of filtration, which may be due to the relatively low proportion of target species DNA in the total eDNA of water samples, making subsequent PCR amplification difficult. Compared to precipitation, filtration is more suitable for the collection and preservation of a large number of water samples [27]. Therefore, filtration was selected as the eDNA collection method in this protocol, and the results showed that this method was feasible. Through collection of different volumes of water, we found that 2 L was the most appropriate amounts for water sample collection, which was similar to the results of other studies [28,29]. In eDNA extraction, due to the complex DNA components in water samples, most studies use commercial kits to extract total eDNA of high quality. Currently, the MOBio PowerWater DNA extraction kit and DNeasy Tissue and Blood DNA extraction kit are widely used. The MOBio PowerWater DNA extraction kit uses the physical method of cell lysis. Owing to the large mechanical shear force, this physical method is suitable for DNA isolation from prokaryotic bacteria. The DNeasy Tissue and Blood DNA extraction kit uses protease K to cleave the cell membrane, which causes little damage to the cell and has a better separation effect for eukaryotic DNA [30,31]. Therefore, our findings confirmed that the DNeasy Tissue and Blood DNA Extraction Kit could effectively obtain eukaryotic DNA from water samples.
The accurate identification of target species plays a crucial role in the success of eDNA analysis. In fish monitoring, eDNA detection methods primarily consist of two categories: species-specific detection and eDNA metabarcoding [32,33,34]. With the development of high-throughput DNA sequencing technology, eDNA metabarcoding has attracted increasing attention; however, many challenges remain in its practical application. High costs are a crucial factor hindering the long-term use of eDNA metabarcoding for monitoring endangered species. Second, the construction of a comprehensive reference database with high quality and accuracy on a global scale is a prerequisite for comparative eDNA metabarcoding analysis of target sequences. Numerous studies have demonstrated that errors or the absence of reference sequences for species of interest can significantly diminish the accuracy of survey results [35,36,37]. At present, the database information for endemic and rare species is incomplete. Therefore, this study aimed to enhance the analysis of the mtDNA D-loop region of Sichuan taimen by designing and screening specific molecular markers. Furthermore, a comparative analysis was performed between traditional PCR and TaqMan fluorescence PCR assays for detecting the target species, and the reaction conditions were subsequently optimized. It was concluded that although the results of the traditional PCR method were specific to laboratory conditions, the TaqMan fluorescence PCR method was advantageous for stream water samples. However, in field investigations, errors such as false positives and false negatives are important reasons for the high uncertainty in eDNA technology. False positives result from a species being detected even though it is not present in the environment, whereas false negatives occur when the DNA of the species cannot be detected, even though it is present in the environment. False negatives can arise due to various reasons, such as the low eDNA concentration of the target species, including low biological eDNA release in the sample itself, and eDNA loss caused by degradation during transportation. Additionally, the physical and chemical characteristics of the sample, such as the high salinity of seawater, can inhibit subsequent PCR amplification [38]. Other factors that can contribute to false negatives include low primer specificity and resolution. For instance, in fish diversity surveys, the MiFish primers are considered to be the most effective universal primers for amplification, yet they have limited species differentiation and low resolution despite their ability to amplify 90% of the 12S rRNA partial sequences in fish mitochondria [39]. The main factor leading to false positives is believed to be the widespread presence of exogenous or non-target DNA contamination during eDNA processing. Therefore, before sampling, DNA extraction, PCR amplification, and other experimental operations, we can refer to the strict decontamination procedures in archaeological DNA research [40,41], including the use of 10% bleach or 254 nm ultraviolet light to treat tools. The use of spatial separation and surface cleaning during practical operations is an effective method to avoid sample, laboratory, or cross contamination. In addition, strict setting of multiple negative controls (such as double distilled water blank samples), including on-site blanks, filtered blanks, extraction blanks, and PCR blanks, is necessary for evaluating contamination throughout the entire eDNA process. At present, two primary approaches are employed to enhance the efficiency of eDNA detection and address the issue of false negatives. The first approach involves designing high-resolution primers and developing multi-site markers. By doing so, the specificity and discriminatory power of the primers can be improved, enabling accurate identification of target species. The second approach focuses on tackling false positives by developing standardized technical specifications. Establishing such standards was an essential objective of this study in constructing an eDNA analysis system before conducting extensive field investigations.
Traditional aquatic biological monitoring relies mainly on morphological identification methods, which are time-consuming, are expensive, and have low accuracy. Although eDNA analysis technology still has uncertain factors, it will have wider application in the future with the continuous optimization of experimental methods, improvements of sequencing technology and reference databases, and establishment of species detection standards. We predict that eDNA analysis will become an accurate evaluation system for monitoring species, analyzing diversity, estimating population abundance in aquatic ecosystems, and finding applications in conservation ecology, population genetics, and biogeography.

5. Conclusions

In summary, we optimized eDNA methods for detecting Sichuan taimen, particularly water collection, eDNA capture and extraction, genetic marker selection, and eDNA detection. Our results suggest that 2 L water collection volume and eDNA capture on 0.45 µm WCN filters, followed by extraction with the DNeasy Tissue and Blood DNA extraction kit, can obtain high-quality eDNA and reliable results. By using specific primers targeting the D-loop region of the mitochondrial DNA (mtDNA) genome sequence, TaqMan qPCR assays have proven to be effective for the rapid and accurate identification of this rare species in field settings. Quality controls can also be established to minimize detection errors by eliminating contamination, including spatial separation, surface cleaning, and negative controls at each step of eDNA analysis. This study establishes an important technical means for further investigation of wild populations of Sichuan taimen based on water sample eDNA analysis and provides a reference for subsequent surveys of this endangered aquatic animal.

Supplementary Materials

The following supporting information can be downloaded at: https://www.mdpi.com/article/10.3390/fishes8070339/s1, Figure S1: Comparison of combinations of PCR reaction systems and PCR programs. M: DNA Marker (DL2000). Lanes 1–9 were PCR products amplified by method 1; lanes 10–18 were PCR products amplified by method 2; lanes 19–27 were PCR products amplified by method 3; lanes 28–36 were PCR products amplified by method 4; and lane C was negative control. Figure S2: Comparison of two DNA isolation methods. M: DNA Marker (DL2000). Lanes 1–3 were PCR products of eDNA extracted using PoweWater DNA Isolation kit, Lanes 4–6 were PCR products of eDNA extracted using DNeasy Tissue and Blood DNA extraction kit, and lane C was negative control. Figure S3: Comparison of water volumes. M: DNA Marker (DL2000). Lanes 1–3 were PCR products of eDNA from 250 mL water samples; Lanes 4–6 were PCR products of eDNA from 500 mL water samples; Lanes 7–9 were PCR products of eDNA from 1 L water samples; Lanes 10–12 were PCR products of eDNA from 2 L water samples; and lane C- was negative control.

Author Contributions

Conceptualization, W.J.; methodology, W.J.; software, J.D. and W.J.; validation, W.J.; formal analysis, J.D. and Q.W.; investigation, J.D. and Q.W.; resources, J.D.; data curation, J.D. and W.J.; writing—original draft preparation, J.D.; writing—review and editing, W.J. and L.Z.; visualization, F.K. and H.Z. (Hu Zhao); supervision, H.Z. (Hongxing Zhang) and W.J.; project administration, W.J.; funding acquisition, W.J. All authors have read and agreed to the published version of the manuscript.

Funding

This work was supported by National Natural Science Foundation of China (31502170); Foundation of Shaanxi Science and Technology Department (2015NY152) and Foundation of Shaanxi Academy of Sciences of China (grant No. 2017k-17; grant No. 2021k-19).

Institutional Review Board Statement

The animal study protocol was approved by the Animal Ethics Committee of the Shaanxi Institute of Zoology (protocol code: L23D012A51, date of approval: 24 April 2023) for studies involving animals.

Informed Consent Statement

Not applicable.

Data Availability Statement

The data presented in this study are available on request from the corresponding author.

Acknowledgments

Our sincere thanks go to Hongying Ma, Jianlu Zhang, Han Zhang, and Cheng Fang for the help in animal sample collections and experiments.

Conflicts of Interest

The authors declare no conflict of interest.

References

  1. Snyder, C.D.; Young, J.A. Identification of management thresholds of urban development in support of aquatic biodiversity conservation. Ecol. Indic. 2020, 112, 106124. [Google Scholar] [CrossRef]
  2. Roper, B.B.; Capurso, J.M.; Paroz, Y.; Young, M.K. Conservation of aquatic biodiversity in the context of multiple-use management on National Forest System lands. Fisheries 2018, 43, 396–405. [Google Scholar] [CrossRef]
  3. Leng, X.Q.; Du, H.; Xiong, W.; Cheng, P.L.; Luo, J.; Wu, J.M. Successful ultrasonography-assisted artificial reproduction of critically endangered Sichuan taimen (Hucho bleekeri). Fishes 2023, 8, 152. [Google Scholar] [CrossRef]
  4. Eiler, A.; Lofgren, A.; Hjerne, O.; Norden, S.; Saetre, P. Environmental DNA (eDNA) detects the pool frog (Pelophylax lessonae) at times when traditional monitoring methods are insensitive. Sci. Rep. 2018, 8, 5452. [Google Scholar] [CrossRef] [PubMed]
  5. Schmelzle, M.C.; Kinziger, A.P. Using occupancy modelling to compare environmental DNA to traditional field methods for regional-scale monitoring of an endangered aquatic species. Mol. Ecol. Resour. 2016, 16, 895–908. [Google Scholar] [CrossRef]
  6. Snyder, D.E. Invited overview: Conclusions from a review of electrofishing and its harmful effects on fish. Rev. Fish Biol. Fish. 2003, 13, 445–453. [Google Scholar] [CrossRef]
  7. Willerslev, E.; Hansen, A.J.; Binladen, J.; Brand, T.B.; Gilbert, M.T.; Shapiro, B.; Bunce, M.; Wiuf, C.; Gilichinsky, D.A.; Cooper, A. Diverse plant and animal genetic records from Holocene and Pleistocene sediments. Science 2003, 300, 791–795. [Google Scholar] [CrossRef]
  8. Lydolph, M.C.; Jacobsen, J.; Arctander, P.; Gilbert, M.T.; Gilichinsky, D.A.; Hansen, A.J.; Willerslev, E.; Lange, L. Beringian paleoecology inferred from permafrost-preserved fungal DNA. Appl. Environ. Microbiol. 2005, 71, 1012–1017. [Google Scholar] [CrossRef]
  9. Valiere, N.; Taberlet, P. Urine collected in the field as a source of DNA for species and individual identification. Mol. Ecol. 2000, 9, 2150–2152. [Google Scholar] [CrossRef]
  10. Ma, H.Y.; Zhang, H.; Deng, J.; Zhao, H.; Kong, F.; Jiang, W.; Zhang, H.X.; Dong, X.G.; Wang, Q.J. Detection the eDNA of Batrachuperus taibaiensis from the Zhouzhi Heihe River using a nested PCR method and DNA barcoding. Animals 2022, 12, 1105. [Google Scholar] [CrossRef]
  11. Lam, I.P.Y.; Sung, Y.H.; Fong, J.J. Using eDNA techniques to find the endangered big-headed turtle (Platysternon megacephalum). PLoS ONE 2022, 17, e0262015. [Google Scholar] [CrossRef]
  12. Uchii, K.; Wakimura, K.; Kikko, T.; Yonekura, R.; Kawaguchi, R.; Komada, H.; Yamanaka, H.; Kenzaka, T.; Tani, K. Environmental DNA monitoring method of the commercially important and endangered fish Gnathopogon caerulescens. Limnology 2022, 23, 49–56. [Google Scholar] [CrossRef]
  13. Yu, D.; Shen, Z.; Chang, T.; Li, S.; Liu, H. Using environmental DNA methods to improve detectability in an endangered sturgeon (Acipenser sinensis) monitoring program. BMC Ecol. Evol. 2021, 21, 216. [Google Scholar] [CrossRef]
  14. Kumar, G.; Eble, J.E.; Gaither, M.R. A practical guide to sample preservation and pre-PCR processing of aquatic environmental DNA. Mol. Ecol. Resour. 2020, 20, 29–39. [Google Scholar] [CrossRef]
  15. Boyd, S.H.; Niemiller, K.D.K.; Dooley, K.E.; Nix, J.; Niemiller, M.L. Using environmental DNA methods to survey for rare groundwater fauna: Detection of an endangered endemic cave crayfish in northern Alabama. PLoS ONE 2020, 15, e0242741. [Google Scholar] [CrossRef]
  16. Hinlo, R.; Gleeson, D.; Lintermans, M.; Furlan, E. Methods to maximise recovery of environmental DNA from water samples. PLoS ONE 2017, 12, e0179251. [Google Scholar] [CrossRef]
  17. Pilliod, D.S.; Goldberg, C.S.; Arkle, R.S.; Waits, L.P. Estimating occupancy and abundance of stream amphibians using environmental DNA from filtered water samples. Can. J. Fish. Aquat. Sci. 2013, 70, 1123–1130. [Google Scholar] [CrossRef]
  18. Deiner, K.; Walser, J.C.; Machler, E.; Altermatt, F. Choice of capture and extraction methods affect detection of freshwater biodiversity from environmental DNA. Biol. Conserv. 2015, 183, 53–63. [Google Scholar] [CrossRef]
  19. Yukl, S.A.; Kaiser, P.; Kim, P.; Li, P.L.; Wong, J.K. Advantages of using the QIAshredder instead of restriction digestion to prepare DNA for droplet digital PCR. Biotechniques 2014, 56, 194–196. [Google Scholar] [CrossRef]
  20. Goldberg, C.S.; Pilliod, D.S.; Arkle, R.S.; Waits, L.P. Molecular detection of vertebrates in stream water: A demonstration using Rocky Mountain tailed frogs and Idaho giant salamanders. PLoS ONE 2011, 6, e0022746. [Google Scholar] [CrossRef]
  21. Zhang, Y.; Luan, P.; Ren, G.; Hu, G.; Yin, J. Estimating the inbreeding level and genetic relatedness in an isolated population of critically endangered Sichuan taimen (Hucho bleekeri) using genome-wide SNP markers. Ecol. Evol. 2020, 10, 1390–1400. [Google Scholar] [CrossRef] [PubMed]
  22. Wang, K.; Zhang, S.H.; Wang, D.Q.; Wu, J.M.; Wang, C.Y.; Wei, Q.W. Conservation genetics assessment and phylogenetic relationships of critically endangered Hucho bleekeri in China. J. Appl. Ichthyol. 2016, 32, 343–349. [Google Scholar] [CrossRef]
  23. Loeza-Quintana, T.; Crookes, S.; Li, P.Y.; Reid, D.P.; Smith, M.; Hanner, R.H. Environmental DNA detection of endangered and invasive species in Kejimkujik National Park and historic site. Genome 2021, 64, 172–180. [Google Scholar] [CrossRef] [PubMed]
  24. Lor, Y.; Schreier, T.M.; Waller, D.L.; Merkes, C.M. Using environmental DNA (eDNA) to detect the endangered Spectaclecase Mussel (Margaritifera monodonta). Freshw. Sci. 2020, 39, 837–847. [Google Scholar] [CrossRef]
  25. Shu, L.; Ludwig, A.; Peng, Z. Standards for methods utilizing environmental DNA for detection of fish species. Genes 2020, 11, 296. [Google Scholar] [CrossRef]
  26. Turner, C.R.; Barnes, M.A.; Xu, C.C.Y.; Jones, S.E.; Jerde, C.L.; Lodge, D.M. Particle size distribution and optimal capture of aqueous macrobial eDNA. Methods Ecol. Evol. 2014, 5, 676–684. [Google Scholar] [CrossRef]
  27. Deiner, K.; Altermatt, F. Transport distance of invertebrate environmental DNA in a natural river. PLoS ONE 2014, 9, e88786. [Google Scholar] [CrossRef]
  28. Belle, C.C.; Stoeckle, B.C.; Geist, J. Taxonomic and geographical representation of freshwater environmental DNA research in aquatic conservation. Aquat. Conserv. 2019, 29, 1996–2009. [Google Scholar] [CrossRef]
  29. Lear, G.; Dickie, I.; Banks, J.; Boyer, S.; Buckley, H.L.; Buckley, T.R.; Cruickshank, R.; Dopheide, A.; Handley, K.M.; Hermans, S.; et al. Methods for the extraction, storage, amplification and sequencing of DNA from environmental samples. N. Z. J. Ecol. 2018, 42, 10. [Google Scholar] [CrossRef]
  30. Rajendhran, J.; Gunasekaran, P. Strategies for accessing soil metagenome for desired applications. Biotechnol. Adv. 2008, 26, 576–590. [Google Scholar] [CrossRef]
  31. Tringe, S.G.; Rubin, E.M. Metagenomics: DNA sequencing of environmental samples. Nat. Rev. Genet. 2005, 6, 805–814. [Google Scholar] [CrossRef]
  32. Evans, N.T.; Lamberti, G.A. Freshwater fisheries assessment using environmental DNA: A primer on the method, its potential, and shortcomings as a conservation tool. Fish. Res. 2018, 197, 60–66. [Google Scholar] [CrossRef]
  33. Thomsen, P.F.; Willerslev, E. Environmental DNA-An emerging tool in conservation for monitoring past and present biodiversity. Biol. Conserv. 2015, 183, 4–18. [Google Scholar] [CrossRef]
  34. Rees, H.C.; Maddison, B.C.; Middleditch, D.J.; Patmore, J.R.M.; Gough, K.C. The detection of aquatic animal species using environmental DNA-a review of eDNA as a survey tool in ecology. J. Appl. Ecol. 2014, 51, 1450–1459. [Google Scholar] [CrossRef]
  35. Yang, J.H.; Zhang, X.W.; Xie, Y.W.; Song, C.; Zhang, Y.; Yu, H.X.; Burton, G.A. Zooplankton community profiling in a eutrophic freshwater ecosystem-lake Tai basin by DNA metabarcoding. Sci. Rep. 2017, 7, 1773. [Google Scholar] [CrossRef]
  36. Sigut, M.; Kostovcik, M.; Sigutova, H.; Hulcr, J.; Drozd, P.; Hrcek, J. Performance of DNA metabarcoding, standard barcoding, and morphological approach in the identification of host-parasitoid interactions. PLoS ONE 2017, 12, e0187803. [Google Scholar] [CrossRef]
  37. Abad, D.; Albaina, A.; Aguirre, M.; Laza-Martinez, A.; Uriarte, I.; Iriarte, A.; Villate, F.; Estonba, A. Is metabarcoding suitable for estuarine plankton monitoring? A comparative study with microscopy. Mar. Biol. 2016, 163, 149. [Google Scholar] [CrossRef]
  38. Wilson, I.G. Inhibition and facilitation of nucleic acid amplification. Appl. Environ. Microbiol. 1997, 63, 3741–3751. [Google Scholar] [CrossRef]
  39. Li, C.H.; Ling, L.X.; Tan, J.; Lin, X.L.; Wang, H.; Sun, B.J.; Li, Z. Challenge, breakthrough and future perspectives of environmental DNA technology in monitoring aquatic organisms. J. Shanghai Ocean. Univ. 2023, 32, 564–574. (In Chinese) [Google Scholar] [CrossRef]
  40. Pedersen, M.W.; Overballe-Petersen, S.; Ermini, L.; Sarkissian, C.D.; Haile, J.; Hellstrom, M.; Spens, J.; Thomsen, P.F.; Bohmann, K.; Cappellini, E.; et al. Ancient and modern environmental DNA. Philos. Trans. R. Soc. B 2015, 370, 20130383. [Google Scholar] [CrossRef]
  41. Knapp, M.; Clarke, A.C.; Horsburgh, K.A.; Matisoo-Smith, E.A. Setting the stage-building and working in an ancient DNA laboratory. Ann. Anat. 2012, 194, 3–6. [Google Scholar] [CrossRef] [PubMed]
Figure 1. Map of field sampling points.
Fishes 08 00339 g001
Figure 2. PCR products of four pairs of primers. M: DNA Marker (DL2000). Lanes 1–3 and 13–15 were PCR products of P1; lanes 4–6 and 16–18 were PCR products of PN2; lanes 7–9 and 19–21 were PCR products of PN1; and lanes 10–12 and 22–24 were PCR products of PNL.
Fishes 08 00339 g002
Figure 3. Fluorescence curves of TaqMan probe. Each colored line represents a pair of specific TaqMan probes. The red ones refer to Sichuan taimen, and the purple ones refer to Brachymystax lenok tsinlingensis.
Fishes 08 00339 g003
Figure 4. Amplification curves of partial field water samples. Each colored line represents one test sample, and the green ones represent the positive control.
Fishes 08 00339 g004
Table 1. Primer and probes for mtDNA D-loop of Sichuan taimen.
NamesSequenceAnnealing
Temperature (°C)
Production Size (bp)
PNLF 5′-TAAGAACCGACCAACG-3′58.0814
R 5′-GTGCCAAATGTCATAAAG-3′
PN1F 5′-AAAGCCGAATGTAATGC-3′58.5325
R 5′-AGGATCGTTCAGCGTAG-3′
PN2F 5′-AAGAACCGACCAACGA-3′59.0193
R 5′-TGGGTAACGGGCAATA-3′
P1F 5′-AAAACACGGATAACCACC-3′59.0223
R 5′- ACCAAATGCCAGGAATAA-3′
PtaqF 5′-CCCCTTCATAATTAAAGTATACATTA-3′60.882
R 5′-GGTCTGATGACAGTGTTG-3′61.5
P (FAM) TAACACACTTTATGACATTTGGCACCG (Eclipse)69.3
F: forward primer; R: reverse primer; Ptaq: TaqMan fluorescent qPCR; P: TaqMan fluorescent probe; FAM: fluorescence labeled; Eclipse: fluorescence eclipse.
Table 2. Test of TaqMan primer and probe amplification curves by DNA derived from the tissues.
WellTemplate TypeTarget NameSample NameCt(CP)
C1TissueJQ675732.1B-119.48
C2TissueJQ675732.1B-119.66
C3TissueHM804473.1H-214.09
C4TissueHM804473.1H-214.09
C5BCHM804473.1H2O--
C6BCHM804473.1H2O--
Well: refers to the name of different fluorescent reaction pores for testing; BC: refers to the blank controls; Target Name: refers to the different target gene sequence numbers in NCBI database; Sample Name: refers to the names of different target species, with B being the abbreviation for Brachymystax lenok tsinlingensis and H for Sichuan taimen.
Table 3. The Ct values of fluorescence quantification of field water samples.
WellSample TypeSample NameCt(CP)Ct(SDM)
B3UNKNXJG1-1----
C3UNKNXJG1-1----
B4UNKNXJG1-238.0137.07
C4UNKNXJG1-237.9236.84
B5UNKNXJG1-338.0236.77
C5UNKNXJG1-337.9136.78
B6UNKNXJG2-139.09--
C6UNKNXJG2-1----
B7UNKNXJG2-238.53--
C7UNKNXJG2-238.3837.63
B8UNKNXJG2-336.9736.14
C8UNKNXJG2-338.6436.85
B9UNKNXJG3-137.437.11
C9UNKNXJG3-138.8737.31
B10UNKNXJG3-2----
C10UNKNXJG3-2----
D3UNKNXJG3-337.837.5
E3UNKNXJG3-338.8737.81
D4UNKNTBH2-133.3833.53
E4UNKNTBH2-132.6633.1
D5UNKNTBH2-233.0833.16
E5UNKNTBH2-232.9733.28
D6UNKNTBH2-337.0336.87
E6UNKNTBH2-336.7236.78
D9UNKNSJG4-137.6638.18
E9UNKNSJG4-139.5--
F2UNKNSJG4-238.0337.53
G2UNKNSJG4-235.6435.81
F3UNKNSJG4-338.5438.19
G3UNKNSJG4-3----
D10UNKNTBH4-135.6435.95
E10UNKNTBH4-136.3936.62
F3UNKNTBH4-235.2235.27
G3UNKNTBH4-235.8535.81
F4UNKNTBH4-335.9636.35
G4UNKNTBH4-337.3537.83
F5NTCnegative34.2934.66
G5NTCnegative35.3735.28
G8BCH2O----
G9BCH2O----
G10PTCpositive21.4821.27
G11PTCpositive21.6621.34
Well: refers to the name of different fluorescent reaction pores for testing; UNKN: refers to different water samples from the field; NTC: negative controls; BC: blank controls; PTC: positive controls; The red mark shows the detected effective amplification.
Disclaimer/Publisher’s Note: The statements, opinions and data contained in all publications are solely those of the individual author(s) and contributor(s) and not of MDPI and/or the editor(s). MDPI and/or the editor(s) disclaim responsibility for any injury to people or property resulting from any ideas, methods, instructions or products referred to in the content.

