Article

Effects of Feeding Frequency on Liver Transcriptome: Unveiling Appetite-Regulating Peptides in Mexican Pike Silverside (Chirostoma estor)

by
Mitzi Ernestina Juárez-Gutiérrez
1,
Carlos Cristian Martínez-Chávez
1,
Claudia Yaneth Godoy-Figueroa
1,
Verónica Jiménez-Jacinto
2,
María Gisela Ríos-Durán
1,
Carlos Antonio Martínez-Palacios
1 and
Pamela Navarrete-Ramírez
3,*
1
Instituto de Investigaciones Agropecuarias y Forestales, Universidad Michoacana de San Nicolás de Hidalgo, Morelia 58330, Mexico
2
Unidad Universitaria de Secuenciación Masiva y Bioinformática del Instituto de Biotecnología, Universidad Nacional Autónoma de México, Cuernavaca 62210, Mexico
3
CONAHCyT-Instituto de Investigaciones Agropecuarias y Forestales, Universidad Michoacana de San Nicolás de Hidalgo, Morelia 58330, Mexico
*
Author to whom correspondence should be addressed.
Fishes 2024, 9(10), 393; https://doi.org/10.3390/fishes9100393
Submission received: 22 August 2024 / Revised: 27 September 2024 / Accepted: 28 September 2024 / Published: 30 September 2024
(This article belongs to the Special Issue Advances in Fish Genome and Transcriptomes)

Abstract

:
The Mexican pike silverside (Chirostoma estor) is a zooplanktivorous, agastric short-intestined species, and it has been found that increased-frequency feeding (twelve feedings a day) improved feed efficiency and promoted growth by 70%. This work determined the effect of different juvenile feeding frequencies upon the C. estor liver transcriptome. The level of the expression of appetite-regulating peptides was analyzed in silico to understand the mechanisms involved in appetite control in this species. Differential expression analysis showed that up-regulated genes between treatments were related to metabolism, digestive processes, immune system response, apoptosis, growth, and oxidative stress. This information explains the better performance of pike silverside fed 12 times daily. Appetite regulatory peptides were identified for the first time in the liver of C. estor in response to high feeding frequencies, contributing to the general knowledge of the roles of each family of neuropeptides in this agastric, short-intestined fish. The information presented here emphasizes the need to explore further the complex physiological processes involved in appetite regulation in C. estor. Additionally, it will serve as a basis for more specific targeted studies of appetite control to elucidate the mechanisms behind this process.
Key Contribution: This study contributes to understanding the effects of different feeding frequencies in the Chirostoma estor liver transcriptome. Appetite regulatory peptides were identified for the first time in this species in response to high feeding frequencies; elucidating the mechanisms behind appetite control.

1. Introduction

The Mexican pike silverside (Chirostoma estor) is a zooplanktivorous organism that lacks a stomach (agastric) and has a short intestine (<1 RIL, relative intestinal length) throughout its life cycle, requiring frequent feeding [1,2]. To our knowledge, no fish species currently in commercial aquaculture share these unique characteristics of C. estor. The digestive configuration of adult pike silverside is comparable to that of fish larvae [3], highlighting its relevance as a promising model that could improve specific larval feeding requirements in this and other fish species.
In this context, a recent study analyzed the effect of three feeding frequencies (FF; 4, 8, and 12 times a day) on the performance of C. estor juveniles in terms of growth, feeding efficiency, and survival. Although no difference was observed in total feed consumption and survival between treatments, a feeding frequency of 12 times per day presented a better food conversion ratio, protein efficiency, and higher growth (70% more than the FF4) [2]. However, the implications of feeding frequency at the global gene expression level are necessary to understand the performance observed in these organisms. Omic sciences, particularly nutrigenomics, provide valuable tools for determining the effect of different feeding frequencies on the expression of genes and the physiological signaling pathways.
It is also interesting to evaluate the effect of this feeding regimen (12 feedings per day) on appetite regulation of C. estor since no other fish in culture presents this feeding frequency. Appetite regulation requires stimulation through positive hormonal regulation of orexigenic peptides and negative hormonal regulation of anorexigenic peptides [4,5]. To date, various studies have been conducted on appetite control in different species of fish, such as zebrafish, goldfish, carp, and fugu puffer, among other species [4,5,6], finding different results in terms of appetite-regulating peptide expression due, in part, to the physiological characteristics and habits of each species [7,8]. As mentioned earlier, the Mexican pike silverside (C. estor) has an unusual digestive configuration, requiring continuous feeding. Investigating appetite regulation in the Mexican pike silverside can provide crucial information to optimize feeding practices and improve aquaculture production sustainably and efficiency in this and other fish species with similar characteristics.
This work, therefore, aimed to evaluate the effect of different feeding frequencies on the liver transcriptome of C. estor juveniles. Furthermore, the expression levels of orexigenic (appetite stimulators) and anorexigenic (appetite inhibitors) genes were analyzed in silico to understand their importance and the mechanisms involved in their regulation in this biological model with high aquaculture potential.

2. Materials and Methods

2.1. Experimental Samples

Samples were obtained from the experiment performed by [2] in the aquaculture biotechnology laboratory LANMDA-IIAF (Universidad Michoacana de San Nicolás de Hidalgo), where pike silverside (C. estor) juveniles were fed at three different feeding frequencies (FF) (4, 8, and 12 times a day, named FF4, FF8, and FF12, respectively). Six livers were randomly collected for each treatment and preserved in RNAlater® Tissue Collection Solution (Invitrogen, Thermo Fisher Scientific, Waltham, MA, USA) until RNA extraction.

2.2. RNA-seq and Bioinformatics Analysis

RNA extraction and high-throughput sequencing (RNA-Seq) were performed at the Omega Bioservices Laboratory (Norcross, GA, USA). The RNA of each sample was evaluated with an Agilent NanoDrop RNA Chip Bioanalyzer (Norcross, GA, USA). RNA was reported to be high quality (RIN values between 7.2 and 8.9). An RNA-seq library was prepared for each sample using the NEBNext Ultra II with Poly-A Selection kit from Illumina (Norcross, GA, USA) through a HiSeq platform (4000/X-Ten) using the sequencing-by-synthesis (SBS) method. The reading type was “paired-end” using 2 × 150 chemistry, with an expected throughput of 10 million readings per library.
Quality control for high-throughput sequence data was performed with the fastqc software version 0.12.1 (https://www.bioinformatics.babraham.ac.uk/projects/fastqc/; accessed on 15 December 2022). This analysis was of optimal quality, and there was no evidence of adapters. De novo transcriptome assembly was conducted using Trinity v 2.6.6 software [9]. RSEM (v1.3.3) was used to construct the abundance matrix with raw counts that were the input to the differential expression process [10]. A total of 232,570 transcripts, ranging from 200 bp to 11,800 bp, were obtained. These 232,570 transcripts corresponded to the various isoforms of 114,528 genes. After fine-tuning transcription, the number of genes was reduced to 25,889.

2.3. Differential Expression Analysis

Differential gene expression analysis was conducted using the IDEAMEX website (Integrated Differential Expression Analysis MultiEXperiment, http://www.uusmb.unam.mx/ideamex/; accessed on 16 August 2023) [11]. Four methods were employed (DESeq2, EdgeR, NOISeq and limma), and the results of the DESeq2 method were selected as the most closely aligned with the results of the other methods. A differential expression analysis was conducted on results from the three experimental conditions (FF4, FF8, and FF12). The analysis was conducted on genes with a p-value Adj less than 0.05 and a Log Fold-Change of at least 1. A Multidimensional Scaling plot (MDS) was constructed to analyze variation among the replicates and samples (Figure S1).
Subsequently, enrichment analysis was performed regarding Gene Ontology (GO) to identify the biological processes, molecular functions, and cellular components in which each gene is involved. The relevant biological processes and the differential expressed genes (DEGs) participating in each process were identified.

2.4. Appetite-Regulating Peptide Expression

A bibliographic search was conducted where orexigenic (appetite stimulation) and anorexigenic (appetite inhibition) peptides previously reported in fish were selected [4,5,12,13,14,15] (Table S1).
Subsequently, the search strategy was directed to the annotation report generated through bioinformatic processing when de novo transcriptome assembly was performed. The annotation report was generated through Trinotate (https://github.com/Trinotate/Trinotate.github.io/wiki; accessed on 12 January 2023), which generates a functional annotation of the assembled transcripts. In the annotation report, it was possible to identify the presence/absence of transcripts/genes involved in regulating appetite. The expression levels of the respective peptides identified in the annotation report were analyzed using transcript abundance count matrices and the software and bioinformatics packages available for this purpose (Integrated Differential Expression Analysis MultiEXperiment, http://www.uusmb.unam.mx/ideamex/; accessed on 16 January 2024) [11].

3. Results

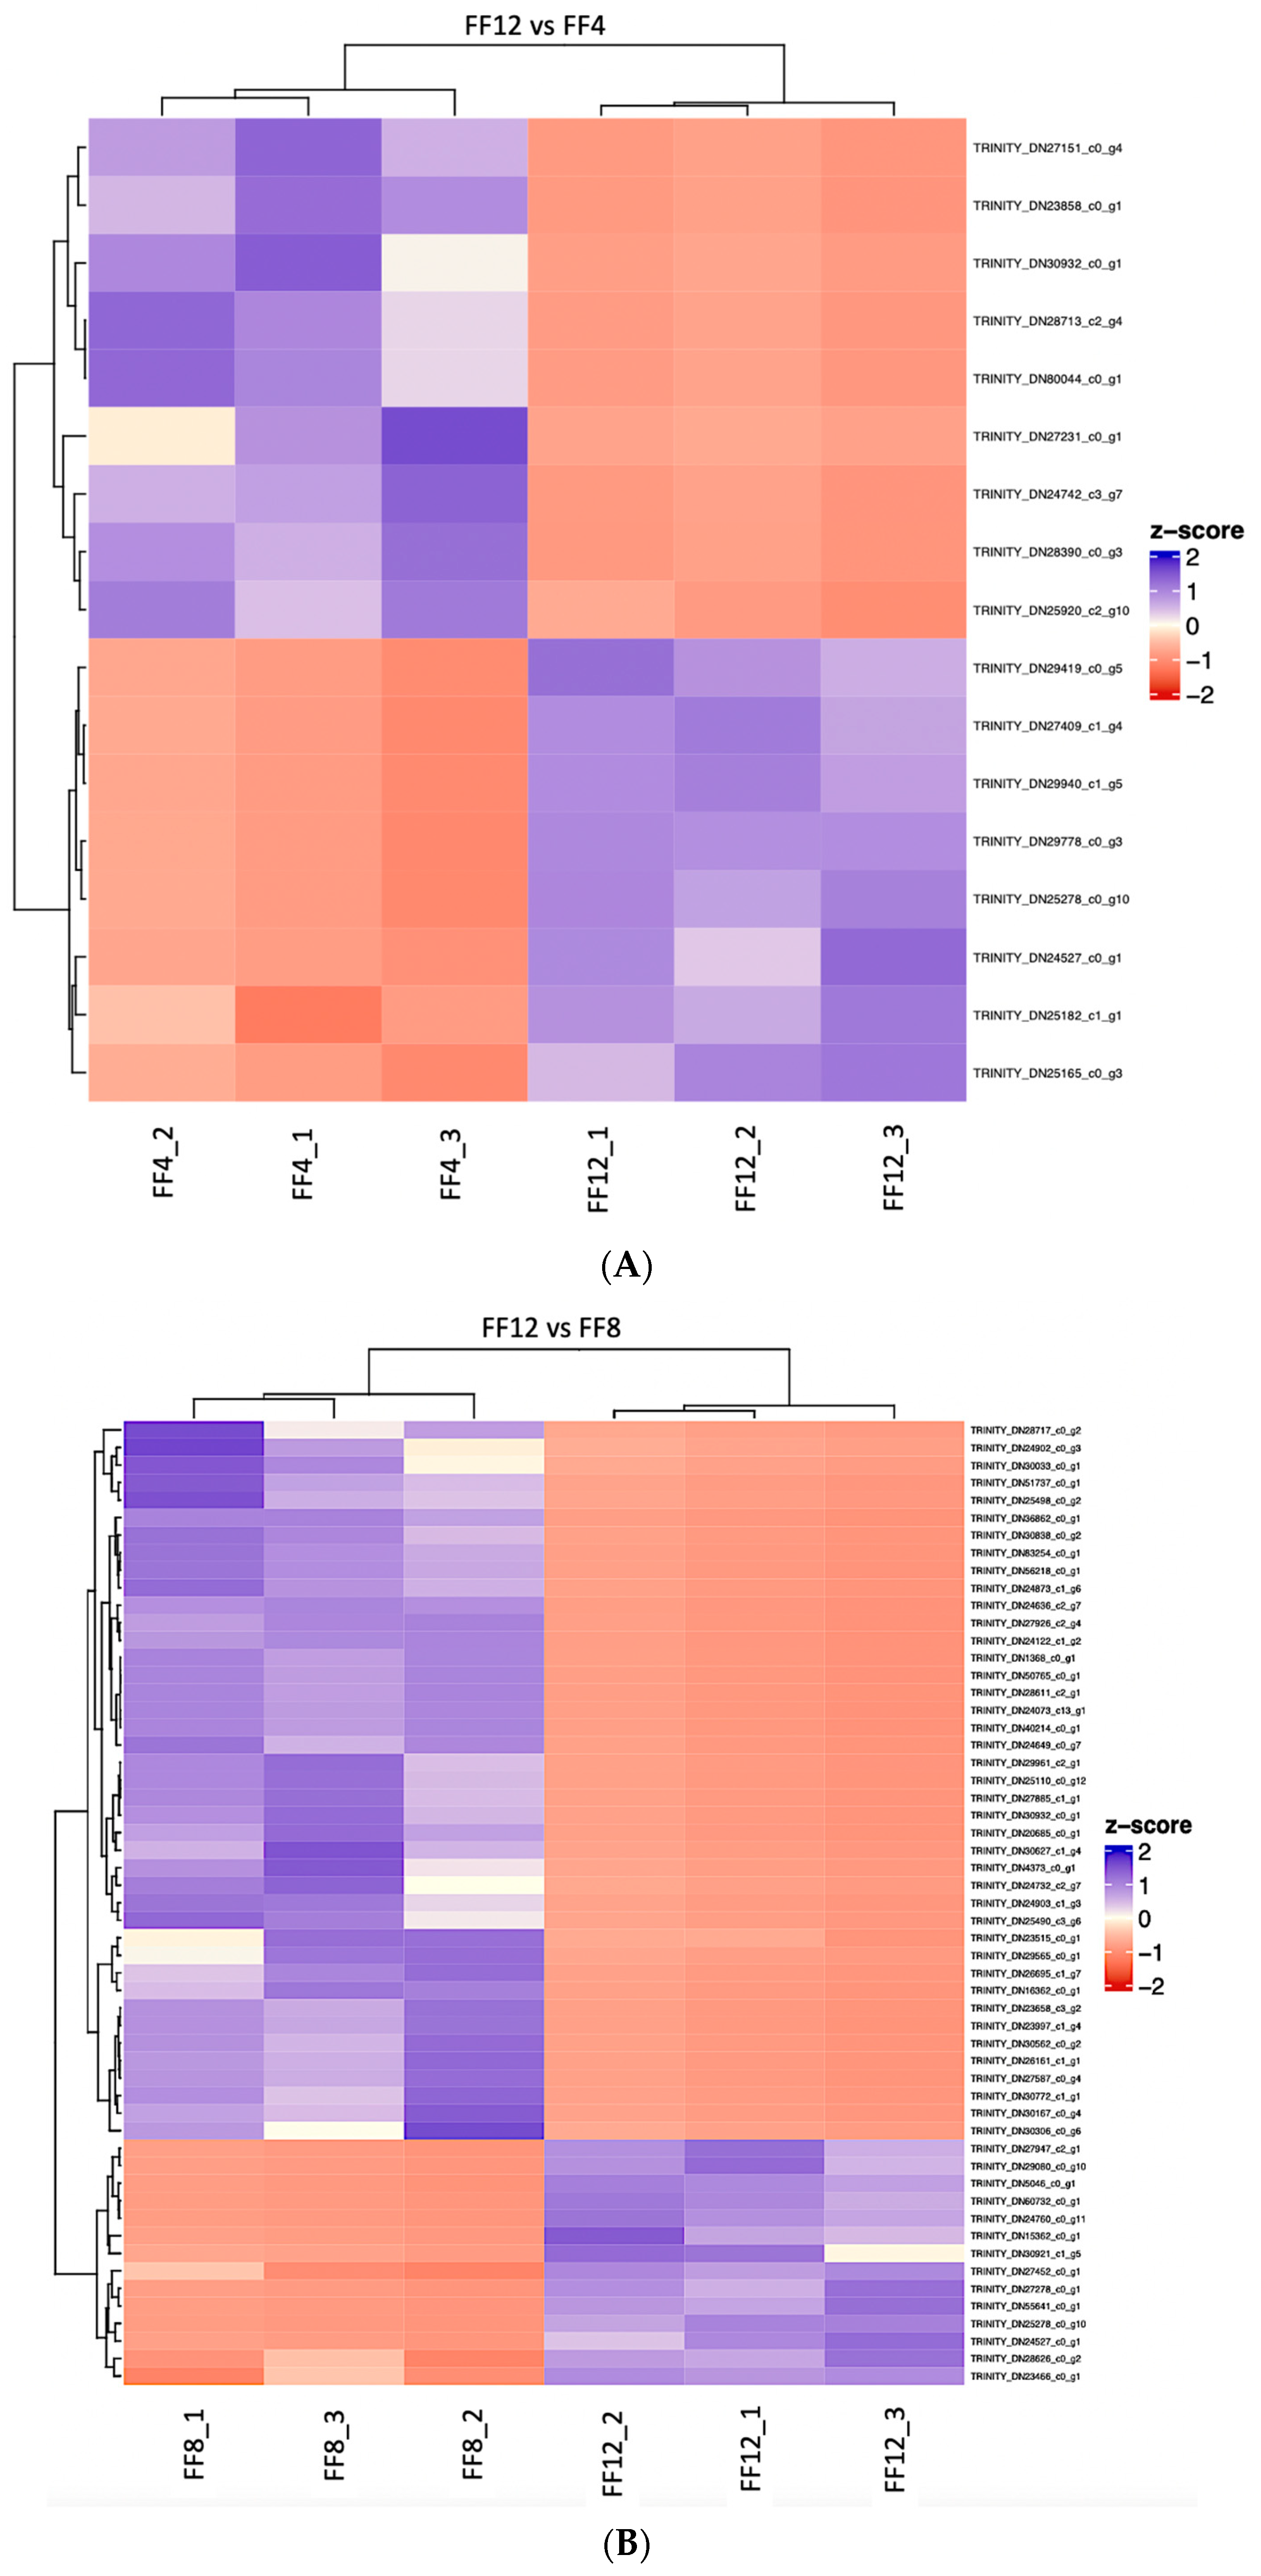
3.1. Differential Expression

As reported by [2], a feeding frequency of 12 times a day (FF12) showed better food conversion ratio and protein efficiency ratio, in addition to significantly higher growth (70%) compared to the group fed 4 times a day (FF4), demonstrating that FF12 is a better feeding frequency for C. estor. Therefore, this study evaluated the effect of the different feeding frequencies tested in [2] by high throughput in the liver of C. estor juveniles.
Seventeen DEGs were obtained between the FF12 and FF4 treatments, but only three were annotated. Fifty-five DEGs were found in the FF8 and FF4 treatments, of which only 14 were found in the annotation report. Finally, 111 DEGs were identified between the FF12 and FF8; however, only 26 were annotated (Figure 1).
The differential expression analysis of the annotated genes showed the up-regulated and down-regulated genes between treatments, associated with metabolic and digestive processes, immune system response, apoptosis, growth, and oxidative stress (Table 1).
The biological processes were identified based on the enrichment in GO terms (Figure 2), where processes such as cellular response to potassium ion and protein heterotrimerization for FF12 vs. FF4, cellular response to peptide and apoptotic process for FF8 vs. FF4, and response to food and digestive system development for FF12 vs. FF8 were found.

3.2. Appetite Regulating Peptide Expression

Due to the performance results in terms of growth and differential expression of genes for C. estor, a targeted in silico search focused on the identification of appetite-regulating peptides and their receptors was performed between the treatment with the lowest feeding frequency (FF4) and the treatment with the highest feeding frequency (FF12) (Table 2 and Table 3).
The liver expression of orexigenic and anorexigenic peptides was identified. Some appetite peptides showed a typical feedback expression with their respective receptors, as in the case of apelin and cholecystokinin, which showed up-regulation in FF12. In contrast, their receptors were down-regulated in the same treatment. In some cases, only peptide receptors or their precursors were identified for some appetite-regulating peptides, such as neuropeptide Y, the glucagon-like peptide, and tachykinins.
Among the orexigenic peptides that showed differences in the regulation of their expression were apelin, galanin, agouti-related protein, and neuropeptide Y. However, their expression was not proportionate to feeding frequency. In the case of anorexigenic peptides, those that showed differences in the regulation of their expression were cholecystokinin, neuromedin-B, the glucagon-like peptide 2 receptor, and protachykinin, all of which were up-regulated in the FF4 treatment.
Some orexigenic and anorexigenic genes, such as ghrelin, orexin, secretoneurin, melanocyte-stimulating hormone, leptin, spexin, amylin, pro-opiomelanocortin, and cocaine- and amphetamine-regulated transcripts, were not found in the annotation report or did not show expression in the sequenced transcriptome of the livers of C. estor under different feeding frequencies.

4. Discussion

An adequate feeding frequency is essential for fish to achieve optimal growth, feed efficiency, high survival, avoid deformities, and reduce waste and production costs [16]. The feeding frequency strategy can vary depending on the feeding habits and the digestive system structure. Chirostoma estor is an agastric species with a short intestine that requires a higher feeding frequency to reach optimal growth levels [2].
In this work, the effect of different feeding frequencies on gene expression was determined by sequencing the liver transcriptome of C. estor juveniles. The liver is one of the most sensitive tissue to food intake, composition, and timing [17], and it can be regulated by different food-related peptides involved in energy balance [18]. The differential expression analysis and the GO term enrichment showed that up-regulated genes between treatments were related to metabolic and digestive processes, immune system response, apoptosis, and oxidative stress (Table 1). On a global level, only specific genes linked to cell growth exhibited differential expression across treatments (Table 1). The latter is most likely attributable to the cutoff threshold (Log Fold-Change ≥ 1) and the nature of the genes highly expressed in every cell, masking specific target genes related to growth.
In C. estor, the expression of digestive enzymes was increased, mainly from the chymotrypsin family, which promoted the digestive process through proteolysis when the feeding frequency was 12 times a day (FF12), compared to the fish that were fed 8 times a day (FF8). The latter could have favored the assimilation of nutrients and, therefore, resulted in better performance, since it is known that the growth of fish is linked to their digestive and absorption capacity [19,20]. However, although the correlation between feeding frequency and digestive and absorption capacities in fish is limited, research indicates that feeding frequency might affect fish growth by altering digestive capability [21,22].
Feeding frequency (FF) improves growth performance and immunity; however, the optimal FF to produce an immune response can vary between species. In the case of C. estor, only significantly down-regulated genes that participate in the immune response process were found between FF8 and FF4 (intermediate and low feeding frequencies, respectively), which could indicate an indirect correlation between feeding frequency and immune responses [23,24,25,26].
It is interesting to evaluate the effect of a feeding regimen of 12 times a day on the appetite regulation of C. estor since, to our knowledge, no other fish in culture presents this feeding frequency. As it was not possible to visualize the appetite-regulating peptides and their respective roles in this short-intestined agastric fish at a global level of expression (Log Fold-Change ≥ 1 and p-value ≤ 0.05); an in-depth in silico analysis targeting specific appetite-regulating genes was performed to assess their expression level between the FF treatments and their potential relevance.
Food intake requires appetite stimulation through orexigenic factors and inhibition through anorexigenic factors [4,5]. These factors are produced and interact between the central nervous system (hypothalamus) and peripheral target tissues (such as the intestine and the liver) [4,27]. Given the critical role of these tissues in food intake, energy metabolism, and appetite regulation [28], it could be relevant to evaluate them under different feeding conditions.
In this work, the orexigenic peptides differentially expressed between FF4 and FF12 were apelin, galanin, agouti-related protein, and neuropeptide Y (NPY). Although the expression of these peptides was not associated with feeding frequency in both treatments, some crucial aspects can be highlighted. NPY is classified as a potent orexigenic peptide, known to be secreted mainly by neurosecretory cells of the hypothalamus in response to starvation [29,30]. Still, it has also been shown to be expressed in many tissues, including the liver of several teleosts [31,32]. On the other hand, seven types of NPY receptors have been identified. The Y1 receptor-signaling pathway of NPY is known to stimulate food intake in teleost fishes such as goldfish (Carassius auratus) and zebrafish (Danio rerio) [32,33]. This could be the case in this study, as it has also been detected in the liver previously in other teleosts [34,35]. However, its association with appetite neuroendocrine control remains to be confirmed.
Apelin is a recently discovered orexigenic peptide in several fish tissues [28], including the liver [36,37,38]. The known receptor for apelin is the APJ receptor, with two different receptor forms, APJa and APJb, both found in the present work, showing opposite regulation in the different feeding frequency treatments. This receptor’s dynamics is interesting since research has found discrepancies between their roles, arguing that possibly for some species, one of these receptors is involved in long-term feeding effects (APJa) and the other in short-term feeding effects (APJb) [39].
The agouti-related protein is predominantly expressed in the brain in the hypothalamic ventrobasal tuberal nucleus [40]; however, its expression has also been demonstrated in multiple tissues (including the liver) and fish species. The agouti-related protein orexigenic action has been studied in several fish, where its regulation (up- or down-regulation) under different fasting conditions has been found [41,42,43,44]. In this work, the expression of this orexigenic peptide was up-regulated in the group of fish with the highest feeding frequency (FF12) and down-regulated in the group fed fewer times per day (FF4). It is hypothesized that in this study [2], brief but frequent meals (FF12) could account for up-regulated agouti-related protein levels. In contrast, less-frequent but higher-quantity meals (FF4) could maintain satiation longer in fish, reflecting the down-regulated agouti-related protein. However, because fasting conditions differ across studies, the extrapolation of this hypothesis is limited.
Although CCK is highly expressed in different gut and brain regions, it has been detected in various other tissues. However, its expression in the liver is null or very low [37,38,45,46]. The fact that CCK is expressed in the liver of C. estor, makes it interesting to pursue its role in this tissue and the intestine, as it may be essential in regulating food intake in this agastric species.
Other orexigenic and anorexigenic genes did not appear to be expressed in C. estor liver. This was the case with ghrelin, orexin, secretoneurin, the melanocyte-stimulating hormone, leptin, spexin, amylin, pro-opiomelanocortin, and cocaine- and amphetamine-regulated transcript, among others. The latter could perhaps be explained by the target tissue analyzed.
Some peptides showed typical feedback between their receptors, as seen in the case of apelin (Table 2). However, the information generated on appetite-regulating peptides is limited; even less is known about the receptor-ligand interaction and their activation of signaling pathways. This information can become more complex due to the various receptor isoforms since it is known that some modulate short-term food intake and others modulate long-term intake. However, it is unknown whether these isoforms are coexpressed simultaneously [47]. In addition, some receptors and their isoforms are not specific to a single peptide but can also be activated by other ligands [48].
The great biological variability between the different fish species, their feeding habits, their digestive configuration, and the techniques and methodological tools used, among other aspects [7], contribute to the generation of diverse results, making it difficult to compare the results of studies on the neuroendocrine appetite regulation in fish. Therefore, further directed studies are required where factors such as the specific culture conditions for each species, the age or reproductive stage, and the sex of the organisms must be considered. It is also essential to consider the feeding and sampling time, the tissue to be analyzed, and the possible co-expression between the appetite-regulating peptides in such a way that the information obtained can establish the basis for studies of appetite control in each particular species, whose behavior could be very different from other fish species.
The sampling of the organisms of the present investigation was carried out at the end of the experiment (a 45-day feeding trial), when all fish had fasted for 12 h, which could have caused a bias in the results, since the expression of appetite-regulating peptides and their receptors can vary greatly depending on the energy status due to the dietary condition [12,49] and the time of day when the sample was taken, since some investigations indicate the existence of daily circadian rhythms of appetite-regulating peptides, among other effects of external signals [7,8,50].
Fasting generally upregulates orexigenic factors and downregulates anorexigenic factors in teleosts [28]. However, other species have shown no effect of fasting on gene expression [51,52,53,54] or increased mRNA levels, depending on the time of fasting [29], suggesting species-specific regulation.
This work describes for the first time the appetite regulatory peptides in an agastric, short-intestined model system (C. estor) using high-throughput techniques such as RNA-seq to contribute to the general knowledge of the roles of each family of neuropeptides in this model. The information presented here emphasizes the need to further explore the complex physiological processes involved in appetite regulation in C. estor. However, it will serve as a basis for more specific targeted studies on food regulation, considering the many intrinsic and extrinsic factors that influence such regulation.

5. Conclusions

Though total daily feed consumption was not different between treatments, feeding frequency (FF) alone affected global liver gene expression.
The metabolic, digestive, immune system, apoptosis, growth, and oxidative stress responses support the growth performance observed in Chirostoma estor fed 12 times daily.
Genes associated with appetite regulation were identified for the first time in the liver of an agastric, short-intestined fish (C. estor) in response to feeding frequencies.

Supplementary Materials

The following supporting information can be downloaded at: https://www.mdpi.com/article/10.3390/fishes9100393/s1, Table S1: Some appetite-regulating peptides reported in some fish species; Figure S1: Multidimensional Scaling plot (MDS) showing variation among the replicates and samples of treatments. FF12: C. estor juveniles fed 12 times a day. FF8: C. estor juveniles fed 8 times a day. FF4: C. estor juveniles fed 4 times a day.

Author Contributions

Conceptualization, P.N.-R. and C.C.M.-C.; methodology, M.E.J.-G. and C.Y.G.-F.; software, M.E.J.-G. and V.J.-J.; validation, P.N.-R. and M.E.J.-G.; formal analysis, M.E.J.-G., C.Y.G.-F. and V.J.-J.; investigation, P.N.-R., C.C.M.-C. and M.E.J.-G.; resources, C.A.M.-P.; data curation, M.E.J.-G., C.Y.G.-F., V.J.-J. and M.G.R.-D.; writing—original draft preparation, M.E.J.-G. and P.N.-R.; writing—review and editing, M.E.J.-G., P.N.-R., C.C.M.-C., M.G.R.-D., C.A.M.-P., C.Y.G.-F. and V.J.-J.; visualization, M.E.J.-G. and C.C.M.-C.; supervision, P.N.-R.; project administration, P.N.-R. and C.A.M.-P.; funding acquisition, C.A.M.-P. All authors have read and agreed to the published version of the manuscript.

Funding

Consejo Nacional de Humanidades, Ciencias y Tecnologías (CONAHCYT scholarship 842472 provided to M.E.J-G) and Coordinación de la Investigación Científica—Universidad Michoacana de San Nicolás de Hidalgo (CIC2022-2023).

Institutional Review Board Statement

Not applicable. All this work was performed in silico.

Informed Consent Statement

Not applicable.

Data Availability Statement

The datasets generated for this study can be found in the GenBank accession no. PRJNA1151084.

Acknowledgments

We thank Biol. Jesús López García, M. I. Sibila Concha Santos, and IBQ. Lucia Leal Cortés for technical assistance.

Conflicts of Interest

The authors declare no conflicts of interest.

References

  1. Ross, L.G.; Martínez-Palacios, C.A.; Aguilar Valdez, M.d.C.; Beveridge, C.M.; Chávez Sánchez, M.C. Determination of feeding mode in fish: The importance of using structural and functional feeding studies in conjunction with gut analysis in a selective zooplanktivore Chirostoma estor Jordan 1880. J. Fish Biol. 2006, 68, 1782–1794. [Google Scholar] [CrossRef]
  2. Melo, N.; Moreira-Konig, I.F.; Ríos-Durán, M.G.; Navarrete-Ramírez, P.; Martínez-Palacios, C.A.; Solis-Murgas, L.D.; Martínez-Chavez, C.C. Feeding frequency has a determinant role in growth performance, skeletal deformities, and body composition in the Mexican pike silverside (Chirostoma estor), an agastric short-intestine fish (Teleostei: Atheriniformes). Aquaculture 2022, 562, 738766. [Google Scholar] [CrossRef]
  3. Rønnestad, I.; Yúfera, M.; Ueberschär, B.; Ribeiro, L.; Sæle, Ø.; Boglione, C. Feeding behaviour and digestive physiology in larval fish: Current knowledge, and gaps and bottlenecks in research. Rev. Aquacult. 2013, 5, S59–S98. [Google Scholar] [CrossRef]
  4. Volkoff, H.; Canosa, L.F.; Unniappan, S.; Cerdá-Reverter, J.M.; Bernier, N.J.; Kelly, S.P.; Peter, R.E. Neuropeptides and the control of food intake in fish. Gen. Comp. Endocrinol. 2005, 142, 3–19. [Google Scholar] [CrossRef] [PubMed]
  5. Rønnestad, I.; Gomes, A.S.; Murashita, K.; Angotzi, R.; Jönsson, E.; Volkoff, H. Appetite-Controlling endocrine systems in teleosts. Front. Endocrinol. 2017, 8, 73. [Google Scholar] [CrossRef]
  6. Volkoff, H. The neuroendocrine regulation of food intake in fish: A review of current knowledge. Front. Neurosci. 2016, 10, 540. [Google Scholar] [CrossRef] [PubMed]
  7. Hoskins, L.J.; Volkoff, H. The comparative endocrinology of feeding in fish: Insights and challenges. Gen. Comp. Endocrinol. 2012, 176, 327–335. [Google Scholar] [CrossRef]
  8. Volkoff, H. The effects of environmental changes on the endocrine regulation of feeding in fishes. Phil. Trans. R. Soc. B 2024, 379, 20220503. [Google Scholar] [CrossRef] [PubMed]
  9. Haas, B.J.; Papanicolaou, A.; Yassour, M.; Grabherr, M.; Blood, P.D.; Bowden, J.; Couger, M.B.; Eccles, D.; Li, B.; Lieber, M.; et al. De novo transcript sequence reconstruction from RNA-seq using the Trinity platform for reference generation and analysis. Nat. Protoc. 2013, 8, 1494–1512. [Google Scholar] [CrossRef] [PubMed]
  10. Li, B.; Dewey, C.N. RSEM: Accurate transcript quantification from RNA-Seq data with or without a reference genome. BMC Bioinform. 2011, 12, 323. [Google Scholar] [CrossRef]
  11. Jiménez-Jacinto, V.; Sanchez-Flores, A.; Vega-Alvarado, L. Integrative differential expression analysis for multiple experiments (IDEAMEX): A web server tool for integrated RNA-Seq data analysis. Front. Genet. 2019, 10, 279. [Google Scholar] [CrossRef]
  12. Volkoff, H.; Peter, R.E. Feeding behavior of fish and its control. Zebrafish 2006, 3, 131–140. [Google Scholar] [CrossRef] [PubMed]
  13. Volkoff, H.; Hoskins, L.J.; Tuziak, S.M. Influence of intrinsic signals and environmental cues on the endocrine control of feeding in fish: Potential application in aquaculture. Gen. Comp. Endocrinol. 2010, 167, 352–359. [Google Scholar] [CrossRef] [PubMed]
  14. Delgado, M.J.; Cerdá-Reverter, J.M.; Soengas, J.L. Hypothalamic integration of metabolic, endocrine, and circadian signals in fish: Involvement in the control of food intake. Front. Neurosci. 2017, 11, 354. [Google Scholar] [CrossRef]
  15. Bertucci, J.I.; Blanco, A.M.; Sundarrajan, L.; Rajeswari, J.J.; Velasco, C.; Unniappan, S. Nutrient regulation of endocrine factors influencing feeding and growth in fish. Front. Endocrinol. 2019, 10, 83. [Google Scholar] [CrossRef] [PubMed]
  16. Abdel-Aziz, M.F.A.; Hassan, H.U.; Yones, A.M.; Abdel-Tawwab, Y.A.; Metwalli, A.T. Assessing the effect of different feeding frequencies combined with stocking density, initial weight, and dietary protein ratio on the growth performance of tilapia, catfish, and carp. Sci. Afr. 2021, 12, e00806. [Google Scholar] [CrossRef]
  17. Paredes, J.F.; López-Olmeda, J.F.; Martínez, F.J.; Sánchez-Vázquez, F.J. Daily rhythms of lipid metabolic gene expression in zebrafish liver: Response to light/dark and feeding cycles. Chronobiol. Int. 2015, 32, 1438–1448. [Google Scholar] [CrossRef]
  18. Isorna, E.; de Pedro, N.; Valenciano, A.I.; Alonso-Gómez, Á.L.; Delgado, M.J. Interplay between the endocrine and circadian systems in fishes. J. Endocrinol. 2017, 232, R141–R159. [Google Scholar] [CrossRef] [PubMed]
  19. Hakim, Y.; Uni, Z.; Hulata, G.; Harpaz, S. Relationship between intestinal brush border enzymatic activity and growth rate in tilapias fed diets containing 30% or 48% protein. Aquaculture 2006, 257, 420–428. [Google Scholar] [CrossRef]
  20. Perez-Casanova, J.C.; Murray, H.M.; Gallant, J.W.; Ross, N.W.; Douglas, S.; Johnson, S.C. Development of the digestive capacity in larvae of haddock (Melanogrammus aeglefinus) and Atlantic cod (Gadus morhua). Aquaculture 2006, 251, 377–401. [Google Scholar] [CrossRef]
  21. Xie, F.; Ai, Q.; Mai, K.; Xu, W.; Ma, H. The optimal feeding frequency of large yellow croaker (Pseudosciaena crocea, Richardson) larvae. Aquaculture 2011, 311, 162–167. [Google Scholar] [CrossRef]
  22. Tian, H.Y.; Zhang, D.D.; Li, X.F.; Zhang, C.N.; Qian, Y.; Liu, W.B. Optimum feeding frequency of juvenile blunt snout bream Megalobrama amblycephala. Aquaculture 2015, 437, 60–66. [Google Scholar] [CrossRef]
  23. Garcia, J.A.; Villarroel, M. Effect of feed type and feeding frequency on macrophage functions in tilapia (Oreochromis niloticus L.). Fish. Shellfish. Immunol. 2009, 27, 325–329. [Google Scholar] [CrossRef] [PubMed]
  24. Li, X.F.; Tian, H.Y.; Zhang, D.D.; Jiang, G.Z.; Liu, W.B. Feeding frequency affects stress, innate immunity and disease resistance of juvenile blunt snout bream Megalobrama amblycephala. Fish. Shellfish. Immunol. 2014, 38, 80–87. [Google Scholar] [CrossRef] [PubMed]
  25. Ding, Z.; Kong, Y.; Zhang, Y.; Li, J.; Cao, F.; Zhou, J.; Ye, J. Effect of feeding frequency on growth, body composition, antioxidant status and mRNA expression of immunodependent genes before or after ammonia-N stress in juvenile oriental river prawn, Macrobrachium nipponense. Fish. Shellfish. Immunol. 2017, 68, 428–434. [Google Scholar] [CrossRef] [PubMed]
  26. Edholm, E.S.; Pasquier, L.D. Major histocompatibility complex (MHC) in fish. In Principles of Fish Immunology: From Cells and Molecules to Host Protection; Buchmann, K., Secombes, C.J., Eds.; Springer: Berlin/Heidelberg, Germany, 2022; pp. 355–386. [Google Scholar]
  27. Augustine, V.; Lee, S.; Oka, Y. Neural control and modulation of thirst, sodium appetite, and hunger. Cell 2020, 180, 25–32. [Google Scholar] [CrossRef] [PubMed]
  28. Assan, D.; Huang, Y.; Mustapha, U.F.; Addah, M.N.; Li, G.; Chen, H. Fish feed intake, feeding behavior, and the physiological response of apelin to fasting and refeeding. Front. Endocrinol. 2021, 12, 798903. [Google Scholar] [CrossRef] [PubMed]
  29. Cerdá-Reverter, J.M.; Larhammar, D. Neuropeptide Y family of peptides: Structure, anatomical expression, function, and molecular evolution. Biochem. Cell. Biol. 2000, 78, 371–392. [Google Scholar] [CrossRef] [PubMed]
  30. López-Patiño, M.A.; Guijarro, A.I.; Isorna, E.; Delgado, M.J.; Alonso-Bedate, M.; de Pedro, N. Neuropeptide Y has a stimulatory action on feeding behavior in goldfish (Carassius auratus). Eur. J. Pharmacol. 1999, 377, 147–153. [Google Scholar] [CrossRef] [PubMed]
  31. Zhou, Y.; Liang, X.F.; Yuan, X.; Li, J.; He, Y.; Fang, L.; Guo, X.; Liu, L.; Li, B.; Shen, D. Neuropeptide Y stimulates food intake and regulates metabolism in grass carp, Ctenopharyngodon idellus. Aquaculture 2013, 380–383, 52–61. [Google Scholar] [CrossRef]
  32. Assan, D.; Mustapha, U.F.; Chen, H.; Li, Z.; Peng, Y.; Li, G. The roles of neuropeptide Y (Npy) and peptide YY (Pyy) in teleost food intake: A mini review. Life 2021, 11, 547. [Google Scholar] [CrossRef] [PubMed]
  33. Mercer, R.E.; Chee, M.J.S.; Colmers, W.F. The role of NPY in hypothalamic mediated food intake. Front. Neuroendocrinol. 2011, 32, 398–415. [Google Scholar] [CrossRef] [PubMed]
  34. Larson, E.T.; Fredriksson, R.; Johansson, S.R.T.; Larhammar, D. Cloning, pharmacology, and distribution of the neuropeptide Y-receptor Yb in rainbow trout. Peptides 2003, 24, 385–395. [Google Scholar] [CrossRef] [PubMed]
  35. Salaneck, E.; Fredriksson, R.; Larson, E.T.; Conlon, J.M.; Larhammar, D. A neuropeptide Y receptor Y1-subfamily gene from an agnathan, the European river lamprey. A potential ancestral gene. Eur. J. Biochem. 2001, 268, 6146–6154. [Google Scholar] [CrossRef] [PubMed]
  36. Volkoff, H.; Wyatt, J. Apelin in goldfish (Carassius auratus): Cloning, distribution and role in appetite regulation. Peptides 2009, 30, 1434–1440. [Google Scholar] [CrossRef] [PubMed]
  37. Hayes, J.; Volkoff, H. Characterization of the endocrine, digestive and morphological adjustments of the intestine in response to food deprivation and torpor in cunner, Tautogolabrus adspersus. Comp. Biochem. Physiol. A Mol. Integr. Physiol. 2014, 170, 46–59. [Google Scholar] [CrossRef]
  38. Volkoff, H. Cloning and tissue distribution of appetite-regulating peptides in pirapitinga (Piaractus brachypomus). J. Anim. Physiol. Anim. Nutr. 2015, 99, 987–1001. [Google Scholar] [CrossRef]
  39. Yan, X.; Qin, C.; Deng, D.; Yang, G.; Feng, J.; Lu, R.; Yang, L.; Meng, X.; Cao, X.; Nie, G.; et al. Apelin and apj in common carp (Cyprinus carpio L.): Molecular characterization, tissue expression and responses to periprandial changes and fasting–refeeding. Aquac. Res. 2019, 51, 1012–1025. [Google Scholar] [CrossRef]
  40. Agulleiro, M.J.; Cortés, R.; Leal, E.; Ríos, D.; Sánchez, E.; Cerdá-Reverter, J.M. Characterization, tissue distribution and regulation by fasting of the agouti family of peptides in the sea bass (Dicentrarchus labrax). Gen. Comp. Endocrinol. 2014, 205, 251–259. [Google Scholar] [CrossRef]
  41. Kurokawa, T.; Murashita, K.; Uji, S. Characterization and tissue distribution of multiple agouti-family genes in pufferfish, Takifugu rubripes. Peptides 2006, 27, 3165–3175. [Google Scholar] [CrossRef]
  42. Murashita, K.; Kurokawa, T.; Ebbesson, L.O.E.; Stefansson, S.O.; Rønnestad, I. Characterization, tissue distribution, and regulation of agouti-related protein (AgRP), cocaine- and amphetamine-regulated transcript (CART) and neuropeptide Y (NPY) in Atlantic salmon (Salmo salar). Gen. Comp. Endocrinol. 2009, 162, 160–171. [Google Scholar] [CrossRef] [PubMed]
  43. Wei, R.B.; Yuan, D.Y.; Wang, T.; Zhou, C.W.; Lin, F.J.; Chen, H.; Wu, H.W.; Yang, S.Y.; Wang, Y.; Liu, J.; et al. Characterization, tissue distribution and regulation of agouti-related protein (AgRP) in a cyprinid fish (Schizothorax prenanti). Gene 2013, 527, 193–200. [Google Scholar] [CrossRef] [PubMed]
  44. Sun, S.; Su, Y.; Pan, F.; Ge, X. Molecular cloning of AGRP and NPY and their expression analysis during fasting and refeeding in juvenile blunt snout bream (Megalobrama amblycephala). J. Fish. China 2020, 44, 1777–1791. [Google Scholar] [CrossRef]
  45. Feng, K.; Zhang, G.; Wei, K.; Xiong, B.; Liang, T.; Ping, H. Molecular characterization of cholecystokinin in grass carp (Ctenopharyngodon idellus): Cloning, localization, developmental profile, and effect of fasting and refeeding on expression in the brain and intestine. Fish. Physiol. Biochem. 2012, 38, 1825–1834. [Google Scholar] [CrossRef] [PubMed]
  46. Yuan, D.; Wang, T.; Zhou, C.; Lin, F.; Chen, H.; Wu, H.; Wei, R.; Xin, Z.; Li, Z. Leptin and cholecystokinin in Schizothorax prenanti: Molecular cloning, tissue expression, and mRNA expression responses to periprandial changes and fasting. Gen. Comp. Endocrinol. 2014, 204, 13–24. [Google Scholar] [CrossRef]
  47. Gong, N.; Björnsson, B.T. Leptin signaling in the rainbow trout central nervous system is modulated by a truncated leptin receptor isoform. Endocrinology 2014, 155, 2445–2455. [Google Scholar] [CrossRef]
  48. Mohd Zahir, I.; Ogawa, S.; Dominic, N.A.; Soga, T.; Parhar, I.S. Spexin and galanin in metabolic functions and social behaviors with a focus on non-mammalian vertebrates. Front. Endocrinol. 2022, 13, 882772. [Google Scholar] [CrossRef] [PubMed]
  49. Volkoff, H. Control of appetite. In The Encyclopedia of Fish Physiology: From Genome to Environment; Farrell, A.P., Cech, J.J., Eds.; Elsevier: Amsterdam, The Netherlands, 2011; Chapter 273. [Google Scholar]
  50. Appelbaum, L.; Wang, G.; Yokogawa, T.; Skariah, G.M.; Smith, S.J.; Mourrain, P.; Mignot, E. Circadian and homeostatic regulation of structural synaptic plasticity in hypocretin neurons. Neuron 2010, 68, 87–98. [Google Scholar] [CrossRef]
  51. Volkoff, H.; Peter, R.E. Characterization of two forms of cocaine-and amphetamine-regulated transcript (CART) peptide precursors in goldfish: Molecular cloning and distribution, modulation of expression by nutritional status, and interactions with leptin. Endocrinology 2001, 142, 5076–5088. [Google Scholar] [CrossRef]
  52. Kehoe, A.S.; Volkoff, H. The effects of temperature on feeding and expression of two appetite-related factors, neuropeptide Y and cocaine-and amphetamine-tegulated transcript, in Atlantic cod, Gadus Morhua. J. World. Aquac. Soc. 2008, 39, 790–796. [Google Scholar] [CrossRef]
  53. Kobayashi, Y.; Peterson, B.C.; Waldbieser, G.C. Association of cocaine- and amphetamine-regulated transcript (CART) messenger RNA level, food intake, and growth in channel catfish. Comp. Biochem. Physiol. A Mol. Integr. Physiol. 2008, 151, 219–225. [Google Scholar] [CrossRef] [PubMed]
  54. MacDonald, E.; Volkoff, H. Neuropeptide Y (NPY), cocaine- and amphetamine-regulated transcript (CART) and cholecystokinin (CCK) in winter skate (Raja ocellata): cDNA cloning, tissue distribution and mRNA expression responses to fasting. Gen. Comp. Endocrinol. 2009, 161, 252–261. [Google Scholar] [CrossRef] [PubMed]
Figure 1. Heatmaps of the comparison of differential expression between treatments (p-value Adj less than 0.05 and a Log Fold-Change of at least 1); (A) FF12 vs. FF4; (B) FF12 vs. FF8; (C) FF8 vs. FF4. Genes up-regulated in one treatment are under-expressed in the treatment against which it is being compared.
Fishes 09 00393 g001aFishes 09 00393 g001b
Figure 2. Scatterplots of the GO terms for biological processes of differentially up-regulated genes between treatments: (A) FF12 vs. FF4; (B) FF12 vs. FF8; (C) FF8 vs. FF4. The bubble color gradient (yellow to red colors) indicates the degree of GO enrichment corresponding to p-values, with the red color corresponding to the higher p-value. The bubble size is proportional to the frequency of the GO term. The spatial arrangement of bubbles approximately reflects a grouping of GO categories by semantic similarity; thus, bubbles representing similar GO terms are clustered more closely than unrelated GO terms.
Fishes 09 00393 g002aFishes 09 00393 g002b
Table 1. Up-regulated and down-regulated differentially expressed annotated genes between treatments in Chirostoma estor liver (p-value Adj less than 0.05 and a Log Fold-Change of at least 1).
FF12 vs. FF4FF8 vs. FF4FF12 vs. FF8
UP-REGULATED GENESComplement C1q tumor necrosis factor-related protein 6Complement C1q tumor necrosis factor-related protein 6Mitochondrial glycine transporter A
Neuronal pentraxin-1General transcription factor II-I repeat domain-containing protein 2Mitochondrial glycine transporter B
U2 small nuclear ribonucleoprotein BPutative histone H2B type 2-CGlutathione-specific gamma-glutamylcyclotransferase 1
ELL-associated factor 2 *Chymotrypsin-like elastase family member 3B *
COP9 signalosome complex subunit 3Long-chain-fatty-acid--CoA ligase 4 *
Krueppel-like factor 11C2 domain-containing protein At1g53590
Upstream-binding protein 1Perforin-1
Transcription factor CP2-like protein 1 *Chaperone protein HscA
Whey acidic proteinChymotrypsin-like elastase family member 1
WAP four-disulfide core domain protein 2Chymotrypsin-like elastase family member 2A
Histone H2BChymotrypsin-C
UPF0415 protein C7orf25Chymotrypsinogen B
Interphotoreceptor matrix proteoglycan 1High choriolytic enzyme 2
Low choriolytic enzyme Zinc metalloproteinase nas-2
Zinc metalloproteinase nas-3
[Pyruvate dehydrogenase [acetyl-transferring]]-phosphatase 1
Probable E3 ubiquitin-protein ligase HERC1
DnaJ homolog subfamily B member 1
Probable DNA repair protein RAD50
Solute carrier family 41 member 2
N-acetylmuramoyl-L-alanine amidase
ERBB receptor feedback inhibitor 1
Inositol oxigenase
Biglycan
Serine/threonine-protein phosphatase with EF-hands 2
Glutamine synthetase
DOWN-
REGULATED GENES
Galactose-specific lectin nattectinInterferon alpha-inducible protein 27Ras-related protein Rab-11A
LadderlectinClass I histocompatibility antigen, F10 alpha chainCaskin-1
ChymotrypsinMajor histocompatibility complex class I-related gene proteinPolysialic acid O-acetyltransferase
Kallikrein-13HLA class I histocompatibility antigen, B-57 alpha chainApolipoprotein A-I
Cationic trypsin-3H-2 class I histocompatibility antigen, K-K alpha chainGeneral transcription factor II-I repeat domain-containing protein 2
Blarinasin-2Transmembrane prolyl 4-hydroxylaseProbable polyketide synthase 3
Ras-related protein Rab-11AªDmX-like protein 1Ribosome-binding protein 1
Phosphatidylinositol phosphatase PTPRQProtein SON
Zinc finger protein SNAI2Complement C3
Protein phosphatase 1 regulatory subunit 3C-BFibrinogen beta chain
Mucin-1Fibrinogen C domain-containing protein 1-A
Allograft Inflammatory Factor 1Tenascin-N
Synaptogyrin-3Neoverrucotoxin subunit beta
Gap junction alpha-1 protein *Stonustoxin subunit alpha
L-rhamnose-binding lectin SML
Malignant fibrous histiocytoma-amplified sequence 1 homolog
G1/S-specific cyclin-D2
FF4: 4 feedings per day; FF8: 8 feedings per day; FF12: 12 feedings per day. * Growth-related genes.
Table 2. Liver expression of orexigenic genes involved in appetite regulation in C. estor with different feeding frequencies.
PeptideTranscript NameExpression
ApelinApelin receptor B
Apelin receptor A
Apelin
⇑ FF12–⇓ FF4
⇓ FF12–⇑ FF4
⇑ FF12–⇓ FF4
GhrelinN/A-
OrexinN/A-
GalaninGalanin receptor type 1
Galanin peptides
⇓ FF12–⇑ FF4
⇓ FF12–⇑ FF4
SecretoneurinN/A-
Melanin-concentrating hormoneN/A-
Agouti-related proteinAgouti-related protein⇑ FF12–⇓ FF4
Neuropeptide YPro-neuropeptide Y
Neuropeptide Y receptor type 1
⇓ FF12–⇑ FF4
⇑ FF12–⇓ FF4
⇓: down-regulated; ⇑: up-regulated; FF4: four feedings per day; FF12: twelve feedings per day; N/A: no transcript found in the annotation report.
Table 3. Liver expression of anorexigenic genes involved in appetite regulation in C. estor with different feeding frequencies.
PeptideTranscript NameExpression
LeptinLeptin receptorN/E
Nesfatin-1/Nucleobindin-2Nucleobindin-1
Nucleobindin-2
N/E
N/E
SpexinSpexinN/E
AmylinN/A-
CholecystokininCholecystokinin
Cholecystokinin receptor type A
⇓ FA12–⇑ FA4
⇑ FA12–⇓ FA4
Gonadotropin-releasing hormoneGonadotropin-releasing hormone II receptorN/E
Melanocyte-stimulating hormoneN/A-
NeuromedinNeuromedin-B
Neurotensin/neuromedin N
Neuromedin-U
Neuromedin-K receptor
⇓ FA12–⇑ FA4
N/E
N/E
N/E
OctadecaneuropeptideN/A-
Arginine-vasotocin[Arg8]-vasotocin receptorN/E
Corticotropin-releasing factorCorticotropin-releasing factor receptor 2
Corticotropin-releasing factor receptor 1
N/E
N/E
UrocortinUrocortin-3N/E
Cocaine- and amphetamine-regulated transcriptCocaine- and amphetamine-regulated transcript proteinN/E
Pro-opiomelanocortinN/A-
Gastrin-releasing peptide/BombesinGastrin-releasing peptide receptor
Gastrin-releasing peptide
N/E
N/E
Glucagon-like peptideGlucagon-like peptide 2 receptor
Glucagon-like peptide 1 receptor
⇓ FA12–⇑ FA4
⇑ FA12–⇓ FA4
TachykininsProtachykinin⇓ FA12–⇑ FA4
UrotensinsN/A-
⇓: down-regulated; ⇑: up-regulated; FF4: Four feedings per day; FF12: Twelve feeding per day; N/A: no transcript found in the annotation report; N/E: no expression.
Disclaimer/Publisher’s Note: The statements, opinions and data contained in all publications are solely those of the individual author(s) and contributor(s) and not of MDPI and/or the editor(s). MDPI and/or the editor(s) disclaim responsibility for any injury to people or property resulting from any ideas, methods, instructions or products referred to in the content.

