Article

Research on Measuring the Bodies of Underwater Fish with Inclined Positions Using the YOLOv8 Model and a Line-Laser System

1
Key Laboratory of Fisheries Remote Sensing, Ministry of Agriculture and Rural Affairs, East China Sea Fisheries Research Institute, Chinese Academy of Fishery Sciences, Shanghai 200090, China
2
College of Information Technology, Shanghai Ocean University, Shanghai 200090, China
3
School of Navigation and Naval Architecture, Dalian Ocean University, Dalian 116023, China
*
Author to whom correspondence should be addressed.
Fishes 2024, 9(6), 206; https://doi.org/10.3390/fishes9060206
Submission received: 11 April 2024 / Revised: 23 May 2024 / Accepted: 28 May 2024 / Published: 1 June 2024
(This article belongs to the Special Issue AI and Fisheries)

Abstract

:
Fish body measurement is essential for monitoring fish farming and evaluating growth. Non-destructive underwater measurements play a significant role in aquaculture management. This study involved annotating images of fish in aquaculture settings and utilized a line laser for underwater distance calibration and fish body inclined-angle calculation. The YOLOv8 model was employed for fish identification and key-point detection, enabling the determination of actual body dimensions through a mathematical model. The results show a root-mean-square error of 6.8 pixels for underwater distance calibration using the line laser. The pre-training YOLOv8-n, with its lower parameter counts and higher MAP values, proved more effective for fish identification and key-point detection, considering speed and accuracy. Average body length measurements within 1.5 m of the camera showed a minor deviation of 2.46% compared to manual measurements. The average relative errors for body length and width were 2.46% and 5.11%, respectively, with corresponding average absolute errors. This study introduces innovative techniques for fish body measurement in aquaculture, promoting the digitization and informatization of aquaculture processes.
Key Contribution: To provide a non-contact measurement of fish bodies underwater that is capable of measuring the length and width of freely swimming, inclined fish, as well as calculating the angle of inclination.

Graphical Abstract

1. Introduction

Fish farming, a vital component of aquaculture, is widely practiced and carries substantial economic importance worldwide. It is essential to monitor fish cultivation to ensure effective oversight of the aquaculture environment and the development of the fish [1]. Fish body measurements are essential tools for monitoring, providing valuable insights into fish growth using parameters such as body length and morphology [2]. Fish body measurements enable fish farmers to accurately evaluate fish growth, assess feeding efficiency, and implement effective management strategies in a timely manner [3]. In the realm of fish studies, body measurements often rely on manual techniques, a process that is not only time-consuming and labor-intensive but also prone to inaccuracies and inconsistent outcomes [4]. Furthermore, conventional methods for measuring fish body dimensions are encumbered by constraints such as slow measurement rates, elevated labor expenses, and the potential for eliciting heightened stress responses in fish [5]. Therefore, there is an urgent necessity to explore an efficient, accurate, and non-invasive method for measuring the morphological characteristics of underwater fish.
The swift progress of deep learning algorithms and computer vision technology in recent years has played a crucial role in enabling digitalization integration within aquaculture practices [6,7,8]. The application of deep learning technology in measuring individual fish parameters has resulted in enhanced experimental outcomes [9,10]. Ongoing studies on fish body measurement classify methods into two primary categories: two-dimensional and three-dimensional. Two-dimensional methods can be subdivided into out-of-water and underwater techniques. In the examination of 2D measurements of fish out of water, Ou Liguo et al. [11] utilized computer vision technology to determine the positions of key points on tuna specimens. They conducted automated measurements of the pixel length of morphological features for three tuna species and calculated their actual lengths. The results show that computer vision technology effectively measured morphological indicators of all three tuna species. Furthermore, Wang Yusha et al. [12] developed a device that employs a mask region convolutional neural network (Mask R-CNN) for the automated and non-invasive segmentation of fish images and measurement of phenotypic traits. The device demonstrated average relative errors in body length and height measurements of greater amberjacks below 4%. While accurate measurements can be obtained in controlled 2D assessments of fish out of water, the dehydrated environment may still pose risks to the fish. Fish body measurement in underwater environments surpasses the limitations of traditional methods in terms of fish damage, cost, and performance. The prevailing method for underwater fish body measurement involves the utilization of three-dimensional measurements. In their study, Zhou Jialong et al. [13] employed binocular stereo-vision technology to calibrate and align the original images to capture depth information accurately. They then utilized the SOLOv2 model to segment the fish body, integrating image planar features with depth data to achieve precise three-dimensional pose fitting, consequently facilitating the accurate estimation of the fish’s total length. The average relative error in estimating the full length using this approach was found to be 2.67%, with a standard deviation of 9.45%. Huang et al. [14] proposed a novel approach for fish size measurement employing stereo vision in conjunction with Mask R-CNN. This method integrates stereo vision, fish instance segmentation, and 3D point cloud processing. By combining the 3D coordinates obtained through stereo vision with an accurate fish segmentation technique in images, the researchers successfully produced 3D point cloud data representing the fish being measured. The experimental results reveal that utilizing the transformed 3D point cloud for estimating fish length yielded an average error of 5.5 mm. Undoubtedly, the utilization of 3D technology for underwater fish body measurement yields a wealth of detailed information; however, it comes at the cost of high computational demands and the necessity for sophisticated equipment. On the contrary, the current research landscape in the realm of 2D underwater fish body analysis predominantly revolves around segmentation [15], identification [16], and tracking [17]. The exploration of 2D underwater measurement is constrained due to the challenges associated with aligning fish bodies in the water, thereby impeding coplanarity with the camera’s viewpoint. Nevertheless, the advantage of 2D underwater fish body measurement lies in its reduced equipment dependency compared to 3D methods, rendering its operation more streamlined and conducive for fish farming monitoring purposes.
YOLO (You Only Look Once) is a revolutionary object detection algorithm first proposed by Joseph Redmon in 2015. The core innovation of YOLO lies in its simplification of the object detection task into a single regression problem, which can predict the positions and categories of all objects in the image through a single forward propagation. This design gives YOLO a significant advantage in detection speed and makes it particularly suitable for real-time application scenarios [18]. Since its release in January 2023, YOLOv8 has become a significant milestone in the field of object detection, attracting the attention of numerous scholars and researchers [19]. As the latest version of the YOLO series, YOLOv8 has inherited and further developed the strengths of its predecessors while introducing a series of innovative improvements. These enhancements have led to notable advancements in various key performance metrics.
The study aims to propose a model utilizing YOLOv8 and line-laser technology for accurately measuring the body dimensions of underwater inclined fish, transcending the limitations associated with conventional measurement techniques. Initially, video footage of the fish is captured for labeling, ensuring measurement precision through distance calibration and correction of the underwater camera. Subsequently, the line-laser detection method is utilized to detect laser lines on the fish’s body, facilitating the analysis of the fish–camera distance and body tilt angle. The YOLOv8 algorithm is then deployed for species identification and key-point detection on the fish’s body, enabling the assessment of pixel measurements for body length and width. Finally, leveraging length calibration data acquired at various distances and the fish’s tilt angle, a mathematical model computes the accurate body dimensions of the fish. This model presents a cost-effective, efficient, and precise solution for measuring underwater tilted fish bodies, offering a valuable technical asset for underwater fish measurement research and aquaculture management. Our main contributions are summarized as follows:
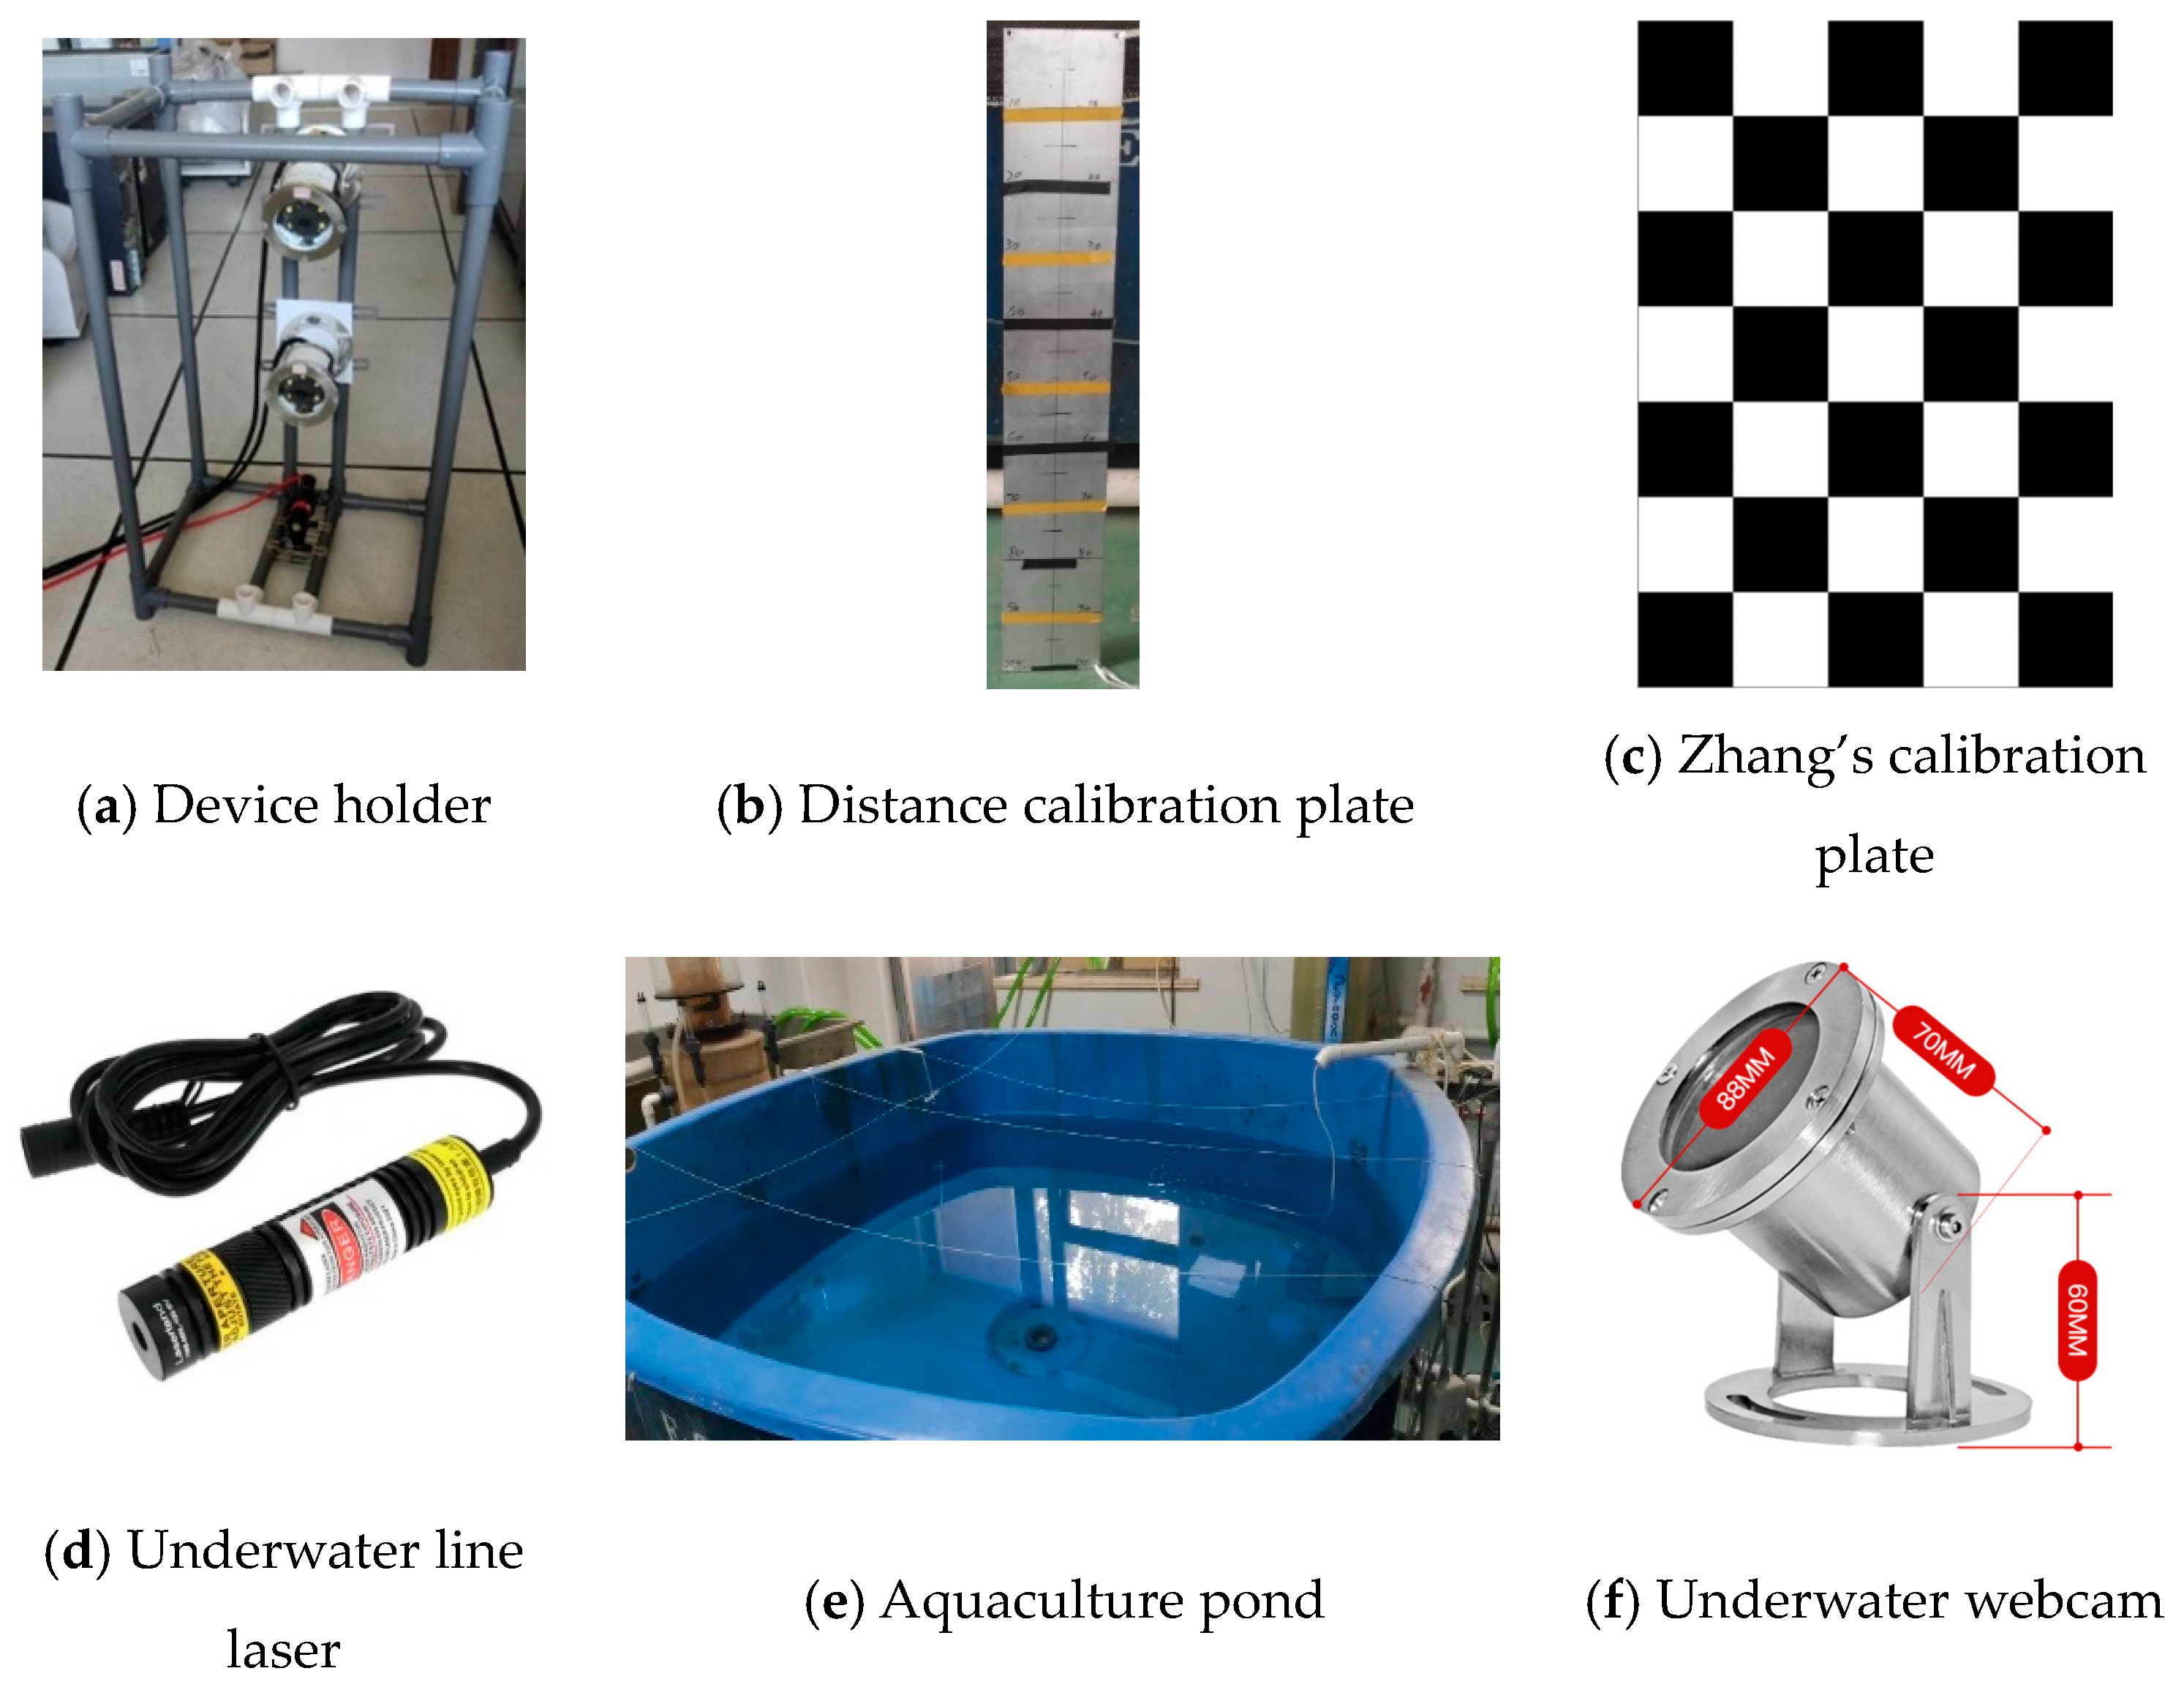
  • This study first collects and constructs an underwater fish-body measurement dataset and underwater camera distance calibration dataset using our self-made experimental device.
  • This study, for the first time, integrates line-laser measurement technology with deep learning technology and applies it to the field of underwater fish body measurement.
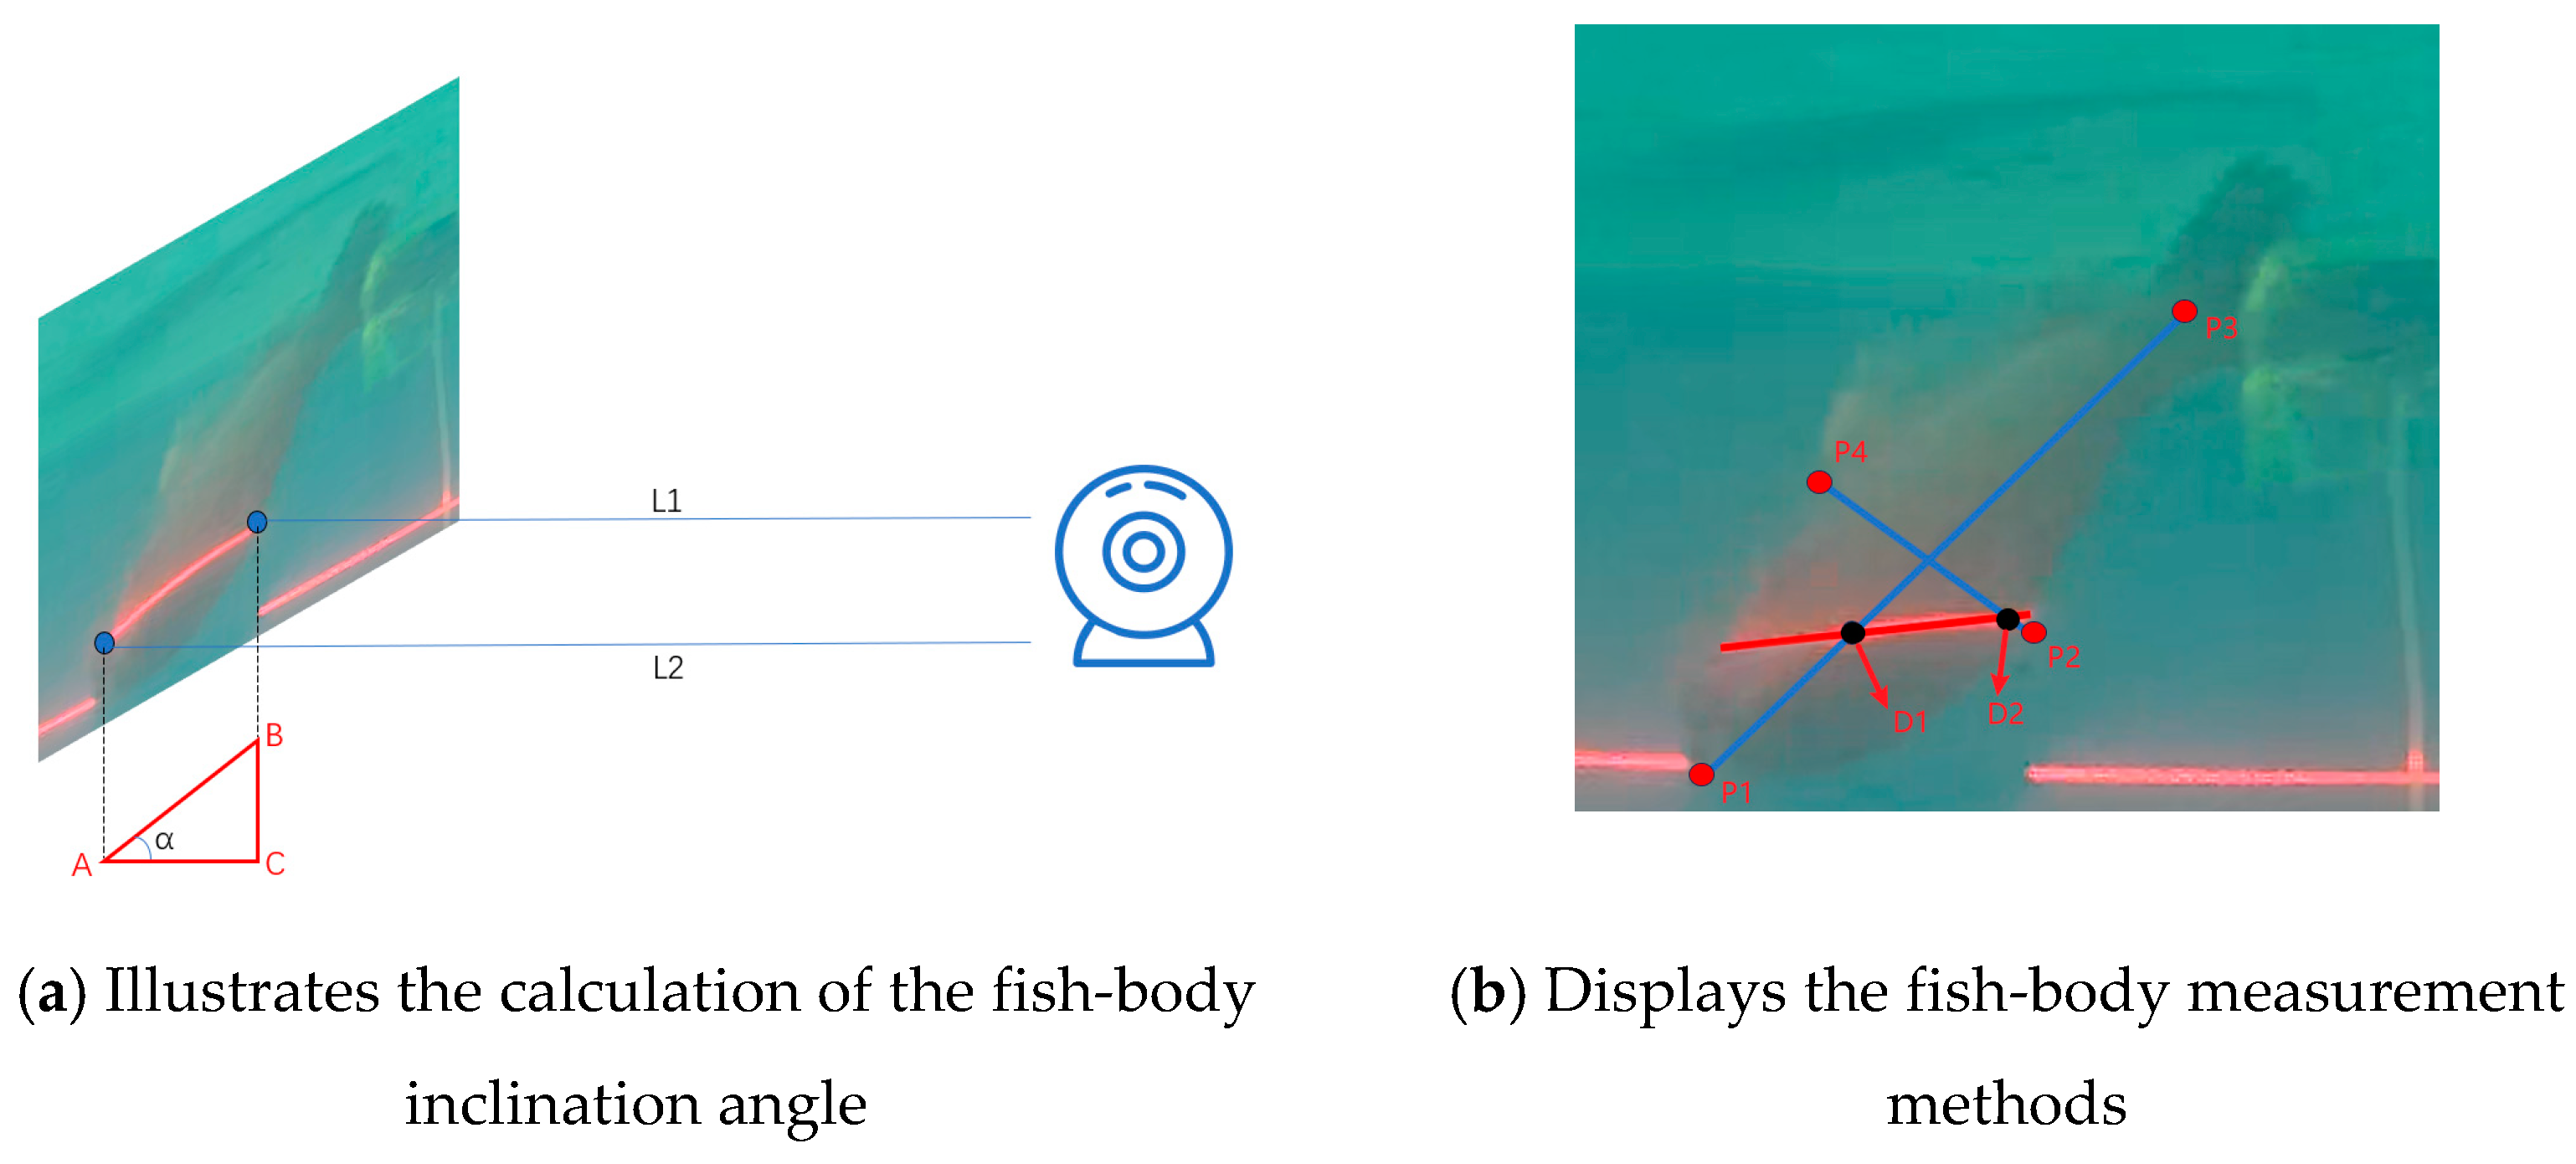
  • This study, for the first time, mathematically models and calculates the inclinations, body lengths, and body widths of underwater fish images captured by a single camera with a line laser. The results show that compared to manual measurement, this method has smaller errors, introducing innovative technology to fish body measurement in aquaculture.
This article is divided into four sections. Section 2 describes the construction of the dataset and introduces the model used in this experiment. Section 2.1 introduces the data collection equipment and experimental site. Section 2.2 describes the data collection and processing process. Section 2.3 introduces the experimental methods, including camera calibration, underwater line-laser detection, underwater camera distance calibration, YOLOv8 key-point detection, and fish-body measurement algorithm. Section 2.4 presents the evaluation metrics for the experimental results. Section 3 presents the experimental results. Section 4 comprises a discussion of the experiment and its results. Lastly, Section 5 consists of the conclusions and future prospects of this research.

2. Materials and Methods

2.1. Experimental Equipment

The experiments employed PVC plastic pipes to construct the device holder (Figure 1a). The line laser and two underwater cameras were precisely positioned and secured on the PVC holder to ensure stability. Subsequently, the experimental device was submerged in the aquaculture pond (Figure 1e) to capture images of the underwater aquaculture setting. A distance calibration plate (Figure 1b), consisting of a steel plate with scale markings, was used for underwater distance calibration. A Zhang’s calibration plate (Figure 1c) served as a tool for camera calibration to enhance imaging accuracy. An underwater line laser (Figure 1d) was used for underwater localization, emitting a linear laser beam to locate objects in the underwater environment. Video footage was captured with a Haxtec HK90A (Shen Zhen hakester Electronics Co., Ltd. Shenzhen, China). high-clear-water underwater webcam (Figure 1f), with a resolution of 4 megapixels and a frame rate of 1–30 frames per second for monitoring underwater organisms.

2.2. Data Acquisition and Processing

The experimental setup was arranged in the breeding tank to facilitate data collection. Images of various fish species were captured using the PotPlayer video player software (version 1.7.22227) along with lasers. There are four fish species, including Channa argus (referred to as ‘blackfish’ later on), Carassius auratus (referred to as ‘crucian carp’ later on), and Lateolabraxjaponicus (referred to as ‘sea bass’ later on), and among them, there is one black fish and one sea bass, while there are two crucian carp. To accurately differentiate between the crucian carp specimens in comparing their experimental and actual lengths, dorsal markers (Figure 2a) and tail markers (Figure 2b) were assigned to each individual crucian carp. Fish dimensions were manually measured at specific key points to determine body length and width precisely (Figure 3). A total of 661 images were extracted from videos of underwater fish culture, with respective categories and quantities detailed in Table 1. The classification and labeling of fish body key points were conducted using Labelme software (version: 5.4.1). This process produced a txt label file containing the coordinates of labeled categories and key points, in accordance with the guidelines shown in Figure 3. The labeled dataset was then split into training, validation, and test sets at an 8:1:1 ratio.
This study employed a calibration plate and a line laser for accurately measuring underwater distances. The calibration plate was securely positioned vertically underwater to ensure the laser line intersected the plate and stayed within the camera’s field of view. A total of 49 datasets were collected with 2 cm intervals using a systematic sampling technique. Each dataset contained information on the distance between the camera and the calibration plate in the image, the vertical position of the laser line on the plate in the image, and the pixel lengths corresponding to 10 cm, 20 cm, 30 cm, and 40 cm on the calibration plate.

2.3. Research Methodology

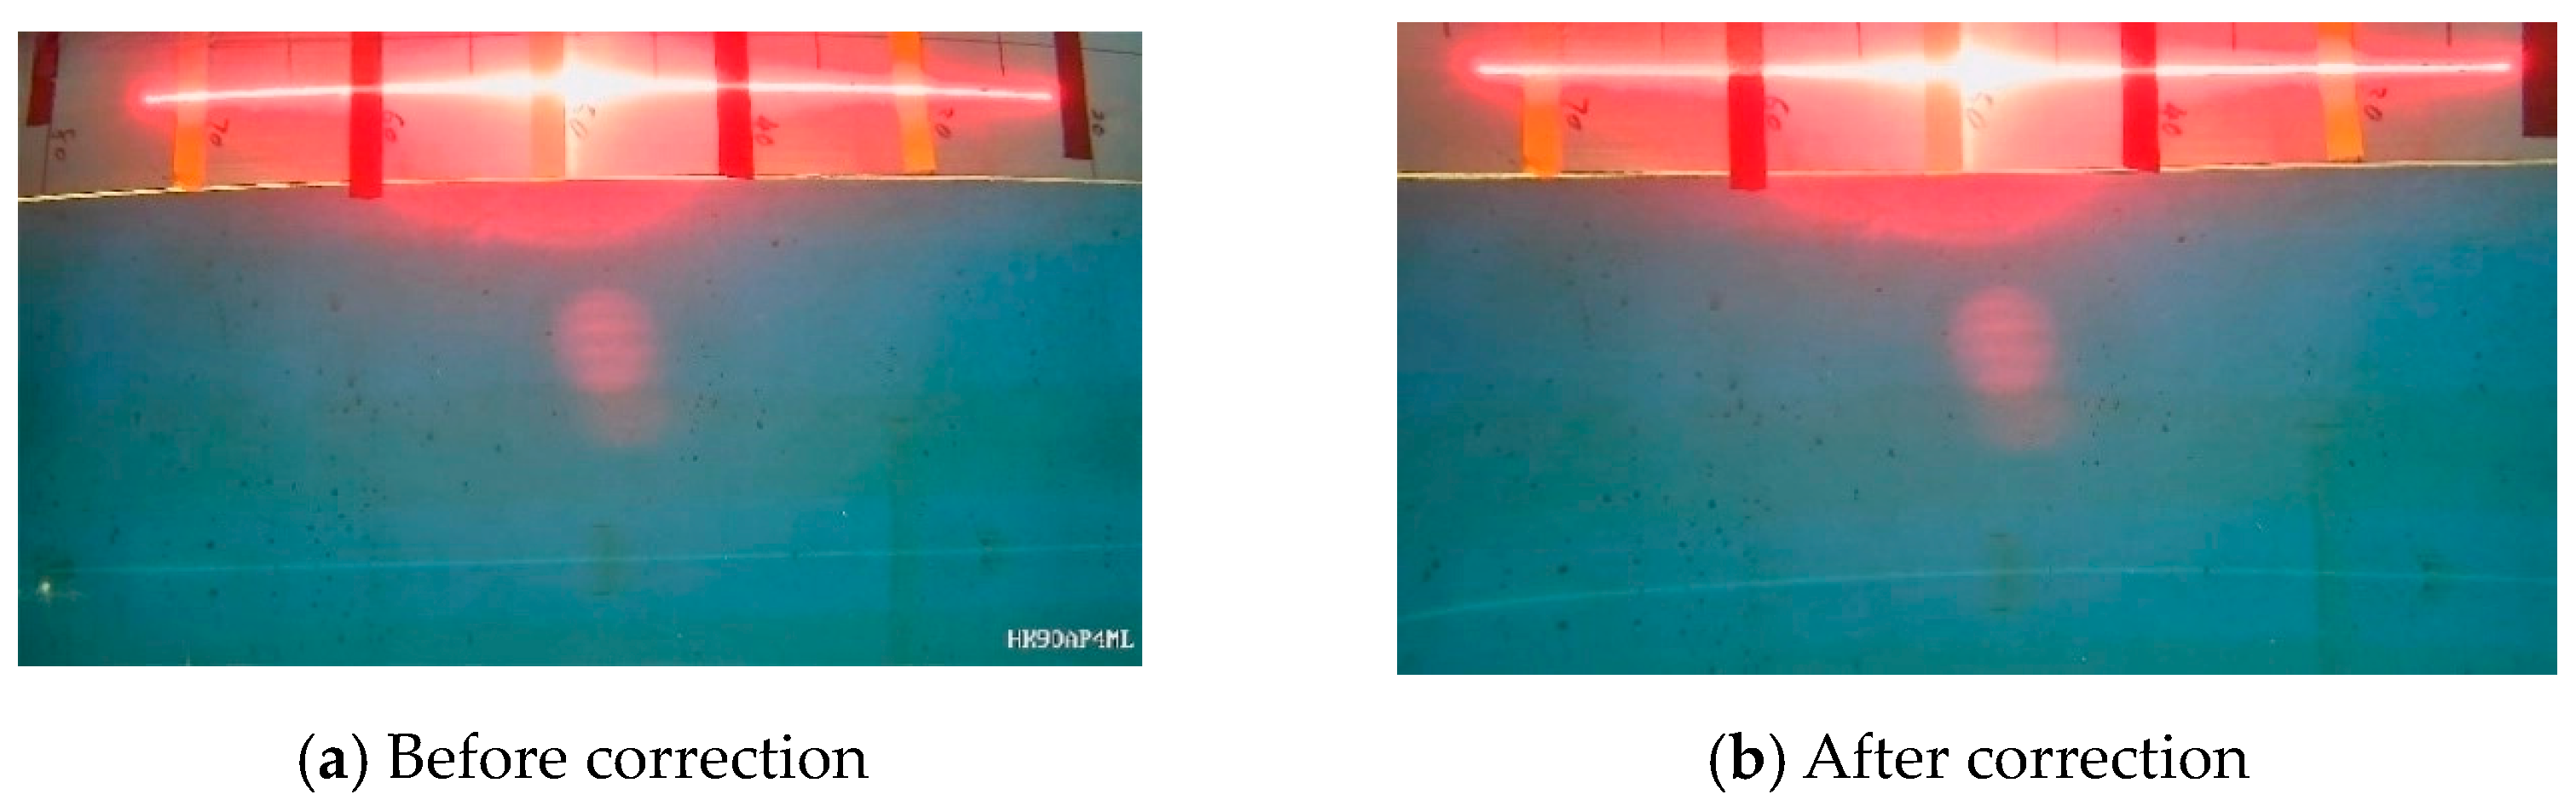
2.3.1. Camera Calibration

Zhang’s camera calibration method is commonly used in computer vision for calibrating cameras to ascertain both the internal and external parameters of the camera [20]. This method hinges on utilizing the coordinates of a known three-dimensional object in the camera’s coordinate system and the corresponding two-dimensional image coordinates to calculate the camera’s internal parameter matrix and external parameter vector through specific operations.
The analysis involves multiple images of the calibration plate taken at various positions, orientations, and distances. Corner points on the calibration plate in each image are automatically detected using corner point algorithms available in image processing libraries such as OpenCV. The camera’s internal parameter matrix (referred to as K) is then computed by applying Zhang’s calibration algorithm to the identified corner pairs (Equations (1) and (2)). Subsequently, the rotation matrix (R) and translation vector (T) for each calibration-plate image are determined based on the camera’s internal parameter matrix and distortion coefficients (Equation (3)). By utilizing all corner points from the calibration images and the resultant camera external parameters, a comprehensive optimization process is conducted using the least squares method to improve both the camera’s internal and external parameters, resulting in the final camera parameter matrix.
x y 1 = s f x 0 c x 0 f y c y 0 0 1 r 11 r 12 r 13 t x r 21 r 22 r 23 t y r 31 r 32 r 33 t z 0 0 0 1 X Y Z 1
where (X, Y, Z) represents the coordinates of a point in 3D space, while (x, y) denotes the coordinates of the corresponding pixel on the camera’s imaging plane.
J = i = 1 N   j = 1 m   u i j u i j ^ 2 + v i j v i j ^ 2  
where the pixel coordinates of the corner points are denoted as u and v, while the pixel coordinates derived from the camera’s internal and external references, as well as an unknown coefficient vector, are represented as u ^ and v ^ .
a r g m i n R , T , p i = 1 N   j = 1 m   f X i j , R , T , p x i j 2
where X i j is the world coordinate of the j th corner point in the i th image on the calibration plate, X i j is the pixel coordinates of the corner point in the corresponding image, f is the function that projects the corner point from the world coordinate system to the camera coordinate system, R and T are the rotation matrix and translation vector, respectively, and p contains the internal parameter matrix and distortion coefficients of the camera.

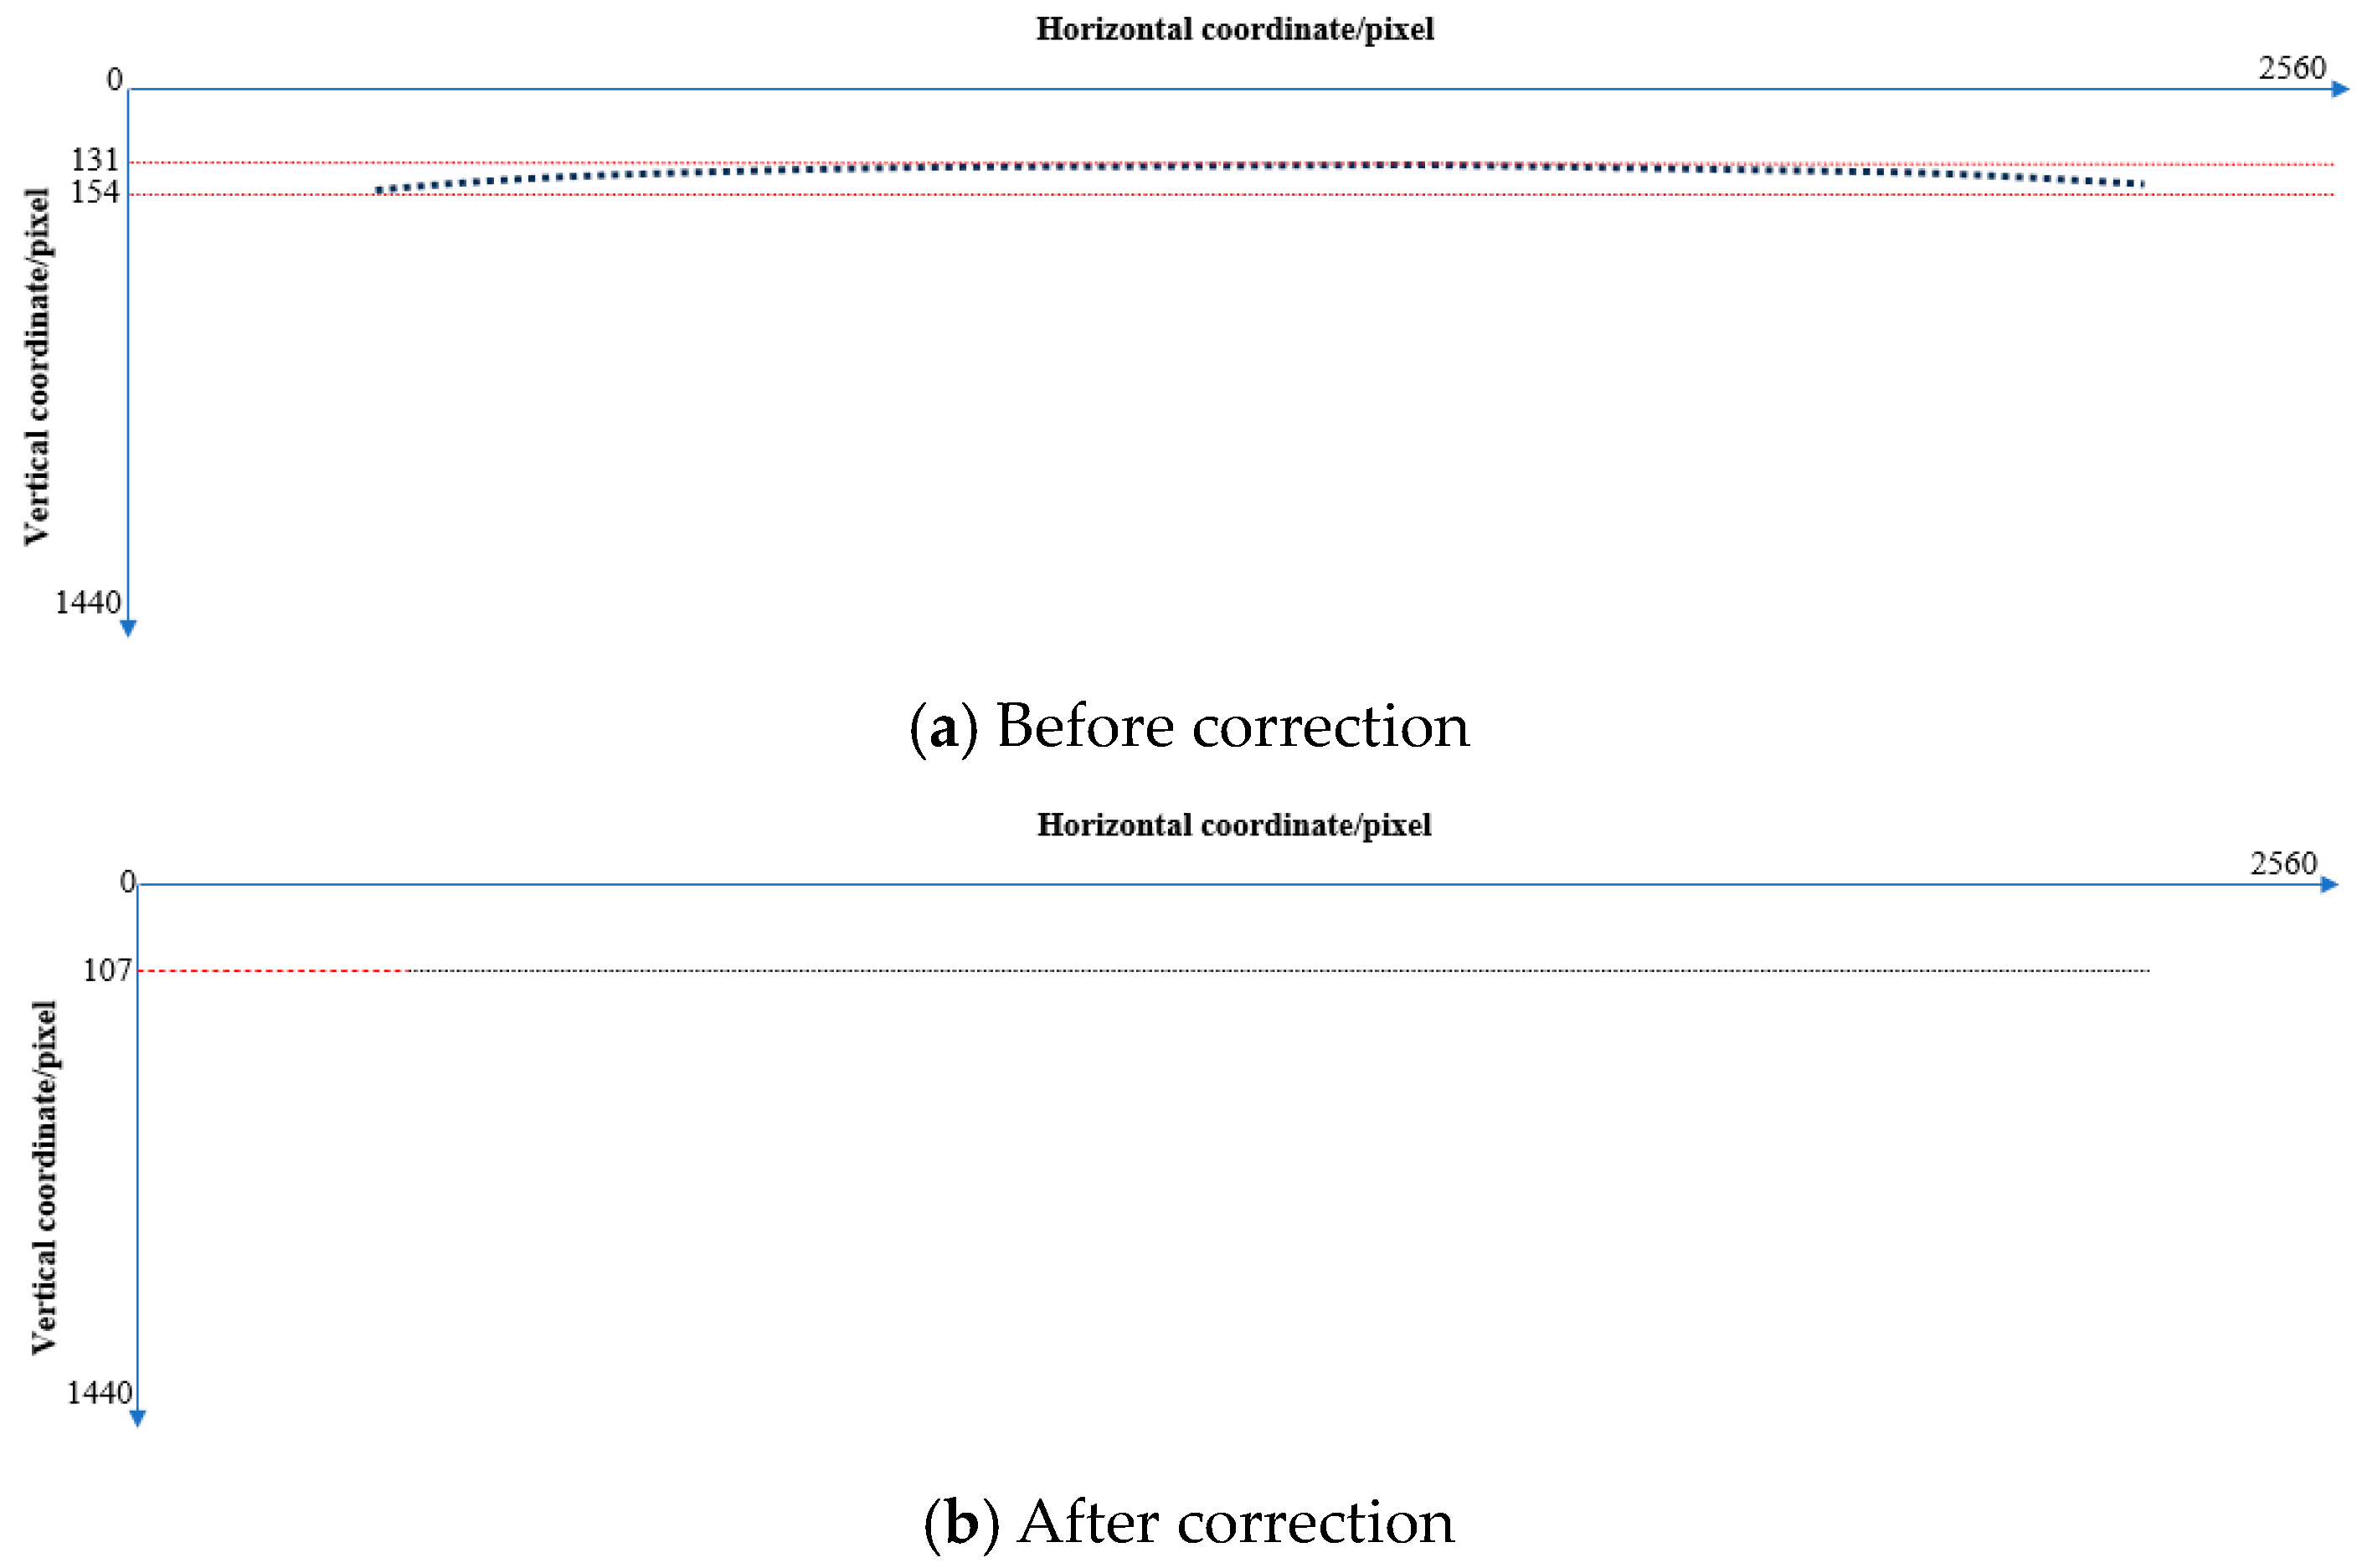
2.3.2. Underwater Laser-Line Inspection

The laser beam line has a specific width as it projects onto the surface of the object undergoing measurement. If the laser line’s width surpasses the predetermined minimum accuracy threshold, substantial measurement discrepancies or total inaccuracies might arise [21]. The foremost step involves precisely ascertaining the central axis of the laser line. This is accomplished through an analysis of the RGB channels extracted from the captured image. The blue (B) channel undergoes the extreme value method to detect outliers in each column of the image. Subsequently, the gradient gravity technique is employed to compute the center of the laser line based on numerous extreme points within a column, as demonstrated in Equation (4). This methodology facilitates pinpointing the laser line’s center in each column by assessing potential points, eliminating outliers, and disregarding extraneous points not belonging to the original laser line. Following this evaluation, only the brightest 50% of points are retained. Ultimately, a linear regression model is applied to these chosen points using the least squares method to determine the accurate central line of the laser beam.
C y = x G x , y G x , y ,   where   x = 1,2 , , m  
where G(x, y) denotes the gray gradient value of the pixel with coordinates (x, y) in the image, where x is the row coordinate and y is the column coordinate.

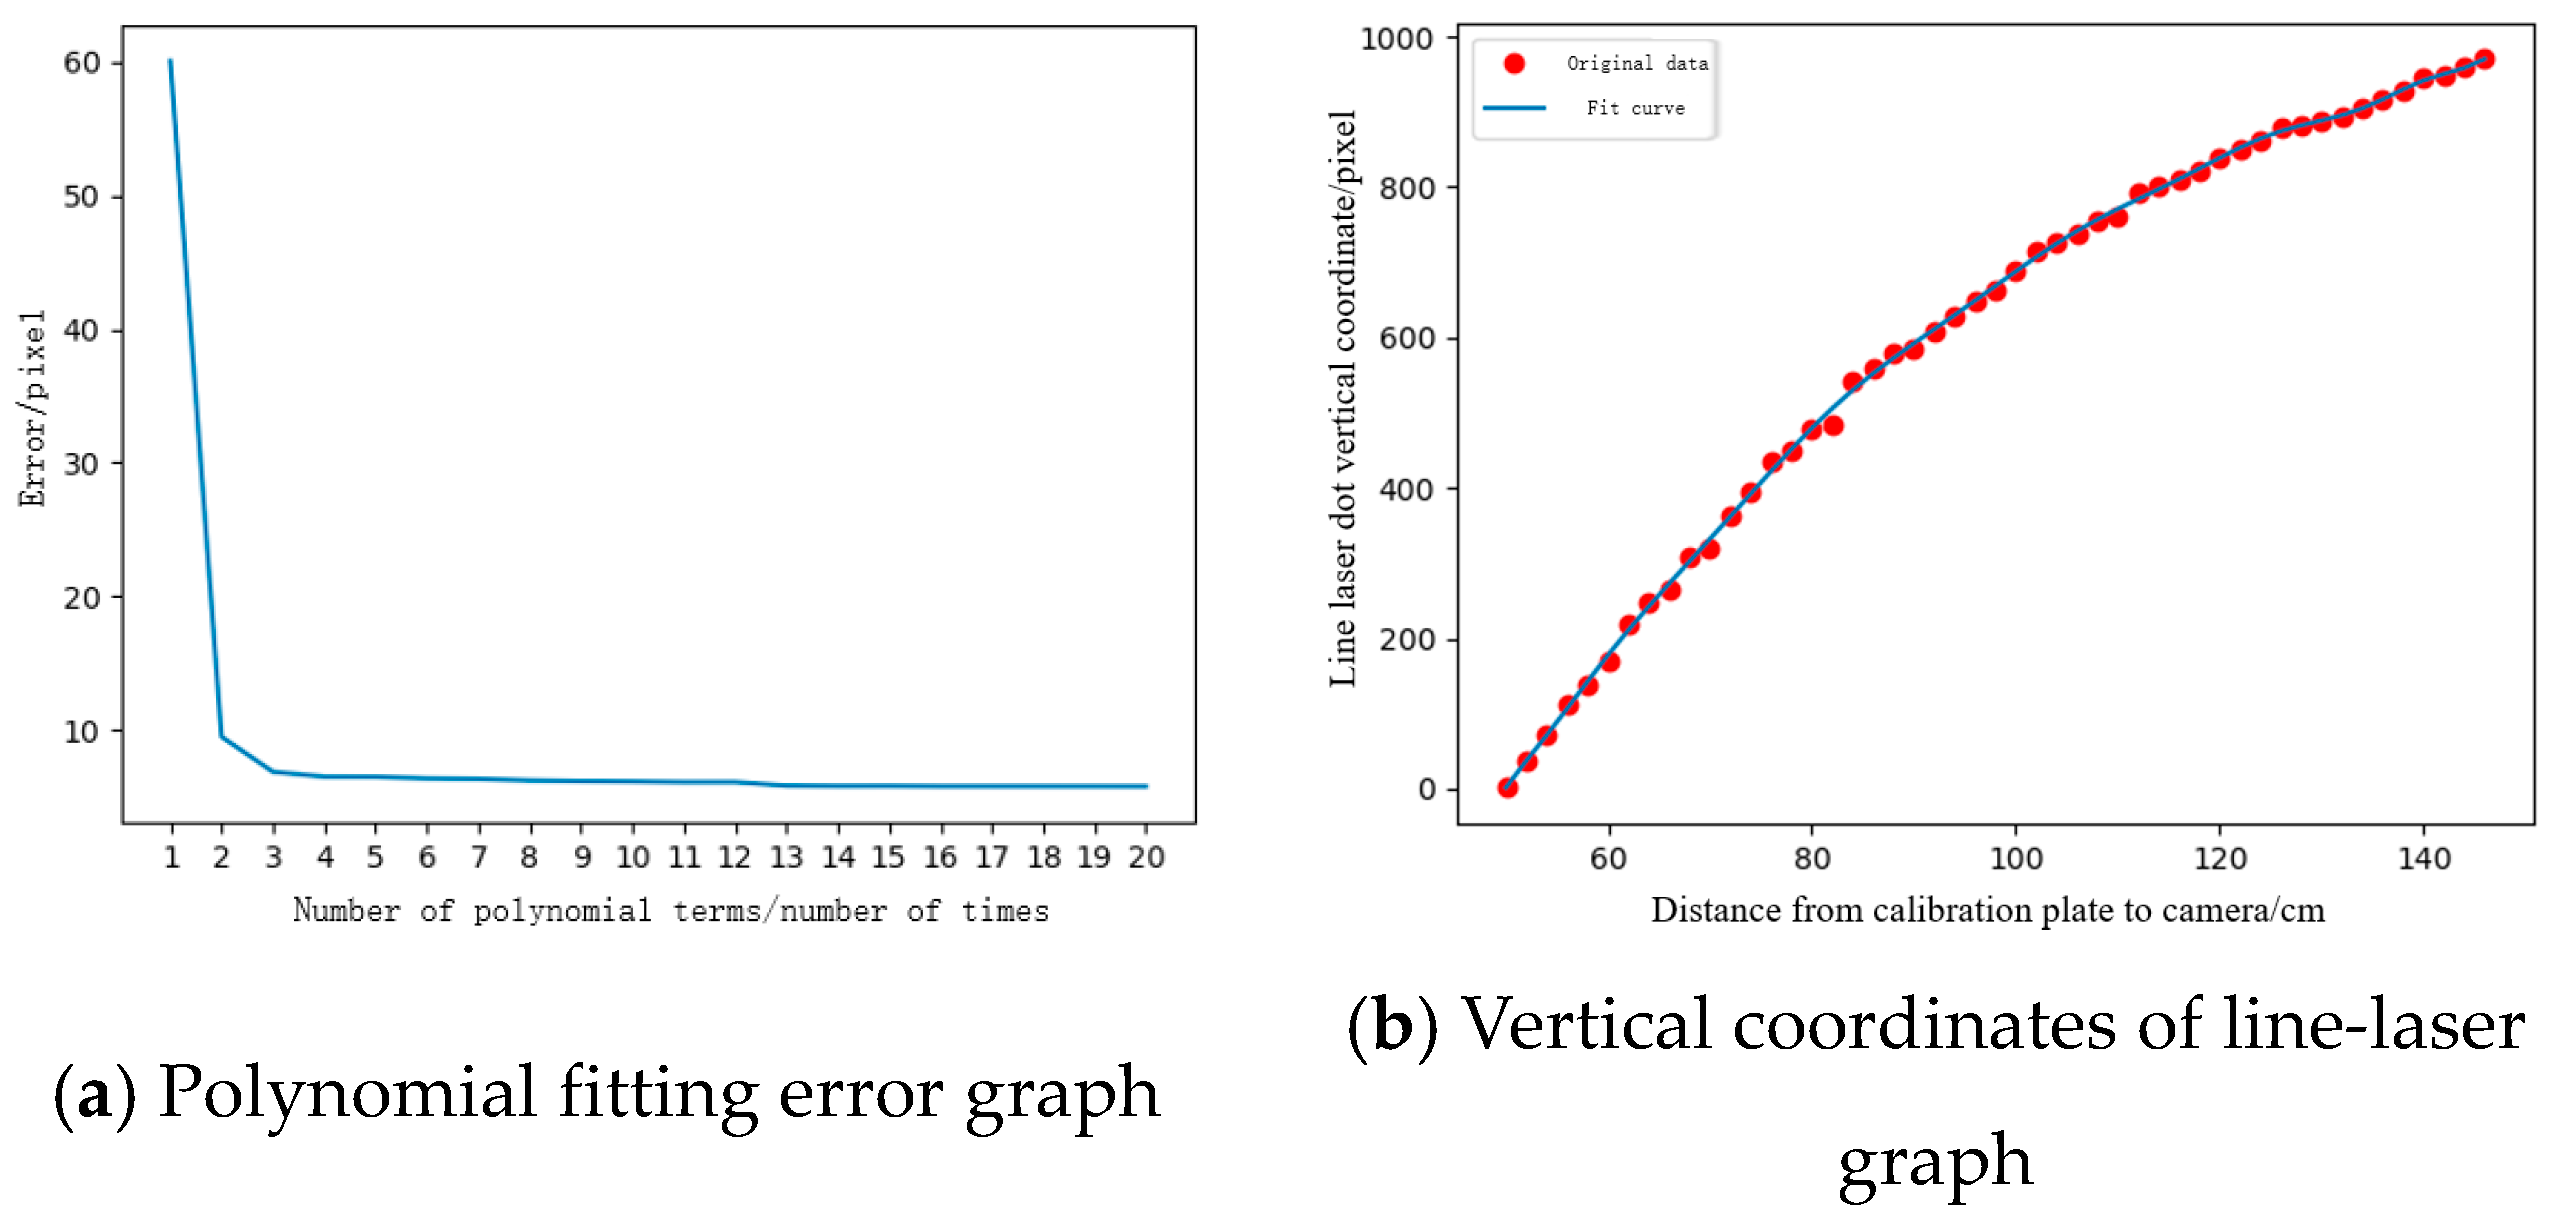
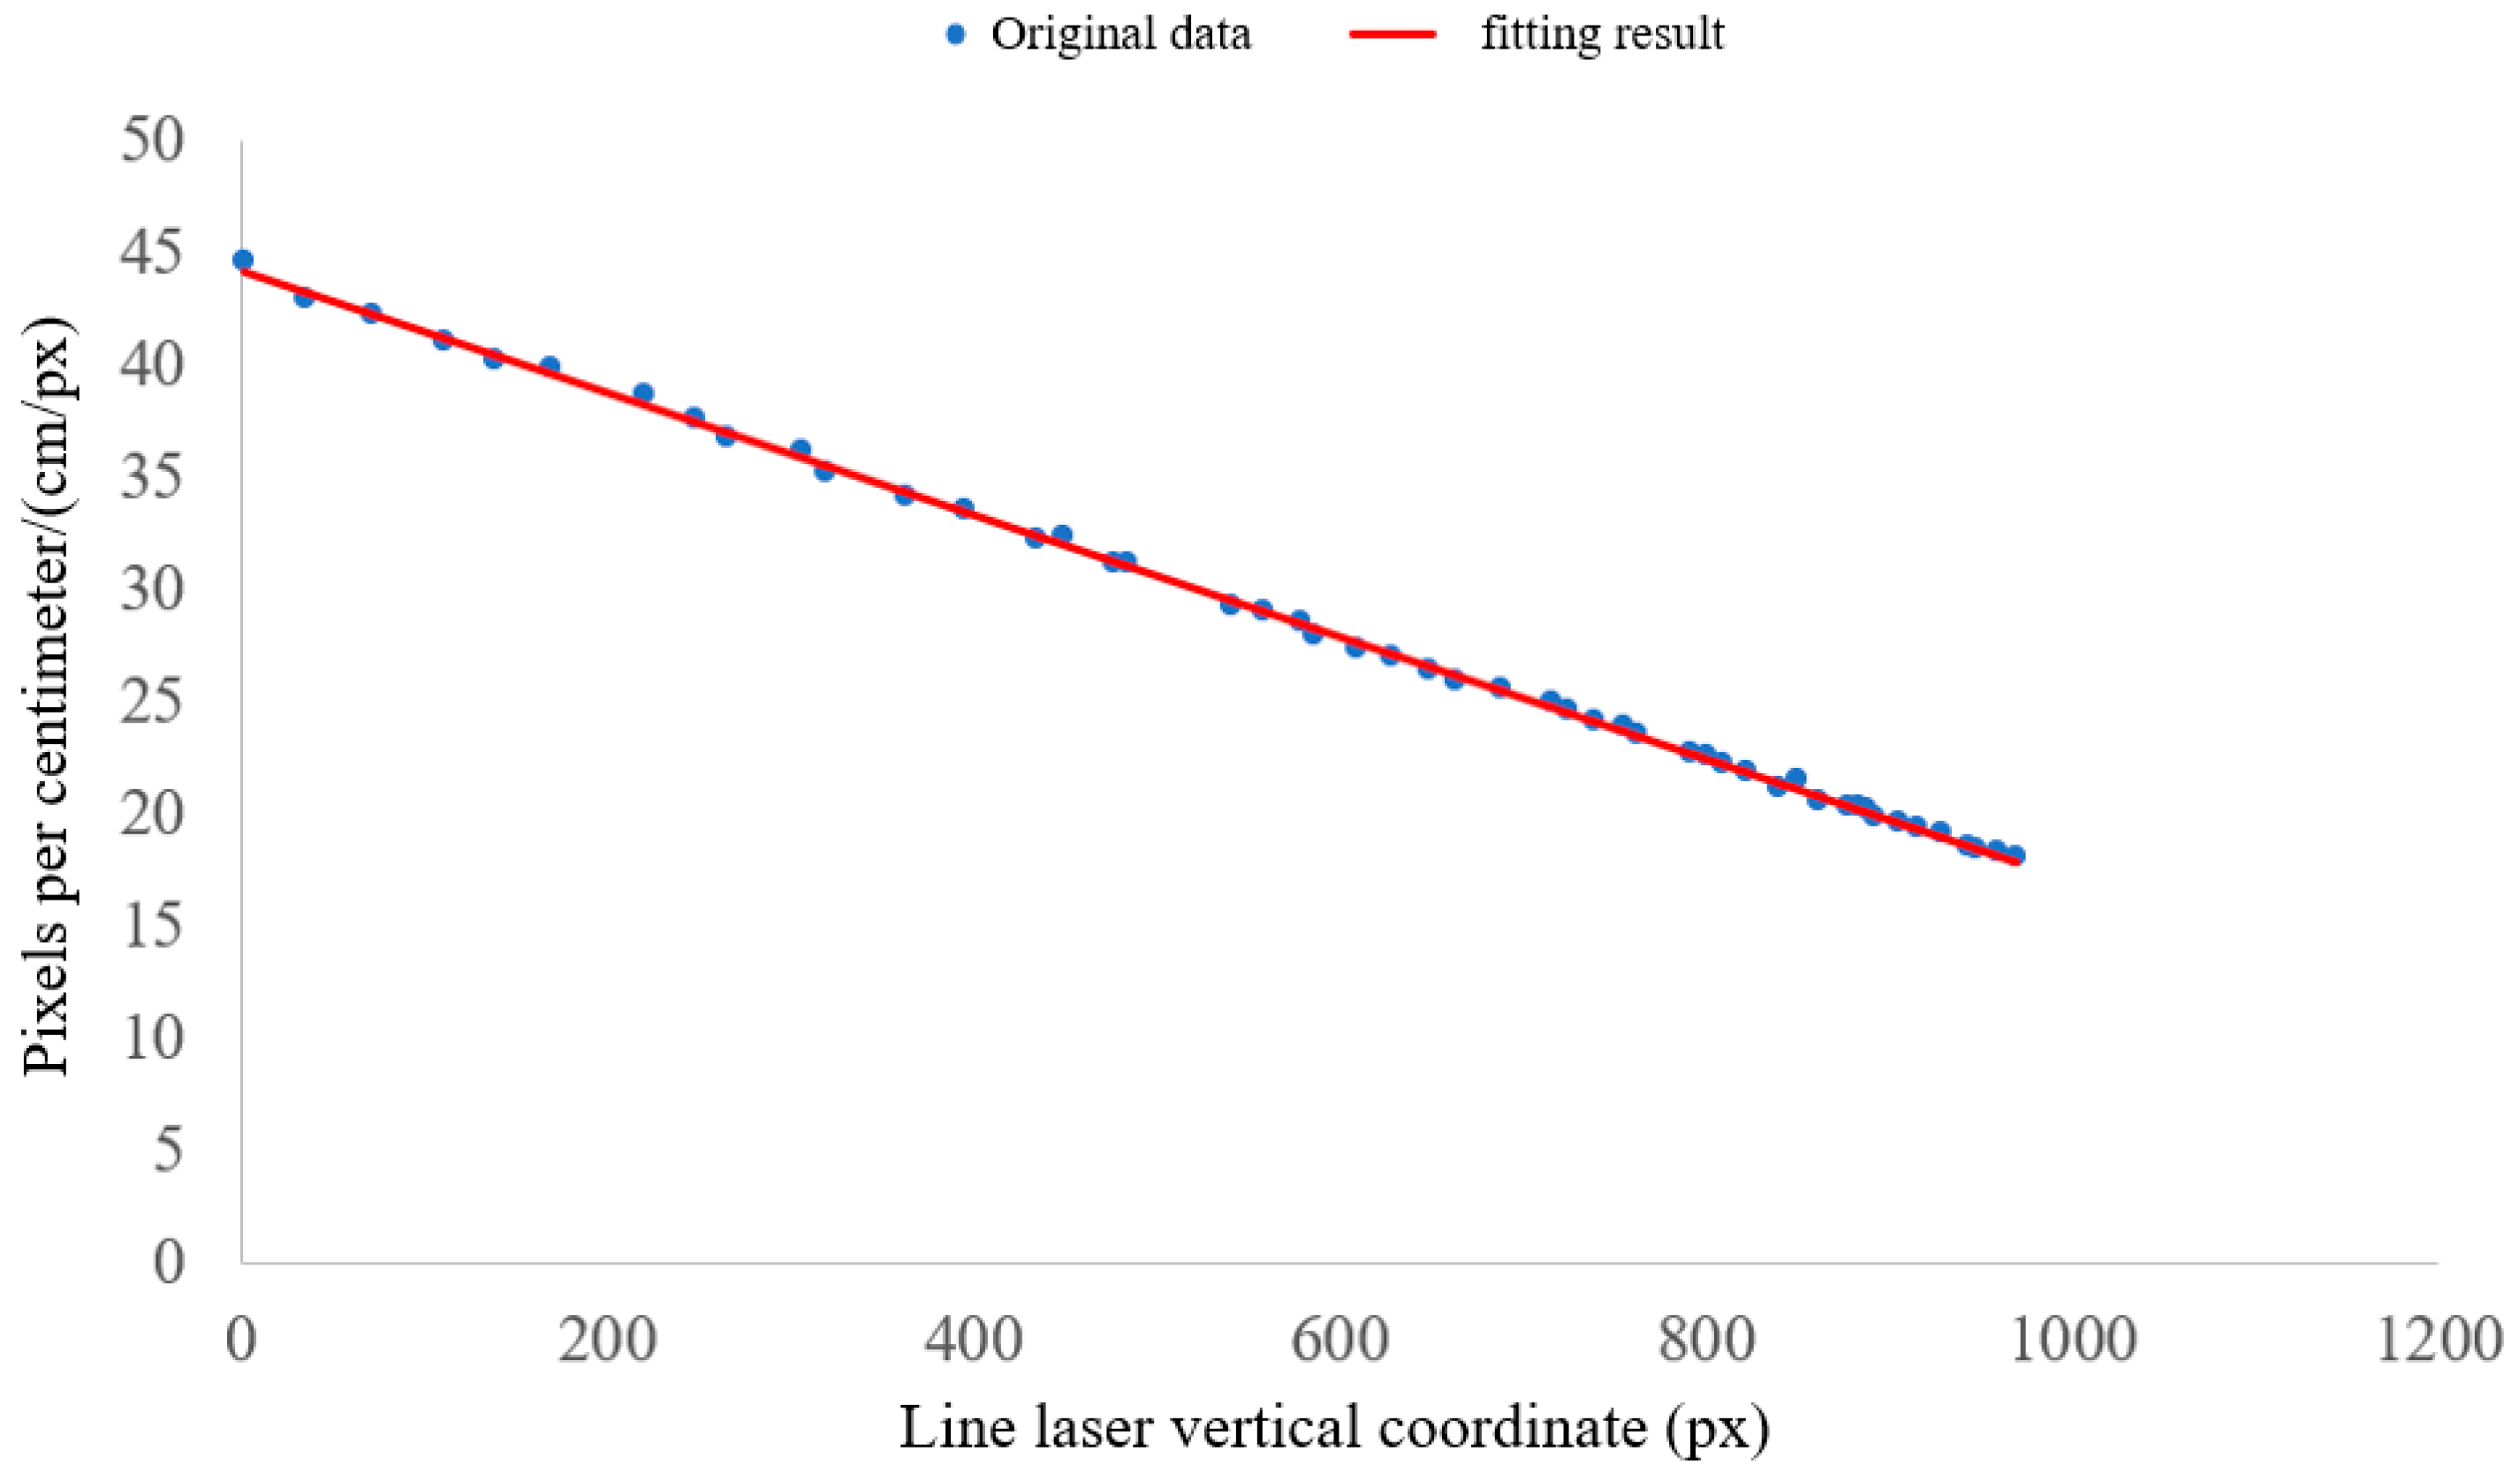
2.3.3. Underwater Camera Distance Calibration

The precise distance between the line laser and the fish and the correlation between pixel length and actual distance were established through underwater distance calibration using a calibration plate. The distance from the camera to the calibration plate was designated as ‘x’, and the vertical coordinate of the line laser was labeled as ‘y’. A polynomial function was employed to depict the relationship between ‘x’ and ‘y’. It is crucial to select the appropriate number of polynomial terms, as a shortage of terms leads to notable fitting errors, while an excess increases the computational workload for subsequent analyses. In the experiment, curve fitting was conducted using polynomials ranging from 1 to 20, and the associated fitting errors were evaluated. Furthermore, specific pixel lengths of 10 cm, 20 cm, 30 cm, and 40 cm on the calibration-plate scale line in the image were identified. By integrating these lengths with the established ‘x-y’ relationship, the longitudinal coordinate of the line laser and the corresponding pixel sizes for each centimeter at the given distance could be ascertained.

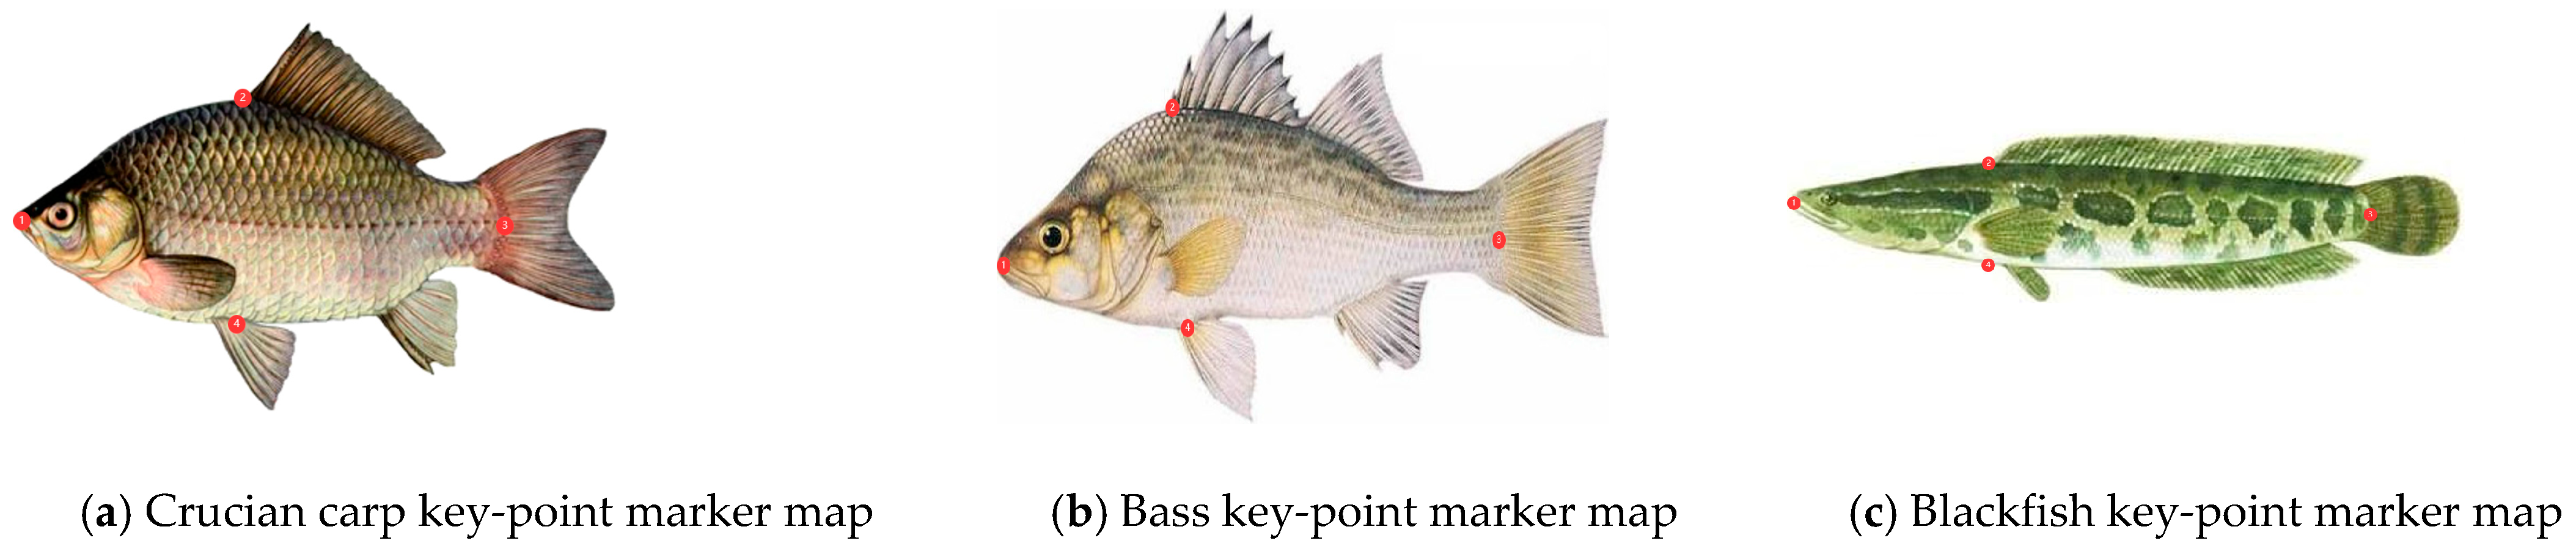
2.3.4. YOLOv8 Key-Point Detection Algorithm

The YOLOv8 model stands as the current state-of-the-art in computer vision technology, which presents a wide array of practical applications, encompassing target tracking, instance segmentation, image classification, and pose estimation, alongside target detection [22]. YOLOv8 is categorized into five variations: n, s, m, l, and x. The model’s complexity, in terms of both parameters and computational demands, escalates proportionally with its depth and width. Therefore, the suitable model configuration can be determined based on the specific requirements of the given task.
The YOLOv8 network model comprises three main components: the backbone network, neck network, and head network. In the backbone network, YOLOv8 utilizes CSPDarknet53 as its backbone. This backbone consists of a series of residual blocks containing convolutional layers, batch normalization layers, and activation functions, allowing CSPDarknet53 to extract high-level features from images by stacking multiple residual blocks. The neck network functions as an intermediary layer in the YOLOv8 model, responsible for merging and processing the features extracted by the backbone network. YOLOv8 adopts the FPN+PAN structure in its neck network. Here, FPN aids in merging features across different scales of feature maps, while PAN facilitates merging features within the spatial dimension of the feature maps. The head network, located at the top layer of the YOLOv8 model, focuses on target classification and localization. YOLOv8 combines the DBL (Doubly Bounded Linear) and CIOU (Complete Intersection over Union) loss functions for the head network’s loss function. DBL aims to enhance target detection accuracy, whereas CIOU loss addresses issues related to target overlap. Moreover, YOLOv8 employs predefined Anchor Boxes to predict target locations and sizes, which are evenly distributed on the feature map acting as default target boxes to determine target location and size based on their alignment with actual targets.

2.3.5. Fish Measurement Calculations

The YOLOv8 model is utilized for detecting targets and key points. During the imaging phase of detection, two endpoints of the laser line are selected for line-laser extraction. The actual distances from these endpoints to the camera are determined by establishing a right triangle, as illustrated in Figure 4a. The length of side BC is calculated using Equation (5), while the length of side AC is derived using Equation (6). Additionally, angle α, which represents the inclination of the fish body, is computed using Equation (7). Upon identifying the key points, line P1-P3 denotes the fish body’s length, whereas line P2-P4 represents the width of the fish body. The intersection of laser detection lines D1 and D2 serve as reference points for converting pixel dimensions to real dimensions to determine the size of the fish body. Thus, the length of the inclined fish body is determined using Equation (8), and the width of the fish body is calculated using Equation (9).
L B C = L 1 L 2
where L1 and L2 represent the distance from the camera to the two endpoints of the laser, as shown in Figure 5a
L A C = X B X A × f Y A
where X A ,   X B denote the horizontal coordinates of points A and B in Figure 5a, and f Y A denotes the longitudinal coordinate of point A brought into the distance mapping function.
α = tan 1 L B C L A C
where L B C denotes the BC edge length and L A C denotes the AC edge length.
L = X P 3 X P 1 2 + Y P 3 Y P 1 2 × f Y D 1 cos α
where X p 3 ,   X p 1 denote the horizontal coordinates of points P3 and P1 in Figure 4a, Y p 3 ,   Y p 1 denote the vertical coordinates of points, and f Y D 1 denotes that the vertical coordinate of point D1 is brought into the distance mapping function.
W = X P 4 X P 2 2 + Y P 4 Y P 2 2 × f Y D 2
where X p 4 ,   X p 2 denote the horizontal coordinates of points P4 and P2 in Figure 4b, Y p 4 ,   Y p 2 denote the vertical coordinates of points, f Y D 2 denotes that the vertical coordinate of point D2 is brought into the distance mapping function.

2.4. Experimental Evaluation Indicators

2.4.1. Distance Calibration Evaluation Indicator

This study evaluated the accuracy of distance calibration from the camera to the calibration plate by employing the root-mean-square error (RMSE) as a measurement metric. Equation (10) was applied to determine the RMSE for assessing the results of the distance calibration process.
R M S E = i = 1 n ( y i x i ) 2 n  
where yi is the actual observed value, xi is the predicted value, and n is the sample size.

2.4.2. YOLOv8 Model Evaluation Metrics

The study assessed the impact of YOLOv8 fish identification and key-point modeling by considering precision (P), recall (R), balanced score (F1), model parameters, floating-point operations (FLOPs), detection accuracy, completeness (P-IR) curves, and F1 curves to evaluate the performance of the target detection model.
Precision and recall are calculated as shown in Equations (11) and (12)
P = T P T P + F P  
R = T P T P + F N  
MAP (mean average precision) is a commonly employed evaluation metric used to assess a model’s detection performance across diverse categories. Average precision is calculated by constructing a precision–recall curve (P–R curve), which involves determining precision and recall values for each category based on the model’s predictions and true labels. A series of precision values is then calculated by varying thresholds within a recall range of 0 to 1. The average precision for a category is obtained by calculating the area under the precision–recall curve of that category. The computation of MAP is expressed by Equation (13).
M a p = 1 n i = 1 n A P i  
where n is the number of categories in the experiment.

2.4.3. Indicators for Evaluating Fish Body Measurements

The fish measurement algorithm’s effectiveness was assessed using absolute error (AE), relative error (RE), and standard deviation (SD) as evaluation metrics. The formulas for AE, RE, and SD are provided in Equations (14)–(16).
A E = 1 n i = 1 n | y i y ^ i |
where y i denotes experimental measurements, y ^ i denotes true measurements, and n denotes the number of samples.
R E = 1 n i = 1 n | y i y ^ i y i |
where y i denotes experimental measurements, y ^ i denotes true measurements, and n denotes the number of samples.
S D = 1 n i = 1 n ( y i y ¯ ) 2
where y i denotes the experimental measurements, y ¯ denotes the sample mean, and n denotes the sample size.

3. Results

3.1. Camera Calibration and Distance Calibration Results

Camera distortion causes straight-line bending in the image, which affects line-laser detection in this study. In this paper, the camera is calibrated with the help of Zhang Zhengyou calibration board, and Figure 5a is the image captured when the camera is not calibrated, and Figure 5b is the image after calibration using the camera calibration parameters. Line-laser candidate points were extracted from the above images to obtain the corresponding images in Figure 6, respectively. The original image acquired by the camera has line-laser bending (Figure 6a), and after calibration, the line laser can be detected in a straight line (Figure 6b). The camera calibration results can correct the acquired curved line laser to a straight-line laser, which can support the subsequent line-laser detection.
Determining the distance between the fish and the camera using the line laser’s longitudinal coordinates is essential for calculating the fish’s tilt angle. Our analysis of the scatter plot depicting the line laser’s longitudinal coordinates against the camera distance reveals a nonlinear relationship. The findings in Figure 7a illustrate that as the error of the third-degree polynomial fit reaches 6.8 pixels in this study, the rate of decrease in higher polynomial errors diminishes, gradually declining to 5.7 pixels with the 20th polynomial fit. The selection of a third-degree polynomial for subsequent experimental calculations was based on a balance between precision and computational efficiency. The curve of the third-degree polynomial fitting result is shown in Figure 7b.
To ascertain the precise dimensions of the fish body in terms of length and width, it is imperative to convert the measured pixel dimensions into real-world units. The experimental data validate a clear correlation between the distance from the calibration plate to the camera and both the vertical position of the line-laser point and the density of pixels per centimeter on the calibration plate. This correlation facilitates the establishment of a connection between the longitudinal coordinates of the line laser and the pixel density on the calibration plate, as depicted in Figure 8. This relationship enables the accurate derivation of the actual length of the fish body on the analyzed plane from the acquired line-laser data.

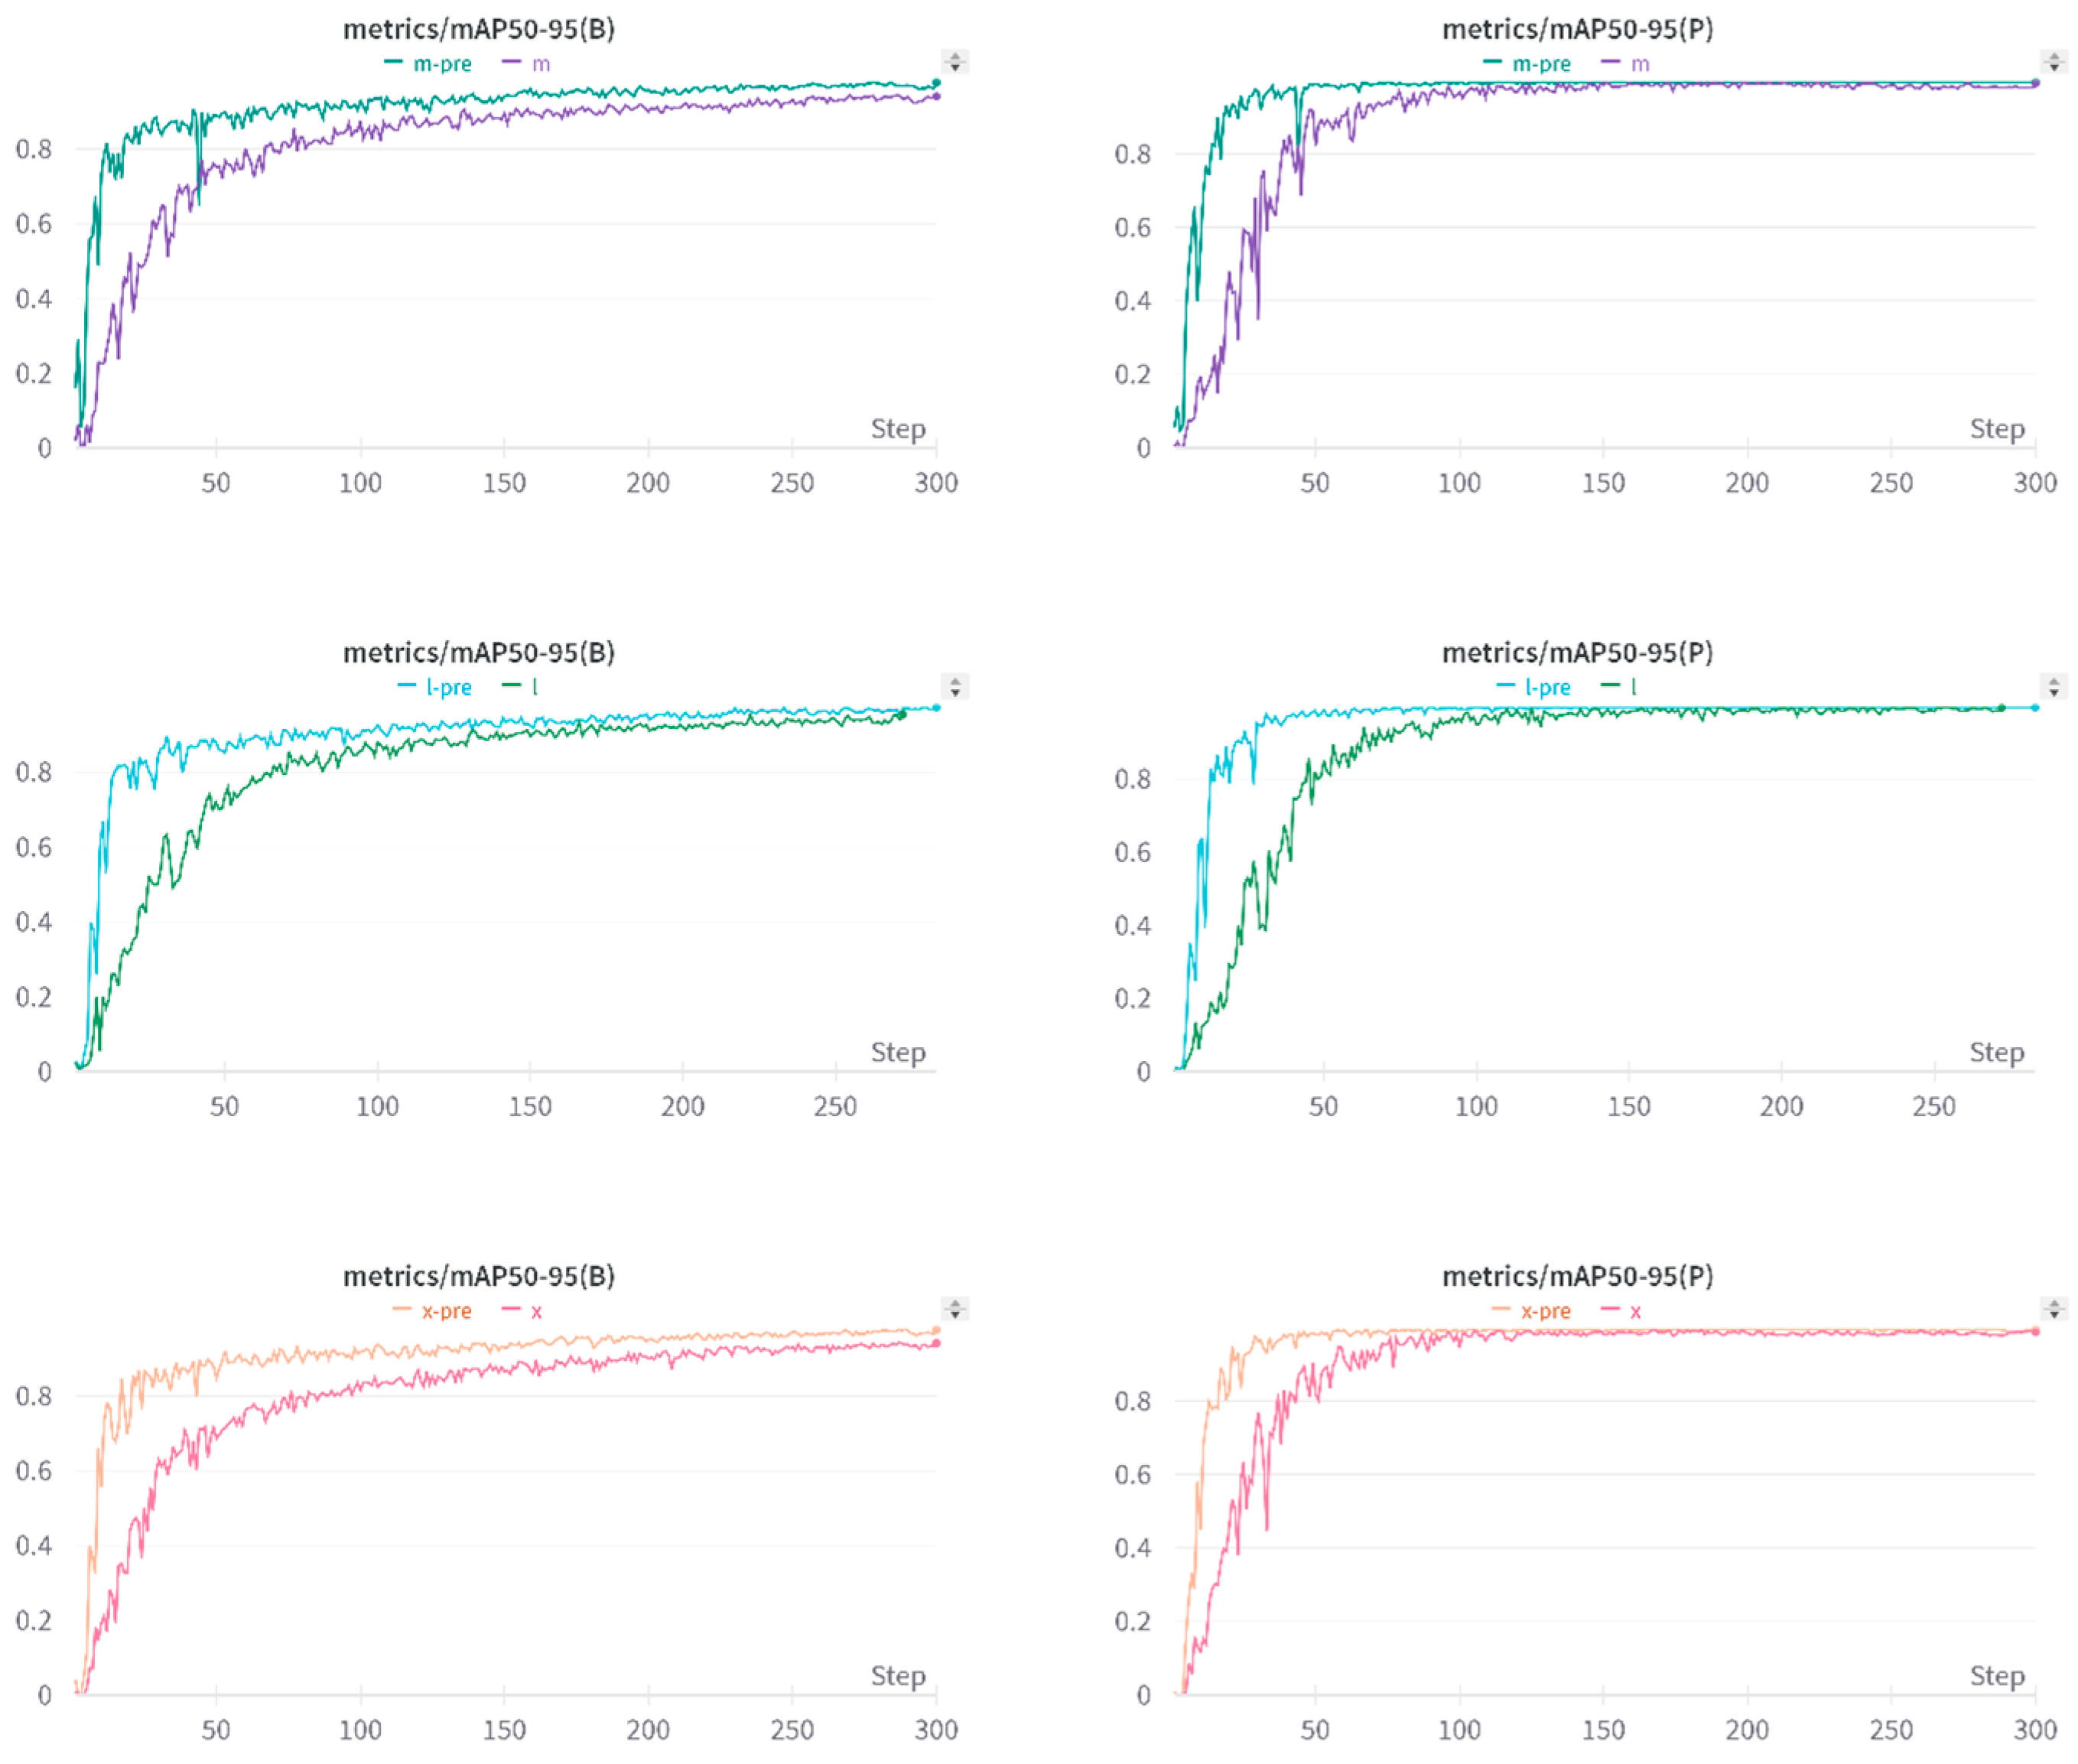
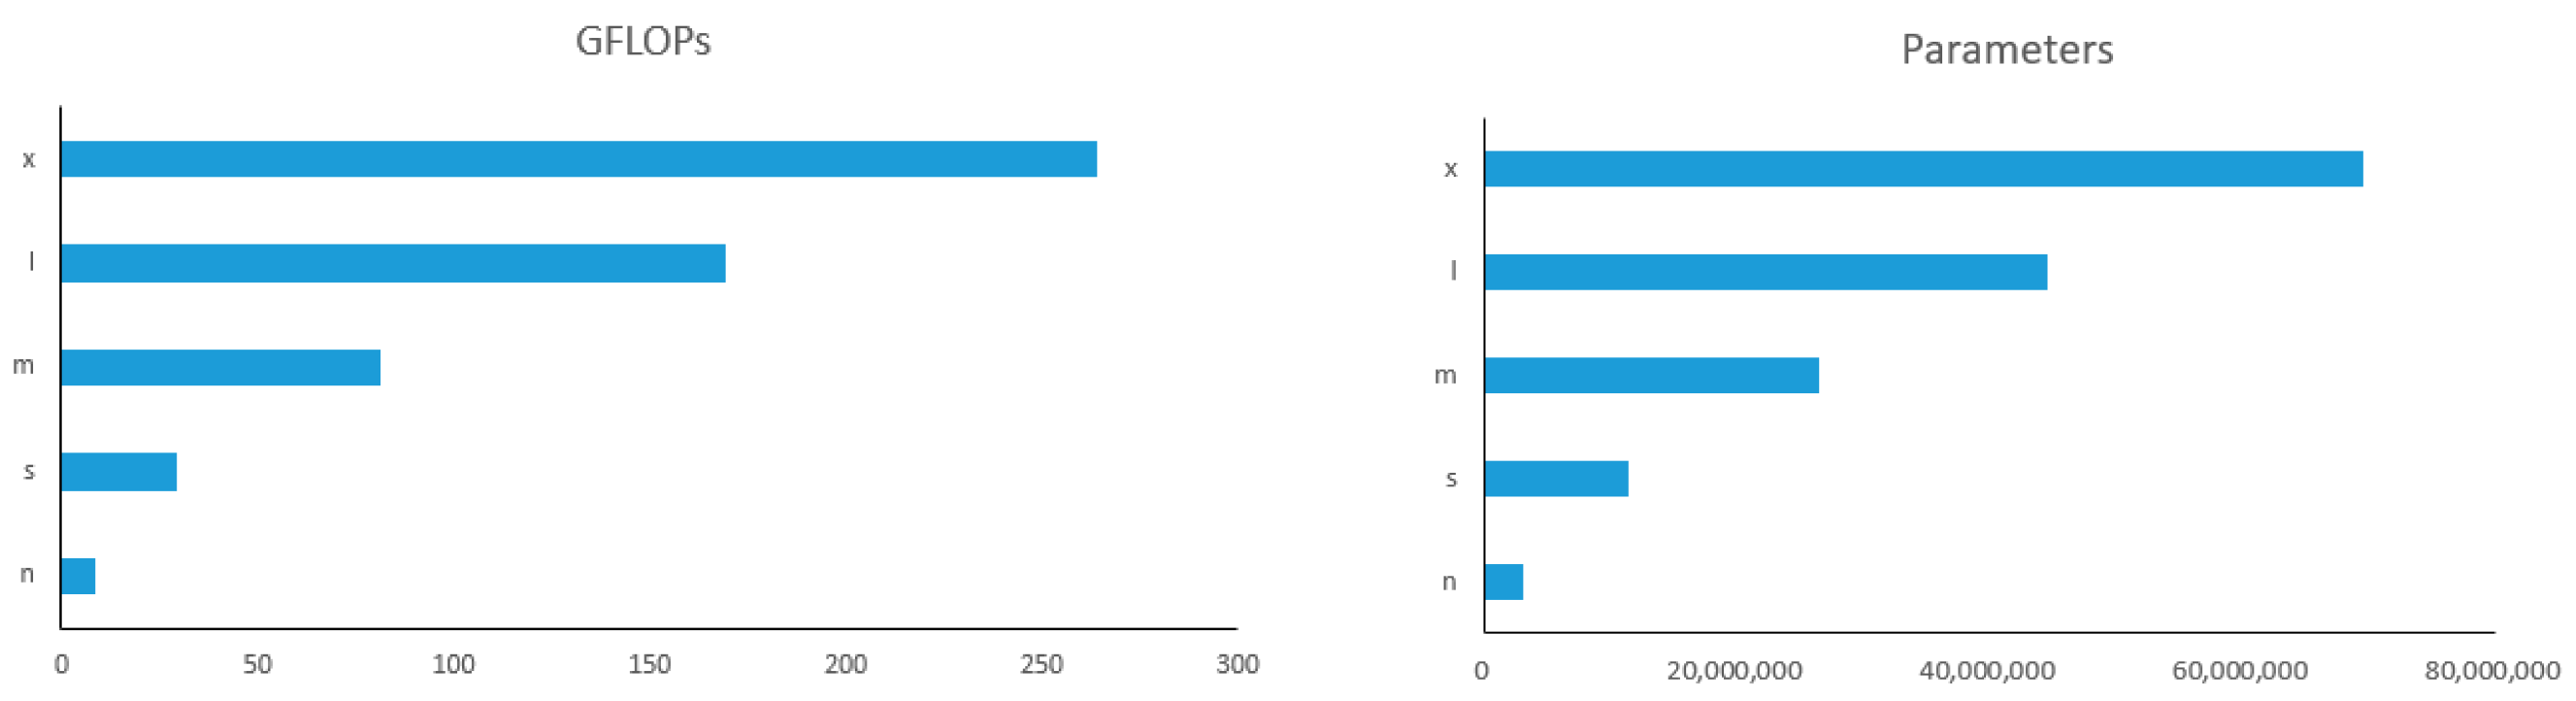
3.2. YOLOv8 Model Test Results

Migration learning utilizes data from the source domain to achieve favorable outcomes despite limited data in the target domain. By leveraging prior knowledge and expertise, migration learning reduces the training time and sample size in the target domain, enhancing the model’s adaptability to changes and complexities in that domain, and thus improving overall generalization capacity [23]. This study involved training 5 variations of the YOLOv8 model (n, s, m, l, and x) for 300 rounds in both pre-training and non-pre-training modes. The pre-training models are distinguished by the suffix -pre. For example, the pre-training YOLOv8-n model is denoted as YOLOv8-n-pre. The results, shown in Figure 9, demonstrate that the pre-training model exhibits faster convergence in detecting frames and achieves a higher map50-95 value compared to the non-pre-training model. Likewise, in the task of detecting key points, the pre-trained model shows quicker convergence without compromising map50-95 values in comparison to the non-pre-trained model. Consequently, the YOLOv8 pre-trained model delivers superior performance on the dataset under consideration. Therefore, the subsequent analysis will focus solely on comparisons among pre-trained models.
This study presents the results of employing six pre-trained YOLOv8 models for fish identification and key-point detection on the test set, as detailed in Table 2. Among these models, YOLOv8-n-pre stands out for its relatively small size of 6.5 M. In terms of accuracy, all models except YOLOv8-n-pre demonstrate a fish identification frames accuracy exceeding 99.5%, with a marginal accuracy gap of less than 1% compared to YOLOv8-n-pre. Notably, both YOLOv8-n-pre and YOLOv8-m-pre models achieve the highest detection frame MAP (50-90) of 0.966, while the YOLOv8-m-pre model attains the highest MAP (50-90) of 0.995 for key-point detection.
In deep learning models, the size and complexity directly influence their practical utility. The size impacts processing speed, while complexity is often assessed through parameters and floating-point operations (FLOPs). These aspects combined determine the computational burden and, consequently, the processing speed [24]. For instance, GFLOPS, which stands for Giga Floating-point Operations Per Second, is a measure of GPU performance indicating the number of floating-point operations that can be executed in a second, with a unit of a billion (109). The higher this metric, the greater the computational power and the faster the processing speed. As shown in Figure 10, the YOLOv8-n-pre model features fewer parameters and GFLOPS than other models, suggesting its relative simplicity and quicker processing. Nonetheless, its detection accuracy and mean average precision (MAP) are on par with top models, rendering it suitable for tasks such as fish identification and key-point detection.

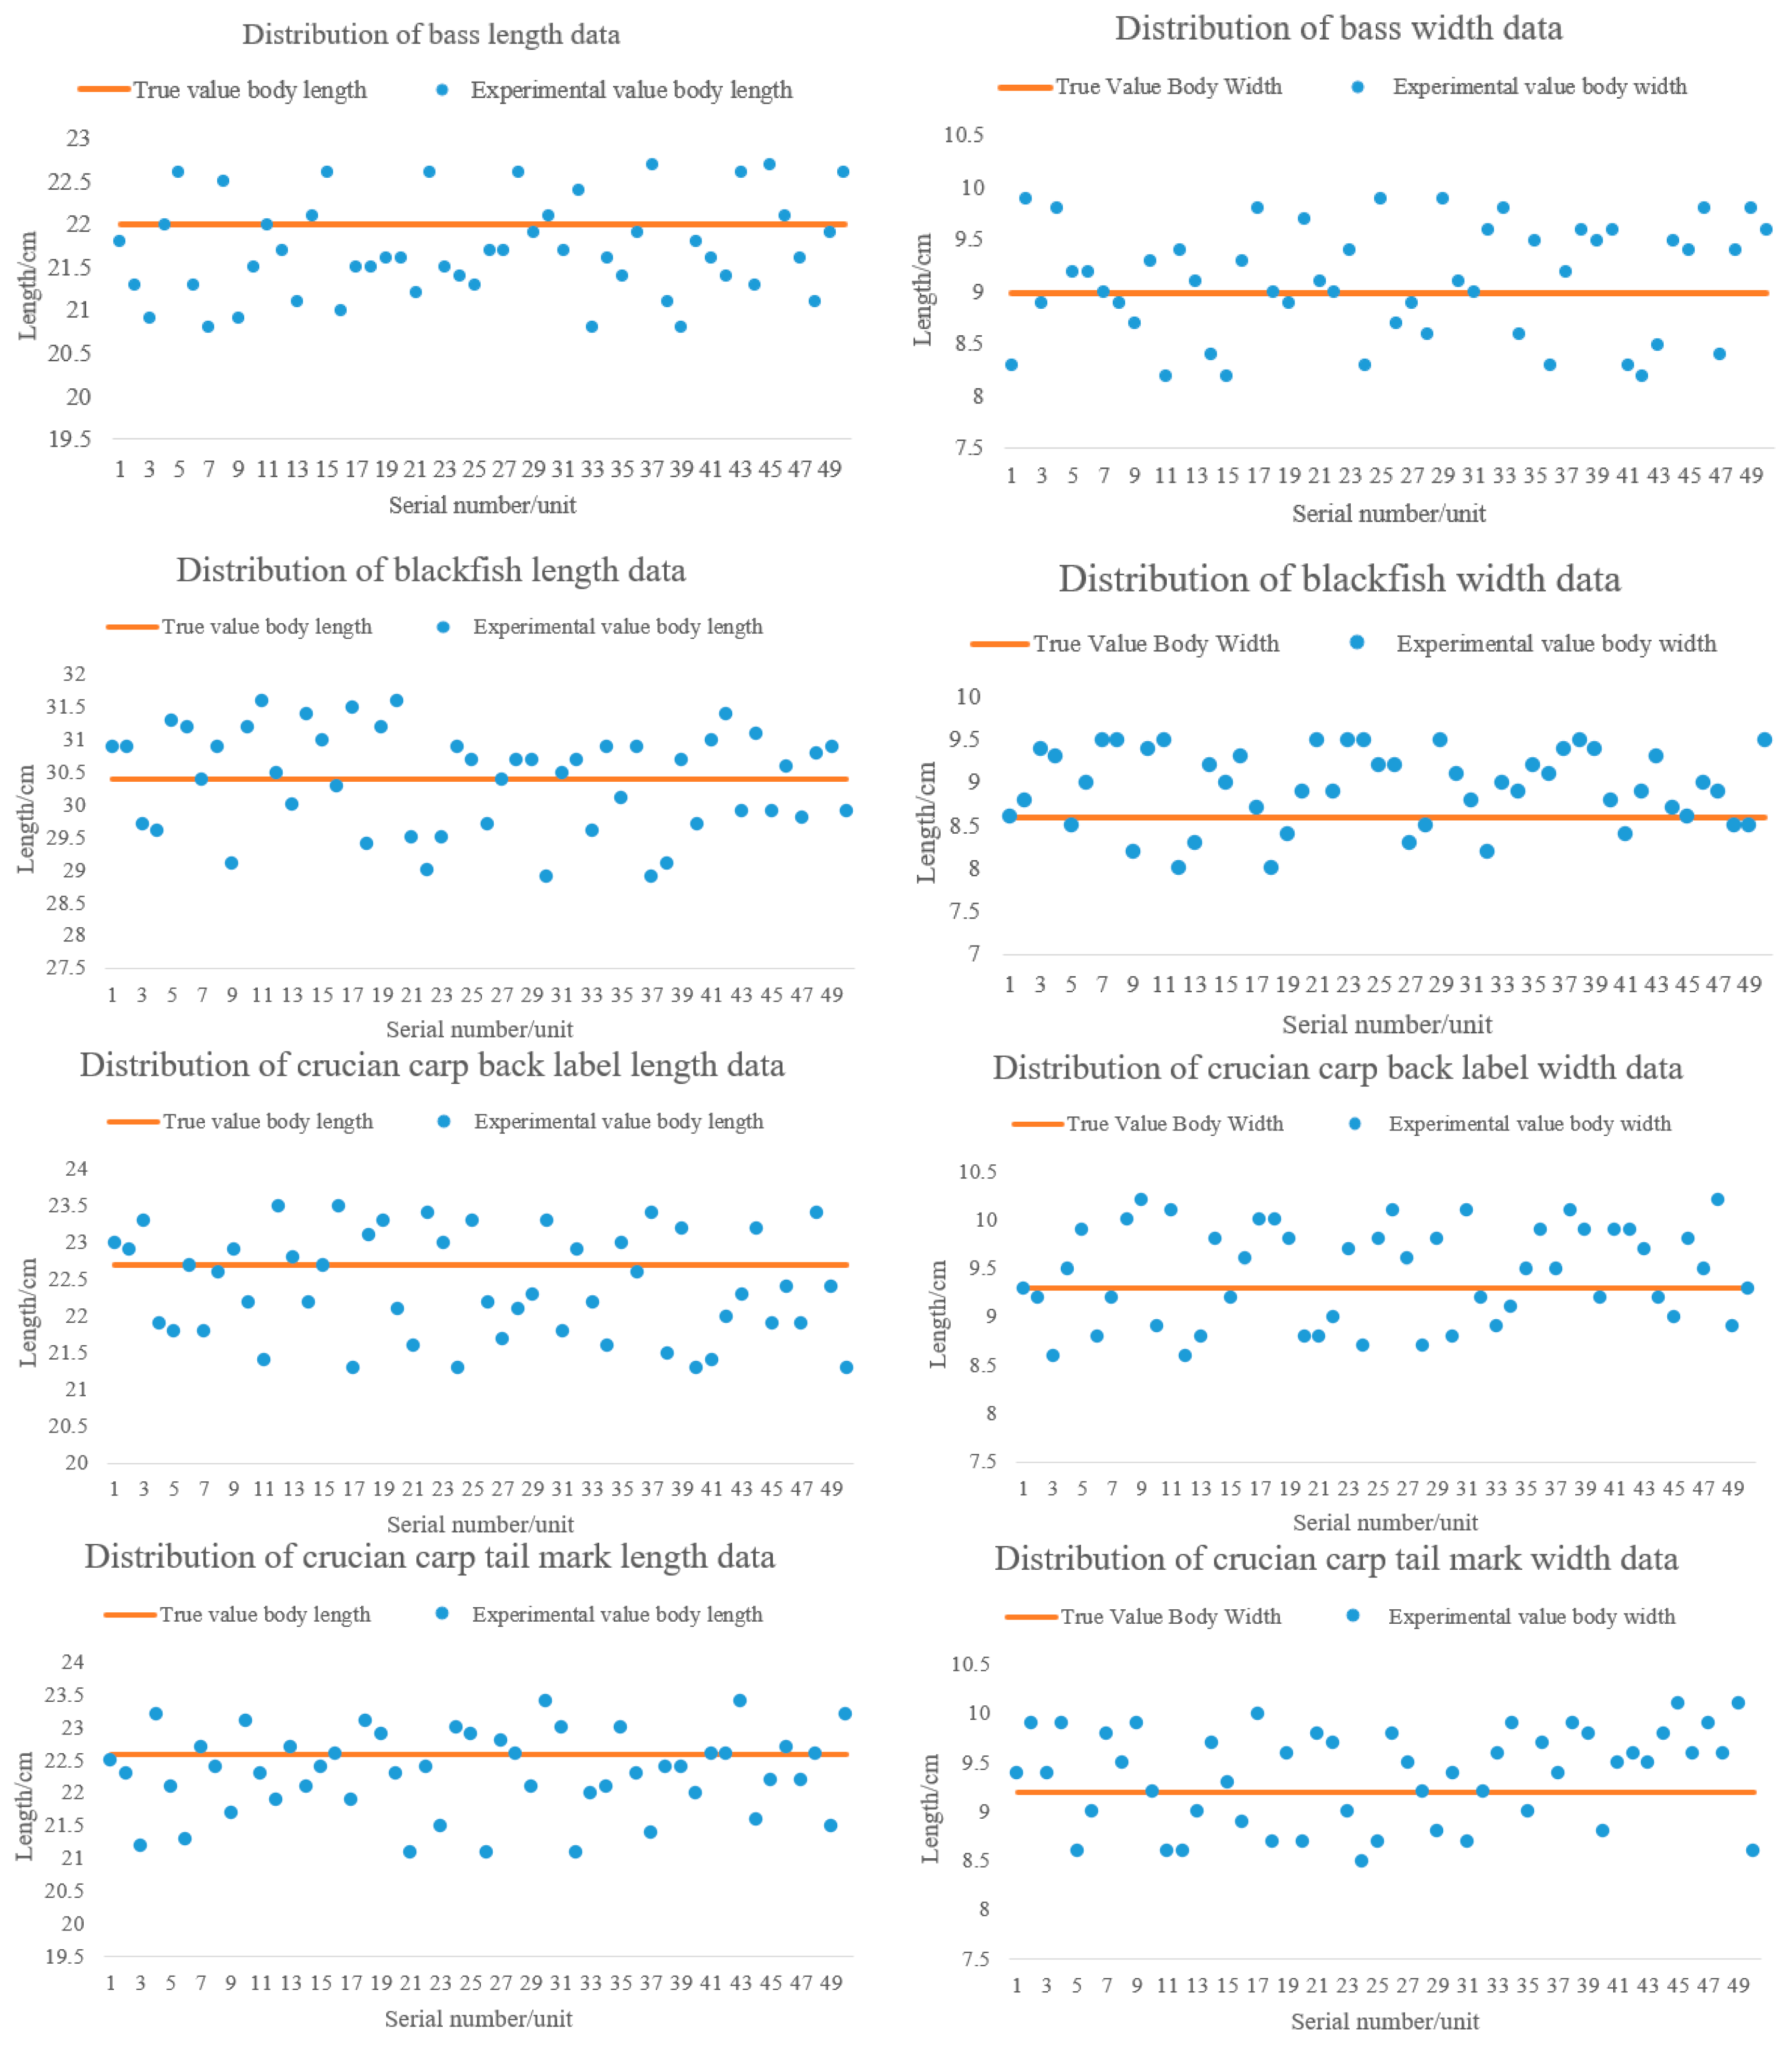
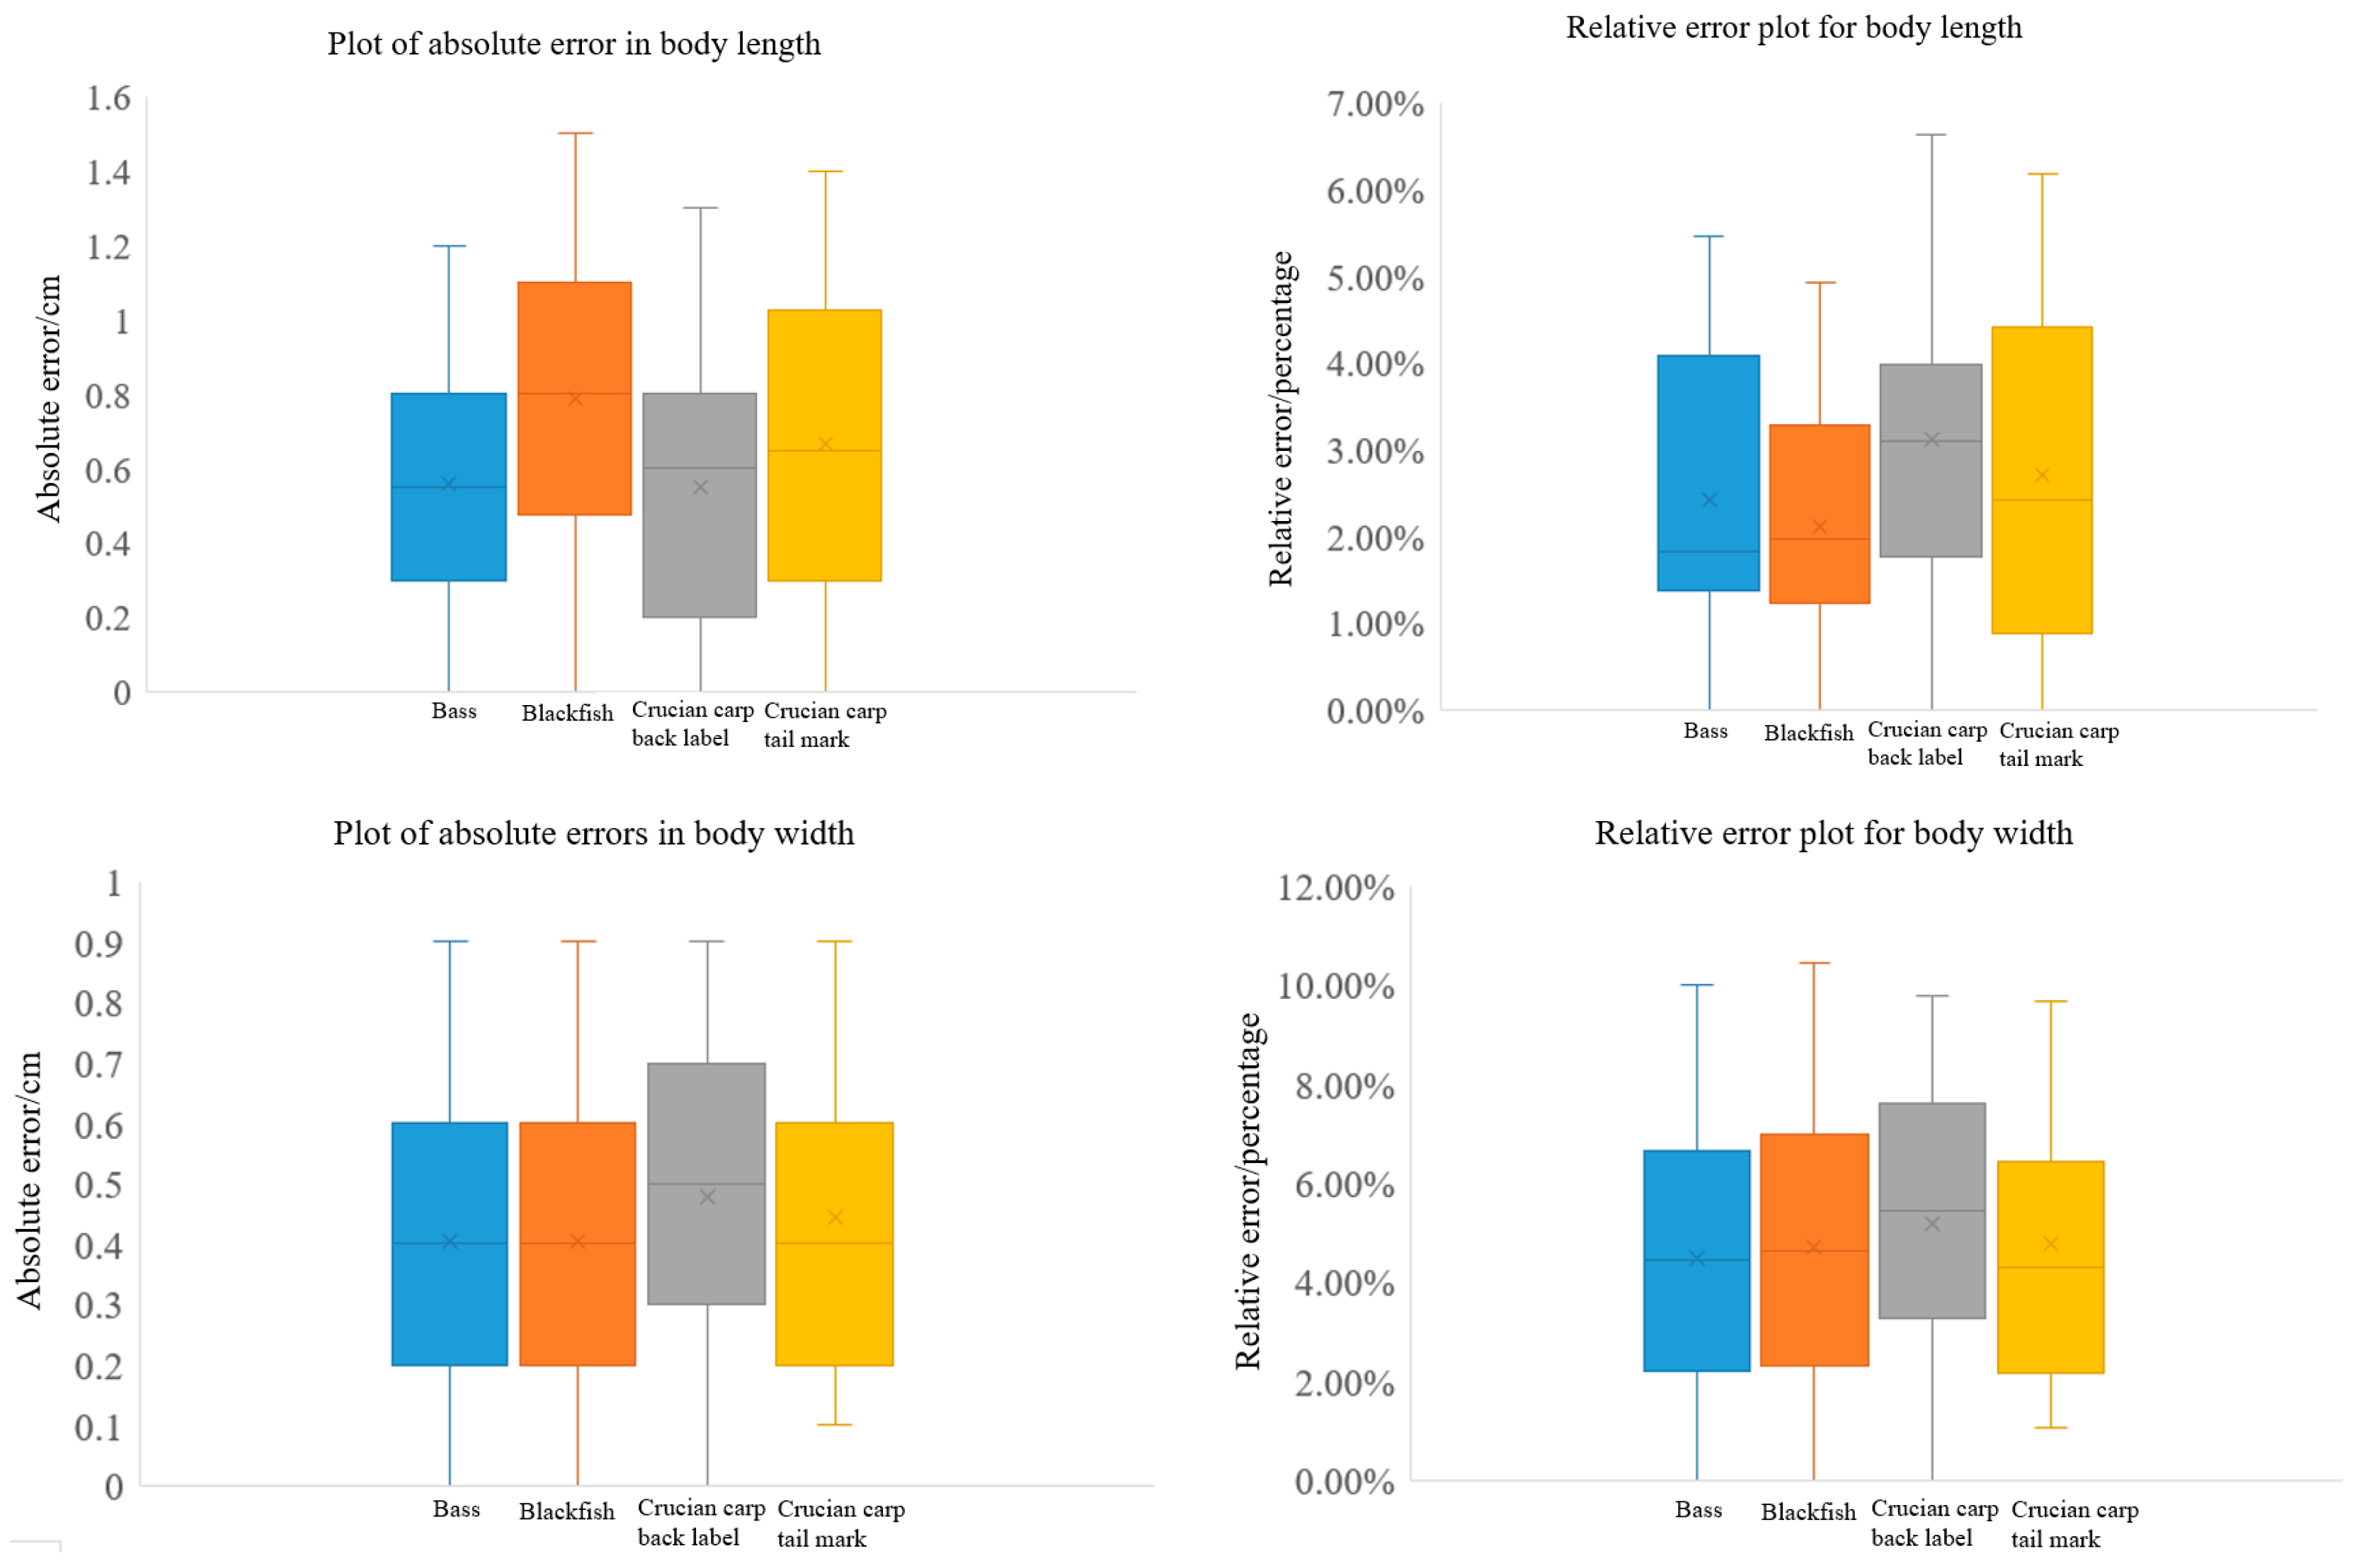
3.3. Fish Body Measurements

The study involved the calculation of absolute and relative errors by comparing automatic and manual measurements of the body length and width of the four experimental fish. The consistency of the automatic measurements was assessed through the analysis of standard deviations. Among the automatically measured body lengths (refer to Table 3), the blackfish and perch exhibited the largest absolute errors at 1.5 cm each, with an average absolute error of 0.58 and a relative error of 6.64%. Furthermore, the crucian carp tail markers displayed an average relative error of 2.46%. Concerning body width measurements (see Table 4), the highest recorded absolute error was 0.9 cm, with an average absolute error of 0.46 and a relative error of 10.47%—the most significant among all observed errors. Blackfish measurements showed the highest relative error at 10.47%, while the average relative error was 2.46%. The standard deviation range was 0.6–0.77, indicating a narrower dispersion of automatic measurement values, leading to a better stability of results. The distribution of both automatic and manual measurement results is visualized in Figure 11.
The box plots effectively demonstrate the clustering and bias within the data. In order to facilitate the analysis of measurement errors, both absolute and relative errors were statistically depicted in box plots (refer to Figure 12). The absence of anomalies in error values indicates overall measurement stability, as all lower whiskers align with the horizontal axis, signifying zero-centimeter absolute error occurrences. When examining absolute errors, the upper whiskers for body length fluctuate within a range of 0.3 cm, whereas for body width, it is 0.9 cm. The consistent distribution of error box plots denotes minimal dispersion in the measurement data, confirming the method’s stability.

4. Discussion

In this study, dual cameras were employed to increase the quantity of fish images captured using lasers for training the YOLOv8 model. This configuration enabled the collection of fish images from various perspectives and visual fields, ultimately enhancing the diversity and comprehensiveness of the training dataset.
Camera calibration plays a critical role in ensuring the precision and accuracy of underwater tilted fish-body measurement models. By calibrating the camera, both its internal and external parameters can be determined, allowing for the calibration and correction of acquired images [25]. The effective utilization of these calibration parameters helps eliminate aberrations introduced by the camera, including camera and radial aberrations [26]. Camera aberrations arise from imperfections in the lens system, leading to distortion in object shapes within images. Conversely, radial aberrations occur due to the spherical curvature of the lens, resulting in distorted straight lines and edges in images. Both types of aberrations significantly impact the accuracy of line laser and key-point position detection. Through thorough camera calibration, errors resulting from these aberrations can be minimized, thereby enhancing the precision and accuracy of measurements and establishing a robust foundation for the applications of fish-body measurement models.
Research in fish biology and aquaculture has inadequately addressed the measurement of underwater tilted fish bodies, resulting in a limited understanding of fish body tilt angles. The tilt angle of a fish’s body is crucial for comprehending fish behavior, aquaculture management, and ecological monitoring. This study introduces a line-laser calibration method to accurately measure underwater tilted fish bodies’ tilt angles. By deploying a line laser in the aquatic environment and using a camera for data acquisition, we captured image data of fish bodies at various tilt angles. Analyzing this data allowed us to establish a correlation between the line laser’s position and the fish’s tilt angle. This calibration method enables precise calculation of fish body tilt angles, presenting a novel approach to studying underwater tilted fish bodies. While fish can theoretically swim at various angles, except backward, when free-swimming, in a stable water flow within a breeding tank, the primary tilt angle typically aligns perpendicularly to the tank’s bottom. This study focuses on measuring this specific type of fish’s body inclination. However, due to the limited field of view of a single camera, accurately detecting four key points for fish tilted at any angle perpendicular to the bottom is unattainable.
In the realm of fish key-point detection, Shi Xiaotao et al. [27] introduced a novel model that enhances network structure, optimizes anchor frame size, and processes fish key points using the RetinaFace algorithm. The precision of fish key-point recognition is exceptionally high, achieving accuracy, recall rate, and average precision of 97.12%, 95.72%, and 96.42% respectively. Additionally, the model exhibits a notable recognition speed of up to 32 frames per second for fish targets and key points. Zeng et al. [28] proposed the HRNet key-point detection model tailored to the morphological features of juvenile yellowtail, achieving a prediction accuracy exceeding 96%. This model demonstrates versatility in detecting fishes of various sizes and complex morphological traits. Similarly, Zhu et al. [29] developed an enhanced AlexNet model for feature point detection, specifically adept at diverse fish size detection, and proposed a method for freshwater fish-species identification leveraging feature point detection. These studies exemplify the expanding use of fish key-point detection in fish culture monitoring, facilitating the precise marking of crucial fish body parts and providing detailed fish-body measurement data. Compared to traditional bounding box detection, key-point detection offers more precise localization of specific fish body parts, enhancing measurement accuracy.
In this study, five different scale models of the YOLOv8 algorithm, namely n, s, m, l, and x, were utilized to assess their effectiveness in detecting fish and key points. The pre-trained YOLOv8 models demonstrated faster convergence speed and higher mean average precision (MAP) (ranging from 50 to 95), particularly in the tasks of bounding box and key-point detection. This highlights the usefulness of transfer learning when dealing with limited data in the target domain. Among these models, YOLOv8-n-pre, with a smaller size of 6.5M and fewer parameters, achieved a faster running speed while still maintaining detection accuracy and comparable MAP values to the optimal model. Consequently, it stands as a compelling option for resource-constrained or real-time applications. Additionally, the model’s low complexity contributes to reduced inference time and computational resource usage, making it suitable for mobile devices or embedded systems. Although the YOLOv8-n-pre model may exhibit slightly lower accuracy compared to the other models, its strong generalization capability and cost-effectiveness make it a valuable choice for specific applications.
In this study, we conducted experiments using an underwater tilted fish-body measurement model based on YOLOv8 and line lasers. The analysis of the measurement data revealed consistently small errors, supported by calculation results from box plots and standard deviation indicating the model’s stability. A comparison of the absolute errors between body length and body width showed that body length had a larger absolute error due to its sensitivity to the fish body’s inclination compared to body width. However, in relative terms, the error for body length was smaller because of its larger value compared to body width. Hsieh et al. [30] determined the body length of tuna using the Hough transform algorithm, reporting an average error of 4.5% ± 4.4%. Despite its effectiveness, the Hough transform-based method requires transforming pixel points during processing, leading to the inclusion of many invalid sampling points, which increases memory consumption and reduces processing speed. Miranda et al. [31] employed a third-degree polynomial regression curve method to estimate the length of rainbow trout silhouettes, achieving an average absolute error of 1.413 cm in measurement results. However, polynomial-based methods pose challenges in maintaining fish orientation and position in practical scenarios. Huang Kangwei [32] proposed a fish-size measurement algorithm based on 3D rotating ellipsoid fitting, resulting in relative errors of 4.7% for body length and 9.2% for body width. In the current study, the average absolute errors for body length and width were 0.58 cm and 0.46 cm, while the average relative errors were 2.46% and 5.11%, respectively, indicating improved experimental outcomes compared to previous research.

5. Conclusions

This study presents a measurement model aiming to non-destructively measure the tilt of underwater fish bodies by integrating line-laser technology and YOLOv8. The model is designed to accurately assess the tilt angle of fish bodies underwater through the utilization of line-laser detection and calibration methods. Additionally, the model integrates the correlation between pixel distances and real lengths, alongside the YOLOv8-n-pre key-point detection model, to establish a reliable approach for gauging the tilt of underwater fish bodies.
Fish body length and width were measured based on the data collected in this study. The findings revealed that the absolute error in body length was less than 1.5 cm, with an average of 0.58 cm and a relative error of 2.46%. Similarly, the absolute error in body width was less than 0.9 cm, with an average of 0.46 cm and a relative error of 5.11%.
It is recommended that future research focuses on gathering a larger database to automate underwater measurements for a broader range of farmed fish species. Additionally, it is ideal for tanks to maintain clean and clear water; however, this is not always the case in both aquaculture and natural tanks. Moreover, when fish change their direction of movement, their bodies undergo bending, resulting in more complex biomechanics and optical distortion that can affect the accuracy of laser-line guidance. Therefore, it is necessary to integrate target-tracking technology to monitor the length and width of fish continuously over a specified period. Since the changes in fish size within this time sequence are generally small, a filtering mechanism can be implemented to identify and discard abnormal measurements that deviate from the overall trend. By adopting this approach, it is believed that measurement errors caused by aquaculture water pollution or fish body bending can be moderately reduced, thereby enhancing the accuracy and reliability of the measurement results.

Author Contributions

J.L. (Jiakang Li): Conceptualization, Methodology, Software, Investigation, Writing—Original draft, Writing—Review and editing. S.Z.: Conceptualization, Methodology, Writing—Review and editing. P.L.: Visualization, Formal analysis. Y.D.: Resources, Data curation. Z.W.: Formal analysis, Data curation. All authors have read and agreed to the published version of the manuscript.

Funding

National Natural Science Foundation of China under Grant No. 61936014, This research was funded by the Laoshan Laboratory under Grant No. LSKJ202201804.

Institutional Review Board Statement

The focus of this study is measuring the bodies of underwater fish with inclined positions and does not involve any commercial interests. The fish involved in the experiment are commercially cultivated and do not belong to rare protected species. The experiment does not involve animal welfare and is a normal behavioral experiment. No other treatments were applied, and no harm was caused to the fish during this experiment.

Data Availability Statement

As the data for this study are still being further collected and processed, a complete dataset is not available at this time. We recognize the importance of data and understand that other researchers may be interested in our study and would be happy to provide further support and assistance if they require data support or would like to communicate with us. We can be contacted by email or other appropriate means and will be happy to support other researchers with data or related research.

Conflicts of Interest

The authors declare no conflicts of interest.

References

  1. Li, D.; Du, L. Recent advances of deep learning algorithms for aquacultural machine vision systems with emphasis on fish. Artif. Intell. Rev. 2022, 55, 4077–4116. [Google Scholar] [CrossRef]
  2. Zhang, S.; Li, J.; Tang, F.; Wu, Z.; Dai, Y.; Fan, W. Research progress on fish farming monitoring based on deep learning technology. Trans. Chin. Soc. Agric. Eng. (Trans. CSAE) 2024, 40, 1–13. [Google Scholar]
  3. Li, Z.; Zhao, Y.; Yang, P.; Wu, Y.; Li, Y.; Guo, R. Review of Research on Fish Body Length Measurement Based on Machine Vision. Trans. Chin. Soc. Agric. Mach. 2021, 52, 207–218. [Google Scholar]
  4. Duan, Y.; Li, D.; Li, Z.; Fu, Z. Review on visual characteristic measurement research of aquatic animals based on computer vision. Trans. Chin. Soc. Agric. Eng. (Trans. CSAE) 2015, 31, 1–11. [Google Scholar]
  5. Papadakis, V.M.; Papadakis, I.E.; Lamprianidou, F.; Glaropoulos, A.; Kentouri, M. A computer-vision system and methodology for the analysis of fish behavior. Aquac. Eng. 2012, 46, 53–59. [Google Scholar] [CrossRef]
  6. Zhang, J.; Zhang, S.; Fan, W.; Tang, F.; Yang, S.; Sun, Y.; Wang, S.; Liu, Y.; Zhu, W. Research on target detection of Engraulis japonicuspurse seine based on improved YOLOv5 model. Mar. Fish. 2023, 45, 618–630. [Google Scholar] [CrossRef]
  7. Pei, K.; Zhang, S.; Fan, W.; Wang, F.; Zou, G.; Zheng, H. Research progress of fish video tracking application based on computer vision. Mar. Fish. 2022, 44, 640–647. [Google Scholar] [CrossRef]
  8. Zhang, J.; Zhang, S.; Wang, S.; Yang, Y.; Dai, Y.; Xiong, Y. Recognition of Acetes chinensis fishing vessel based on 3-2D integrationmodel behavior. South China Fish. Sci. 2022, 18, 126–135. [Google Scholar]
  9. Palmer, M.; Álvarez-Ellacuría, A.; Moltó, V.; Catalán, I.A. Automatic, operational, high-resolution monitoring of fish length and catch numbers from landings using deep learning. Fish. Res. 2022, 246, 106166. [Google Scholar] [CrossRef]
  10. Yu, C.; Hu, Z.; Han, B.; Wang, P.; Zhao, Y.; Wu, H. Intelligent measurement of morphological characteristics of fish using improved U-Net. Electronics 2021, 10, 1426. [Google Scholar] [CrossRef]
  11. Ou, L.; Li, W.; Liu, B.; Chen, X.; He, Q.; Qian, W.; Li, W.; Hou, Q.; Shi, Y. Analysis of phenotype texture features of three Thunnus species based on computer vision. J. Fish. Sci. China 2022, 29, 770–780. [Google Scholar]
  12. Wang, Y.; Wang, J.; Xin, R.; Ke, Q.Z.; Jiang, P.X.; Zhou, T.; Xu, P. Application of computer vision in morphological and body weight measurements of large yellow croaker (Larimichthys crocea). J. Fish. China 2023, 47, 207–216. [Google Scholar]
  13. Zhou, J.; Ji, B.; Ni, W.; Zhao, J.; Zhu, S.; Ye, Z. Non-contact method for the accurate estimation of the full-length of Takifugu rubripes based on 3D pose fitting. Trans. Chin. Soc. Agric. Eng. (Trans. CSAE) 2023, 39, 154–161. [Google Scholar]
  14. Huang, K.; Li, Y.; Suo, F.; Xiang, J. Stereo vison and mask-RCNN segmentation based 3D points cloud matching for fish dimension measurement. In Proceedings of the 2020 39th Chinese Control Conference (CCC), Shenyang, China, 27–30 July 2020; pp. 6345–6350. [Google Scholar]
  15. Chicchon, M.; Bedon, H.; Del-Blanco, C.R.; Sipiran, I. Semantic Segmentation of Fish and Underwater Environments Using Deep Convolutional Neural Networks and Learned Active Contours. IEEE Access 2023, 11, 33652–33665. [Google Scholar] [CrossRef]
  16. Liu, Y.; Zhang, S.; Wang, S.; Wang, F.; Fan, W.; Zou, G.; Bo, J. Research on optimization of aquarium fish target detection network. Fish. Mod. 2022, 49, 89–98. [Google Scholar]
  17. Gupta, S.; Mukherjee, P.; Chaudhury, S.; Lall, B.; Sanisetty, H. DFTNet: Deep fish tracker with attention mechanism in unconstrained marine environments. IEEE Trans. Instrum. Meas. 2021, 70, 1–13. [Google Scholar] [CrossRef]
  18. Terven, J.; Cordova-Esparza, D. A comprehensive review of YOLO: From YOLOv1 to YOLOv8 and beyond. arXiv 2023, arXiv:2304.00501. [Google Scholar]
  19. Talaat, F.M.; ZainEldin, H. An improved fire detection approach based on YOLO-v8 for smart cities. Neural Comput. Appl. 2023, 35, 20939–20954. [Google Scholar] [CrossRef]
  20. Wang, T.; Wang, L.; Zhang, W.; Duan, X.; Wang, W. Design of infrared target system with Zhang Zhengyou calibration method. Opt. Precis. Eng. 2019, 27, 1828–1835. [Google Scholar] [CrossRef]
  21. Zhou, X.; Wang, H.; Li, L.; Zheng, S.; Fu, J.; Tian, Q. Line laser center extraction method based on the improved thinning method. Laser J. 2023, 44, 70–74. [Google Scholar] [CrossRef]
  22. Yang, S.; Wang, W.; Gao, S.; Deng, Z. Strawberry ripeness detection based on YOLOv8 algorithm fused with LW-Swin Transformer. Comput. Electron. Agric. 2023, 215, 108360. [Google Scholar] [CrossRef]
  23. Lin, Q.; Yu, C.; Wu, X.; Dong, Y.; Xu, X.; Zhang, Q.; Guo, X. Survey on Sim-to-real Transfer Reinforcement Learning in Robot Systems [J/OL]. J. Softw. 2024, 35, 1–28. [Google Scholar] [CrossRef]
  24. Sun, Y.; Chen, J.; Zhang, S.; Shi, Y.; Tang, F.; Chen, J.; Xiong, Y.; Li, L. Target detection and counting method for Acetes chinensis fishing vessels operation based on improved YOLOv7. Trans. Chin. Soc. Agric. Eng. (Trans. CSAE) 2023, 39, 151–162. [Google Scholar]
  25. Wang, S.; Meng, Z.; Gao, N.; Zhang, Z. Advancements in fusion calibration technology of lidar and camera. Infrared Laser Eng. 2023, 52, 20230427. [Google Scholar]
  26. Huang, W.; Peng, X.; Li, L.; Li, X.Y. Review of Camera Calibration Methods and Their Progress. Laser Optoelectron. Prog. 2023, 60, 9–19. [Google Scholar]
  27. Shi, X.; Ma, X.; Huang, Z.; Hu, X.; Wei, L.S. Fish Trajectory Extraction Based on Landmark Detection [J/OL]. J. Chang. River Sci. Res. Inst. 2024, 41, 30. [Google Scholar]
  28. Zeng, J.; Feng, M.; Deng, Y.; Jiang, P.; Bai, Y.; Wang, J.; Qu, A.; Liu, W.; Jiang, Z.; He, Q.; et al. Deep learning to obtain high-throughput morphological phenotypes and its genetic correlation with swimming performance in juvenile large yellow croaker. Aquaculture 2024, 578, 740051. [Google Scholar] [CrossRef]
  29. Zhu, M.; Li, M.; Wan, P.; Xiao, C.; Zhao, J. Identification of freshwater fish species based on fish feature point detection. Trans. Chin. Soc. Agric. Eng. (Trans. CSAE) 2023, 39, 155–164. [Google Scholar]
  30. Hsieh, C.L.; Chang, H.Y.; Chen, F.H.; Liou, J.-H.; Chang, S.-K.; Lin, T.-T. A simple and effective digital imaging approach for tuna fish length measurement compatible with fishing operations. Comput. Electron. Agric. 2011, 75, 44–51. [Google Scholar] [CrossRef]
  31. Miranda, J.M.; Romero, M. A prototype to measure rainbow trout’s length using image processing. Aquac. Eng. 2017, 76, 41–49. [Google Scholar] [CrossRef]
  32. Huang, K. Research and Implement of Machine Vision Based Underwater Dynamic Fish Size Measurement Method; Zhejiang University: Hangzhou, China, 2021. [Google Scholar]
Figure 1. Experimental setup diagram.
Fishes 09 00206 g001
Figure 2. Diagram of carp tagging.
Fishes 09 00206 g002
Figure 3. Diagram with key markers.
Fishes 09 00206 g003
Figure 4. Schematic diagram of fish-body measurement calculation.
Fishes 09 00206 g004
Figure 5. Underwater laser calibration diagram.
Fishes 09 00206 g005
Figure 6. Diagram of underwater laser horizontal-axis extraction.
Fishes 09 00206 g006
Figure 7. Diagram of underwater distance calibration results.
Fishes 09 00206 g007
Figure 8. Line-laser calibration result graph.
Fishes 09 00206 g008
Figure 9. YOLOv8 model training results graph.
Fishes 09 00206 g009aFishes 09 00206 g009b
Figure 10. YOLOv8 model parameter diagram.
Fishes 09 00206 g010
Figure 11. Distribution chart of fish-body measurements results.
Fishes 09 00206 g011
Figure 12. Boxplot of fish-body measurement results.
Fishes 09 00206 g012
Table 1. Data category annotation correspondence.
Mark NameNumber
Bass171
Blackfish145
Crucian carp back label165
Crucian carp tail mark180
Table 2. YOLOv8 training results.
ModelSize (M)Accuracy (Box)MAP (50-95)Accuracy (Points)MAP (50-95)
n-pre6.598.7%0.96698.7%0.993
s-pre23.199.5%0.95199.5%0.991
m-pre53.299.7%0.96699.7%0.995
l-pre89.499.6%0.95199.6%0.992
x-pre139.499.6%0.96199.6%0.993
Table 3. Results of body length measurements.
CategoriesAbsolute Error (cm)Mean Absolute Error (cm)Relative ErrorAverage Relative ErrorStandard Deviation
All category0~1.50.580%~6.64%2.46%
Bass0~1.20.500%~5.5%2.50%0.60
Blackfish0~1.50.650%~4.93%2.16%0.77
Crucian carp back label0~1.40.640%~6.17%2.85%0.70
Crucian carp tail mark0~1.50.520%~6.64%2.33%0.62
Table 4. Results of body width measurements.
CategoriesAbsolute Error (cm)Mean Absolute Error (cm)Relative ErrorAverage Relative ErrorStandard Deviation
All category0~0.90.460%~10.47%5.11%
Bass0~0.90.460%~10.0%5.13%0.53
Blackfish0~0.90.480%~10.47%5.60%0.45
Crucian carp back label0~0.90.450%~9.68%4.84%0.50
Crucian carp tail mark0~0.90.440%~9.78%4.87%0.48
Disclaimer/Publisher’s Note: The statements, opinions and data contained in all publications are solely those of the individual author(s) and contributor(s) and not of MDPI and/or the editor(s). MDPI and/or the editor(s) disclaim responsibility for any injury to people or property resulting from any ideas, methods, instructions or products referred to in the content.

