
Feeding Behaviour of Seven Icefish Species (Channichthyidae) in the Ross Sea, Antarctica

 ,
,  , , , and
Abstract
1. Introduction
2. Materials and Methods
2.1. Sampling
2.2. Morphological Traits
2.3. Development of Three-Dimensional (3D) Deformable Models
2.4. Statistical Analyses
3. Results
4. Discussion
Supplementary Materials
Author Contributions
Funding
Institutional Review Board Statement
Data Availability Statement
Acknowledgments
Conflicts of Interest
References
- Eastman, J.T. Antarctic Fish Biology: Evolution in a Unique Environment; Academic Press: San Diego, CA, USA, 1993. [Google Scholar]
- Near, T.J.; Dornburg, A.; Eytan, R.I.; Keck, B.P.; Smith, W.L.; Kuhn, K.L.; Moore, J.A.; Price, S.A.; Burbrink, F.T.; Friedman, M.; et al. Phylogeny and tempo of diversification in the superradiation of spiny-rayed fishes. Proc. Natl. Acad. Sci. USA 2013, 110, 12738–12743. [Google Scholar] [CrossRef]
- Eastman, J.T.; Eakin, R.R. Checklist of the species of notothenioid fishes. Antarct. Sci. 2021, 33, 273–280. [Google Scholar] [CrossRef]
- Kock, K.H. Antarctic Fish and Fisheries; Cambridge University Press: Cambridge, UK, 1992. [Google Scholar]
- Mintenbeck, K.; Barrera-Oro, E.R.; Brey, T.; Jacob, U.; Knust, R.; Mark, F.C.; Moreira, E.; Strobel, A.; Arntz, W.E. Impact of climate change on fishes in complex Antarctic ecosystems. In Advances in Ecological Research; Academic Press: London, UK, 2012; Volume 46, pp. 351–426. [Google Scholar]
- Eastman, J.T.; McCune, A.R. Fishes on the Antarctic continental shelf: Evolution of a marine species flock? J. Fish. Biol. 2000, 57, 84–102. [Google Scholar] [CrossRef]
- Hu, Y.; Ghigliotti, L.; Vacchi, M.; Pisano, E.; Detrich, H.W.; Albertson, R.C. Evolution in an extreme environment: Developmental biases and phenotypic integration in the adaptive radiation of antarctic notothenioids. BMC Evol. Biol. 2016, 16, 1–13. [Google Scholar] [CrossRef] [PubMed]
- Landaeta, M.F.; Villegas, A.; Hüne, M. Shape, condition and diet of the pike icefish Champsocephalus esox (Teleostei: Channichthyidae): Evidence of phenotypic plasticity? Antarct. Sci. 2021, 33, 10–16. [Google Scholar] [CrossRef]
- Eastman, J.T. The nature of the diversity of Antarctic fishes. Polar Biol. 2005, 28, 93–107. [Google Scholar] [CrossRef]
- Devries, A.L.; Eastman, J.T. Lipid sacs as a buoyancy adaptation in an Antarctic fish. Nature 1978, 271, 352–353. [Google Scholar] [CrossRef]
- Voskoboinikova, O.S. Evolutionary significance of heterochronies in the development of the bony skeleton in fishes of the suborder Notothenioidei (Perciformes). J. Ichthyol. 2001, 41, 415–424. [Google Scholar]
- La Mesa, M.; Eastman, J.T.; Vacchi, M. The role of notothenioid fish in the food web of the Ross Sea shelf waters: A review. Polar Biol. 2004, 27, 321–338. [Google Scholar] [CrossRef]
- Carlig, E.; Di Blasi, D.; Ghigliotti, L.; Pisano, E.; Faimali, M.; O’Driscoll, R.; Parker, S.; Vacchi, M. Diversification of feeding structures in three adult Antarctic nototheniid fish. Polar Biol. 2018, 41, 1707–1715. [Google Scholar] [CrossRef]
- Rabosky, D.L.; Chang, J.; Title, P.O.; Cowman, P.F.; Sallan, L.; Friedman, M.; Kaschner, K.; Garilao, C.; Near, T.J.; Coll, M.; et al. An inverse latitudinal gradient in speciation rate for marine fishes. Nature 2018, 559, 392–395. [Google Scholar] [CrossRef] [PubMed]
- Motta, P.J.; Norton, S.F.; Luczkovich, J.J. Perspectives on the ecomorphology of bony fishes. Environ. Biol. Fishes 1995, 44, 11–20. [Google Scholar] [CrossRef]
- Klingenberg, C.P.; Ekau, W. A combined morphometric and phylogenetic analysis of an ecomorphological trend: Pelagization in Antarctic fishes (Perciformes: Nototheniidae). Biol. J. Linn. Soc. 1996, 59, 143–177. [Google Scholar] [CrossRef]
- Iwami, T. Osteology and relationships of the family Channichthyidae. Mem. Natl. Inst. Polar Res. Ser. E 1985, 36, 1–69. [Google Scholar]
- Near, T.J.; Pesavento, J.J.; Cheng, C.H.C. Mitochondrial DNA, morphology, and the phylogenetic relationships of Antarctic icefishes (Notothenioidei: Channichthyidae). Mol. Phylogenet. Evol. 2003, 28, 87–98. [Google Scholar] [CrossRef] [PubMed]
- Kock, K.-H. Antarctic icefishes (Channichthyidae): A unique family of fishes. A review, Part I. Polar Biol. 2005, 28, 862–895. [Google Scholar] [CrossRef]
- Kuhn, T.; Zizka, V.M.; Münster, J.; Klapper, R.; Mattiucci, S.; Kochmann, J.; Klimpel, S. Lighten up the dark: Metazoan parasites as indicators for the ecology of Antarctic crocodile icefish (Channichthyidae) from the north-west Antarctic Peninsula. PeerJ 2018, 6, e4638. [Google Scholar] [CrossRef] [PubMed]
- Iwami, T.; Kock, K.-H. Channichthyidae. In Fishes of the Southern Ocean; Gon, O., Heemstra, P.C., Eds.; J.L.B. Smith Institute of Ichthyology: Grahamstown, South Africa, 1990; pp. 381–399. [Google Scholar]
- Duhamel, G.; Hulley, P.A.; Causse, R.; Koubbi, P.; Vacchi, M.; Pruvost, P.; Vigetta, S.; Irisson, J.O.; Mormède, S.; Belchier, M.; et al. Biogeographic patterns of fish. In Biogeographic Atlas of the Southern Ocean; De Broyer, C., Koubbi, P., Griffiths, H.J., Raymond, B., d’Udekem d’Acoz, C., Van de Putte, A.P., Danis, B., David, B., Grant, S., et al., Eds.; Scientific Committee on Antarctic Research: Cambridge, UK, 2014; pp. 328–362. [Google Scholar]
- Causse, R.; Ozouf-Costaz, C.; Koubbi, P.; Lamy, D.; Eléaume, M.; Dettaï, A.; Duhamel, G.; Busson, F.; Pruvost, P.; Post, A.; et al. Demersal Ichthyofaunal Shelf Communities from the Dumont D’urville Sea (East Antarctica). Polar Sci. 2011, 5, 272–285. [Google Scholar] [CrossRef]
- Eastman, J.T. Bathymetric distributions of notothenioid fishes. Polar Biol. 2017, 40, 2077–2095. [Google Scholar] [CrossRef]
- Loeb, V.J.; Kellermann, A.K.; Koubbi, P.; North, A.W.; White, M.G. Antarctic larval fish assemblages: A review. Bull. Mar. Sci. 1993, 53, 416–449. [Google Scholar]
- Eastman, J.T. The buoyancy-based biotope axis of the evolutionary radiation of Antarctic cryonotothenioid fishes. Polar Biol. 2020, 43, 1217–1231. [Google Scholar] [CrossRef]
- Eastman, J.T.; Hubold, G. The fish fauna of the Ross Sea, Antarctica. Antarct. Sci. 1999, 11, 293–304. [Google Scholar] [CrossRef]
- Wöhrmann, A.P.A. Aspects of Eco-Physiological Adaptations in Antarctic Fish. In Fishes of Antarctica; Springer: Milano, Italy, 1998. [Google Scholar] [CrossRef]
- Sidell, B.D.; Vayda, M.E.; Small, D.J.; Moylan, T.J.; Londraville, R.L.; Yuan, M.-L.; Rodnick, K.J.; Eppley, Z.A.; Costello, L. Variable expression of myoglobin among the hemoglobinless Antarctic icefishes. Proc. Natl. Acad. Sci. USA 1997, 94, 3420–3424. [Google Scholar] [CrossRef] [PubMed]
- Feller, G.; Gerday, C. Adaptations of the hemoglobinless Antarctic icefish (Channichthyidae) to hypoxia tolerance. Comp. Biochem. Physiol. A Physiol. 1997, 118, 981–987. [Google Scholar] [CrossRef]
- Wainwright, P.C.; Bellwood, D.R. Ecomorphology of feeding in coral reef fishes. In Coral reef fishes: Dynamics and Diversity in a Complex Ecosystem; Sale, P.F., Ed.; Academic Press: San Diego, CA, USA, 2002; pp. 33–55. [Google Scholar]
- Barnett, A.; Bellwood, D.R.; Hoey, A.S. Trophic ecomorphology of cardinalfish. Mar. Ecol. Prog. Ser. 2006, 322, 249–257. [Google Scholar] [CrossRef]
- Wainwright, P.C. Morphology and ecology: Functional basis of feeding constraints in Caribbean labrid fishes. Ecology 1988, 69, 635–645. [Google Scholar] [CrossRef]
- Sonnefeld, M.J.; Turingan, R.G.; Sloan, T.J. Functional morphological drivers of feeding mode in marine teleost fishes. Adv. Zool. Bot. 2014, 2, 6–14. [Google Scholar] [CrossRef]
- Gidmark, N.J.; Pos, K.; Matheson, B.; Ponce, E.; Westneat, M.W. Functional morphology and biomechanics of feeding in fishes. In Feeding in Vertebrates; Bels, V., Whishaw, I., Eds.; Springer: Cham, Switzerland, 2019; pp. 297–332. [Google Scholar] [CrossRef]
- Delariva, R.L.; Neves, M.P. Morphological traits correlated with resource partitioning among small characin fish species coexisting in a Neotropical river. Ecol. Freshw. Fish 2020, 29, 640–653. [Google Scholar] [CrossRef]
- Collar, D.C.; Wainwright, P.C. Discordance between morphological and mechanical diversity in the feeding mechanism of centrarchid fishes. Evolution 2006, 60, 2575–2584. [Google Scholar] [CrossRef]
- Bansode, M.A.; Eastman, J.T.; Aronson, R.B. Feeding biomechanics of five demersal Antarctic fishes. Polar Biol. 2014, 37, 1835–1848. [Google Scholar] [CrossRef]
- Carlig, E.; Di Blasi, D.; Pisano, E.; Vacchi, M.; Santovito, G.; Ghigliotti, L. Ecomorphological differentiation of feeding structures within the Antarctic fish species flock Trematominae (Notothenioidei) from Terra Nova Bay (Ross Sea). J. Mar. Sci. Eng. 2022, 10, 1876. [Google Scholar] [CrossRef]
- Frédérich, B.; Heindler, F.M.; Christiansen, H.; Dettai, A.; Van de Putte, A.P.; Volckaert, F.A.; Lepoint, G. Repeated morphological diversification in endemic Antarctic fishes of the genus Trematomus. Belg. J. Zool. 2022, 152, 55–73. [Google Scholar] [CrossRef]
- Landaeta, M.F.; Pareja, M.; Hüne, M.; Zenteno-Devaud, L.; Vera-Duarte, J.; Bernal-Durán, V.; Castillo, M.I.; La Mesa, M. Morphology and diet are decoupled in nearshore notothenoids from King George Island, West Antarctica. J. Fish Biol. 2023, 104, 957–968. [Google Scholar] [CrossRef] [PubMed]
- Eastman, J.T. The Axes of Divergence for the Evolutionary Radiation of Notothenioid Fishes in Antarctica. Diversity 2024, 16, 214. [Google Scholar] [CrossRef]
- Parker, E.; Zapfe, K.L.; Yadav, J.; Frédérich, B.; Jones, C.D.; Economo, E.P.; Federman, S.; Near, T.J.; Dornburg, A. Periodic environmental disturbance drives repeated ecomorphological diversification in an adaptive radiation of Antarctic fishes. Am. Nat. 2022, 200, E221–E236. [Google Scholar] [CrossRef]
- Westneat, M.W. Skull biomechanics and suction feeding in fishes. In Fish Phisiology. Fish Biomechanics; Shadwick, R.E., Lauder, G.V., Eds.; Elsevier Academic Press: San Diego, CA, USA, 2005; Volume 23, pp. 29–75. [Google Scholar] [CrossRef]
- Liem, K.F. Acquisition of energy by teleosts: Adaptive mechanisms and evolutionary patterns. In Environmental physiology of fishes. NATO Advanced Study Institute Series; Ali, M.A., Ed.; Springer: Boston, MA, USA, 1980; Volume 35, pp. 299–334. [Google Scholar] [CrossRef]
- Norton, S.F.; Brainerd, E.L. Convergence in the feeding mechanics of ecomorphologically similar species in the Centrarchidae and Cichlidae. J. Exp. Biol. 1993, 176, 11–29. [Google Scholar] [CrossRef]
- Carroll, A.M.; Wainwright, P.C.; Huskey, S.H.; Collar, D.C.; Turingan, R.G. Morphology predicts suction feeding performance in centrarchid fishes. J. Exp. Biol. 2004, 207, 3873–3881. [Google Scholar] [CrossRef]
- Westneat, M.W. Evolution of levers and linkages in the feeding mechanisms of fishes. Integr. Comp. Biol. 2004, 44, 378–389. [Google Scholar] [CrossRef]
- Carlig, E.; Christiansen, J.S.; Di Blasi, D.; Ferrando, S.; Pisano, E.; Vacchi, M.; O’Driscoll, R.; Ghigliotti, L. Midtrophic fish feeding modes at the poles: An ecomorphological comparison of polar cod (Boreogadus saida) and Antarctic silverfish (Pleuragramma antarctica). Polar Biol. 2021, 44, 1629–1642. [Google Scholar] [CrossRef]
- Cignoni, P.; Scopigno, R. Sampled 3D models for CH applications: A viable and enabling new medium or just a technological exercise? ACM J. Comput. Cult. Herit. 2008, 1, 1–23. [Google Scholar] [CrossRef]
- Remondino, F.; Guarnieri, A.; Vettore, A. 3D modeling of Close-Range Objects: Photogrammetry or Laser Scanning? In Proceedings of the SPIE—The International Society for Optical Engineering, Electronic Imaging 2005, San Jose, CA, USA, 16–20 January 2005; Volume 5665, pp. 216–225. [Google Scholar]
- Kano, Y. Bio-photogrammetry: Digitally archiving coloured 3D morphology data of creatures and associated challenges. Res. Ideas Outcomes 2022, 8, e86985. [Google Scholar] [CrossRef]
- Scalas, A. A Framework for the Semantics-aware Modelling of Objects. PhD Thesis, University of Genoa, Genoa, Italy, 2021. [Google Scholar]
- Wainwright, P.C.; Richard, B.A. Predicting patterns of prey use from morphology of fishes. Environ. Biol. Fishes 1995, 44, 97–113. [Google Scholar] [CrossRef]
- Lecointre, G. Phylogeny and Systematics of Antarctic Teleosts: Methodological and Evolutionary Issues. In Adaptation and Evolution in Marine Environments; di Prisco, G., Verde, C., Eds.; Volume 1 From Pole to Pole; Springer: Berlin/Heidelberg, Germany, 2012. [Google Scholar] [CrossRef]
- Chen, W.-J.; Bonillo, C.; Lecointre, G. Phylogeny of the Channichthyidae (Notothenioidei, Teleostei) based on two mitochondrial genes. In Fishes of Antarctica: A Biological Overview; Di Prisco, G., Pisano, E., Clarke, A., Eds.; Springer: Milan, Italy, 1998; pp. 287–298. [Google Scholar]
- Kock, K.H.; Gröger, J.; Jones, C.D. Interannual variability in the feeding of ice fish (Notothenioidei, Channichthyidae) in the southern Scotia Arc and the Antarctic Peninsula region (CCAMLR Subareas 48.1 and 48.2). Polar Biol. 2013, 36, 1451–1462. [Google Scholar] [CrossRef]
- Petrov, A.F. New data on the diet of deep-sea icefish Chionobathyscus dewitti (Channichthyidae) in the Ross Sea in 2010. J. Ichthyol. 2011, 51, 692–694. [Google Scholar] [CrossRef]
- Pakhomov, E.A.; Tseitlin, V.B. Feeding pattern of nine species of Antarctic fish and assessment of their daily food consumption. Sel. Sci. Pap. CCAMLR 1992, 321–333. [Google Scholar]
- Takahashi, M.; Nemoto, T. The food of some Antarctic fish in the western Ross Sea in summer 1979. Polar Biol. 1984, 3, 237–239. [Google Scholar] [CrossRef]
- La Mesa, M.; Catalano, B.; Greco, S. Some biological characteristics of early larvae Dacodraco hunteri (Notothenioidei: Channichthyidae) in the western Ross Sea. Polar Biol. 2012, 35, 655–660. [Google Scholar] [CrossRef]
- Casaux, R.; Barrera-Oro, E. Dietary overlap in inshore notothenioid fish from the Danco Coast, western Antarctic Peninsula. Polar Res. 2013, 32, 21319. [Google Scholar] [CrossRef]


| Species | n | SL (mm) | Depth (m) | Life Style | Main Prey |
|---|---|---|---|---|---|
| Chaenodraco wilsoni | 7 | 212–357 | 50–321 | P [12] | euphausiids [19] |
| Chionobathyscus dewitti | 6 | 272–342 | 445–1990 | D [19] | fishes [19] |
| Chionodraco hamatus | 6 | 253–387 | 50–639 | D [12] | euphausiids, fishes [12] |
| Dacodraco hunteri | 6 | 169–254 | 520–752 | SP [27] | fishes [12] |
| Neopagetopis ionah | 8 | 286–434 | 84–864 | SP [27] | euphausiids, fishes [19,27] |
| Pagetodes antarcticus | 6 | 253–328 | 201–450 | D [27] | fishes [12] |
| Pagetopsis macropterus | 7 | 199–239 | 123–286 | D [27] | euphausiids [19] |
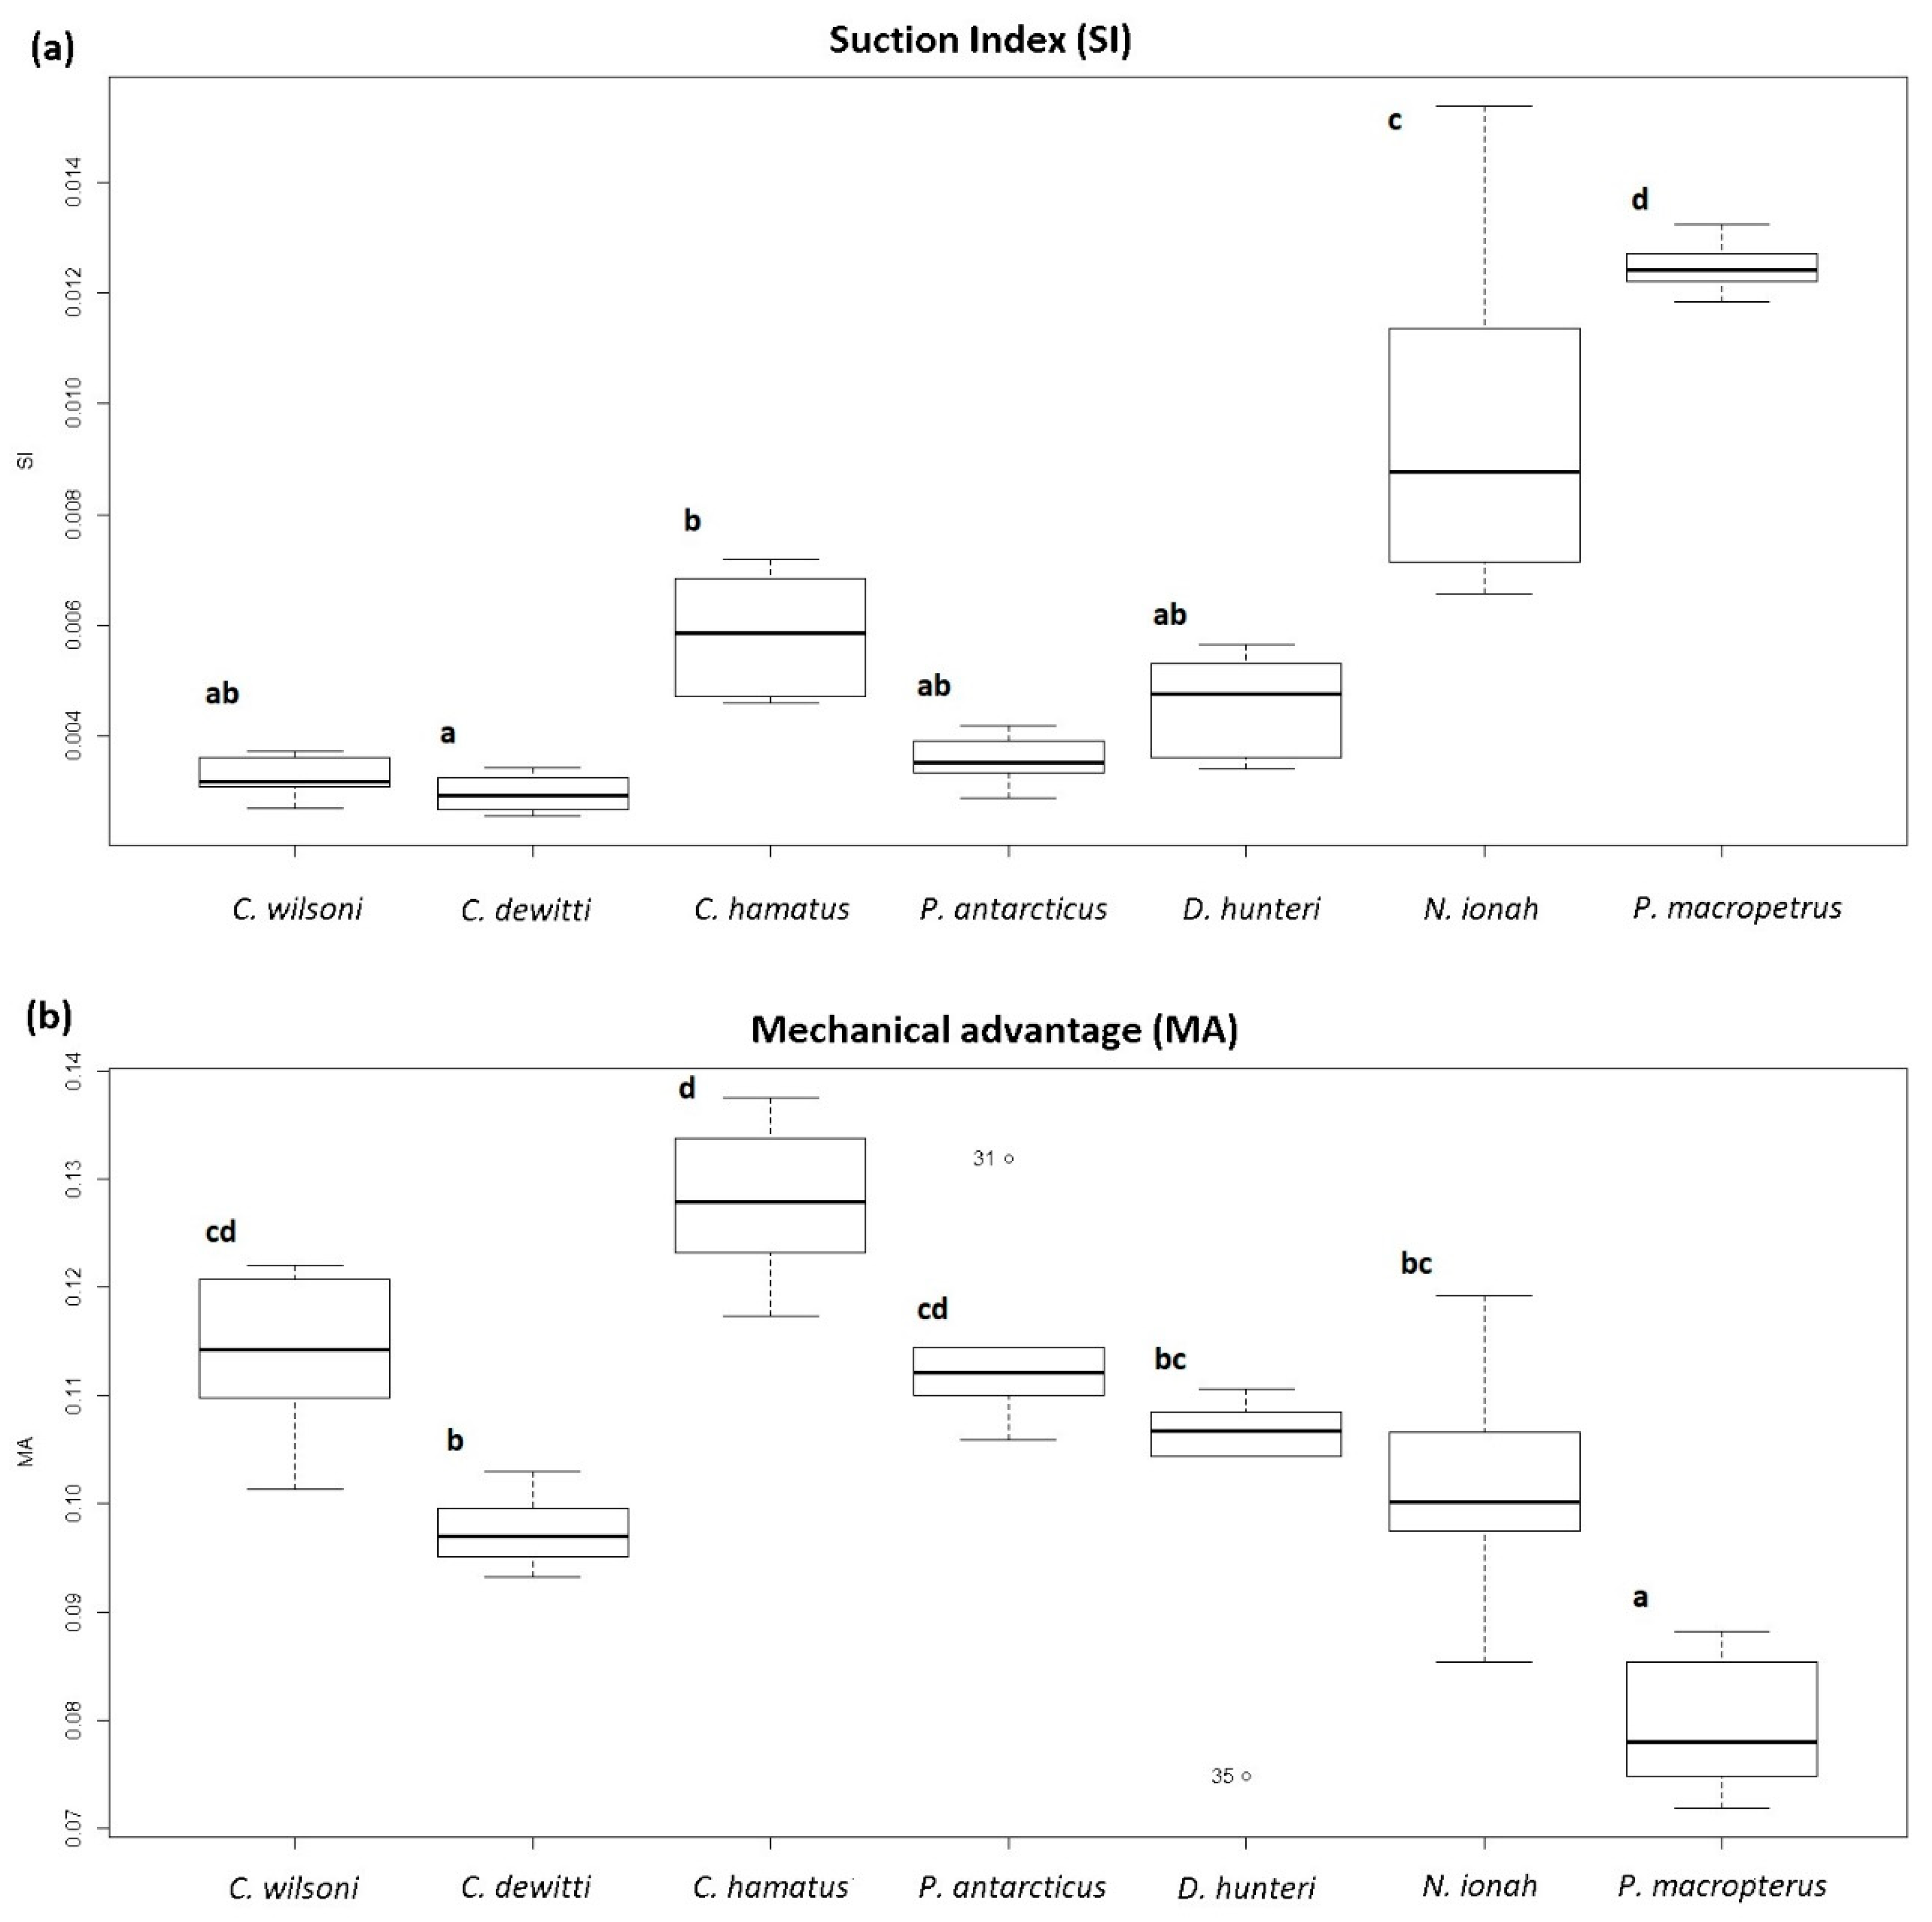
| Scheme | n | Suction Index (Mean ± SD) | Mechanical Advantage (Mean ± SD) |
|---|---|---|---|
| Chaenodraco wilsoni | 7 | 0.003 ± 0.000 | 0.114 ± 0.008 |
| Chionobathyscus dewitti | 7 | 0.003 ± 0.000 | 0.097 ± 0.004 |
| Chionodraco hamatus | 6 | 0.006 ± 0.001 | 0.128 ± 0.007 |
| Dacodraco hunteri | 6 | 0.005 ± 0.001 | 0.102 ± 0.009 |
| Neopagetopis ionah | 8 | 0.010 ± 0.003 | 0.102 ± 0.010 |
| Pagetodes antarcticus | 6 | 0.004 ± 0.000 | 0.114 ± 0.009 |
| Pagetopsis macropterus | 7 | 0.012 ± 0.000 | 0.080 ± 0.007 |
| Traits | C. wilsoni Mean ± SD | C. dewitti Mean ± SD | C. hamatus Mean ± SD | D. hunteri Mean ± SD | N. ionah Mean ± SD | P. antarcticus Mean ± SD | P. macropterus Mean ± SD |
|---|---|---|---|---|---|---|---|
| ED | 0.081 ± 0.007 | 0.062 ± 0.003 | 0.069 ± 0.003 | 0.075 ± 0.004 | 0.053 ± 0.004 | 0.065 ± 0.004 | 0.075 ± 0.004 |
| HL | 0.336 ± 0.024 | 0.364 ± 0.003 | 0.374 ± 0.025 | 0.373 ± 0.013 | 0.373 ± 0.013 | 0.337 ± 0.006 | 0.396 ± 0.009 |
| GW | 0.116 ± 0.007 | 0.131 ± 0.012 | 0.113 ± 0.009 | 0.105 ± 0.013 | 0.129 ± 0.009 | 0.095 ± 0.011 | 0.124 ± 0.005 |
| BL | 0.227 ± 0.016 | 0.213 ± 0.009 | 0.265± 0.020 | 0.277 ± 0.013 | 0.255 ± 0.011 | 0.227 ± 0.006 | 0.263 ± 0.010 |
| CSAepax | 0.038 ± 0.002 | 0.040 ± 0.001 | 0.050 ± 0.002 | 0.043 ± 0.004 | 0.054 ± 0.003 | 0.035 ± 0.002 | 0.055 ± 0.001 |
| LinSI | 0.009 ± 0.001 | 0.009 ± 0.000 | 0.013 ± 0.001 | 0.012 ± 0.001 | 0.016 ± 0.002 | 0.009 ± 0.000 | 0.017 ± 0.001 |
| LoutSI | 0.148 ± 0.015 | 0.165 ± 0.005 | 0.163 ± 0.009 | 0.168 ± 0.007 | 0.150 ± 0.013 | 0.146 ± 0.003 | 0.128 ± 0.005 |
| LinMA | 0.023 ± 0.001 | 0.023 ± 0.001 | 0.030 ± 0.002 | 0.026 ± 0.003 | 0.024 ± 0.002 | 0.026 ± 0.002 | 0.019 ± 0.001 |
| LoutMA | 0.198 ± 0.013 | 0.233 ± 0.004 | 0.233 ± 0.011 | 0.251 ± 0.010 | 0.236 ± 0.012 | 0.227 ± 0.008 | 0.244 ± 0.012 |
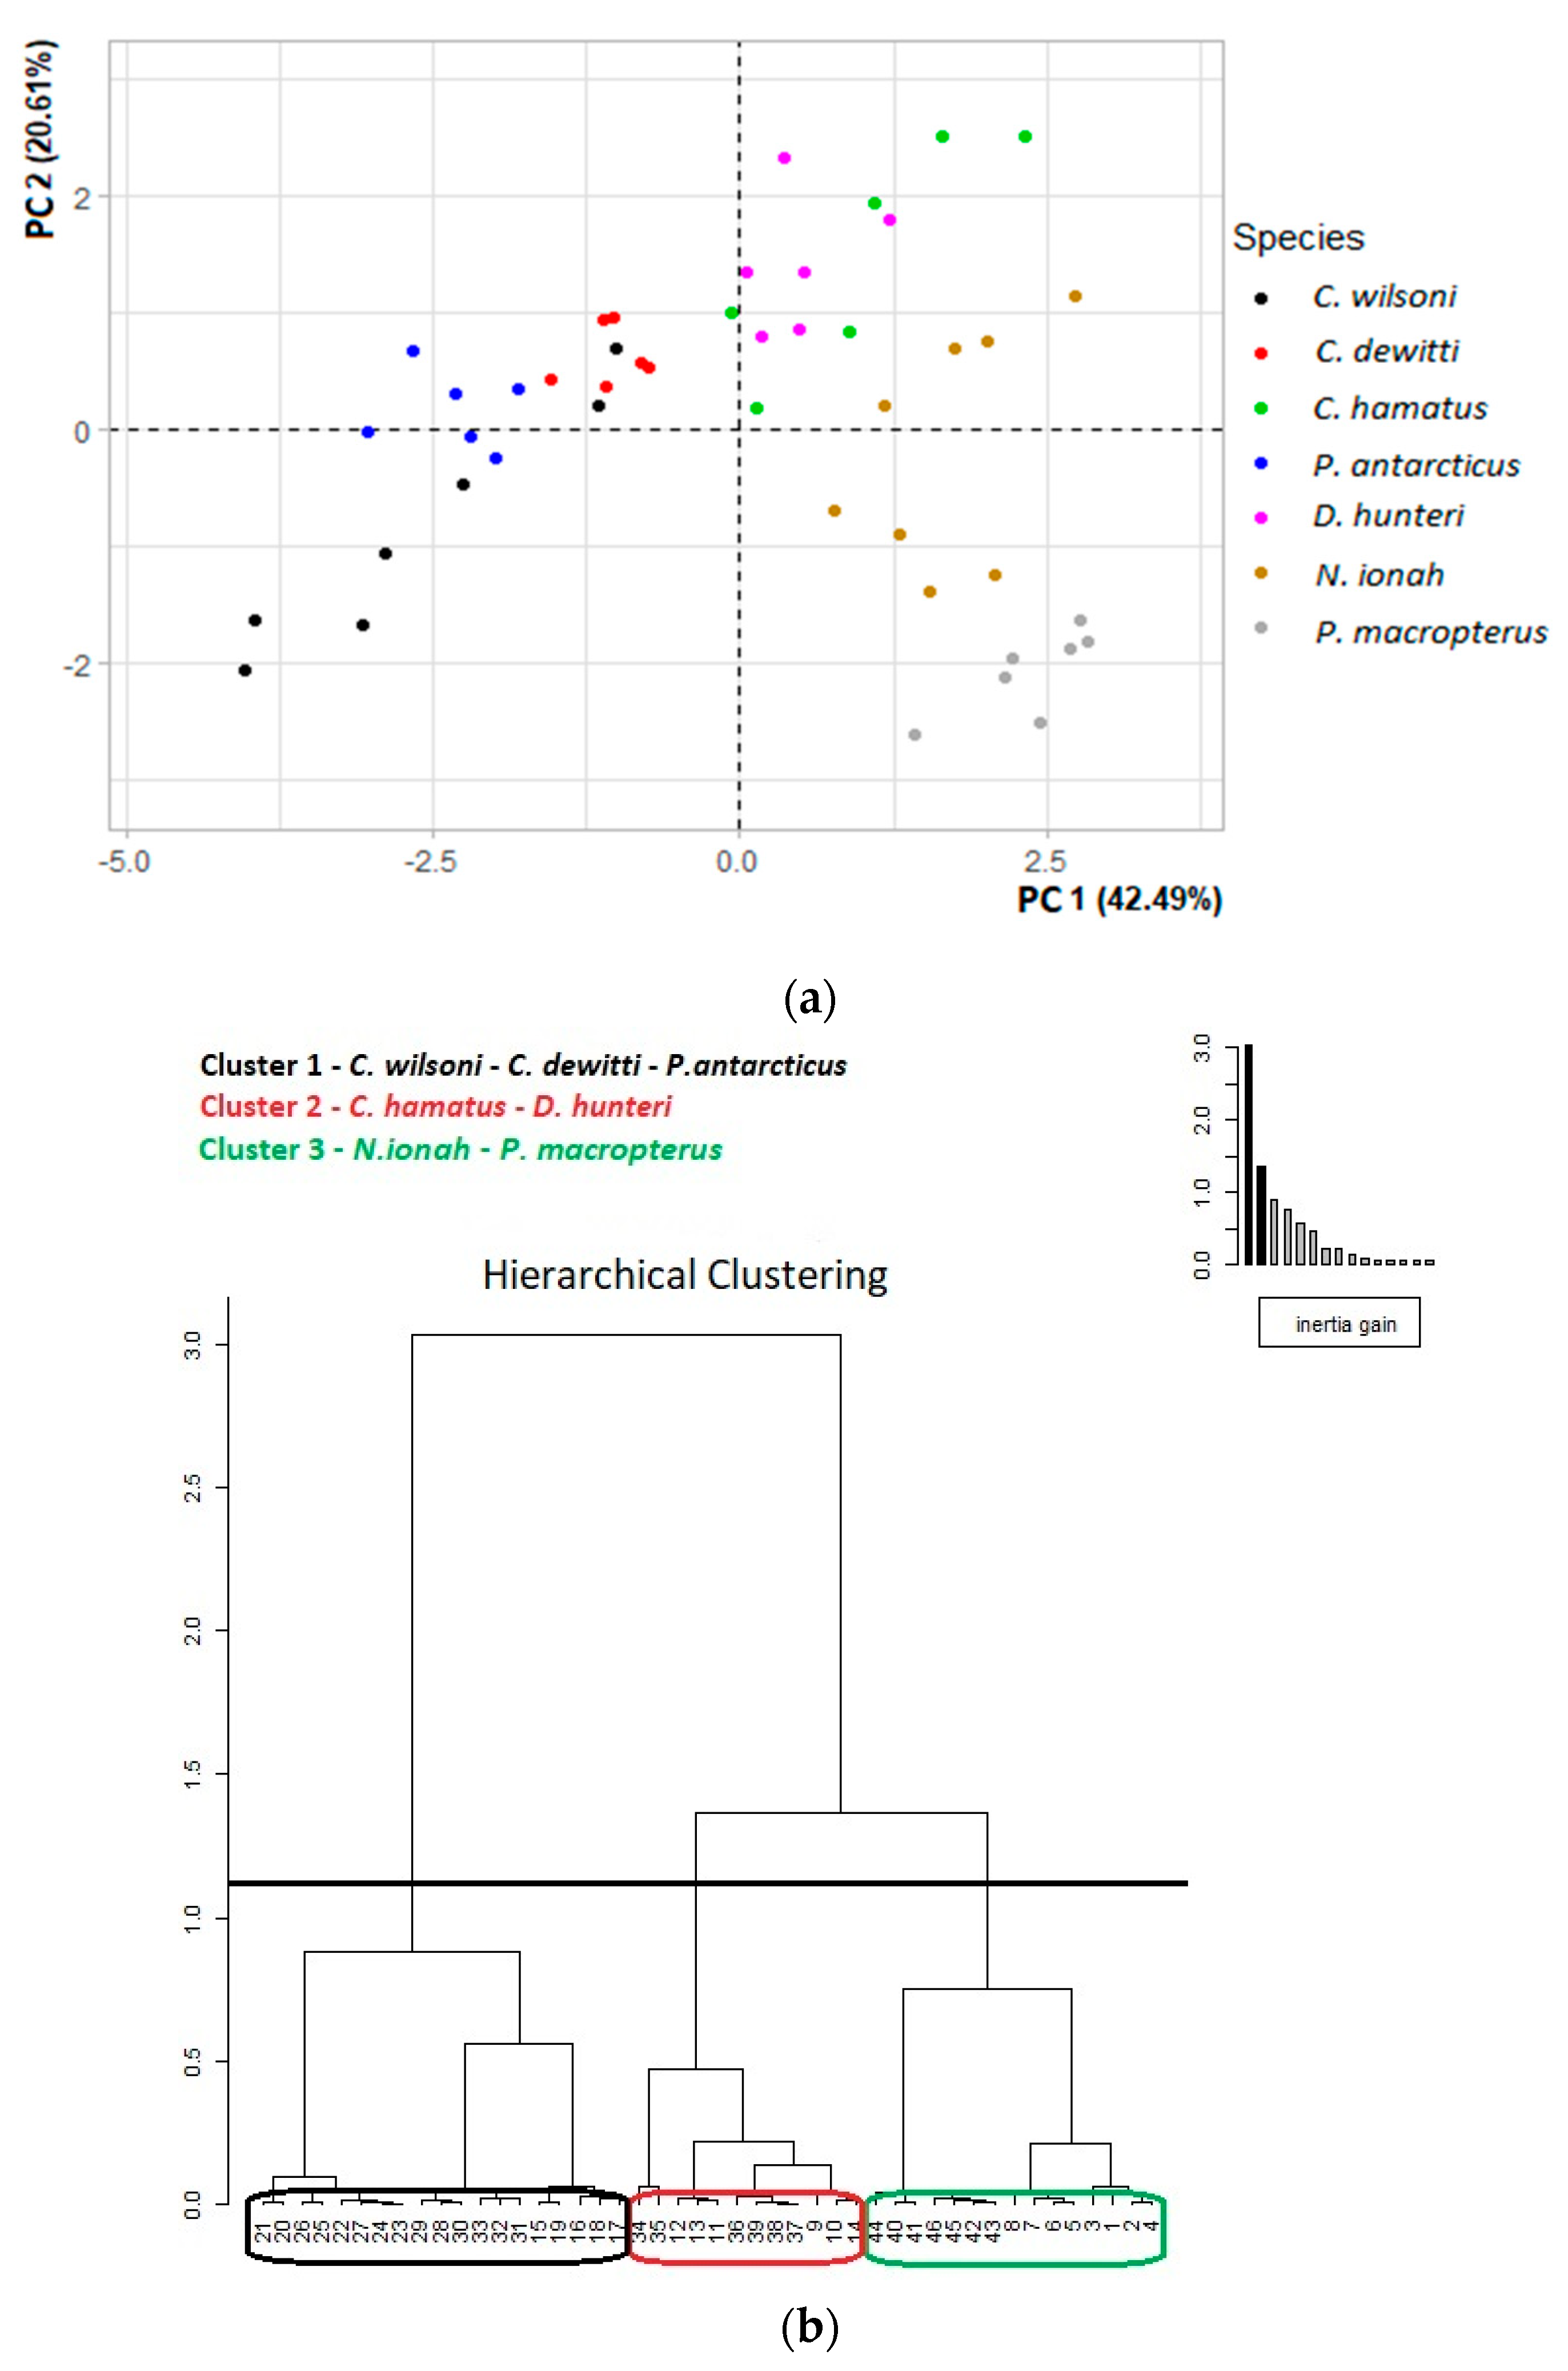
| PC1 | PC2 | PC3 | |
|---|---|---|---|
| Variance | 3.824 | 1.855 | 1.315 |
| % of Variance | 42.494 | 20.609 | 14.612 |
| Cumulative % of Variance | 42.494 | 63.103 | 77.714 |
| Traits | |||
| ED | −0.252 | −0.157 | 0.733 |
| HL | 0.885 | 0.078 | 0.177 |
| GW | 0.504 | 0.094 | −0.615 |
| BL | 0.743 | 0.235 | 0.486 |
| CSAepax | 0.905 | −0.256 | −0.188 |
| LinSI | 0.898 | 0.304 | −0.067 |
| LoutSI | −0.025 | 0.935 | −0.003 |
| LinMA | 0.073 | 0.780 | −0.145 |
| LoutMA | 0.735 | 0.347 | 0.268 |
Disclaimer/Publisher’s Note: The statements, opinions and data contained in all publications are solely those of the individual author(s) and contributor(s) and not of MDPI and/or the editor(s). MDPI and/or the editor(s) disclaim responsibility for any injury to people or property resulting from any ideas, methods, instructions or products referred to in the content. |
© 2024 by the authors. Licensee MDPI, Basel, Switzerland. This article is an open access article distributed under the terms and conditions of the Creative Commons Attribution (CC BY) license (https://creativecommons.org/licenses/by/4.0/).
Share and Cite
Carlig, E.; Di Blasi, D.; Ghigliotti, L.; Scalas, A.; Stewart, A.L.; Mortara, M. Feeding Behaviour of Seven Icefish Species (Channichthyidae) in the Ross Sea, Antarctica. Fishes 2024, 9, 247. https://doi.org/10.3390/fishes9070247
Carlig E, Di Blasi D, Ghigliotti L, Scalas A, Stewart AL, Mortara M. Feeding Behaviour of Seven Icefish Species (Channichthyidae) in the Ross Sea, Antarctica. Fishes. 2024; 9(7):247. https://doi.org/10.3390/fishes9070247
Chicago/Turabian StyleCarlig, Erica, Davide Di Blasi, Laura Ghigliotti, Andreas Scalas, Andrew L. Stewart, and Michela Mortara. 2024. "Feeding Behaviour of Seven Icefish Species (Channichthyidae) in the Ross Sea, Antarctica" Fishes 9, no. 7: 247. https://doi.org/10.3390/fishes9070247
APA StyleCarlig, E., Di Blasi, D., Ghigliotti, L., Scalas, A., Stewart, A. L., & Mortara, M. (2024). Feeding Behaviour of Seven Icefish Species (Channichthyidae) in the Ross Sea, Antarctica. Fishes, 9(7), 247. https://doi.org/10.3390/fishes9070247