Article

Internet of Things Smart Beehive Network: Homogeneous Data, Modeling, and Forecasting the Honey Robbing Phenomenon

1
Department of Artificial Intelligence, Institute of Information Technology, Warsaw University of Life Sciences, Nowoursynowska 159, 02-776 Warsaw, Poland
2
Independent Researcher, 02-627 Warsaw, Poland
*
Authors to whom correspondence should be addressed.
Inventions 2025, 10(2), 23; https://doi.org/10.3390/inventions10020023
Submission received: 31 December 2024 / Revised: 14 February 2025 / Accepted: 18 February 2025 / Published: 3 March 2025

Abstract

:
The role of experimental data and the use of IoT-based monitoring systems are gaining broader significance in research on bees across several aspects: bees as global pollinators, as biosensors, and as examples of swarm intelligence. This increases the demands on monitoring systems to obtain homogeneous, continuous, and standardized experimental data, which can be used for machine learning, enabling models to be trained on new online data. However, the continuous operation of monitoring systems introduces new risks, particularly the cumulative impact of electromagnetic radiation on bees and their behavior. This highlights the need to balance IoT energy consumption, functionality, and continuous monitoring. We present a novel IoT-based bee monitoring system architecture that has been operating continuously for several years, using solar energy only. The negative impact of IoT electromagnetic fields is minimized, while ensuring homogeneous and continuous data collection. We obtained experimental data on the adverse phenomenon of honey robbing, which involves elements of swarm intelligence. We demonstrate how this phenomenon can be predicted and illustrate the interactions between bee colonies and the influence of solar radiation. The use of criteria for detecting honey robbing will help to reduce the spread of diseases and positively contribute to the sustainable development of precision beekeeping.

1. Introduction

Honeybees (Apis mellifera) and beekeeping play a crucial role in pollinating agricultural crops, ensuring food security, and maintaining global biodiversity [1,2,3]. However, COLOSS studies report significant honeybee colony losses across Europe, America, and other regions [4,5,6]. Large losses force beekeepers to focus primarily on population recovery rather than effective pollination, resulting in colonies that have successfully overwintered, but are weakened and have reduced pollination effectiveness.
As noted by Hristov et al. [7], identifying the causes of colony losses is a complex, multifactorial task. Key factors include diseases, climate change, pesticide use, the Varroa destructor mite, and other human-related factors, such as bee management practices. This list is expanding as new insights emerge, making timely and accurate information critical for studying colony losses.
Honey robbing is one of the negative phenomena in honeybee behavior [8]. When natural food resources decline, stronger colonies attack weaker ones to steal their honey stores. This phenomenon is fleeting, dangerous, and remains insufficiently studied [9]. Its consequences include the destruction of the robbed colony and a high probability of disease transmission. Preventive measures are currently the primary strategy to mitigate honey robbing, as once initiated, halting this phenomenon is extremely difficult [10]. According to findings [11], honeybee robbers have shorter lifespans and are more prone to Nosema infections. Therefore, identifying early anomalies that precede honey robbing through experimental data is crucial for understanding its triggers and developing early warning systems. These systems can help to preserve bee colonies and reduce disease spread, particularly during in the period leading up to winter.
Traditionally, beekeepers assess colony health and strength manually, by opening hives and inspecting frames. This invasive and time-consuming method does not allow for the rapid detection of dynamic problems such as robbing honey, which can escalate within hours.
The development of the Internet of Things (IoT) has led to non-invasive systems for monitoring honeybee colonies, enabling continuous, real-time data collection [12,13,14]. These systems allow for the collection of experimental data from various sensors, such as temperature, humidity, weight, and CO2 [12,15], as well as video and acoustic information [15,16,17,18]. Such data are instrumental in detecting diseases [19], identifying queen bee presence and swarming [17,20], and identifying other patterns that may indicate stressful conditions, or the onset of honey robbing [21]. Temperature data inside and outside the hive reflect colony metabolic activity and environmental conditions, helping to assess colony health [18,22].
Sound data and machine learning techniques, like K-Nearest Neighbors (k-NN) and Support Vector Machine (SVM), enable the detection and prediction of specific bee behaviors, such as swarming and other stress-related patterns [20].
IoT-based monitoring systems are increasingly integral to precision beekeeping (PB), enhancing sustainability and efficiency in beekeeping practices [23,24,25]. However, only a limited portion of the data generated by these systems is utilized for machine learning applications to predict honeybee activity [26]. Predictive modeling based on experimental data will identify anomalies, enable early prevention, determine colony loss causes, and optimize honeybee colony management strategies.
These advantages, together with process models, the gamification approach, and IoT-based hive weight measurement, are comprehensively presented in Charbel Kady et al. [27]. A business process model and notation (BPMN) based on beekeeping business rules derived from both experience and observed system events will trigger notifications, informing beekeepers so that they can make optimal and timely decisions.
In addition to their critical role as global pollinators, bees also serve as unique biosensors. Bees leave the hive, collect food, and return to the hive carrying traces of contaminants, pathogens, and other chemical substances that are present in the foraging area [28]. Studies [29] have detected pesticide residues in dead bees collected from 2015 to 2020, highlighting an ongoing public health threat posed by pesticide exposure for both bees and humans [30,31,32].
As noted in the review by Bromenshenk J. et al. [33], bees can be used to search for and locate various chemical substances. Methods for tracking bees outside the hive are employed for this purpose. Technical systems for spatial localization of honeybees, and those which provide the ability to train bees [34,35], provide a foundation for the development of cartographic systems for monitoring the presence of various chemicals. As noted by researchers [36], bees can be trained to detect the smell of explosives, and the most visited locations will indicate suspicious areas [37]. The cost and time required to train bees are low, and large populations can quickly cover suspicious territories. Researchers have placed organic explosive vapors at the hive entrance, which opens new perspectives for the use of IoT in hives.
In addition, the bee colony provides an example of a natural system behavior characterized as swarm intelligence [38]. Based on bee colony behavior, a swarm-based meta-heuristic algorithm for optimizing numerical problems, named the Artificial Bee Colony Algorithm, was created [39]. This algorithm has found wide application for various optimization problems.
Modeling bee colonies is crucial for understanding their dynamics, especially under the influence of biological, ecological, and other stressors that may lead to colony collapse [40]. The first bee colony model was developed in 1979 in Poland [41], and presented at Apimondia in 1987 [42]. Modern computational models like VARROAPOP [43] and BEEHAVE [44] stand out for their ability to simulate complex factors such as Varroa mite parasitism, reduced forage, high forager mortality, and pesticide exposure. The BEEHAVE model has been tested by the European Food Safety Authority (EFSA), and is widely used for risk assessment and management [45].
However, these mathematical models have limitations. Chen et al. [40] note that their weak validation with experimental data, due to the small size and heterogeneity of the datasets, underscores the need for more collaboration between biologists and mathematicians. Additionally, the developers of BEEHAVE emphasize the model’s critical limitation in not accounting for interactions between colonies within and across apiaries.
On the other hand, machine learning methods have proven useful for predicting colony behavior and dynamics, but they also require high-quality experimental data. IoT-based monitoring systems have previously collected heterogeneous data from a small number of hives, using various sensors placed inconsistently. Data inconsistency and a lack of measurement standardization across apiaries hinder the effective application of machine learning methods [46].
Bees have annual cycles, making long-term and continuous monitoring essential [14]. Therefore, there is a need to develop equipment that is capable of generating continuous, standardized, and homogeneous experimental data on bee life at an acceptable sampling rate, which could be applied across various areas of scientific research.
Acquiring meaningful data from continuous, long-term monitoring across multiple hives is challenging [47]. However, one study [48] has shown that homogeneous, multi-sensor datasets with phenotypic measurements from IoT-equipped hives can be achieved. Identical sensors were consistently placed across all hives, according to an accepted internal standard. Phenotypic measurements included assessments of Varroa destructor infestation, hive population, honey yield, and winter mortality. Data analysis and machine learning demonstrated the ability to predict winter mortality and the presence of the queen bee.
Despite the widespread use of IoT systems, they face limitations in energy consumption, particularly in natural conditions. As predicted [47], the future development of IoT systems should focus on energy use only during data collection and transmission. This approach will reduce energy consumption, especially in winter, and minimize the negative impact of electromagnetic radiation on bees. The classification of IoT-equipped hives into “connected” and “smart” beehives [24] highlights that smart hives are capable of performing intelligent operations. In our opinion, transferring computational tasks to the server can reduce energy use and further decrease the impact of electromagnetic radiation on bees.
Studies confirm the effect of electromagnetic fields on bee behavior. According to [49], honeybees accumulate electric charge during movement, emitting electric fields with low- and high-frequency components during activities like flying and the waggle dance. Studies [50,51] show that extremely low-frequency electromagnetic fields (ELF EMFs) from powerlines suppress bee activity, increasing aggression, reducing aversive learning, and negatively affecting flight dynamics and foraging efficiency. Research [52] indicates that continuous electromagnetic radiation, such as from mobile phones at 900 MHz, significantly reduces queen hatching success. Honeybees can absorb radiofrequency electromagnetic fields within permissible limits without observable harm [53], with the absorbed energy primarily leading to thermal effects. However, studies specifically assessing the impact of IoT device radiation on bee colonies remain limited.
In conclusion, obtaining homogeneous, long-term data with an acceptable sampling frequency to study bee behavior using machine learning, and to enable year-round non-invasive health monitoring, remains a relevant and challenging goal. This task is complicated by significant limitations related to providing year-round power for IoT systems in natural conditions (e.g., mountains, forests, meadows, and fields), as well as the need to minimize the negative impact of electromagnetic radiation from IoT devices on bee health and behavior.
Given the need for long-term, reliable, and homogeneous data across various areas of bee research, the main scientific contributions of this study are as follows:
  • Development and successful multi-year operation of a network of smart beehives with IoT. These hives operate continuously, powered solely by solar energy, with minimal technical maintenance and no stress for the bees. The IoT operating algorithm simultaneously minimizes energy consumption and reduces the impact of electromagnetic radiation on bees, ensuring year-round, round-the-clock data collection;
  • Study of the honey robbing phenomenon as a practical example of studying the behavior of bees using a smart apiary. Using data from an apiary of identical smart hives, we documented the prerequisites, onset, and progression of honey robbing. Data analysis indicates the potential for early prediction and detailed study of this negative phenomenon;
  • Analysis of comparative data. The study compares homogeneous experimental data from 10 smart hives within the same apiary over a similar period, enabling a better understanding of the relationship between bee colonies within the apiary before and during honey robbing;
  • Predictive modeling. Data generated from smart beehives are homogeneous, standardized, and reliable, allowing for their effective use in future machine learning models for predicting bee colony dynamics and patterns of behavior;
  • Integration of solar-powered IoT systems in precision beekeeping. Solar-powered IoT devices can serve as an additional source of research data, while ensuring sustainable long-term data collection, reducing environmental impact, and promoting eco-friendly monitoring solutions.

2. Materials and Methods

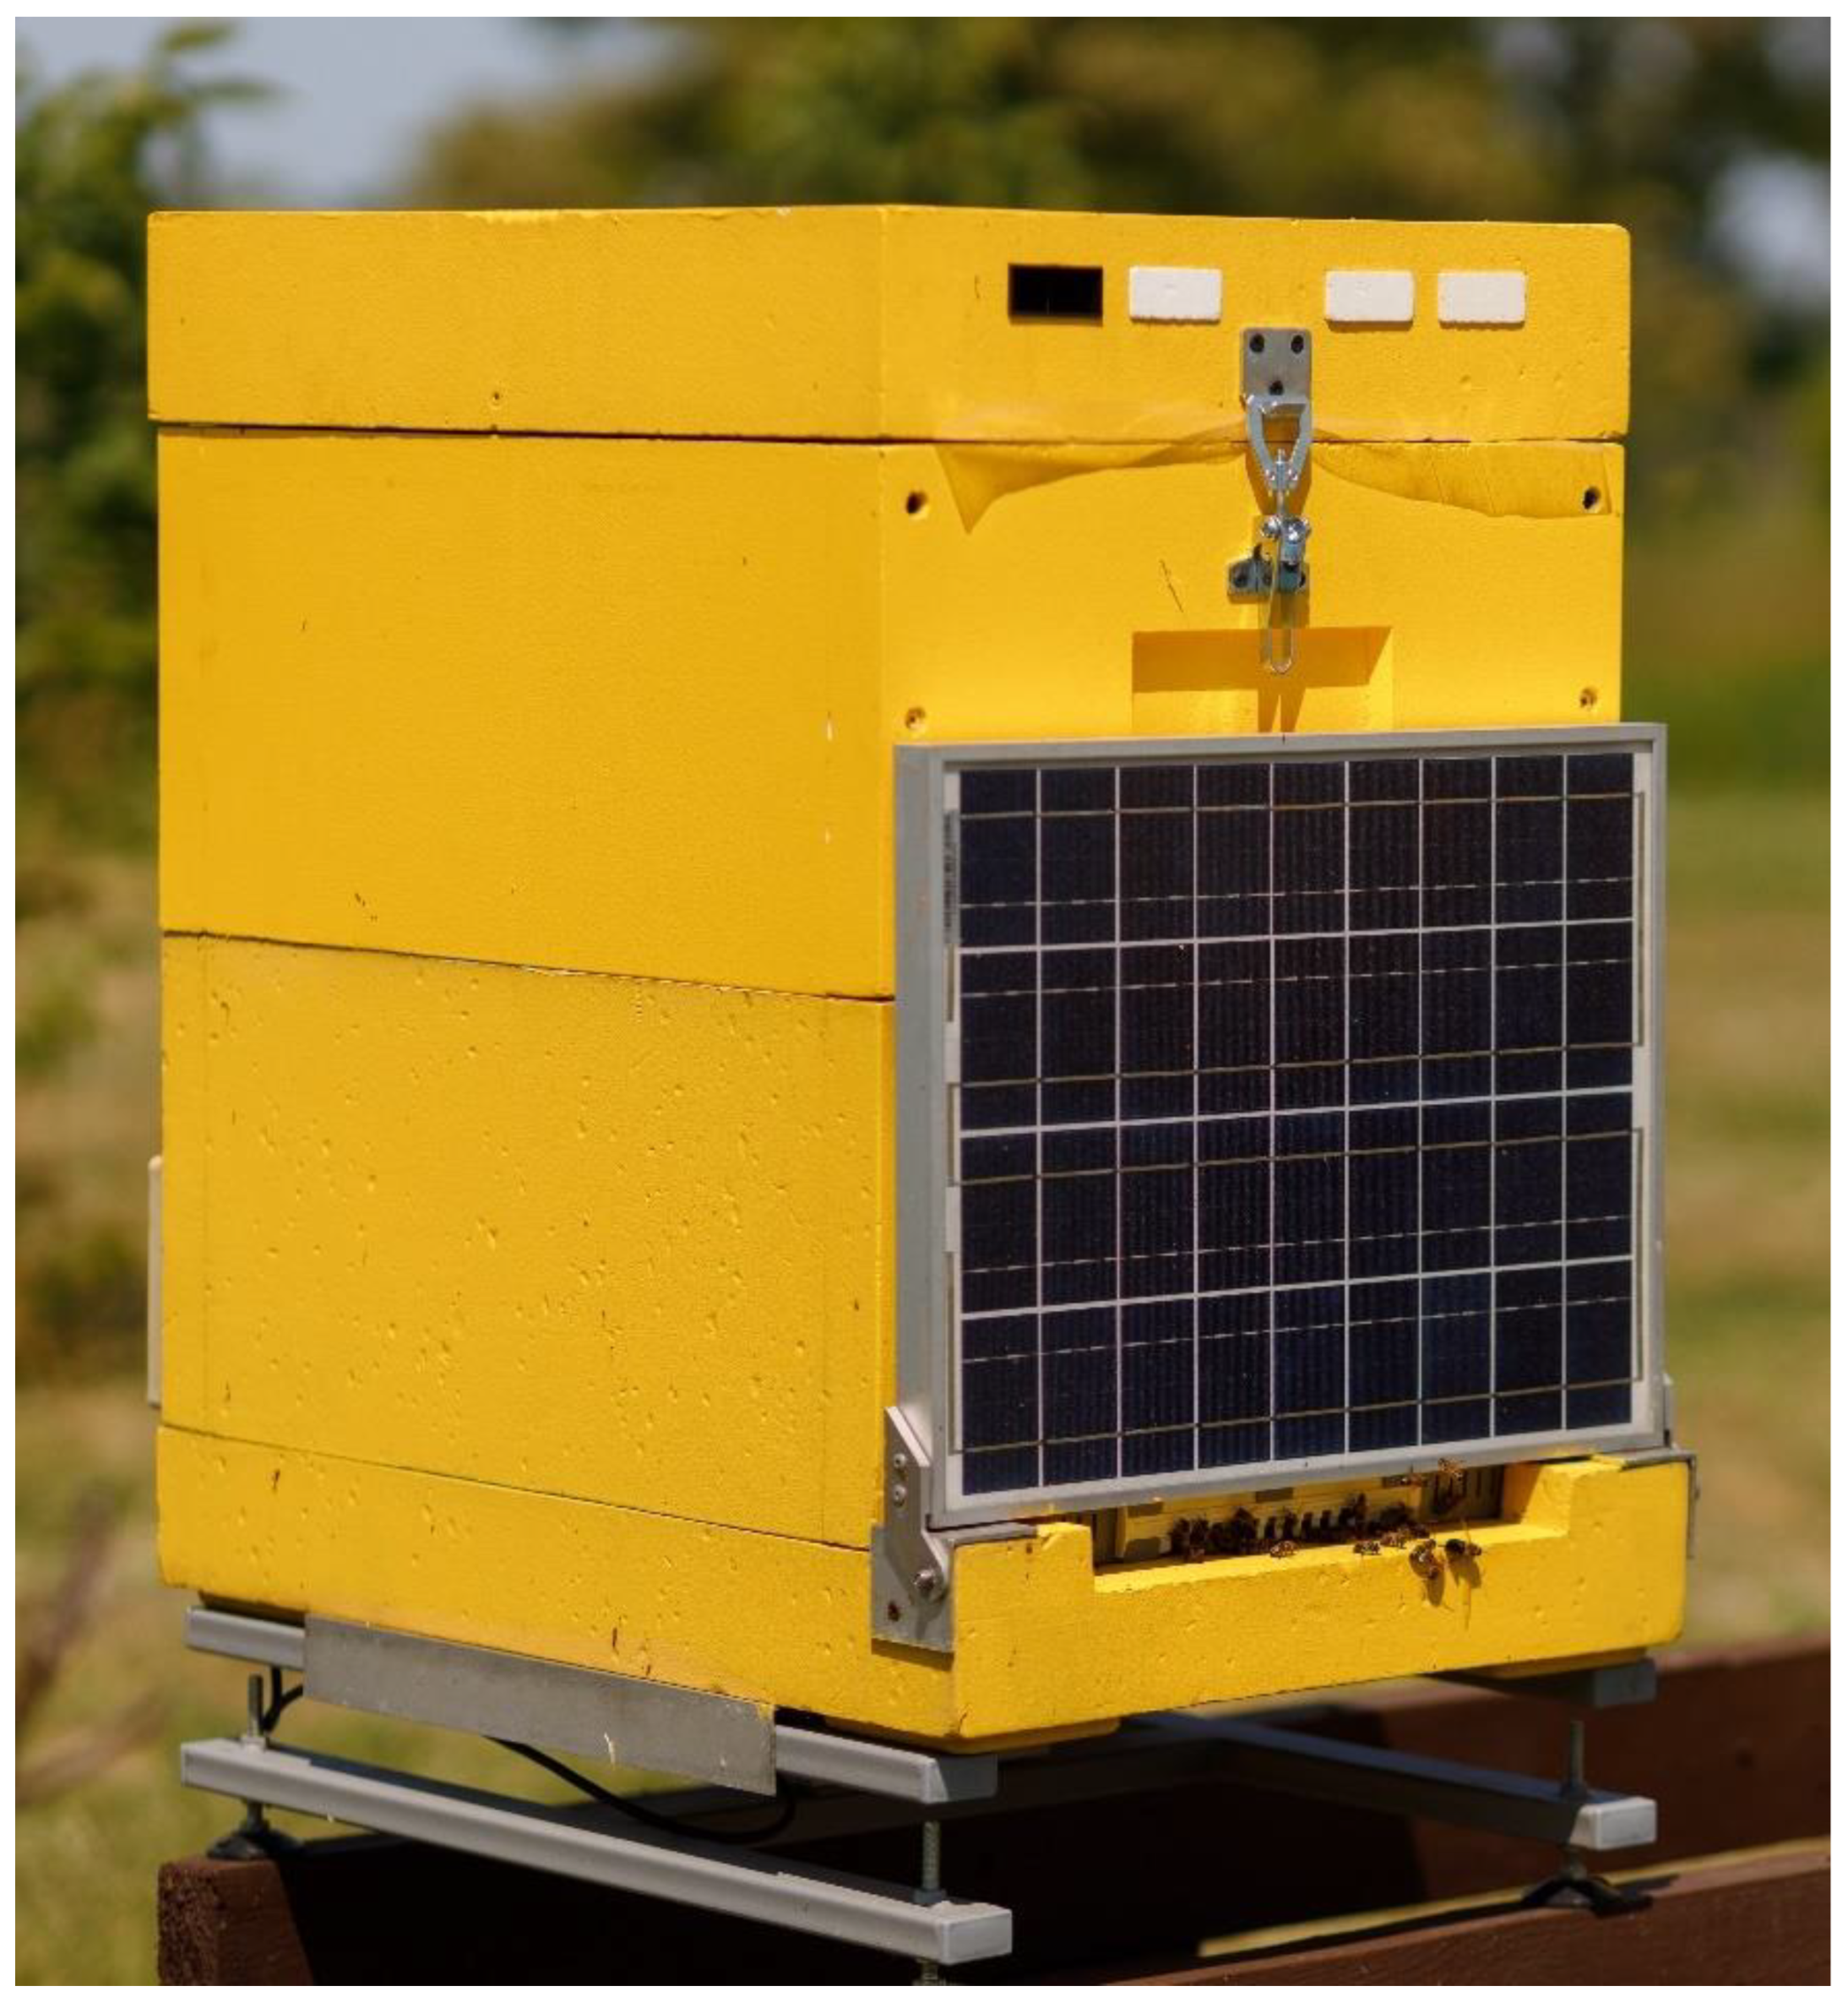
2.1. Smart Hive and System Architecture

For the purpose of our research, we developed a network of smart hives, which includes identical smart hives (Figure 1). These smart hives are installed in various geographic regions with similar climatic conditions and the presence of Apis mellifera: Poland, Canada, Germany, and Ukraine. All smart hives share the same Langstroth hive design. The project has a permanent address: https://amohive.com/ (accessed on 19 February 2025).
Each smart hive operates as an autonomous IoT device that collects and transmits information from sensors installed within the hive. The data, transmitted continuously and year-round, include weight, internal and external temperature and humidity, GPS position, and technical parameters such as communication type, signal quality, signal level, and indirect information about solar activity.
The sensors and IoT electronics are powered solely by solar energy available at the location of the smart hive. Solar energy is converted into electrical energy using a solar panel, and stored in an integrated battery. The IoT devices collect and transmit sensor data to the server at a frequency of once per hour during the summer period, and twice per hour during the winter period. Data uniformity and measurement standardization within the network are ensured by the identical design of the smart hives. Data transmission and reception are conducted through EGSM900/DSC1800/WCDMA and IMT-2000/WCDMA850/WCDMA900/PCS1900 channels.
The smart hive network is based on principles of non-invasive monitoring of bee colonies under natural conditions, with the capability for information exchange between smart hives via a shared server and bee colony models. Individual bee colony models, using machine learning, can operate on the server based on uniform, real-time data.
Individual models optimize the development of bee colonies in smart hives by controlling the movable electromechanical components of the hive. Examples of such components include controlled electromechanical syrup dispensers, bottom ventilation regulators, and hive entrance width regulators. Adjustments to these mechanical parameters influence the development of the bee colony. Control is achieved using embedded IoT devices. Currently, this functionality is outside the scope of this article, and work on its implementation is ongoing.
Figure 2 illustrates the smart hive from the front, rear, and exploded views when opened by a beekeeper or researcher.
A solar panel is mounted vertically on the front wall of the smart hive. This placement ensures optimal energy generation for powering IoT devices throughout the year. In this configuration, the solar panel generates maximum energy during the least favorable periods of the year, namely autumn and winter, when solar elevation and the number of sunny days are minimal. A metal scale structure with a single sensor is installed at the bottom of the smart hive (Figure 3).
An internal temperature and humidity sensor is mounted on the rear wall of the brood chamber of the smart hive (Figure 4a). A sealed IoT block is also installed on the rear wall, with an external temperature and humidity sensor located in the lower part of the block (Figure 4b). Both the internal and external temperature and humidity sensors are identical, and are positioned in the same locations in all smart hives within the network.
The uniformity of the smart hives in the network serves as an internal standard for data measurement. Data consistency is ensured by the standardized design of all smart hives, which feature identical mechanical scale structures, strain gauge sensors, and internal and external temperature and humidity sensors, placed in the same locations within each hive.
Smart hives can be equipped with RFID tags for identification. The RFID tag memory can store various types of information, such as details about the hive manufacturer and its owner, the bee breed, the treatment history, the history of the bee colony living in the hive, and the hive’s location history. This feature is particularly useful for the documentation of operations by beekeepers, or the recording of phenotypic measurements by researchers. The network concept of smart hives envisions the future possibility of synchronizing RFID records with experimental data.
Professional beekeeping and scientific research involve the use of hives in natural conditions, such as forests, meadows, mountains, or fields. Sometimes, apiaries are located far from the residences of beekeepers or scientists, which creates additional requirements for the durability of IoT power sources. In such conditions, the optimal solution is solar energy. As predicted 10 years ago [47], the future development of IoT systems would involve energy consumption only during data collection and transmission. Furthermore, in Section 2.4, “Principle of Operation of IoT Devices”, a technical solution and algorithm for the operation of the IoT electronic board will be proposed, establishing a balance between the frequency of digitization and data transmission, and the energy consumption of the IoT system. This mode is particularly important when the sun is too low, and little solar energy is produced, but data continuity must still be ensured. Work on improving the algorithm is ongoing.
As proposed in a previous study [24], IoT-equipped hives are classified into “connected hives” and “smart hives”. Both types can collect and transmit data, but a smart hive can also perform intelligent operations. The concept of transferring computing functions from the IoT to the server is logical when creating a network. This approach would expand computing capabilities, reduce the energy consumption of IoT-equipped smart hives, and increase system reliability.
Transferring computing functions to the server, along with a specialized IoT algorithm, minimizes the potential negative impact of electromagnetic fields from IoT devices on bee health and behavior.

2.2. Smart Apiary

The network includes a smart apiary (Figure 5). This continuously operating smart apiary consists of ten smart hives equipped with IoT systems and sensors. These hives transmit data, year-round and around the clock, regarding weight, internal and external temperature and humidity, voltage generated by the solar panel, and GPS location. The IoT devices are powered exclusively by solar energy.
The smart apiary was established in the spring of 2023 in Kyiv Oblast, Ukraine (50°XX′XX.X″ N 30°XX′XX.X″ E, coordinates altered for safety reasons). It is used to collect data on bee life in this region, conduct apicultural research, provide practical lessons for the course “Informatics and Beekeeping”, and enable hands-on experience in managing a smart apiary composed exclusively of smart hives. The smart apiary does not include classic hives.
The use of smart hives by beekeepers or researchers in the apiary allows for the investigation of potential relationships between bee colonies within the smart apiary, through data comparison from individual smart hives. This also facilitates the development and improvement of new smart apiary management methods, and enables comparison between smart apiary management practices and traditional beekeeping practices. Such comparisons are particularly important for the practical application of smart apiaries in precision beekeeping.
In the spring of 2023, the smart hives were populated with bee colonies of equal strength and size (four frames densely filled with bees), purchased from a professional bee breeder. The bee species was the European honey bee (Apis mellifera).

2.3. Data Quality Requirements

The main data quality requirements included the following:
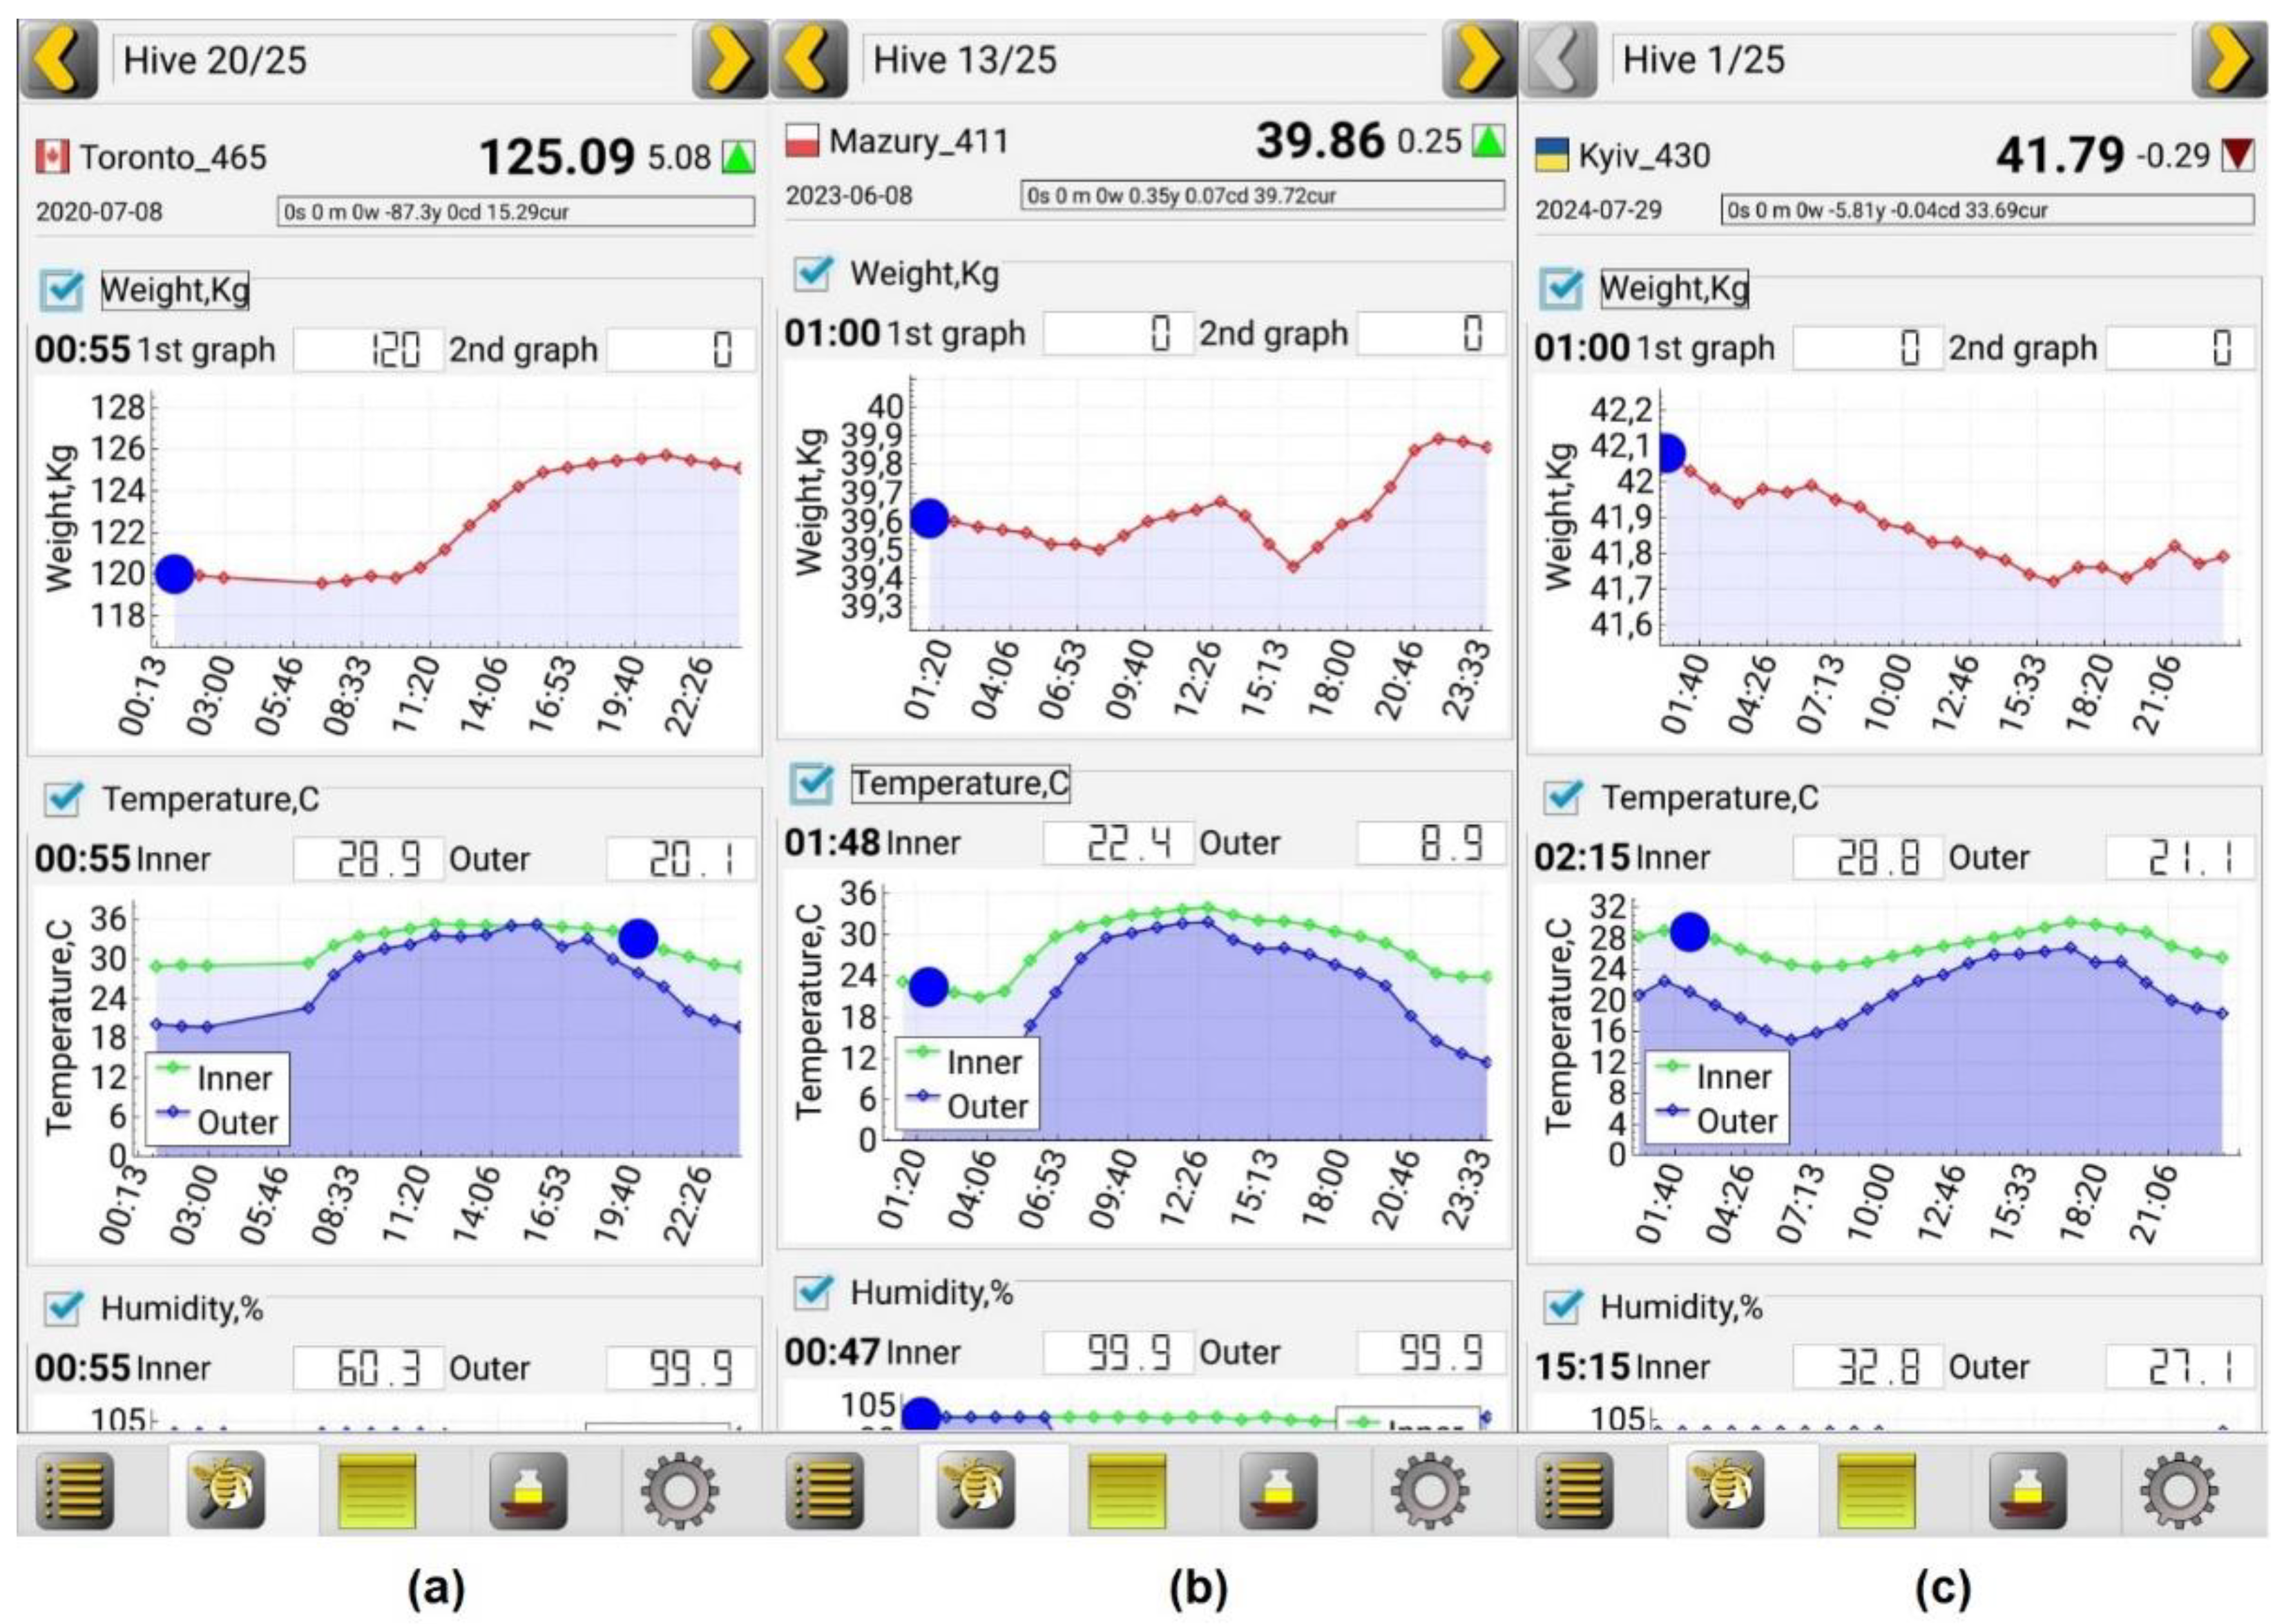
  • Homogeneity. The network uses identical smart hives to ensure correct comparison between different hives and apiaries. All sensors have the same characteristics, and are placed in the same locations, to avoid variations due to technical differences;
  • Accuracy. All smart hives have external temperature and humidity sensors. Thus, the current readings of the external sensors are duplicated within the smart apiary, and in the event of a malfunction, the data from one hive will match the readings of the neighboring smart hive. The set of similar data from a smart apiary will most accurately reflect local weather conditions at the apiary’s location;
  • Consistency. Data are collected year-round, overlapping the life cycles of bee colonies. The data sampling rate depends on solar activity, and ranges from 24 samples in the spring–summer period, to several samples in the autumn–winter period;
  • Timeliness. Beekeepers or scientists receive data almost in real time, and have access to an archive database;
  • Completeness. Experimental data are collected in accordance with the optimal balance between the energy consumption of IoT devices and the types of data, in order to ensure automatic and long-term data collection;
  • Reliability. Reliability depends on the type of sensors and the real-world operating conditions of the smart hives;
  • Reproducibility. In general, experimental data collection is repeated year after year. The data differ due to changes in weather conditions, the influence of gradual global warming, variations in solar activity, and changes in the properties of the next generation of bees, as well as random actions of the beekeeper. The comparison of forecast data with real data is not the focus of this article, but it provides grounds for further research;
  • Scalability. More smart hives and apiaries will be connected in the future. This aspect is not covered in detail in this document;
    Security. Data protection is provided at all stages: from collection to storage and transmission. Users have the option to provide other network users with access to the GPS position of the smart hive, if desired. Access to the database is regulated by data security rules;
  • Interoperability. Given the variety of IoT-based bee monitoring systems, coordinated actions between designers, manufacturers, beekeepers, and scientists are essential.
    The hardware and software for this project are still being improved.
Current and archived data can be accessed on a computer or smartphone through the created software application. Figure 6 and Figure 7 show an example of ten records generated by a smart hive. The columns containing GPS coordinates and SIM card data are omitted for security reasons.
Figure 6 shows the information, where the letters represent the following:
  • A—Date and time;
  • B—The temperature inside the smart hive (°C);
  • C—The temperature outside the smart hive (°C);
  • D—The humidity inside the smart hive (%);
  • E—The humidity outside the smart hive (%);
  • F—The weight of the hive (kg);
  • G—The internal number of the smart hive;
  • H—Processor temperature (°C);
  • I—Database record number.
Figure 7 shows the information, where the letters represent the following:
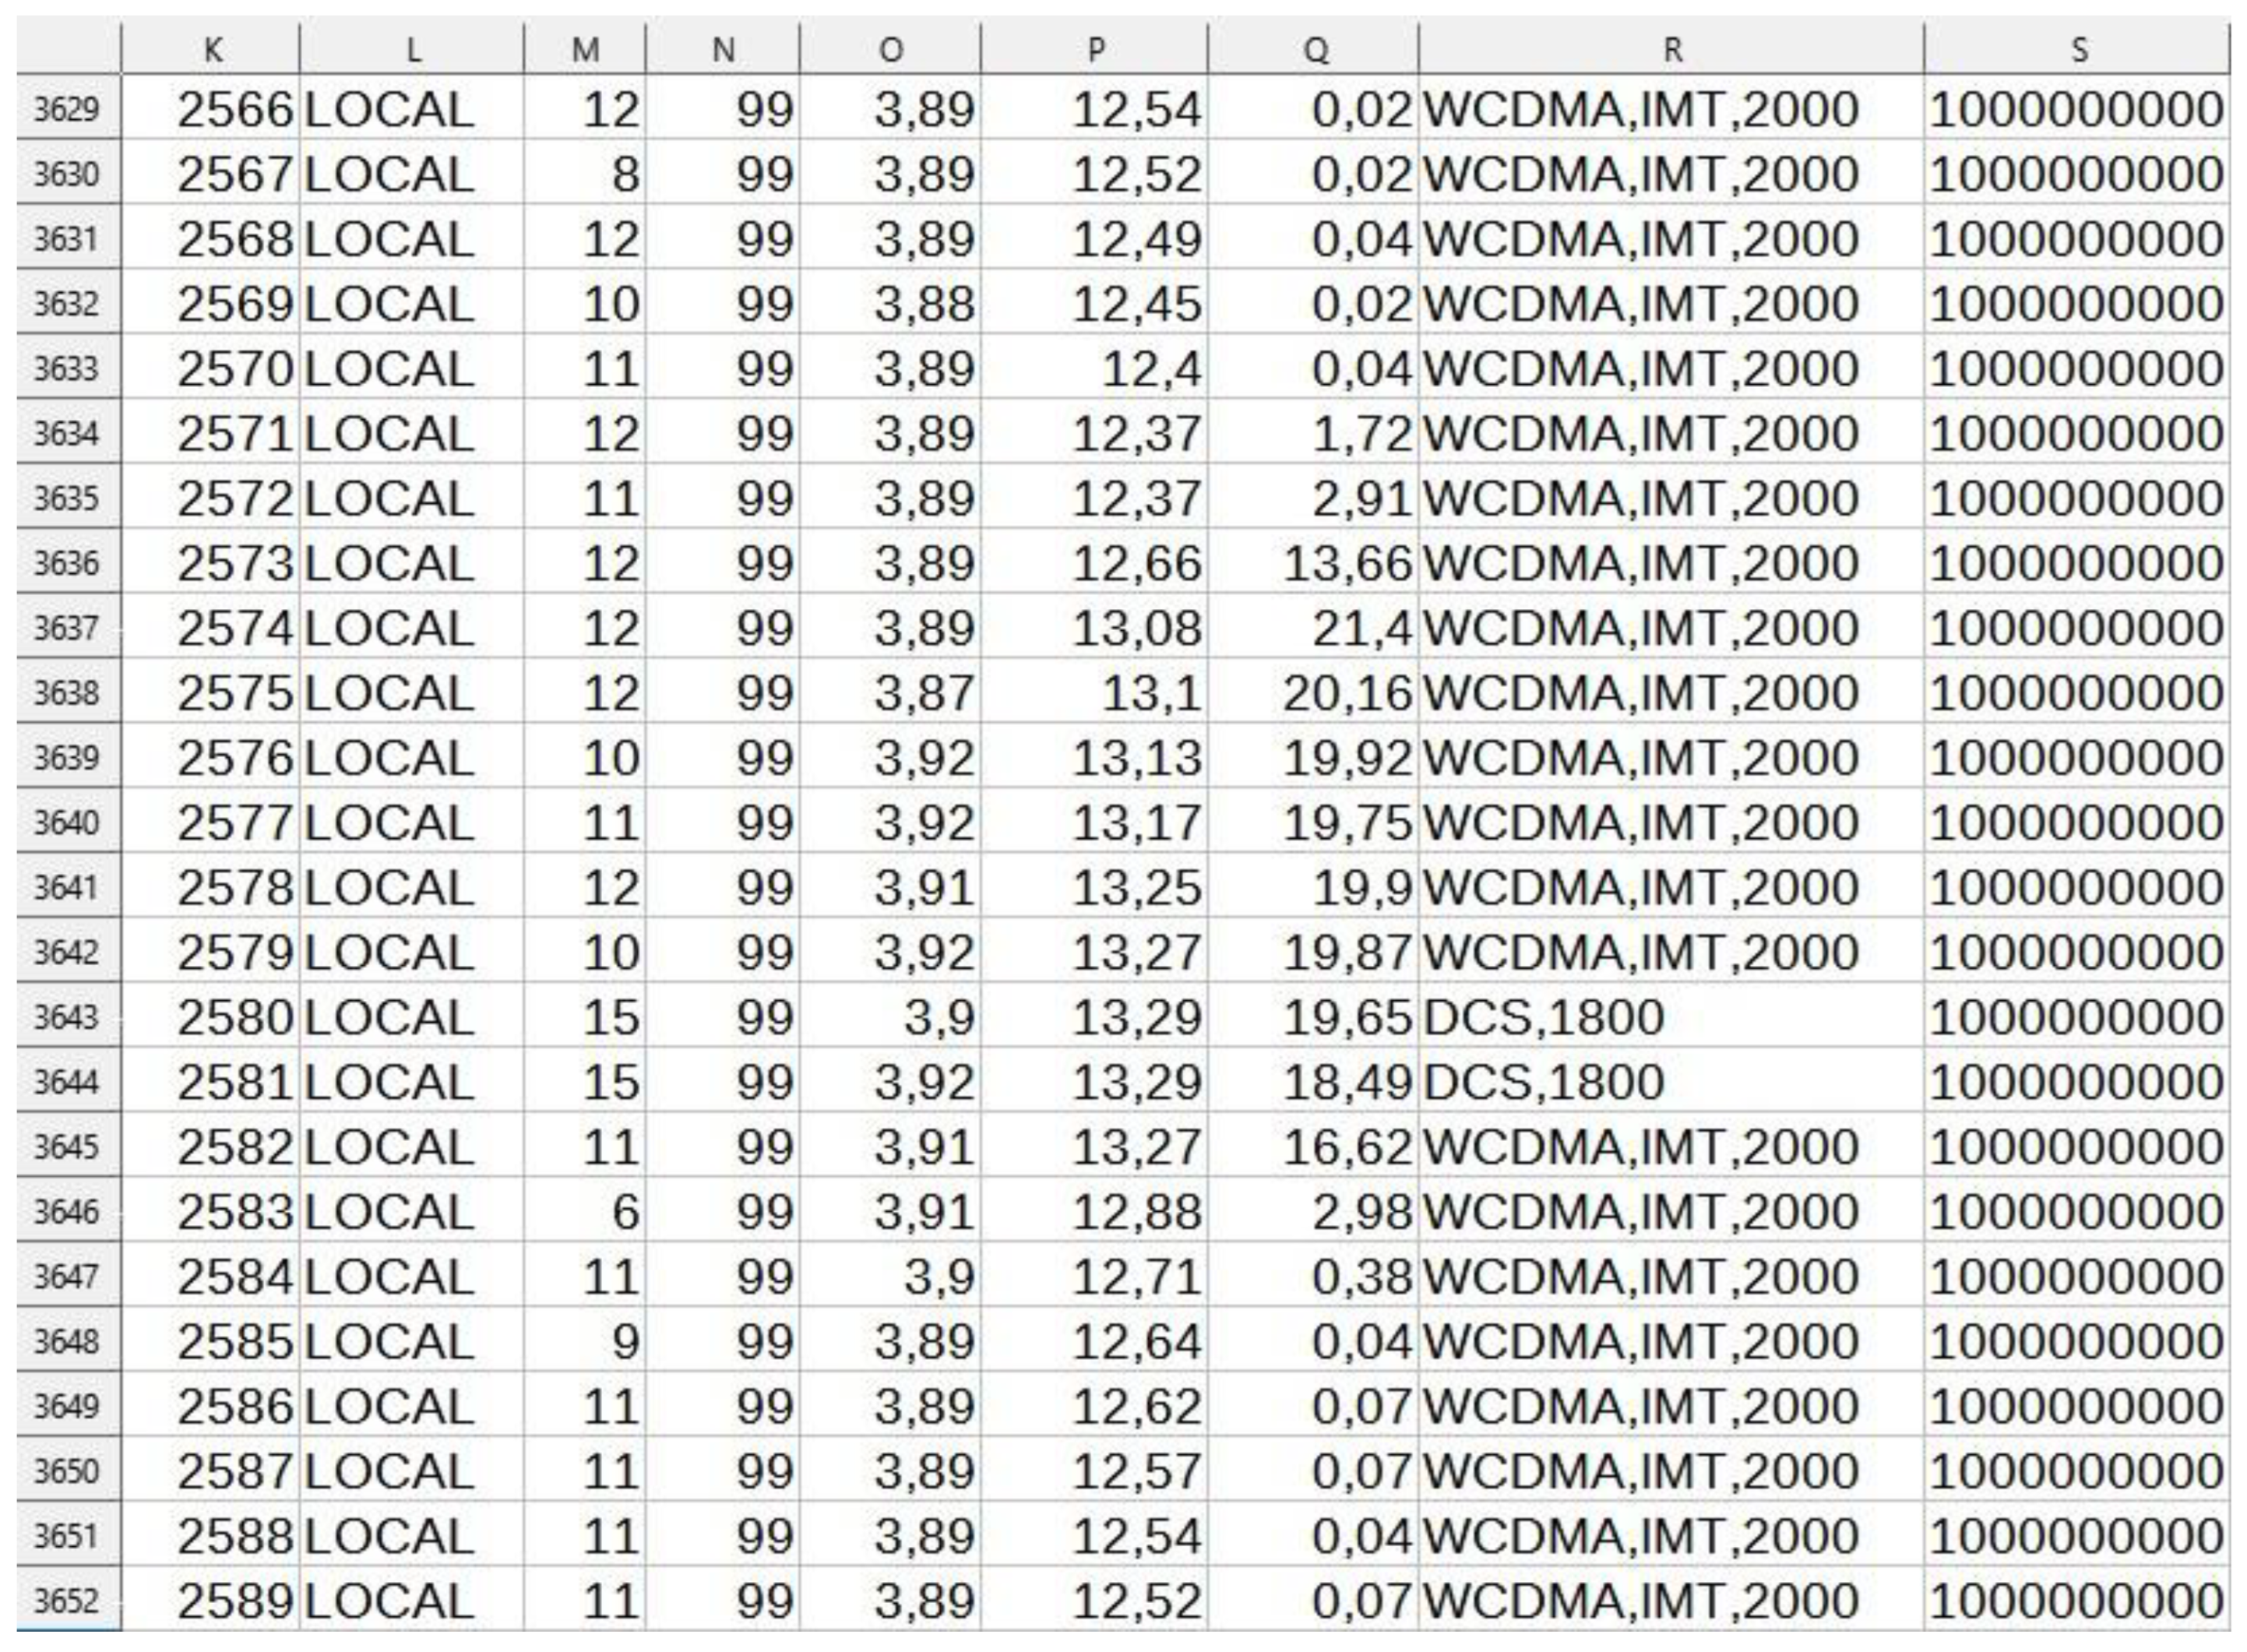
  • K—Record number since restart;
  • L—Local/roaming;
  • M—Signal level (%);
  • N—Quality level (%);
  • O—Technical voltage (V);
  • P—Battery voltage;
  • Q—Solar panel voltage (V);
  • R—Communication type;
  • S—Error code.
The columns containing GPS coordinates are omitted for safety reasons.

2.4. Principle of Operation of IoT Devices

In our research, we use technology developed to meet two main requirements:
  • Ensuring maximum continuity of data transmission, using only solar energy, which is available year-round at any location where the hive is installed;
  • Ensuring the minimization of the possible negative impact of electromagnetic radiation (EMR) from the IoT device on the health and behavior of bees.
The IoT device remains in hibernation for most of the time. The activation schedule depends on solar irradiance at the hive installation site. During periods of high solar energy, which typically occur in the spring and summer, the IoT device activates once every hour. It collects information from sensors and transmits the data to the server. In the autumn and winter, when solar energy is minimal, the IoT device operates less frequently, typically once every two hours. This cycle aligns naturally with the annual life cycle of bee colonies.
In practice, the collection of information and data transmission via wireless communication takes approximately a few minutes. The short duration of electromagnetic radiation is significantly lower compared to the continuous operation of microcomputers, which are often used to collect video or audio data.
Electromagnetic radiation from IoT devices consists of two main components. The first is the EMR generated during data transmission from IoT devices to the server through wireless communication channels. These channels operate at frequencies ranging from 433 MHz (LoRa Wan) to 5 GHz (Wi-Fi, 802.11 ac). Popular microcomputers such as Raspberry Pi and similar devices are often used as IoT components. These modules typically include either built-in or separate Wi-Fi modules [13,14,15,16,18,19,21]. Such modules continuously emit electromagnetic fields over a wide frequency range.
The second component of EMR arises during the execution of computational functions by IoT devices themselves. This type of electromagnetic radiation is less predictable and may have a more significant impact on bees. It involves near-field radiation, where the source of the field is the IoT device itself, its sensors, and the connecting wires between them. The range and other parameters of this radiation can vary significantly. However, during experiments, these components are positioned in close proximity to bees, either inside the hive or nearby.
Therefore, the solutions to minimizing energy use by IoT devices powered by solar panels and reducing the potential negative impact of EMR on the health and behavior of bees lie along the same lines.
The IoT electronics are powered by a switching power supply, which is charged by a battery (UL0.8-12JST, Ultracell (UK) Limited, Liverpool, UK) via a charging module based on the LM2576ADJ (Motorola, Inc., Chicago, IL, USA). The battery is recharged during daylight hours using a solar panel (model: CL020-12, CEL-LINE; rated power: 20 W, rated current: 1.15 A, rated voltage: 17.5 V, open circuit voltage: 22.0 V). The solar panel dimensions (340 × 450 × 25 mm) are ideal for Langstroth hive structures.
Upon device activation or the start of a new cycle, the microprocessor (ATmega328P, ATMEL Corp., San Jose, CA, USA) checks the battery status. If the voltage drops below 12V, the microprocessor switches to a low-power mode until the next cycle (set to one hour), and activates the “hysteresis control” mode. The system remains inactive until the battery voltage exceeds 12.8V. If the voltage is above 12V and no hysteresis mode is active, the processor powers the sensors and the GSM/GPS module (SIM5320).
While the GSM/GPS module registers on the mobile network, the microprocessor reads data from the temperature and humidity sensors (DHT22/AM2302) and the weight module (L6E 200kg C3, Zemic Europe B.V., Etten-Leur, The Netherlands). The microprocessor then instructs the GSM/GPS module to retrieve GPS coordinates. Once the data are collected, the microprocessor formats a data string and transmits it to the server via the GSM/GPS module.
The dataset includes the following:
  • Internal temperature and humidity;
  • External temperature and humidity;
  • Hive weight;
  • Hive GPS coordinates;
  • Technical information: cycle counter, battery voltage, solar panel voltage, error codes from previous transmission attempts, etc.
The DS3231 real-time clock chip manages cycle timing and wake-up functions. If the external temperature exceeds +5 °C, the cycle interval is set to one hour. If the temperature falls below +5 °C, the interval is adjusted to two hours. After completing the cycle, the system disconnects power to the sensors and the GSM/GPS module, and enters low-power mode until the next cycle begins.

2.5. Experimental Examples

First, we will demonstrate the visualization of daily bee activity data within a smart hive. These data were collected over more than 6 years from several dozen hives, with a data sampling frequency of every hour/every two hours. These data allow us to demonstrate how the visualization of the robbing honey phenomenon differs.
The visualization of daily data from a smart hive is displayed using screenshots from the AmoHive mobile application, Version 1.5 (43), installed on the beekeeper’s or researcher’s smartphone. Figure 8 illustrates the visualization of scale data, while Figure 9 displays the visualization of scale data, internal and external temperatures, and humidity levels inside and outside the hive.
Visualizing data on a smartphone is more practical than using a computer, as smartphones are increasingly being used, and have become the primary tool in precision beekeeping.
The periods of daily honey bee activity can be divided into three main phases:
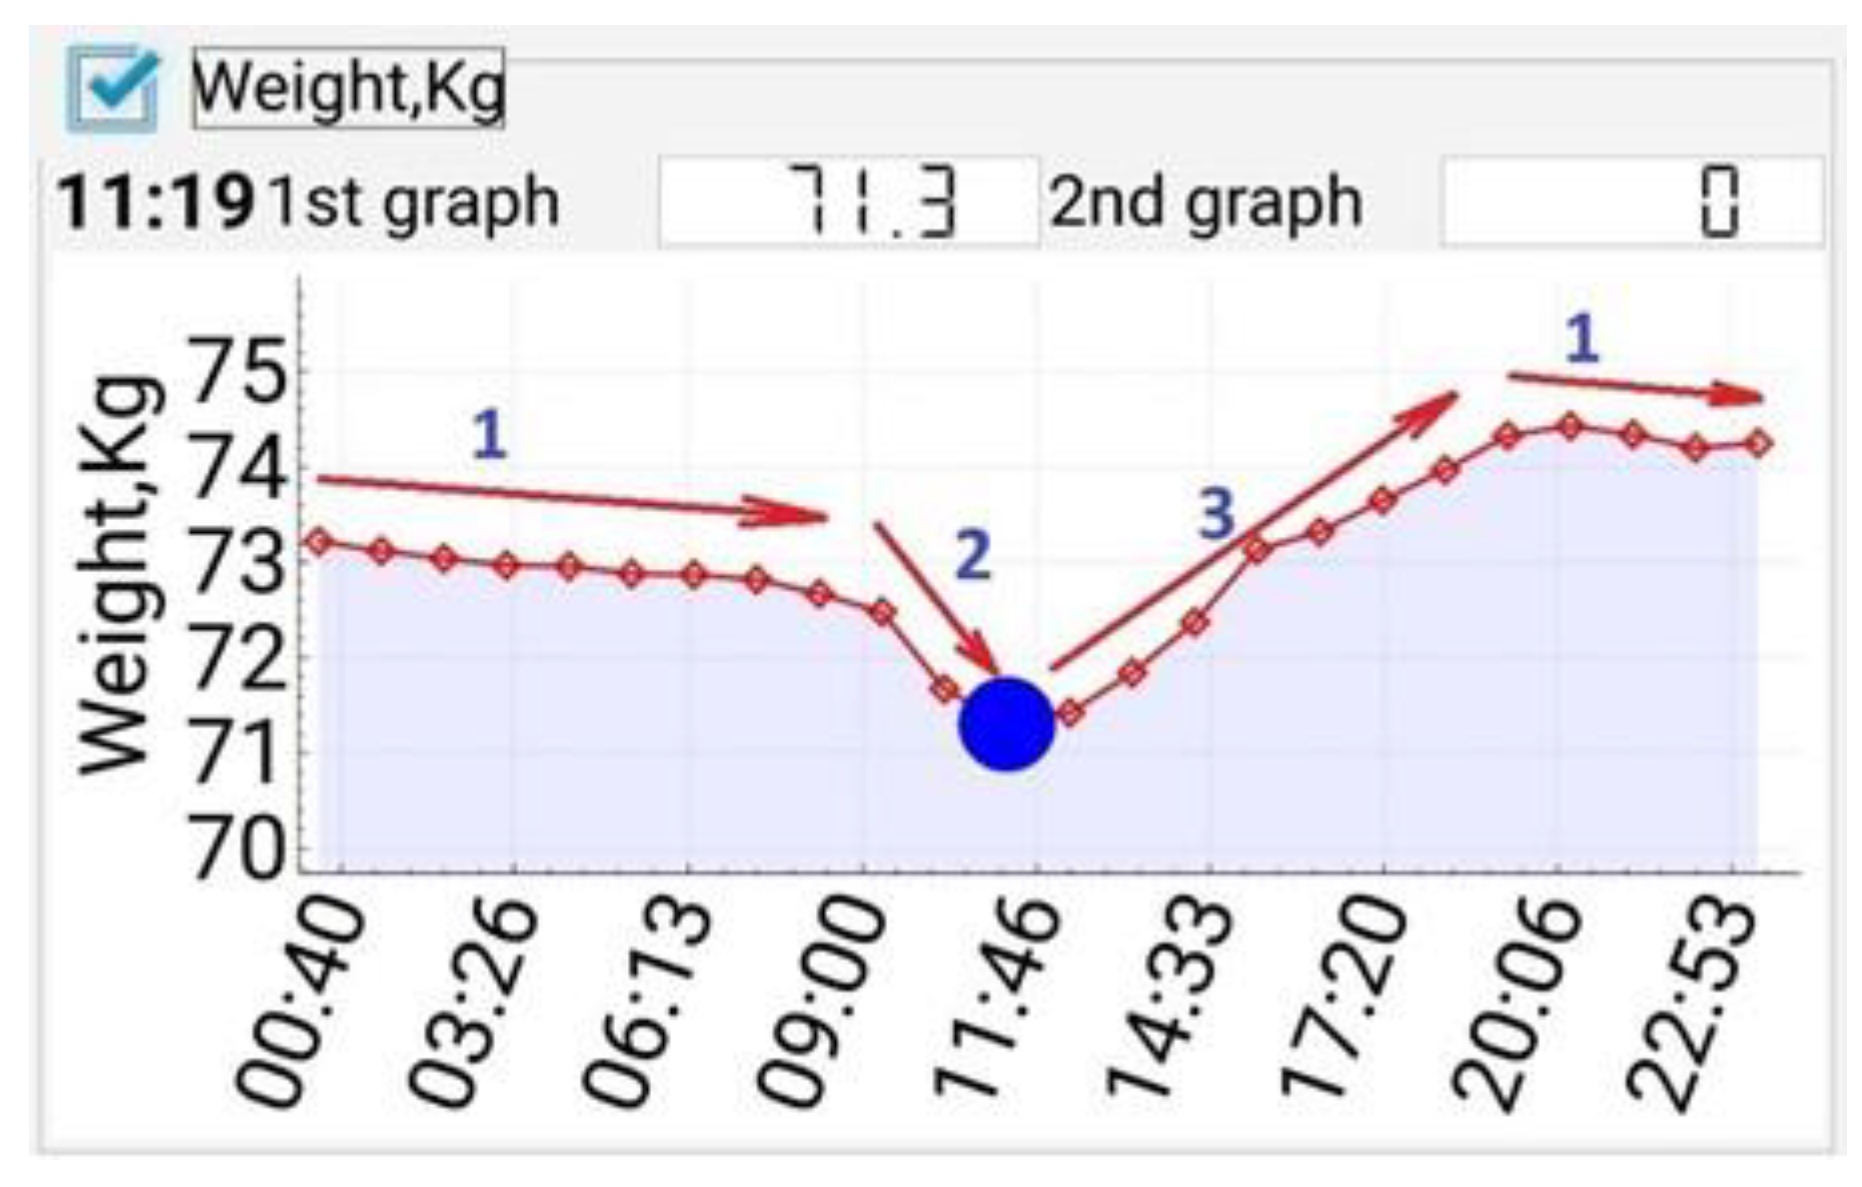
  • Night-time: During this period, the weight of the hive gradually decreases, due to the evaporation of water from the nectar collected the previous day;
  • Departure of foragers: At the start of daylight hours, bees leave the hive. This occurs depending on the current weather conditions and the number of foragers in the colony;
  • Return of foragers: This phase involves bees returning with nectar and pollen to the hive.
The graph of weight change may show two or more minima, due to fluctuations in local weather conditions, forager movement, and nectar availability in the wild.
The daily hive weight data typically follow this pattern, except during the winter period. One of the main criteria that characterize the strength of a bee colony is the number of foragers. A greater number of foragers results in a more pronounced midday weight minimum. With the arrival of spring, the amplitude of this daily weight minimum tends to increase. Conversely, in autumn, as daylight shortens, food availability decreases, the number of foragers declines, and the bee colony weakens, leading to a less pronounced weight minimum.
This trend has been observed consistently, over several years, with various honey bee breeds in the multiple countries where these smart hives are installed. Comparison of multi-year data for the same period from the same smart hives reveals minor deviations and annual trends. These deviations depend on current weather conditions, global climate change trends, and the unique characteristics of the new generation of bees within the smart hive.
Figure 9 presents data visualizations on a smartphone for three cases, based on food availability in nature.
A lack of food in nature forces bees to search for food in other hives. Prolonged food scarcity provokes bees to engage in robbing weaker bee colonies.
Robbing is characterized by a significant decrease in hive weight and an increase in internal temperature compared to the external temperature. The magnitude of these changes depends primarily on the intensity and scale of the robbing activity.
Thus, the phenomenon of honey robbing can be identified through abnormal weight changes and abnormal differences between internal and external temperatures.
An important question is whether it is possible to predict in advance when bees have identified a victim hive. Are there data anomalies that signal impending robbing, and if so, how can this be detected automatically?

3. Results

3.1. Apiary Monitoring and Data

Data preceding and during the mass robbing of a bee colony were obtained in September 2023 at a smart apiary composed exclusively of smart hives. All ten smart hives transmitted data hourly, including weight, internal and external temperatures, internal and external humidity levels, GPS location, and the voltage generated by the solar panel.
Between 25 and 26 September 2023, robbing occurred in smart hive No. 883. Here, we present the visualization of weight changes for all smart hives in the apiary (Figure 10). The visualization includes ten graphs in different colors, each labeled with numbers from 1 to 10. The graph can be divided into several distinct periods:
  • Relative calm (6–17 September 2023);
  • Onset of covert robbing in smart hive 883 (18–24 September 2023);
  • Transition to robbing frenzy (25–26 September 2023).
On 25 September 2023, the weight of smart hive No. 883 decreased by 5 kg, followed by a further 10 kg drop on 26 September. The rate of weight loss was several hundred grams per hour. The bee colony, which had been prepared for winter, ceased to exist.
We analyzed the data from all ten smart hives for the period preceding the honey robbing (6–24 September 2023) and the robbing event itself (25–27 September 2023).
The following findings were established:
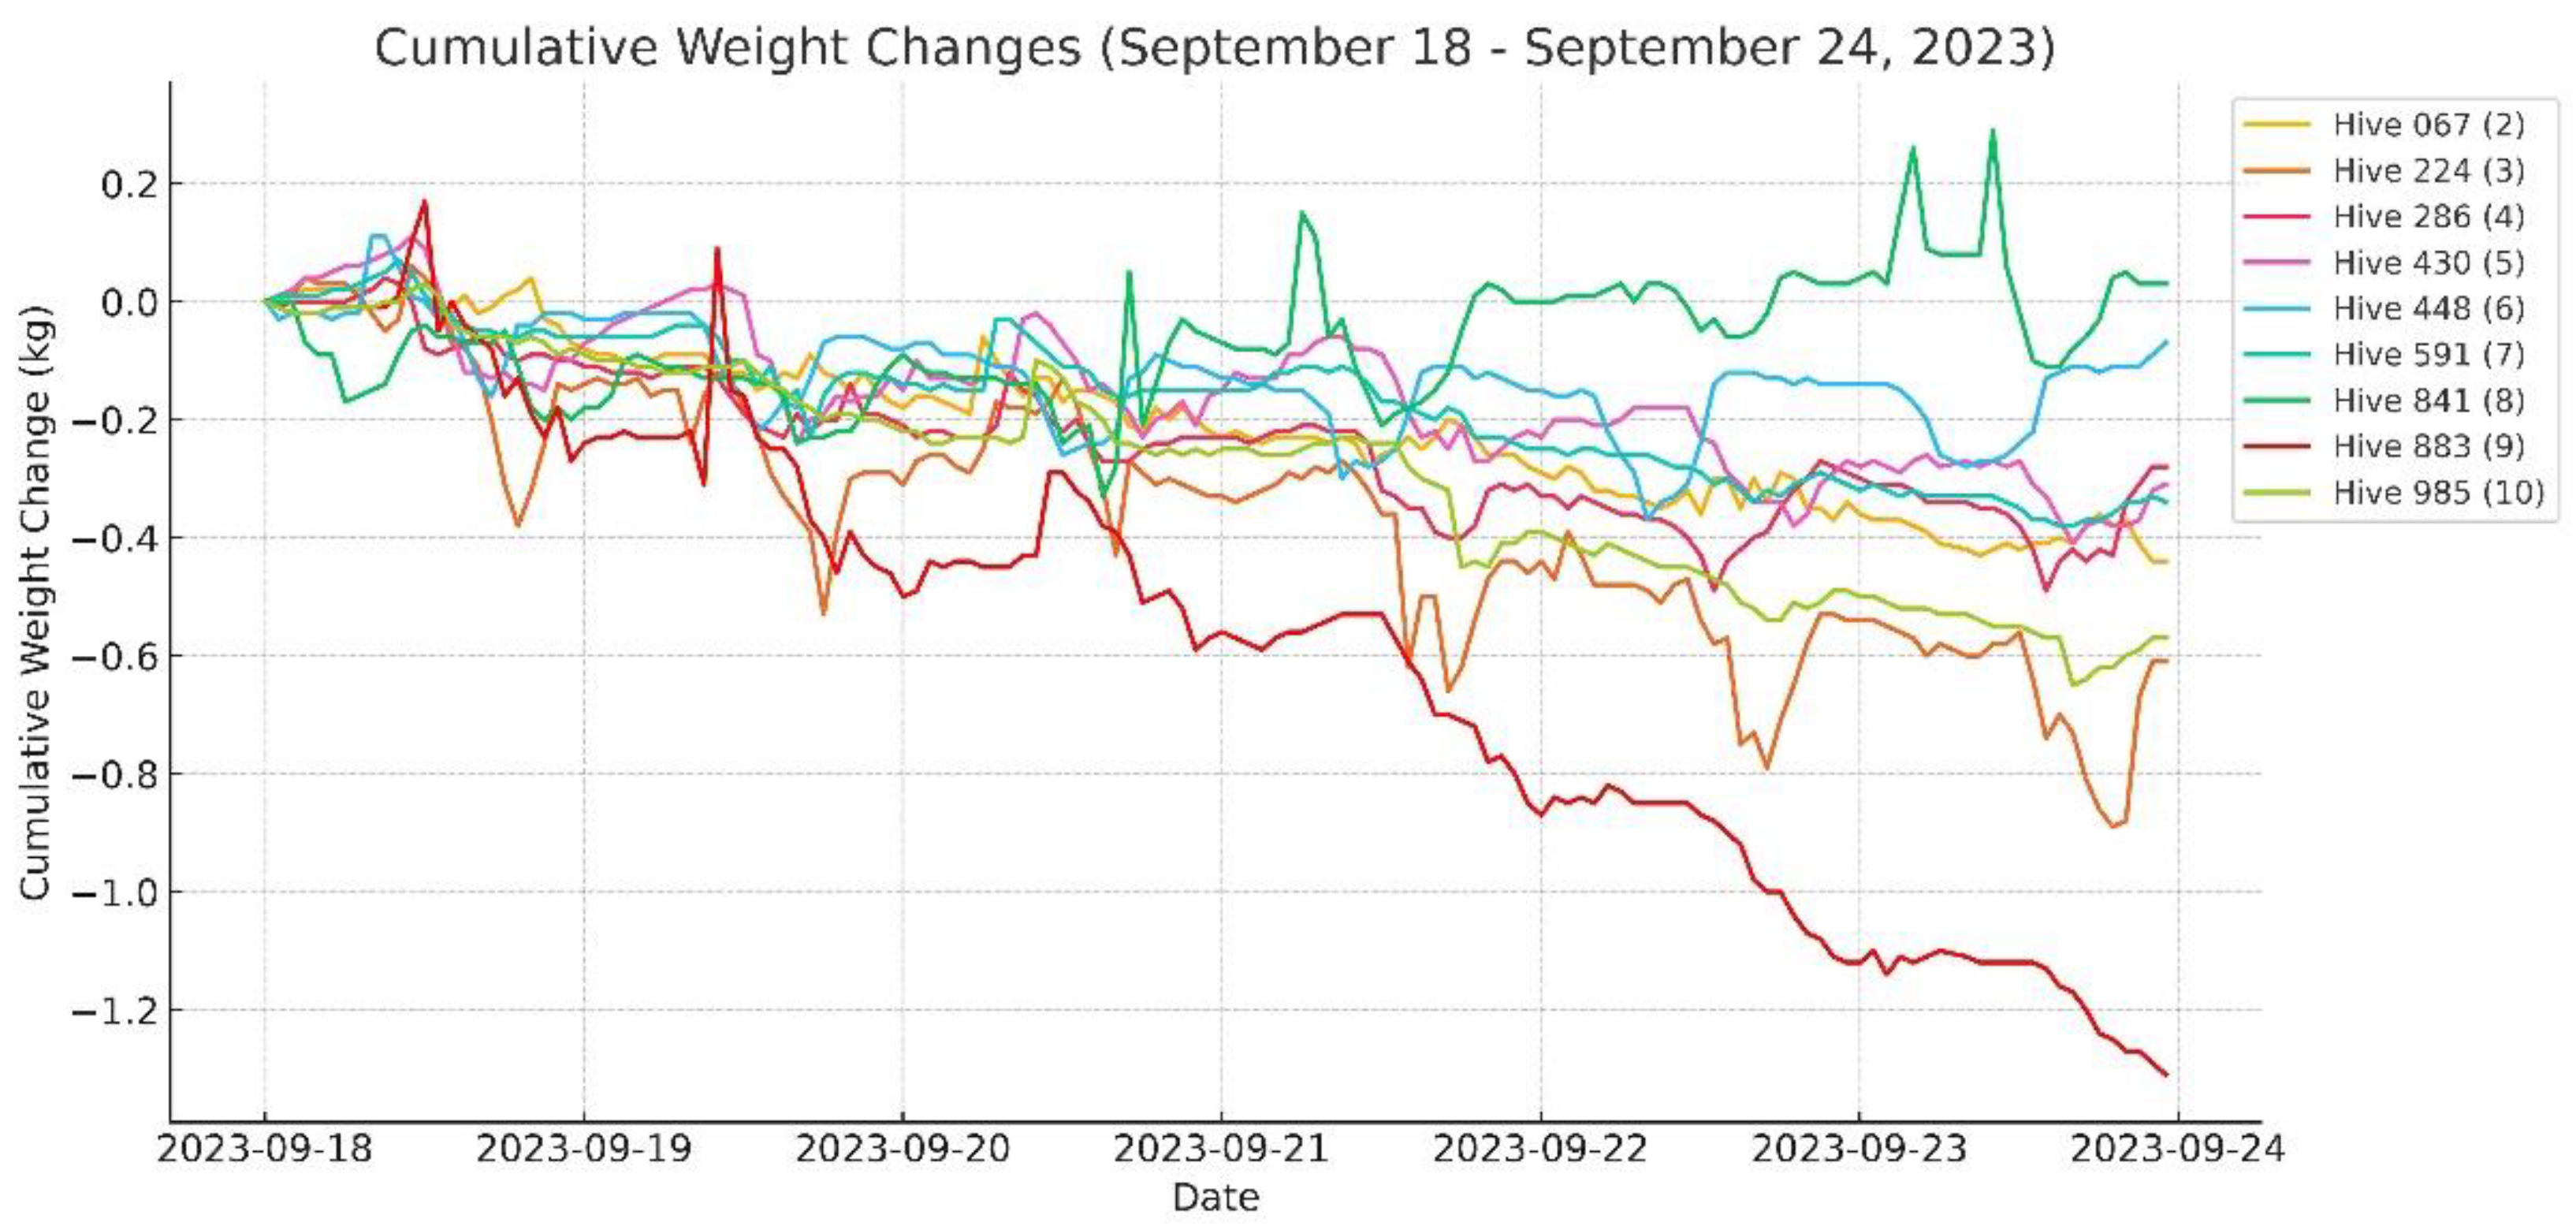
  • During the period of relative calm, from 6 to 17 September 2023, the weight of all ten smart hives gradually decreased at approximately the same rate. This is evident in the lines corresponding to the weight data of the smart hives (Figure 10, lines 1–10). The data from smart hive No. 883 (Figure 10, line 9) and smart hive No. 448 (Figure 10, line 6) are very close, providing a clear view of the overall trend. These lines remain synchronized throughout the calm period, from 6 to 17 September 2023;
  • Approximately seven days before the robbing, from 18 to 24 September 2023, the weight of hive No. 883 began to decrease daily at a faster rate than the other nine smart hives in the apiary. During this period, hive No. 883 lost approximately 70–250 g per day;
  • On 24 September 2023, the day before the robbing, the beekeeper performed routine winter preparations for the bee colonies. He removed two frames from smart hive No. 430 (Figure 10, line 5), and immediately placed them into other hives: one frame in smart hive No. 027 (Figure 10, line 1) and another in smart hive No. 591 (Figure 10, line 7). Being aware of potential threats during food shortages, the beekeeper acted carefully and quickly. However, this did not prevent the honey robbing. The beekeeper performed these actions around 1–2 PM. Most likely, this became the trigger for the robbing frenzy, as the situation was already close to this state;
  • The next day, on 25 September 2023, in hive No. 883, between 10 and 11 AM, a small-weight honey robbing process was observed, similar to the previous days. In the afternoon, however, it escalated into a robbing frenzy. Between 12 PM and 6 PM, the weight dropped by 5 kg, with most honey reserves being stolen during the final two hours. On 26 September, the robbing frenzy continued, starting from 8 AM and continuing until 6 PM, with the weight decreasing by an additional 10 kg. On 27 September, the weight did not decrease further, as hive No. 883 had been completely robbed;
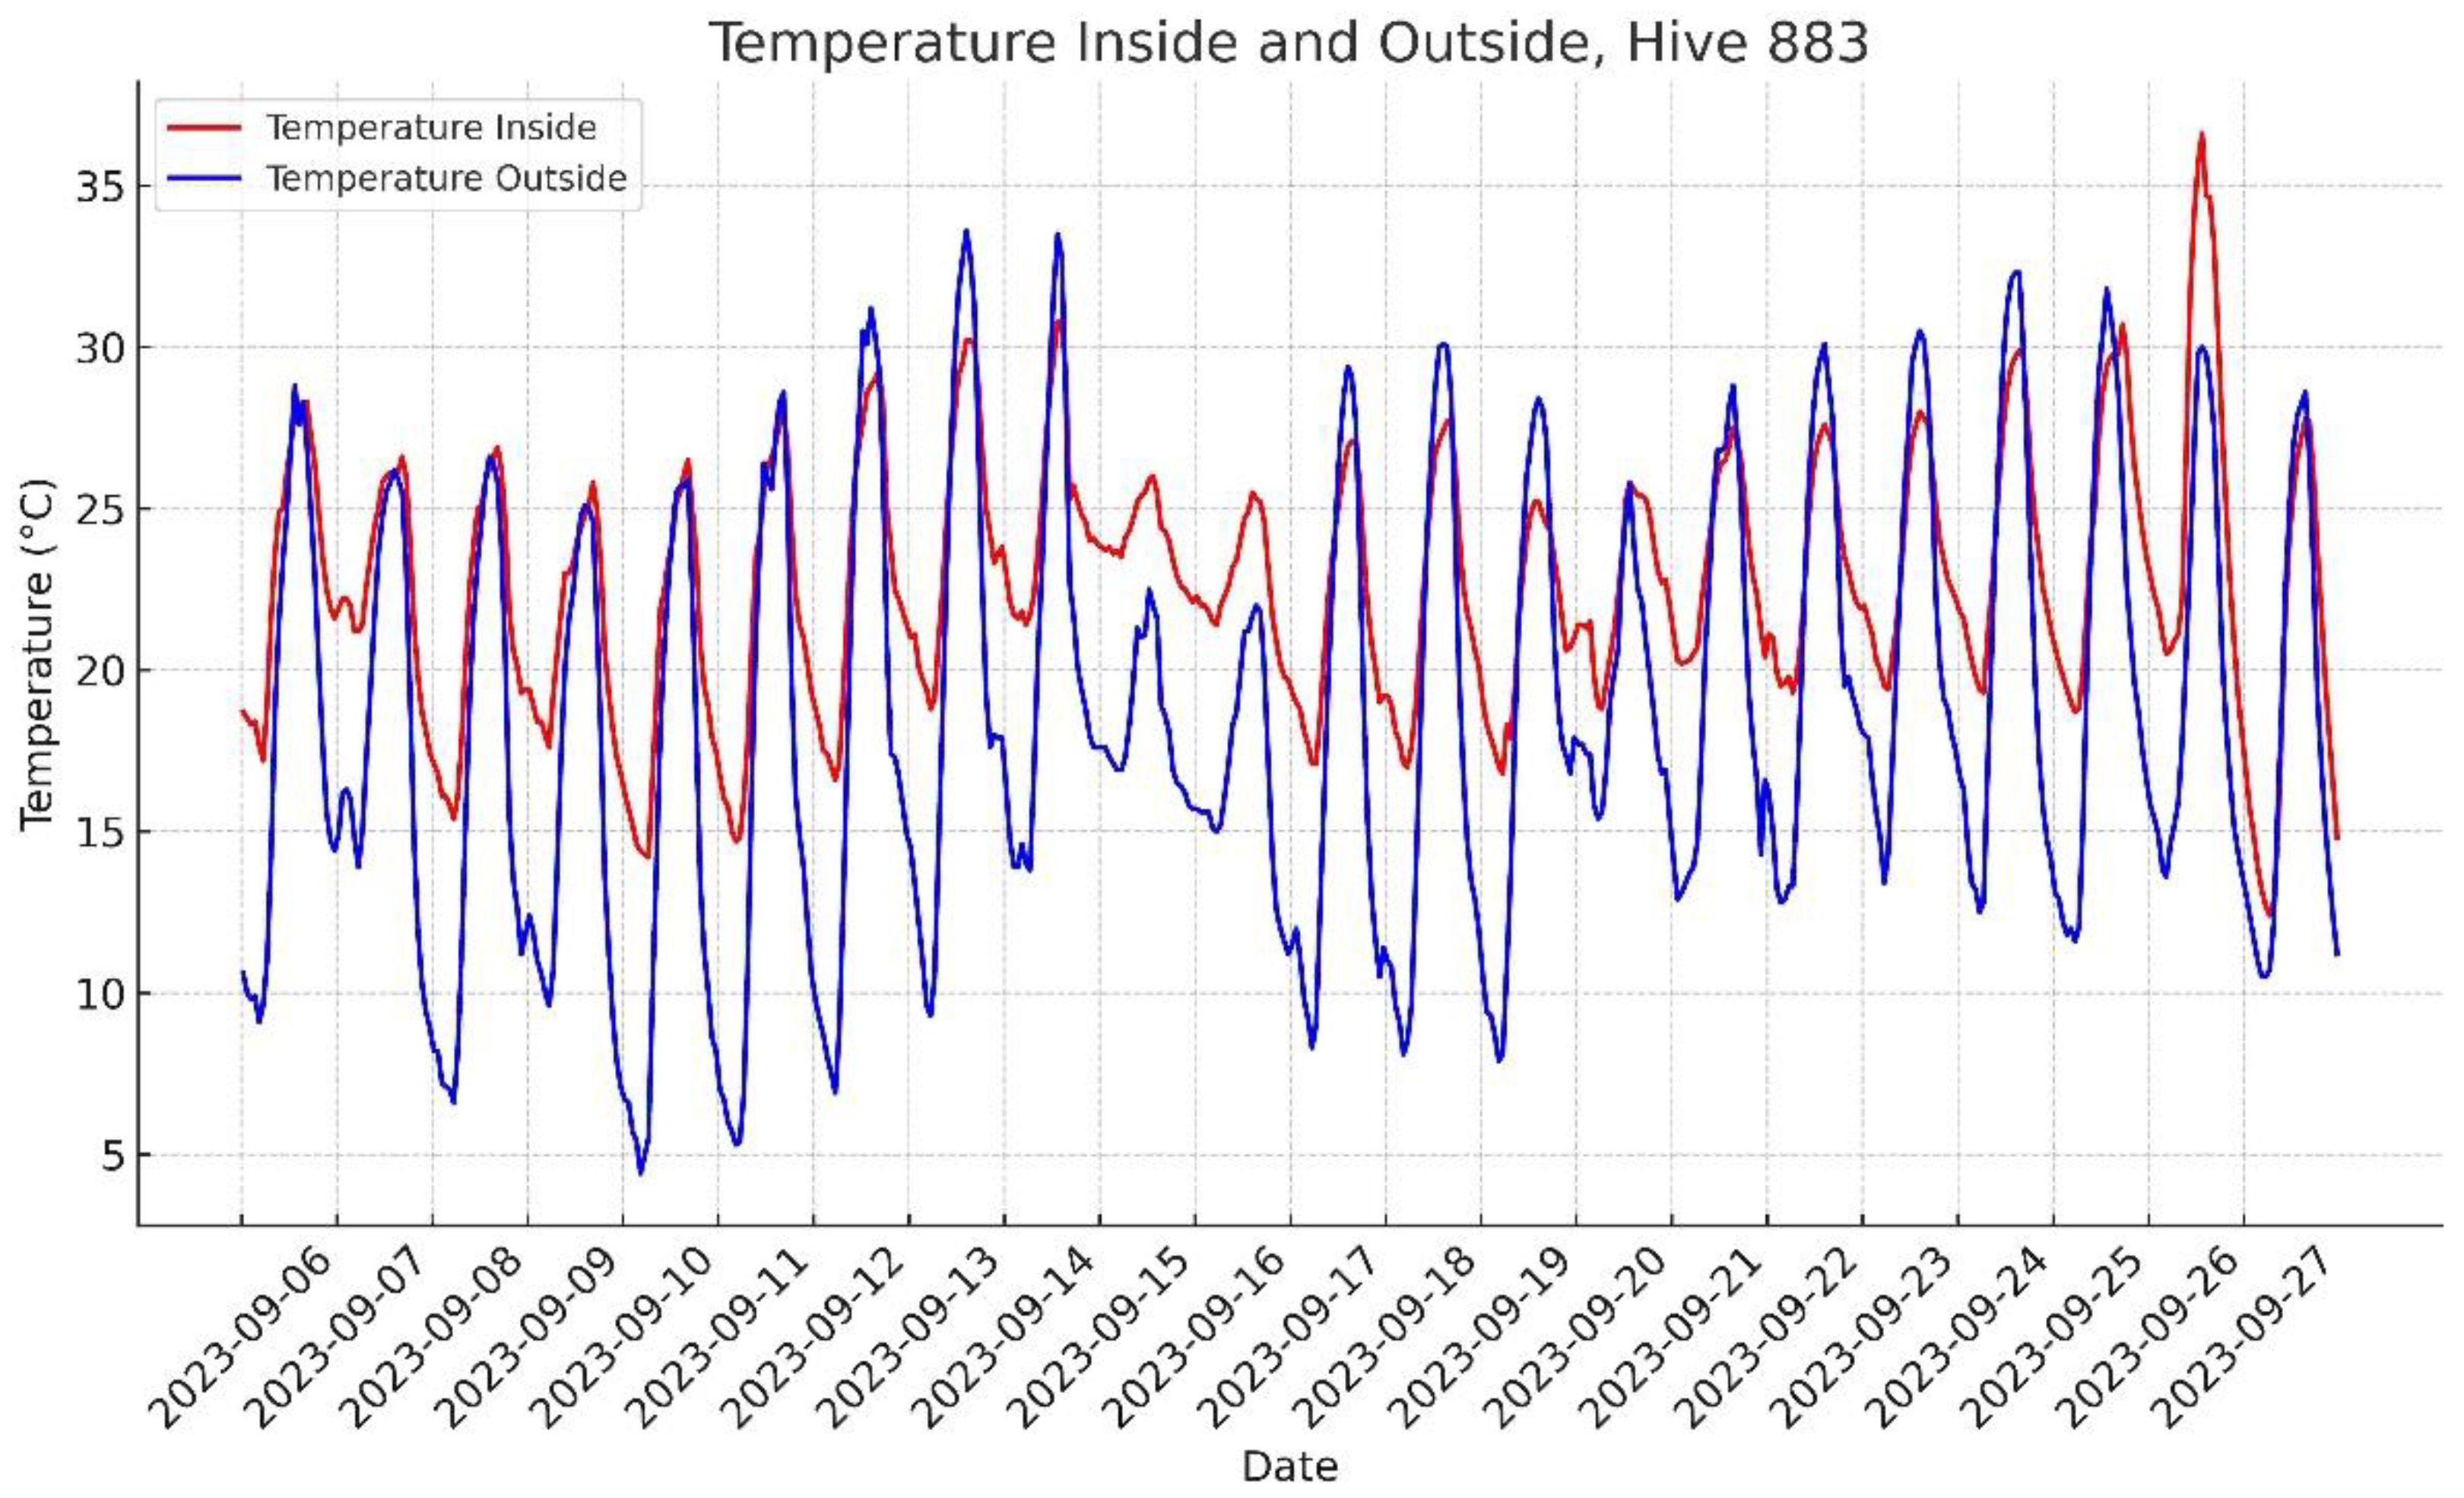
  • The weight change graph for hive No. 883 during the period of calm and covert robbing (6–24 September 2023) is shown in Figure 11. Covert robbing is difficult for a beekeeper or researcher to detect manually, but it becomes apparent through hourly weight measurements only;
6.
It was confirmed that the robbing frenzy process in smart hives manifests through two main criteria: a significant and rapid weight loss of the hive, and a notable increase in internal temperature, associated with the heightened activity of bees. The aggressiveness and mass of the bees entering the hive to rob honey causes a rise in internal temperature (Figure 12). The graph shows an anomalous increase in internal temperature during the afternoon of 25 September 2023. On 26 September, during the peak of the robbing frenzy, the internal hive temperature rose to a maximum of 36.6 °C, significantly exceeding the external temperature. Over the analyzed period, this was the only instance where the internal temperature exceeded the external temperature;
7.
Information on covert robbing recorded seven days before the mass robbing event can be invaluable for timely warning and saving bee colonies. The daily weight loss of the robbed hive was approximately 0.2–0.5% of its total weight. This value was, firstly, not noticeable to the beekeeper, and, secondly, not stable throughout the day. Such values could not initially be classified as anomalies within a single day. However, the accumulated daily weight difference parameter was distinct when compared to similar parameters of other smart hives and the average daily weight change of all smart hives in the apiary;
8.
The bee colonies of the smart apiary did not participate in the robbing honey phenomenon, with the exception of one bee colony: hive No. 286 (Figure 10, line 4). This bee colony, located alongside the others, participated in the robbing to a very limited extent. The amount of stolen honey was approximately 500 g, which is minimal compared to the 15 kg lost by the robbed colony. This 500 g was brought in during the first day of robbing, before 4 PM, that is, before the robbing frenzy began. During this period, smart hive No. 883 lost 1 kg of honey only. Thus, it can be assumed that this bee colony in hive No. 286, along with bees from another apiary, participated in the initial stage of the mass robbing, but later withdrew, and did not transition into the active robbing frenzy. Between 4 PM and the end of the day, hive No. 883 lost another 4 kg, and on the following day, it lost the remaining 10 kg;
9.
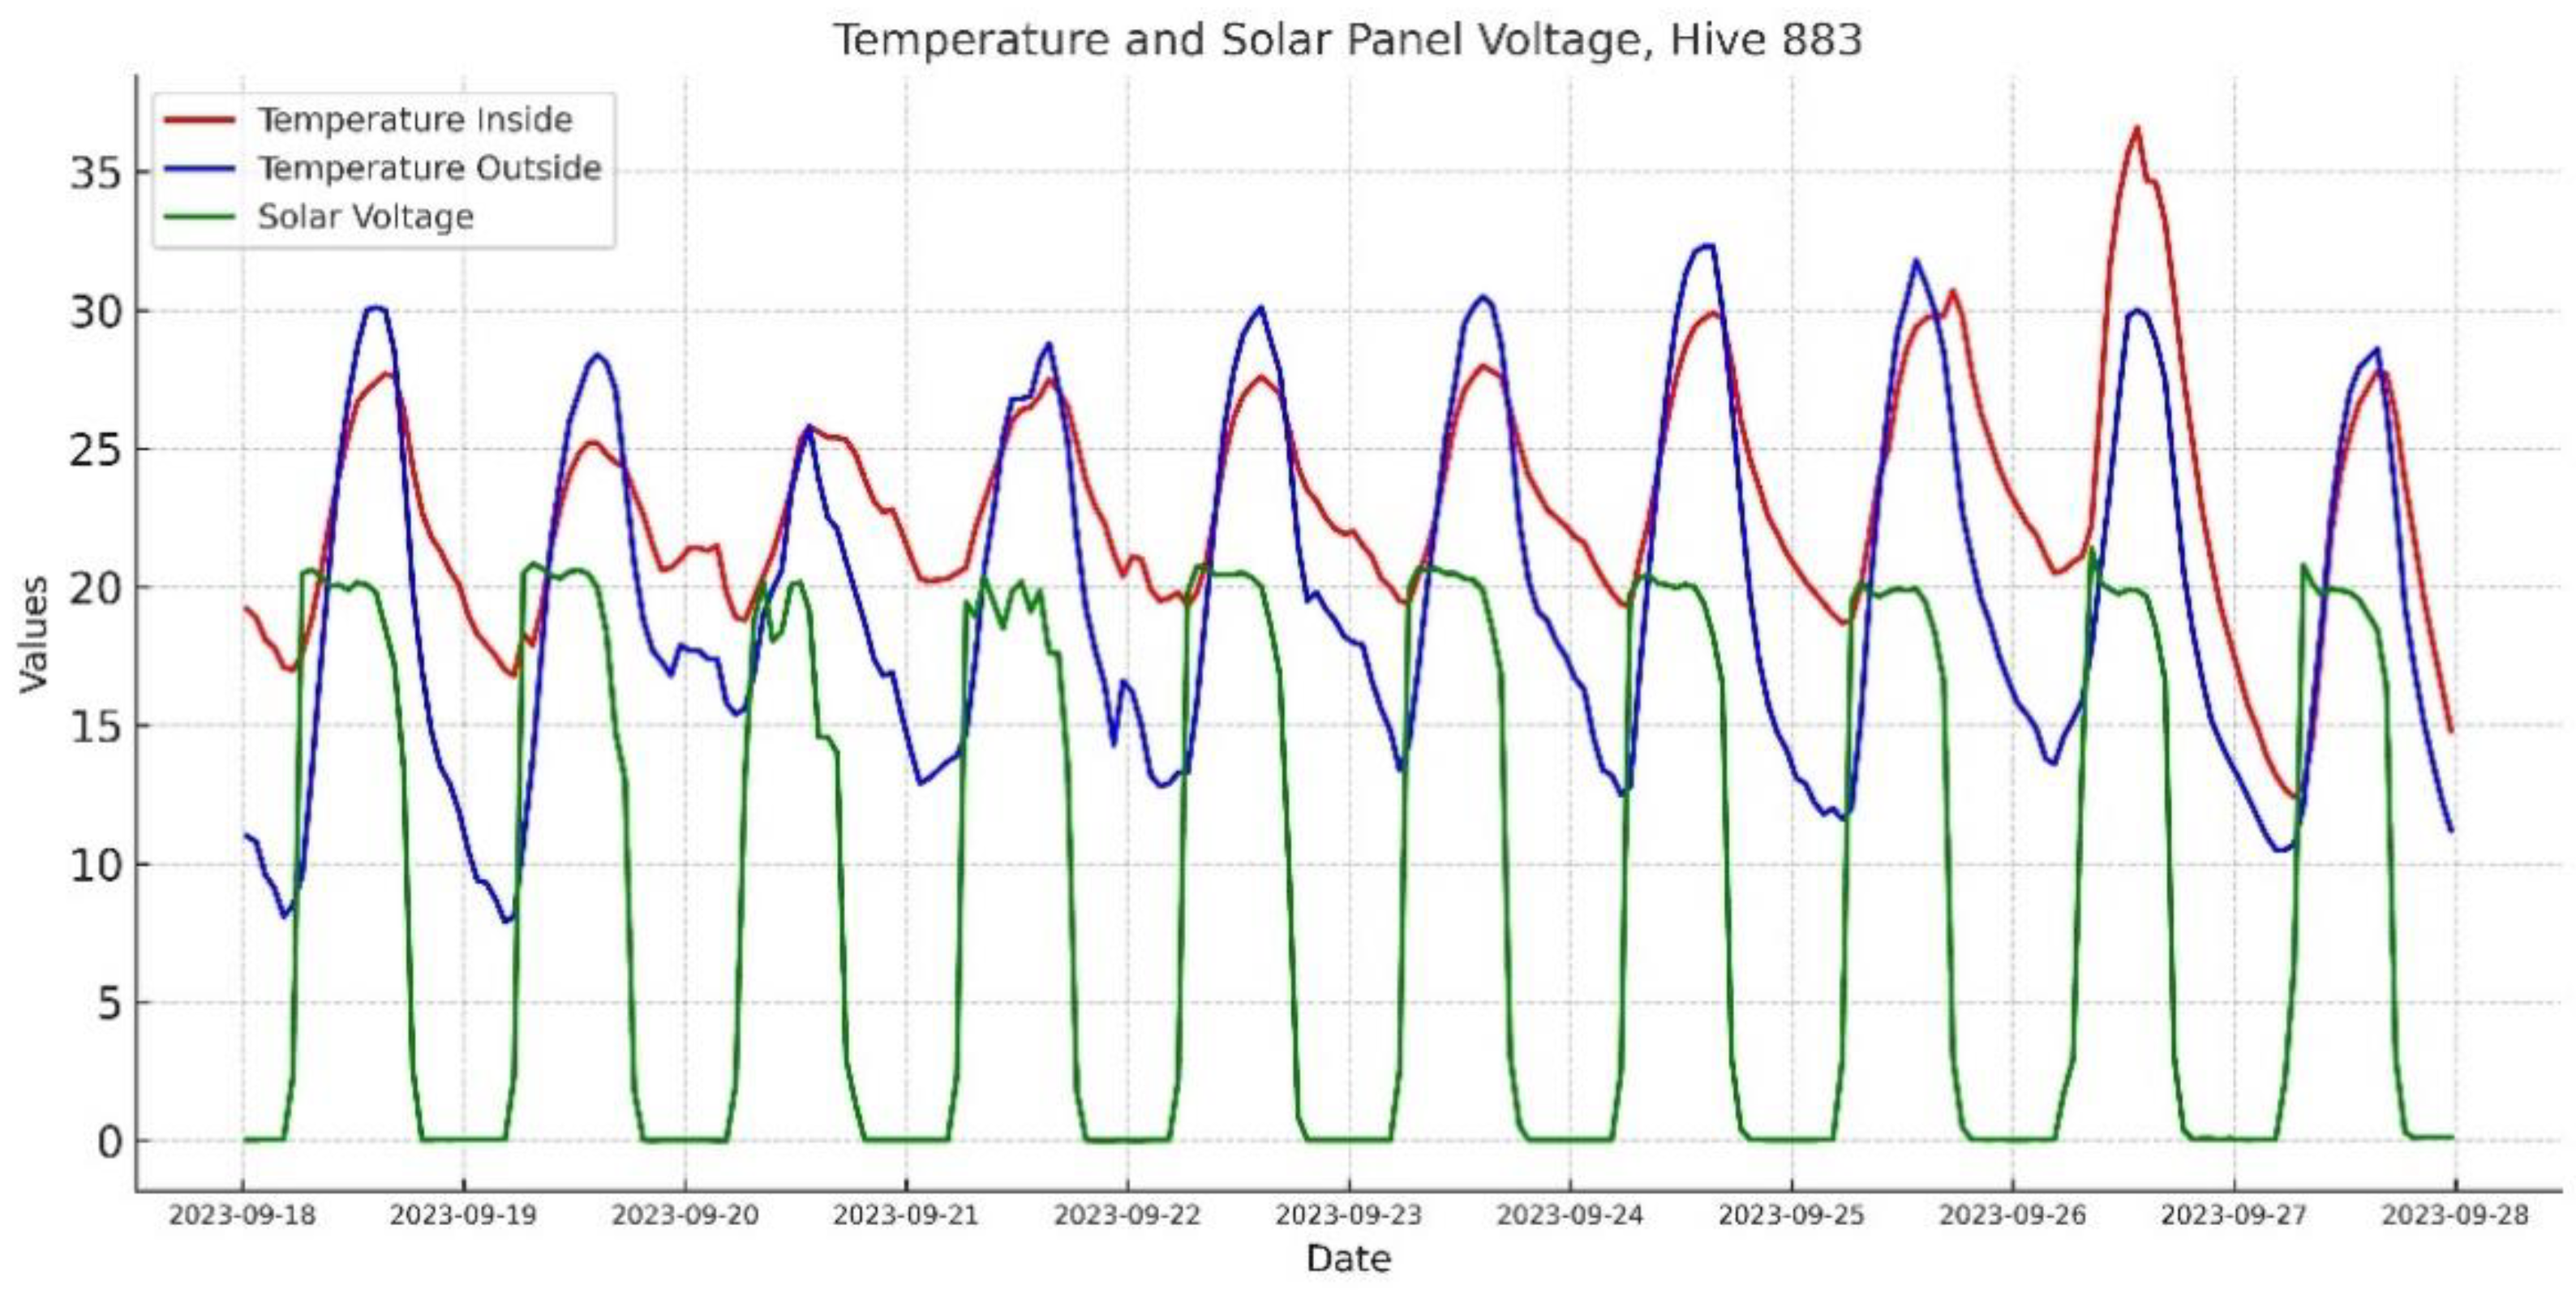
Of particular interest for further research is the analysis of correlations between solar panel data and bee behavior during robbing events.
It is known that bee behavior depends on many environmental factors, including solar irradiance [54]. The solar panel, installed on the front wall of the smart hives, is designed to generate an electrical current for IoT devices. While the voltage data are not direct indicators of solar radiation, they can help to provide insights into bee behavior. The voltage readings from the solar panel terminals fluctuated between 0 and 22 V throughout the day. During the analyzed period, the voltage exceeded 21 V only twice: on September 15 and 26 September 2023. On 26 September, the peak day of the robbing frenzy, the voltage reached a maximum value of 21.4 V, recorded at 08:28:54 AM.
We overlaid the solar panel data onto the graphs of internal and external temperatures of the smart hive (Figure 13). During the covert robbing period, starting from 18 September 2023, the amplitude of daily fluctuations in internal and external temperatures increased. It is possible that the bright, intense sunlight on 26 September 2023 acted as the final trigger for the robbing frenzy. This hypothesis, of course, requires further investigation, as does the overall influence of solar irradiance on bee behavior. Solar panels installed on hives, in addition to serving as energy sources for IoT devices, can become a new and practical source of data on solar irradiance and its effects on bee behavior.
Thus, it can be hypothesized that the mass robbing was carried out by bee colonies from another apiary (or other apiaries) located within the foraging range of the bees. The nearest traditional apiary was no closer than 1 km from this location.
Work on the apiary, particularly the scent from the frames and temporarily opened hives, triggered primarily foreign bees present in the area. These bees detected the scent of food and attacked the colony that had been experiencing covert honey robbing for the past seven days. However, they did not engage in robbing the neighboring hives within the smart apiary, despite having the preconditions for robbing. The stable daily weight loss of all smart hives in the smart apiary indicates a consistent food deficit in nature prior to the robbing event.

3.2. Methods for Calculation and Early Warning of Honey Robbing

We established that early stages of honey robbing in a smart apiary can be detected seven days before the mass robbing event. Thanks to this early detection, the bee colony can be saved. Mass robbing occurs rapidly, leaving the beekeeper unable to react in time if they are away from the apiary and do not observe the visual signs of robbing [55]. It is likely that indicators based on the rate of weight change or the presence of anomalous temperature increases within the hive will not provide a realistic opportunity to save the bee colony. Instead, developing indicators that warn of a potential robbing event several days in advance is both useful and practical. Such an indicator can be created by comparing the cumulative daily weight changes of each smart hive (Figure 14).
For greater representativeness, we excluded the data from smart hive No. 027. The weight fluctuation measurements for this smart hive were inaccurate, due to temporary technical issues related to the mechanical scale structure and wind.
The ranking of weight changes among the smart hives of the smart apiary will highlight the hive experiencing an anomalous situation—the leader in weight changes within the apiary. An anomalous situation may reflect either negative conditions, like colony weakness and reduced defense, or positive ones, such as active nectar collection. The decision will rest with the beekeeper, although such an anomaly will inevitably draw their attention.
At present, the number of smart hives—and even more so, smart apiaries—worldwide is extremely limited. Nevertheless, it is already possible to forecast the development and implementation of automated criteria that will predict the growth and condition of bee colonies using real-time experimental data from smart hives.
The data on honey robbing were obtained without artificially creating conditions for this phenomenon. All observations occurred naturally, under real-world conditions.

4. Discussion

Our research is interdisciplinary, and will be of interest to a broad range of both scientists and beekeepers. The creation of a small experimental IoT smart beehive network, which has been operational for over six years across multiple countries in the Northern Hemisphere, opens new avenues for researchers studying honey bees.
As highlighted in the recent study by Xinyu Wang et al. [10], research on honey robbing, which often leads to the destruction of bee colonies and the transmission of diseases [56], remains relatively limited. Our experimental data on the prerequisites, onset, and progression of honey robbing contributes to filling this gap.
The IoT smart beehive network we have developed offers several key advantages:
  • The network consists of both individual smart hives and their integration into a smart apiary. The absence of traditional hives within the smart apiary allows for data comparison between hives, enabling the analysis of inter-colony relationships. This feature positively differentiates our approach from the BEEHAVE model [44], whose major limitation is that it only considers a single colony, thus ignoring interactions between colonies within and across apiaries [45]. Simultaneously monitoring data from all smart hives forming the apiary, with honey robbing data as an example, highlights the potential for such comparative analysis;
  • As noted by Chen et al. [38], most mathematical models face limitations due to weak validation with experimental data, which is often attributed to the small sample size and heterogeneity of datasets. Our IoT smart apiary generates homogeneous data year-round, enabling the validation of existing mathematical models;
  • Machine learning methods, as outlined in [46], require high-quality data to predict colony behavior and dynamics. In our network, identical smart hives and standardized solutions are used to ensure measurement consistency and enable effective data comparison. Stationary sensors and connecting cables between the sensors and the IoT devices are installed within the walls of the hives. In contrast, most existing IoT-based monitoring systems involve attaching sensors to pre-existing hives. As a result, the design and geometric dimensions of such hives may vary, and the placement of sensors inside and outside the hive is often non-standardized. This leads to reduced data homogeneity, and the comparative value of such data may be limited. Moreover, the connecting wires and technological openings between the IoT components (typically mounted outside the hive) and the internal sensors create what is known as a “thermal bridge”. While this effect may be negligible in summer, it becomes critical during winter. Such a “thermal bridge” can not only affect bee behavior and distort data, but can also lead to the chilling of the colony in winter, or even its death. Our solution avoids these issues, as all equipment is mounted in a fixed manner, and connecting cables are routed inside the walls of identically constructed hives. This ensures reliable thermal insulation and, consequently, the validity of the non-invasive data collected throughout the year. While this may seem like a minor consideration at first, it is of considerable importance for scientific research in northern regions. An example of this is the use of such smart hives for scientific research in Canada for over six years. Since spring 2019, researchers have been conducting continuous monitoring of bee colonies to study the mitochondrial functions and metabolic flexibility of honeybees in temperature adaptation and aging processes [57,58,59], facing sharp changes in weather conditions and significant annual temperature fluctuations ranging from minus 30 °C in winter to plus 35 °C in summer;
  • Our IoT systems for smart hives exclusively use solar energy. This provides advantages over other IoT-based monitoring systems for bees, as our smart hives can be installed in natural environments where bees reside, including mountains, forests, fields, and meadows, where mobile communication is available. A single data packet is very small—around 2 kB. This data volume is sufficient to transmit key information that is necessary for assessing the current state of bee colonies. The small amount of transmitted data and low requirements for communication quality highlight our solution as attractive compared to other IoT systems using popular microcomputers such as Raspberry Pi or similar devices with Wi-Fi or Bluetooth communication [13,14,15,16,18,19,21], although our system does not support the transmission of video and audio data. It is essential to strike a balance between the volume of monitoring data and the information required to diagnose bee health and behavior;
  • The IoT’s operating mode is designed to minimize energy consumption while ensuring the year-round operation of the electronics. This significantly reduces the impact of electromagnetic fields on bees. The negative effects on health and behavioral changes in bees have been previously confirmed [49,50,51,52]. Greggers, U. et al. [49] hypothesized that bees accumulate electric charges during flight and body movements, and that the movement of bees with accumulated electric charges, especially during the waggle dance, generates a small electromagnetic field. This field may affect the antennae of bees, influencing their communication. According to electrodynamics principles, the movement of charged bodies in an electromagnetic field generated by IoT devices could potentially interfere with bee communication and alter their behavior. Studies [50,52] highlight the negative impact of extremely low-frequency electromagnetic fields (ELF EMFs) on the cognitive and motor abilities of honey bees. Exposure to 100 μT ELF EMFs reduced aversive learning performance by over 20% [50]. Exposure to 50 Hz ELF EMFs at levels ranging from 20 to 100 µT, found at ground level below powerline conductors, was shown to reduce learning, alter flight dynamics, reduce the success of foraging flights towards food sources, and reduce feeding [51]. In study [52], honey bee queen larvae were exposed to radiation from a common mobile phone device (GSM band at 900 MHz) during all stages of their pre-adult development. Although mobile phone radiation educed the hatching rate of honey bee queen larvae, the researchers note that caution is needed in interpreting these results. Typically, IoT devices are installed directly on the hive wall and operate continuously. For radio waves, the walls of the hive are essentially transparent, as they are usually made of wood, polystyrene, or polypropylene. Although the radiation power of IoT devices is generally low, it can be assumed that the cumulative effect of prolonged exposure may influence bee behavior, and introduce bias into the results of long-term studies and the homogeneity of experimental data. In this context, the widespread use of continuously operating microcomputers, like Raspberry Pi and similar devices, as components of IoT systems may be a new direction for research into their effects on bee behavior and health. The impact of electromagnetic fields from the IoT on bees is insufficiently studied, so it is logical to predict a reduction in its impact even during the development of the network concept and IoT design, which we achieved by creating new IoT devices for the smart hive network;
  • The presence of a solar panel provides an additional advantage in research. Although studies on the impact of solar radiation on bee activity are provided in [55], these studies did not include a correlation with the phenomenon of honey robbing. In contrast, our multi-year experimental data on solar activity at the smart hive installation site, which are synchronously linked with other data from the smart hive regarding bee life, provide a basis for further analysis and planning new year-round studies, such as the impact of solar radiation on honey production, colony development dynamics, or wintering;
  • IoT devices powered by solar batteries ensure sustainable and long-term collection of data on bee life, reduce environmental impact, and contribute to ecological solutions in precision beekeeping. Our research confirms the involvement of bees from other apiaries in honey robbing, underscoring the need for GPS positioning for both traditional and smart apiaries in order to prevent disease spread.
Finally, the behavior of bees, both as attackers and defenders during honey robbing, is an example of the phenomenon of swarm intelligence. A few years ago, inspiration for developing an optimization algorithm based on the foraging behavior of honey bees was used to create an artificial bee colony algorithm for application to various optimization tasks [39]. This algorithm is known for its effectiveness in solving unconditional and conditional optimization problems, as well as multi-dimensional numerical problems in computer science.
It is possible that similar inspiration from honey bee behavior during attacks and in defense of their hive, along with the latest interdisciplinary research in fields such as mathematical sciences and biology (Chen, J. et al., [40]), agricultural science and technologies (Xinyu Wang et al., [10]), and computer science (Tashakkori, R. et al., [21]), combined with the results of our studies based on long-term homogeneous experimental data on bee behavior, may lay the groundwork for new scientific directions.

5. Conclusions

This interdisciplinary study is of significant importance for both the scientific community and beekeepers. It demonstrates the successful integration of IoT technology into beekeeping for monitoring bee colonies, generating homogeneous and continuous data that can be used to validate mathematical models of bee colonies, and applying machine learning techniques to predict bee colony dynamics and honey robbing. Our IoT-powered smart beehive network, powered solely by solar panels, minimizes the negative impact of electromagnetic radiation on bee health and behavior, while ensuring stable data collection. Our work, along with other recent interdisciplinary research, lays the foundation for future advances in both bee research and sciences extending beyond beekeeping into other areas of computational, biological, and agricultural research.

6. Patents

Kurdin, I.; Honey Bee Diagnostic System in Hives. Patent UA133650, 10 April 2019.

Author Contributions

Conceptualization, I.K. and A.K.; methodology, I.K.; validation, I.K. and A.K.; formal analysis and investigation, I.K.; resources, I.K. and A.K.; data curation, I.K.; writing—original draft preparation, I.K. and A.K.; writing—review and editing, I.K. and A.K; visualization, I.K. and A.K.; supervision, I.K.; project administration, A.K. All authors have read and agreed to the published version of the manuscript.

Funding

This research received no external funding.

Institutional Review Board Statement

Not applicable.

Data Availability Statement

The data presented in this study will be available when required.

Acknowledgments

The authors would like to thank professional beekeeper Serhiy Tonkovyd for supporting the smart apiary and Rafal Dyba, Oleksiy Alekseev, and Oleg Klochko for technical support.

Conflicts of Interest

The authors declare no conflicts of interest. The funders had no role in the design of the study; in the collection, analyses, or interpretation of data; in the writing of the manuscript; or in the decision to publish the results.

References

  1. Etxegarai-Legarreta, O.; Sanchez-Famoso, V. The role of beekeeping in the generation of goods and services: The interrelation between environmental, socio-economic, and socio-cultural utilities. Agriculture 2022, 12, 551. [Google Scholar] [CrossRef]
  2. Kremen, C.; Williams, N.M.; Thorp, R.W. Crop pollination from native bees at risk from agricultural intensification. Proc. Natl. Acad. Sci. USA 2002, 99, 16812–16816. [Google Scholar] [CrossRef]
  3. Papa, G.; Maier, R.; Durazzo, A.; Lucarini, M.; Karabagias, I.K.; Plutino, M.; Bianchetto, E.; Aromolo, R.; Pignatti, G.; Ambrogio, A.; et al. The Honey Bee Apis Mellifera: An Insect at the Interface between Human and Ecosystem Health. Biology 2022, 11, 233. [Google Scholar] [CrossRef]
  4. Popovska Stojanov, D.; Dimitrov, L.; Danihlík, J.; Uzunov, A.; Golubovski, M.; Andonov, S.; Brodschneider, R. Direct Economic Impact Assessment of Winter Honeybee Colony Losses in Three European Countries. Agriculture 2021, 11, 398. [Google Scholar] [CrossRef]
  5. Brodschneider, R.; Gray, A.; Adjlane, N.; Ballis, A.; Brusbardis, V.; Charrière, J.D.; Chlebo, R.; Coffey, M.F.; Dahle, B.; de Graaf, D.C.; et al. Multi-country loss rates of honey bee colonies during winter 2016/2017 from the COLOSS survey. J. Apic. Res. 2018, 57, 452–457. [Google Scholar] [CrossRef]
  6. Kulhanek, K.; Steinhauer, N.; Rennich, K.; Caron, D.M.; Sagili, R.R.; Pettis, J.S.; Ellis, J.D.; Wilson, M.E.; Wilkes, J.T.; Tarpy, D.R.; et al. A national survey of managed honey bee 2015-2016 annual colony losses in the USA. J. Apic. Res. 2017, 56, 328–340. [Google Scholar] [CrossRef]
  7. Hristov, P.; Shumkova, R.; Palova, N.; Neov, B. Factors Associated with Honey Bee Colony Losses: A Mini-Review. Vet. Sci. 2020, 7, 166. [Google Scholar] [CrossRef]
  8. Ryan Willingham, R.; Klopchin, J.; Ellis, J. Robbing Behavior in Honey Bees. University of Florida. Available online: https://edis.ifas.ufl.edu/publication/IN1064 (accessed on 18 December 2024).
  9. Grume, G.J.; Biedenbender, S.P.; Rittschof, C.C. Honey robbing causes coordinated changes in foraging and nest defence in the honey bee, Apis mellifera. Anim. Behav. 2021, 173, 53–65. [Google Scholar] [CrossRef]
  10. Wang, X.; Huang, T.; Ji, Q.; Guo, J.; Zhao, Y. Honey Robbing: Causes, Impacts and Preventive Measures. Insects 2025, 16, 15. [Google Scholar] [CrossRef]
  11. Kuszewska, K.; Woyciechowski, M. Risky Robbing Is a Job for Short-Lived and Infected Worker Honeybees. Apidologie 2014, 45, 537–544. [Google Scholar] [CrossRef]
  12. Zaman, A.; Dorin, A. A framework for better sensor-based beehive health monitoring. Comput. Electron. Agric. 2023, 210, 107906. [Google Scholar] [CrossRef]
  13. Cota, D.; Martins, J.; Mamede, H.; Branco, F. BHiveSense: An Integrated Information System Architecture for Sustainable Remote Monitoring and Management of Apiaries Based on IoT and Microservices. J. Open Innov. Technol. Mark. Complex. 2023, 9, 100110. [Google Scholar] [CrossRef]
  14. Kviesis, A.; Zacepins, A. System Architectures for Real-Time Bee Colony Temperature Monitoring. Procedia Comput. Sci. 2015, 43, 86–94. [Google Scholar] [CrossRef]
  15. Cecchi, S.; Spinsante, S.; Terenzi, A.; Orcioni, S. A Smart Sensor-based Measurement System for Advanced Bee Hive Monitoring. Sensors 2020, 20, 2726. [Google Scholar] [CrossRef]
  16. Tashakkori, R.; Hamza, A.S.; Crawford, M.B. Beemon: An IoT-Based Beehive Monitoring System. Comput. Electron. Agric. 2021, 190, 106427. [Google Scholar] [CrossRef]
  17. Uthoff, C.; Homsi, M.N.; von Bergen, M. Acoustic and Vibration Monitoring of Honeybee Colonies for Beekeeping-Relevant Aspects of Presence of Queen Bee and Swarming. Comput. Electron. Agric. 2023, 205, 107589. [Google Scholar] [CrossRef]
  18. Arribas, F.A.; Hortelano, M.R. An Internet of Living Things based device for a better understanding of the state of the honey bee population in the hive during the winter months. Comput. Electron. Agric. 2023, 212, 108026. [Google Scholar] [CrossRef]
  19. Mrozek, D.; Gorny, R.; Wachowicz, A.; Malysiak-Mrozek, B. Edge-Based Detection of Varroosis in Beehives with IoT Devices with Embedded and TPU-Accelerated Machine Learning. Appl. Sci. 2021, 11, 1078. [Google Scholar] [CrossRef]
  20. Kiromitis, D.I.; Bellos, C.V.; Stefanou, K.A.; Stergios, G.S.; Andrikos, I.; Katsantas, T.; Kontogiannis, S. Performance Evaluation of Classification Algorithms to Detect Bee Swarming Events Using Sound. Signals 2022, 3, 807–822. [Google Scholar] [CrossRef]
  21. Tashakkori, R.; Buchanan, G.B.; Craig, L.M. Analyses of Audio and Video Recordings for Detecting a Honey Bee Hive Robbery. In Proceedings of the 2020 SoutheastCon, Online, 12–15 March 2020; pp. 1–6. [Google Scholar] [CrossRef]
  22. Cook, D.; Tarlinton, B.; McGree, J.M.; Blackler, A.; Hauxwell, C. Temperature Sensing and Honey Bee Colony Strength. J. Econ. Entomol. 2022, 115, 715–723. [Google Scholar] [CrossRef]
  23. Zacepins, A.; Brusbardis, V.; Meitalovs, J.; Stalidzans, E. Challenges in the development of Precision Beekeeping. Biosyst. Eng. 2015, 130, 60–71. [Google Scholar] [CrossRef]
  24. Hadjur, H.; Ammar, D.; Lefèvre, L. Toward an Intelligent and Efficient Beehive: A Survey of Precision Beekeeping Systems and Services. Comput. Electron. Agric. 2022, 192, 106604. [Google Scholar] [CrossRef]
  25. Danieli, P.P.; Addeo, N.F.; Lazzari, F.; Manganello, F.; Bovera, F. Precision Beekeeping Systems: State of the Art, Pros and Cons, and Their Application as Tools for Advancing the Beekeeping Sector. Animals 2024, 14, 70. [Google Scholar] [CrossRef]
  26. Andrijević, N.; Urošević, V.; Arsić, B.; Herceg, D.; Savić, B. IoT Monitoring and Prediction Modeling of Honeybee Activity with Alarm. Electronics 2022, 11, 783. [Google Scholar] [CrossRef]
  27. Kady, C.; Chedid, A.M.; Kortbawi, I.; Yaacoub, C.; Akl, A.; Daclin, N.; Trousset, F.; Pfister, F.; Zacharewicz, G. IoT-Driven Workflows for Risk Management and Control of Beehives. Diversity 2021, 13, 296. [Google Scholar] [CrossRef]
  28. Cunningham, M.M.; Tran, L.; McKee, C.G.; Ortega Polo, R.; Newman, T.; Lansing, L.; Griffiths, J.S.; Bilodeau, G.J.; Rott, M.; Marta Guarna, M. Honey Bees as Biomonitors of Environmental Contaminants, Pathogens, and Climate Change. Ecol. Indic. 2022, 134, 108457. [Google Scholar] [CrossRef]
  29. Martinello, M.; Manzinello, C.; Dainese, N.; Giuliato, I.; Gallina, A.; Mutinelli, F. The Honey Bee: An Active Biosampler of Environmental Pollution and a Possible Warning Biomarker for Human Health. Appl. Sci. 2021, 11, 6481. [Google Scholar] [CrossRef]
  30. El-Nahhal, Y. Pesticide residues in honey and their potential reproductive toxicity. Sci. Total Environ. 2020, 741, 139953. [Google Scholar] [CrossRef]
  31. Rani, L.; Thapa, K.; Kanojia, N.; Sharma, N.; Singh, S.; Singh Grewal, A.; Lal Srivastav, A.; Kaushal, J. An extensive review on the consequences of chemical pesticides on human health and environment. J. Clean. Prod. 2021, 283, 124657. [Google Scholar] [CrossRef]
  32. Sabarwal, A.; Kumar, K.; Singh, R.P. Hazardous effects of chemical pesticides on human health—Cancer and other associated disorders. Environ. Toxicol. Pharmacol. 2018, 63, 103–114. [Google Scholar] [CrossRef]
  33. Bromenshenk, J.J.; Henderson, C.B.; Seccomb, R.A.; Welch, P.M.; Debnam, S.E.; Firth, D.R. Bees as biosensors: Chemosensory ability, honey bee monitoring systems, and emergent sensor technologies derived from the pollinator syndrome. Biosensors 2015, 5, 678–711. [Google Scholar] [CrossRef]
  34. Farina, W.M.; Arenas, A.; Díaz, P.C.; Martin, C.S.; Barcala, M.C.E. Learning of a mimic odor within beehives improves pollination service efficiency in a commercial crop. Curr. Biol. 2020, 30, 4284–4290. [Google Scholar] [CrossRef]
  35. Farina, W.M.; Arenas, A.; Estravis-Barcala, M.C.; Palottini, F. Targeted crop pollination by training honey bees: Advances and perspectives. Front. Bee Sci. 2023, 1, 1253157. [Google Scholar] [CrossRef]
  36. Simić, M.; Gillanders, R.N.; Avramović, A.; Gajić, S.; Jovanović, V.; Stojnić, V.; Risojević, V.; Glackin, J.; Turnbull, G.A.; Filipi, J.; et al. Honeybee activity monitoring in a biohybrid system for explosives detection. In CMBEBIH 2019: Proceedings of the International Conference on Medical and Biological Engineering, (CMBEBIH 2019), Banja Luka, Bosnia and Herzegovina, 16–18 May 2019; IFMBE Proceedings; Badnjevic, A., Škrbić, R., Gurbeta Pokvić, L., Eds.; Springer: Cham, Switzerland; Volume 73, pp. 185–192. [CrossRef]
  37. Filipi, J.; Stojnić, V.; Muštra, M.; Gillanders, R.N.; Jovanović, V.; Gajić, S.; Turnbull, G.; Babić, Z.; Kezić, N.; Risojević, V. Honeybee-based biohybrid system for landmine detection. Sci. Total Environ. 2022, 803, 150041. [Google Scholar] [CrossRef]
  38. Yuce, B.; Packianather, M.S.; Mastrocinque, E.; Pham, D.T.; Lambiase, A. Honey Bees Inspired Optimization Method: The Bees Algorithm. Insects 2013, 4, 646–662. [Google Scholar] [CrossRef]
  39. Karaboga, D. Artificial bee colony algorithm. Scholarpedia 2010, 5, 6915. [Google Scholar] [CrossRef]
  40. Chen, J.; DeGrandi-Hoffman, G.; Ratti, V.; Kang, Y. Review on mathematical modeling of honeybee population dynamics. J. Math. Biosci. Eng. 2021, 18, 9606–9650. [Google Scholar] [CrossRef]
  41. Migacz., A.; Tadeusiewicz, R. Model Rodziny Pszczelej. Academia.edu. Available online: https://www.academia.edu/27920933/Model_rodziny_pszczelej (accessed on 18 December 2024).
  42. Migacz., A.; Tadeusiewicz, R. Mikrokomputerowy Model Rodziny Pszczelej. Academia.edu. Available online: https://www.academia.edu/116379567/Mikrokomputerowy_model_rodziny_pszczelej (accessed on 18 December 2024).
  43. DeGrandi-Hoffman, G.; Curry, R. A mathematical model of Varroa mite (Varroa destructor Anderson and Trueman) and honeybee (Apis mellifera L.) population dynamics. Int. J. Acarol. 2004, 30, 259–274. [Google Scholar] [CrossRef]
  44. Becher, M.A.; Grimm, V.; Thorbek, P.; Horn, J.; Kennedy, P.J.; Osborne, J.L. BEEHAVE: A systems model of honeybee colony dynamics and foraging to explore multifactorial causes of colony failure. J. Appl. Ecol. 2014, 51, 470–482. [Google Scholar] [CrossRef]
  45. BEEHAVE|The Model. 2024. Available online: https://beehave-model.net (accessed on 10 December 2024).
  46. Guruprasad, S.M.; Leiding, B. BeeOpen—An Open Data Sharing Ecosystem for Apiculture. Agriculture 2024, 14, 470. [Google Scholar] [CrossRef]
  47. Meikle, W.G.; Holst, N. Application of continuous monitoring of honeybee colonies. Apidologie 2015, 46, 10–22. [Google Scholar] [CrossRef]
  48. Zhu, Y.; Abdollahi, M.; Maucourt, S.; Coallier, N.; Guimarães, H.R.; Giovenazzo, P.; Falk, T.H. MSPB: A longitudinal multi-sensor dataset with phenotypic trait measurements from honey bees. Sci. Data 2024, 11, 860. [Google Scholar] [CrossRef]
  49. Greggers, U.; Koch, G.; Schmidt, V.; Fuer, A.; Floriou-Servou, A.; Pipenbrock, D.; Goefert, M.C.; Menzel, R. Reception and learning of electric fields in bees. Proc. Royal Soc. B 2013, 290, 20130528. [Google Scholar] [CrossRef]
  50. Shepherd, S.; Hollands, G.; Godley, V.C.; Sharkh, S.M.; Jackson, C.W.; Newland, P.L. Increased Aggression and Reduced Aversive Learning in Honey Bees Exposed to Extremely Low Frequency Electromagnetic Fields. PLoS ONE 2019, 14, e0223614. [Google Scholar] [CrossRef]
  51. Shepherd, S.; Lima, M.A.; Oliveira, E.E.; Sharkh, S.M.; Jackson, C.W.; Newland, P.L. Extremely low frequency electromagnetic fields impair the cognitive and motor abilities of honey bees. Sci. Rep. 2018, 8, 7932. [Google Scholar] [CrossRef]
  52. Odemer, R.; Odemer, F. Effects of Radiofrequency Electromagnetic Radiation (RF-EMF) on Honey Bee Queen Development and Mating Success. Sci. Total Environ. 2019, 661, 553–562. [Google Scholar] [CrossRef]
  53. Thielens, A.; Greco, M.K.; Verloock, L.; Martens, L.; Joseph, W. Radio-Frequency Electromagnetic Field Exposure of Western Honey Bees. Sci. Rep. 2020, 10, 461. [Google Scholar] [CrossRef]
  54. Capela, N.; Sarmento, A.; Simões, S.; Lopes, S.; Castro, S.; Alves da Silva, A.; Alves, J.; Dupont, Y.L.; de Graaf, D.C.; Sousa, J.P. Exploring the External Environmental Drivers of Honey Bee Colony Development. Diversity 2023, 15, 1188. [Google Scholar] [CrossRef]
  55. Ecrotek, Learn Beekeeping, Beekeeping 101: How to Stop Hive Robbing, 2021. Available online: https://www.ecrotek.com.au/blogs/articles/beekeeping-101-how-to-stop-hive-robbing (accessed on 10 December 2024).
  56. Matović, K.; Žarković, A.; Debeljak, Z.; Vidanović, D.; Vasković, N.; Tešović, B.; Ćirić, J. American Foulbrood—Old and Always New Challenge. Vet. Sci. 2023, 10, 180. [Google Scholar] [CrossRef]
  57. Cormier, S.B.; Léger, A.; Boudreau, L.H.; Pichaud, N. Overwintering in North American domesticated honeybees (Apis mellifera) causes mitochondrial reprogramming while enhancing cellular immunity. J. Exp. Biol. 2022, 225, 1–13. [Google Scholar] [CrossRef]
  58. Menail, H.A.; Cormier, S.B.; Ben Youssef, M.; Jørgensen, L.B.; Vickruck, J.L.; Morin, P.J.; Boudreau, L.H.; Pichaud, N. Flexible thermal sensitivity of mitochondrial oxygen consumption and substrate oxidation in flying insect species. Front Physiol. 2022, 13, 1–15. [Google Scholar] [CrossRef]
  59. Menail, H.A.; Cormier, S.B.; Léger, A.; Robichaud, S.; Hebert-Chatelain, E.; Lamarre, S.G.; Pichaud, N. Age-related flexibility of energetic metabolism in the honey bee Apis mellifera. FASEB J. 2023, 37, e23222. [Google Scholar] [CrossRef]
Figure 1. Smart beehive.
Inventions 10 00023 g001
Figure 2. Smart hive: (a) front view, (b) back view, (c) exploded view.
Inventions 10 00023 g002
Figure 3. Smart beehive scale.
Inventions 10 00023 g003
Figure 4. Smart hive sensors: (a) internal temperature and humidity sensor; (b) IoT block with external temperature and humidity sensor.
Inventions 10 00023 g004
Figure 5. Smart apiary.
Inventions 10 00023 g005
Figure 6. View of query to database server, biological information.
Inventions 10 00023 g006
Figure 7. View of query to database server, technical information.
Inventions 10 00023 g007
Figure 8. Periods of daily activity of honey bees. 1. Night-time; 2. Departure of foragers; 3. Return of foragers.
Inventions 10 00023 g008
Figure 9. Data visualization according to food availability: (a) the option with abundant food, where the bee colony successfully accumulates reserves; (b) the option with scarce food, where the colony consumes almost everything the foragers collect; (c) the option with insufficient food, where foragers are unable to provide adequate food for the colony.
Inventions 10 00023 g009
Figure 10. Weight change of beehives (6–27 September 2023).
Inventions 10 00023 g010
Figure 11. Weight changes of hive 883 (6–24 September 2023).
Inventions 10 00023 g011
Figure 12. Temperature inside and outside hive 883.
Inventions 10 00023 g012
Figure 13. Temperature and solar panel voltage, hive 883.
Inventions 10 00023 g013
Figure 14. Cumulative weight changes (18–24 September 2023).
Inventions 10 00023 g014
Disclaimer/Publisher’s Note: The statements, opinions and data contained in all publications are solely those of the individual author(s) and contributor(s) and not of MDPI and/or the editor(s). MDPI and/or the editor(s) disclaim responsibility for any injury to people or property resulting from any ideas, methods, instructions or products referred to in the content.

