Article

Large-Scale BESS for Damping Frequency Oscillations of Power Systems with High Wind Power Penetration

Department of Electronic, Electrical and Systems Engineering, School of Engineering, University of Birmingham, Birmingham B15 2TT, UK
*
Author to whom correspondence should be addressed.
Inventions 2024, 9(1), 3; https://doi.org/10.3390/inventions9010003
Submission received: 17 November 2023 / Revised: 19 December 2023 / Accepted: 20 December 2023 / Published: 26 December 2023
(This article belongs to the Special Issue Innovative Strategy of Protection and Control for the Grid)

Abstract

:
With the high penetration of renewable energy into power grids, frequency stability and oscillation have become big concerns due to the reduced system inertia. The application of the Battery Energy Storage System (BESS) is considered one of the options to deal with frequency stability and oscillation. This paper presents a strategy to size, locate, and operate the BESS within the power grid and, therefore, investigate how sizing capacity is related to renewable energy penetration levels. This paper proposes an identification method to determine the best location of the BESS using the Prony method based on system oscillation analysis, which is easy to implement based on measurements while actual physical system models are not required. The proposed methods for BESS size and location are applied using MATLAB/Simulink simulation software (version: R2023a) on the Kundur 2-area 11-bus test system with different renewable energy penetration levels, and the effectiveness of the applied method in enhancing frequency stability is illustrated in the study cases. The case studies showed a significant improvement in steady-state frequency deviation, frequency nadir, and Rate of Change of Frequency (ROCOF) after implementing BESS at the selected bus. The integration of BESS can help to avoid Under-frequency Load Shedding (UFLS) by proper selections of size, location, and operating strategy of the BESS within the power grid.

1. Introduction

The substitution of synchronous generators with inverter-based renewable sources is leading to a reduction in the overall inertia of the system. Hence, the increased integration of high-level power electronic-based generation in the system results in a reduction in system inertia, thereby rendering the system frequency more susceptible to disturbances and potential frequency instability. In order to regulate frequency deviations, this highlights the necessity for the development of advanced ancillary energy balancing services [1,2,3].
Several researchers have undertaken investigations into the effects of low inertia on the stability and operation of power systems, primarily due to the significant penetration of renewable energy sources. The study conducted in [1] examined the relationship between system inertia and the operational difficulties arising from the reduction of inertia in the system. This study suggests that the utilization of an energy storage system (ESS) or the inertia of converter-connected generation could serve as a viable solution for low-inertia systems.
The incorporation of battery energy storage systems (BESS) within power grids is increasingly garnering attention as a significant area of focus for the provision of ancillary services. According to [4], the inclusion of a frequency response service in the control structure of a BESS enables the system to deliver its maximum rated active power within one second of the occurrence of a frequency disturbance. In their study, the authors in [5] examine the application of battery systems in the context of secondary frequency control and the mitigation of area control error (ACE) to achieve complete elimination. The utilization of BESS for the purpose of power system oscillation damping has been demonstrated in previous studies [6,7]. The intermittent nature of renewable sources, such as wind and solar power, coupled with the inherent inaccuracies in their forecasts, necessitates the implementation of battery systems as a feasible solution to address these challenges, as demonstrated in reference [8].
Reference [9] described the utilization of the BESS to provide an inertia response (IR) and primary frequency response (PFR). When only a few synchronous generators are online, a BESS with adequate capacity could provide sufficient frequency reserves in a power system. Reference [10] presented a detailed investigation of the effects of using BESS to offer primary frequency management support in a power system that has an increasing amount of renewable energy resources (RESs), particularly wind generation. To examine the overall improvement in frequency response resulting from the use of BESS, several forms of events, including transient line outages, single-line-to-ground faults, and increases in load demand at different levels of wind penetration, are applied. The authors find that the BESS effectively mitigates frequency oscillation by counterbalancing energy deficits and absorbing energy surpluses, where the use of the BESS raises the degree of wind energy penetration by 3.58% to 5.21%. However, no strategies regarding BESS sizing and location are presented to improve the frequency response and ROCOF.
The sizing scheme for BESS proposed in [11] was predicated exclusively on the optimization of microgrid operational costs and the minimization of BESS charging and discharging capacity. The study investigates the effectiveness of the recommended technique in three different scenarios contingent on the microgrid connectivity status by connecting and selling electricity to the power grid. However, the performance of the system is not evaluated in terms of allowable deviation in frequency or system rate of change of frequency (ROCOF) limits.
The authors of [12] present a bi-level optimization model that is transformed into a mixed-integer linear program in order to reach maximal profit. The optimal capacity of the energy storage, as determined by this algorithm, is contingent upon the system fault condition, the duration of load decrease across different fault scenarios, and the enhancement of distribution system profitability in terms of unit income. However, neither system operating conditions, including frequency and ROCOF, nor the system under different levels of renewable penetration are investigated.
Accurately determining the proper sizes and placement of the BESS is crucial to significantly enhancing grid stability and economic efficiency by mitigating problems like excessive or insufficient sizes as well as selecting unsuitable BESS locations [13]. However, most of the previous studies on the placement of energy storage have primarily focused on economic or steady-state factors, as well as considering the distribution system. The research conducted on the placement of ESS in transmission systems with regard to enhancing stability is relatively limited [7]. The study conducted in [14] has introduced a probabilistic assessment approach for determining the appropriate size of BESS in order to improve the security of the power network. This was achieved by examining different combinations of BESS power ratings and energy capacity.
In [15], a method is provided that utilizes historic frequency data to minimize the capacity of BESS when providing primary frequency reserve services for power system frequency regulation. However, the study did not address the issue of BESS placement, as it only focused on a predetermined location. With the locations fixed, the controller parameters are optimized by Tabu-Search in [16]. However, the optimal BESS placement for enhancing the frequency oscillation damping of a system has not been thoroughly investigated.
A BESS sizing methodology is presented in [9] for primary frequency control and inertial response using a 12-bus power system model and theoretically estimated values of the inertia and power/frequency characteristics of the target system. However, neither the method nor the location where BESS was installed are disclosed in the information provided. In addition, Ref. [17] examined the impact of BESS on primary frequency control in a frequency response model for a simple low-order system; however, the issues of BESS allocation and sizing were not included.
The study in [18] has proposed a method to enhance transient voltage stability by identifying the best place for connecting BESS. The authors proposed a method to enhance voltage stability by formulating it as a voltage stability index and then applying it using Cross-Entropy Optimization (CEO). The results demonstrated an enhancement in the stability of electrical potential. Although the authors made progress in improving voltage stability, they overlooked the issue of system frequency and ROCOF when determining the placement of the BESS.
The issue of BESS location was also addressed in [19] with the aim of enhancing voltage and frequency stability in weak grids through the utilization of a binary grey wolf optimization technique. In [20], the BESS allocation problem was examined for power networks with PV systems. The study utilized the Henry gas solubility optimization (HGSO) and simulated annealing (SA) algorithms with the goal of minimizing power losses and enhancing the voltage profile of the power network. Reference [21] presents a BESS allocation method involving wind power. The scheme utilizes linear programming and bivariate piecewise linearization to minimize system operation costs and variations in voltage.
Researchers in [22] have shown that connecting utility-scale BESS may improve the frequency responsiveness in a transmission network. By adjusting the size, positioning, and controller parameters of BESS, the study employed a fitness-scaled chaotic artificial bee colony (FSCABC) method to decrease the ROCOF and the frequency nadir. In a similar vein, researchers in reference [23] have presented an optimization problem that makes use of the idea of virtual inertia to determine the best location for increasing inertia while minimizing costs.
Significant insights can be derived from the previously mentioned studies, enabling the identification of potential research opportunities about the optimal utilization of BESS. Recent research has focused on utilizing optimization algorithms in the power grids and other areas of study. These interesting studies mostly focus on enhancing voltage profiles, reducing generation costs and power loss, and minimizing investment costs and operating and maintenance expenses associated with storage systems. While research into the integration of BESS into power grids is increasing, it is still limited in terms of correctly addressing frequency deviation and ROCOF, especially for large contingencies (e.g., loss of a generation unit), which can strongly influence the optimum candidate bus for BESS allocation. In addition, it is essential to take into account high penetration levels of RESs when determining the optimal placement of BESS. This is because RESs plants are showing tremendous growth in modern power networks. This work addresses the research gaps that will be highlighted in the next sections.
Considering the above challenges, this paper proposes a strategy to size, locate, and operate the BESS within the power grid for frequency response control. Firstly, the frequency deviation and ROCOF are evaluated after each simulated disturbance of the network. Accordingly, the required size of the BESS is computed considering a large power contingency under high wind power penetration levels. Then, the location of the BESS is assessed by using the Prony method to (1) reconstruct the frequency response signal, (2) evaluate the eigenvalues and damping ratio of the frequency signal, and (3) determine the best location for the BESS to damp the frequency oscillations of the system while maintaining the frequency deviation and ROCOF within the acceptable limits.
The paper is structured as follows: In Section 2, the grid frequency response characteristics are analysed, and the ESS sizing methodology is introduced. Section 2.3 presents the background on the Prony method, which is used to analyse the system frequency signals and evaluate the location of the BESS. The proposed strategy for BESS location, size, and operation for frequency regulation is then introduced in Section 2.4. To verify the effectiveness of the proposed strategy for BESS, simulation and analysis are presented in Section 3. The results are discussed in Section 4. Finally, Section 5 provides the conclusion.

2. Materials and Methods

2.1. Grid Frequency Response Characteristics

Following an event that causes an imbalance of electricity in a grid, frequency response behaviour typically consists of multiple phases. The stages of frequency response defined by the European Network of Transmission System Operators for Electricity (ENTSO-E) are shown in Figure 1. The first stage is the inertial response (IR), which is the natural response of synchronous machines. The PFR then stabilizes the frequency to an acceptable deviation from the nominal value. The magnitude and timing of the deployment of the two services (IR and PFR) affect the frequency nadir, the point at which the frequency response of the grid reaches the lowest value. This aspect is pertinent to the grid’s frequency stability. The secondary frequency reserve appears to improve the primary frequency reserve (PFR), whereas the tertiary frequency reserve (TFR) reschedules the preceding generation [9,24,25].

2.2. ESS Sizing for IR and PFR

Active power variation and frequency deviation can be explained by the inertia and governor droop constant (R) of the synchronous generators of the system. In an emergency situation involving a large generator failure, load curtailment, or transmission line failure, the frequency fluctuates rapidly until the imbalance between supply and demand is eliminated. Synchronous generators in the grid release kinetic energy from their rotating masses in order to achieve a new synchronous rate. In [9,26], the connection between frequency change rates and generator inertia is described as follows:
df   dt 2 H sys f o = Δ P S sys
where S s y s represents the capacity of the online generators; Δ P denotes the power imbalance or change in active power output from the generators; f o represents the initial frequency resulting from the input–output imbalance in active power; and H s y s represents the corresponding inertia constant of the power system.
The equivalent system inertia constant of a power system, which consists of many generating units, is obtained from [3,9] the following:
H sys = i = 1 n   H i S i S sys
where S i and H i represent the nominal power and inertia constants of the i-th generation unit, respectively.
The swing Equation (3) shows the relationship between H sys and the ROCOF ( df dt ) due to a power deficit ( Δ P b ) caused by an imbalance between active power generation ( P g ) and demand ( P l ) [9,27].
2 H sys f o df dt = P g   P l S sys = Δ P b S sys
The response of the governor is directly proportional to the deviation of the frequency value. The relationship between the frequency and generator output can be determined as follows [27]:
Δ P G = Δ f     S G f nom   R
where f nom represents the system’s nominal frequency and S G   represents the total capacity of the system’s generators.
In a power system with multiple generators, it is necessary to consider the equivalent sum of each governor’s droop constant. The frequency and governor response of a network of multiple generators is commonly defined as [27]
Δ f SS = Δ P i = 1 n   1 R i S i f o
where f S S is the steady-state frequency deviation when Δ P mismatch is induced in the network and R i is the droop constant of the generator i .

2.2.1. Sizing ESS for IR

According to the reference cited [9], it is recommended to keep the ROCOF within the range of ±0.5 Hz/s in order to maintain the reliable operation of the power system. In this paper, the previously mentioned ROCOF standard is used as a benchmark to verify the suggested technique. By using Equations (3) and (2), together with the upper limit of the ROCOF value, the minimum parameter for the ESS Inertia Response (IR) can be determined by [27].
i = 1 m H ESS , i S ESS , i     Δ P max   f o 2 d f max dt - i = 1 N H i S i
where m is the number of ESS units in the network, d f max dt is the maximum allowable ROCOF value, and Δ P m a x is the maximum generation loss in the network. The ESS inertia constant H E S S is defined in [9] as follows:
H ESS = K IR f o 2  

2.2.2. Sizing ESS for PFR

Along with the IR, the principal frequency response support of the ESS must be evaluated in order to satisfy the steady-state operation requirement of the given network. ESSs typically employ a variable droop constant for frequency support, which is implemented into the target network. The minimum required droop constant can be calculated using Equation (5), where f m i n is the minimum frequency of the system requirement [27].
i = 1 m 1 R ESS , i S ESS , i f o     Δ P max f nom - f min - i = 1 N S i R i   f o

2.2.3. ESS Modelling for IR and PFR Controls

The ESS power reference ( P ESS ) consists of the quantity of the IR and the PFR, as specified [9,28].
P ESS = S ESS P IR + P PFR
where S ESS represents the nominal power of ESS in MW. P IR and P P F R represent the power control signals per unit value provided by the IR and PFR loops, respectively. Figure 2 shows the block diagram of the IR and PFR controls.
  • Inertia Response Control (IR)
The IR control signal is directly proportional to the frequency derivative. The IR power signal P IR can be determined by [9,28] the following:
P IR   K IR df dt
where   K IR represents the IR control gain. By reforming the swing Equation (3), the ESS inertia constant ( H E S S ) can be defined as follows [9]:
H ESS = P IR f o 2 df dt 1
The inertia computed by (11) can be divided into two stages. In the first stage, H E S S remains unchanged because p I R is below the nominal power. In the second stage, where p I R is limited to the ESS’s rated power, H E S S is inversely proportional to the df dt . H E S S can be written as follows by substituting (10) into (11) [9].
H ESS   K IR   f o 2 ,             i f   p IR 1 f o 2 df dt 1 ,    i f   p IR 1
2.
Primary Frequency Control (PFR)
The PFR control is activated when the measured frequency differs from its nominal value [28]. By ignoring the influence of the inactive band, P PFR is calculated by
P PFR   f f o f o   R ESS
where the R ESS represents the ESS droop.

2.3. Prony Method

Prony analysis, a measurement-based method that does not involve comprehensive system information, is utilized in this paper to determine the system features. Prony analysis utilises a set of complex functions to generate the signal, which is described in (14)–(16) [29,30].
y ^ n = i = 1 p M i e j θ i e α i + j 2 π f i T s n = i = 1 p H i e λ i t
where y ˆ n represents a data sequence signal estimate, y ˆ = y ˆ 0 , y ˆ 1 , ,   y ˆ N 1 ,   p represents the fitting model order, θ i is the phase angle, M i is the magnitude of i t h mode, α i is the damping coefficient, T s is the sampling time interval, f i is the frequency, and H i is the i t h output residue including the input signal.
Using the Laplace domain representation of the system (Y(s) = G(s)U(s)), the transfer function can be written as a residue:
G ( s ) = i = 1 p R i s     λ i
The residue H i includes the input signal information, which is not explicitly defined in (14). If the input U ( s ) is provided and assumed to be a step signal, the calculation of the transfer function residue can be performed [31].
U ( s ) = i = 0 k   c i e s D i     e s D i + 1 s R j = H j λ j i = 0 k   c i e λ j D k D i       j = 1 , 2 , ,   p
The residue of the transfer function can be acquired by subjecting a known input disturbance to the power system and subsequently conducting a Prony analysis on the resulting output. The system controller design can be informed by the expected system information obtained through the application of the Prony method.

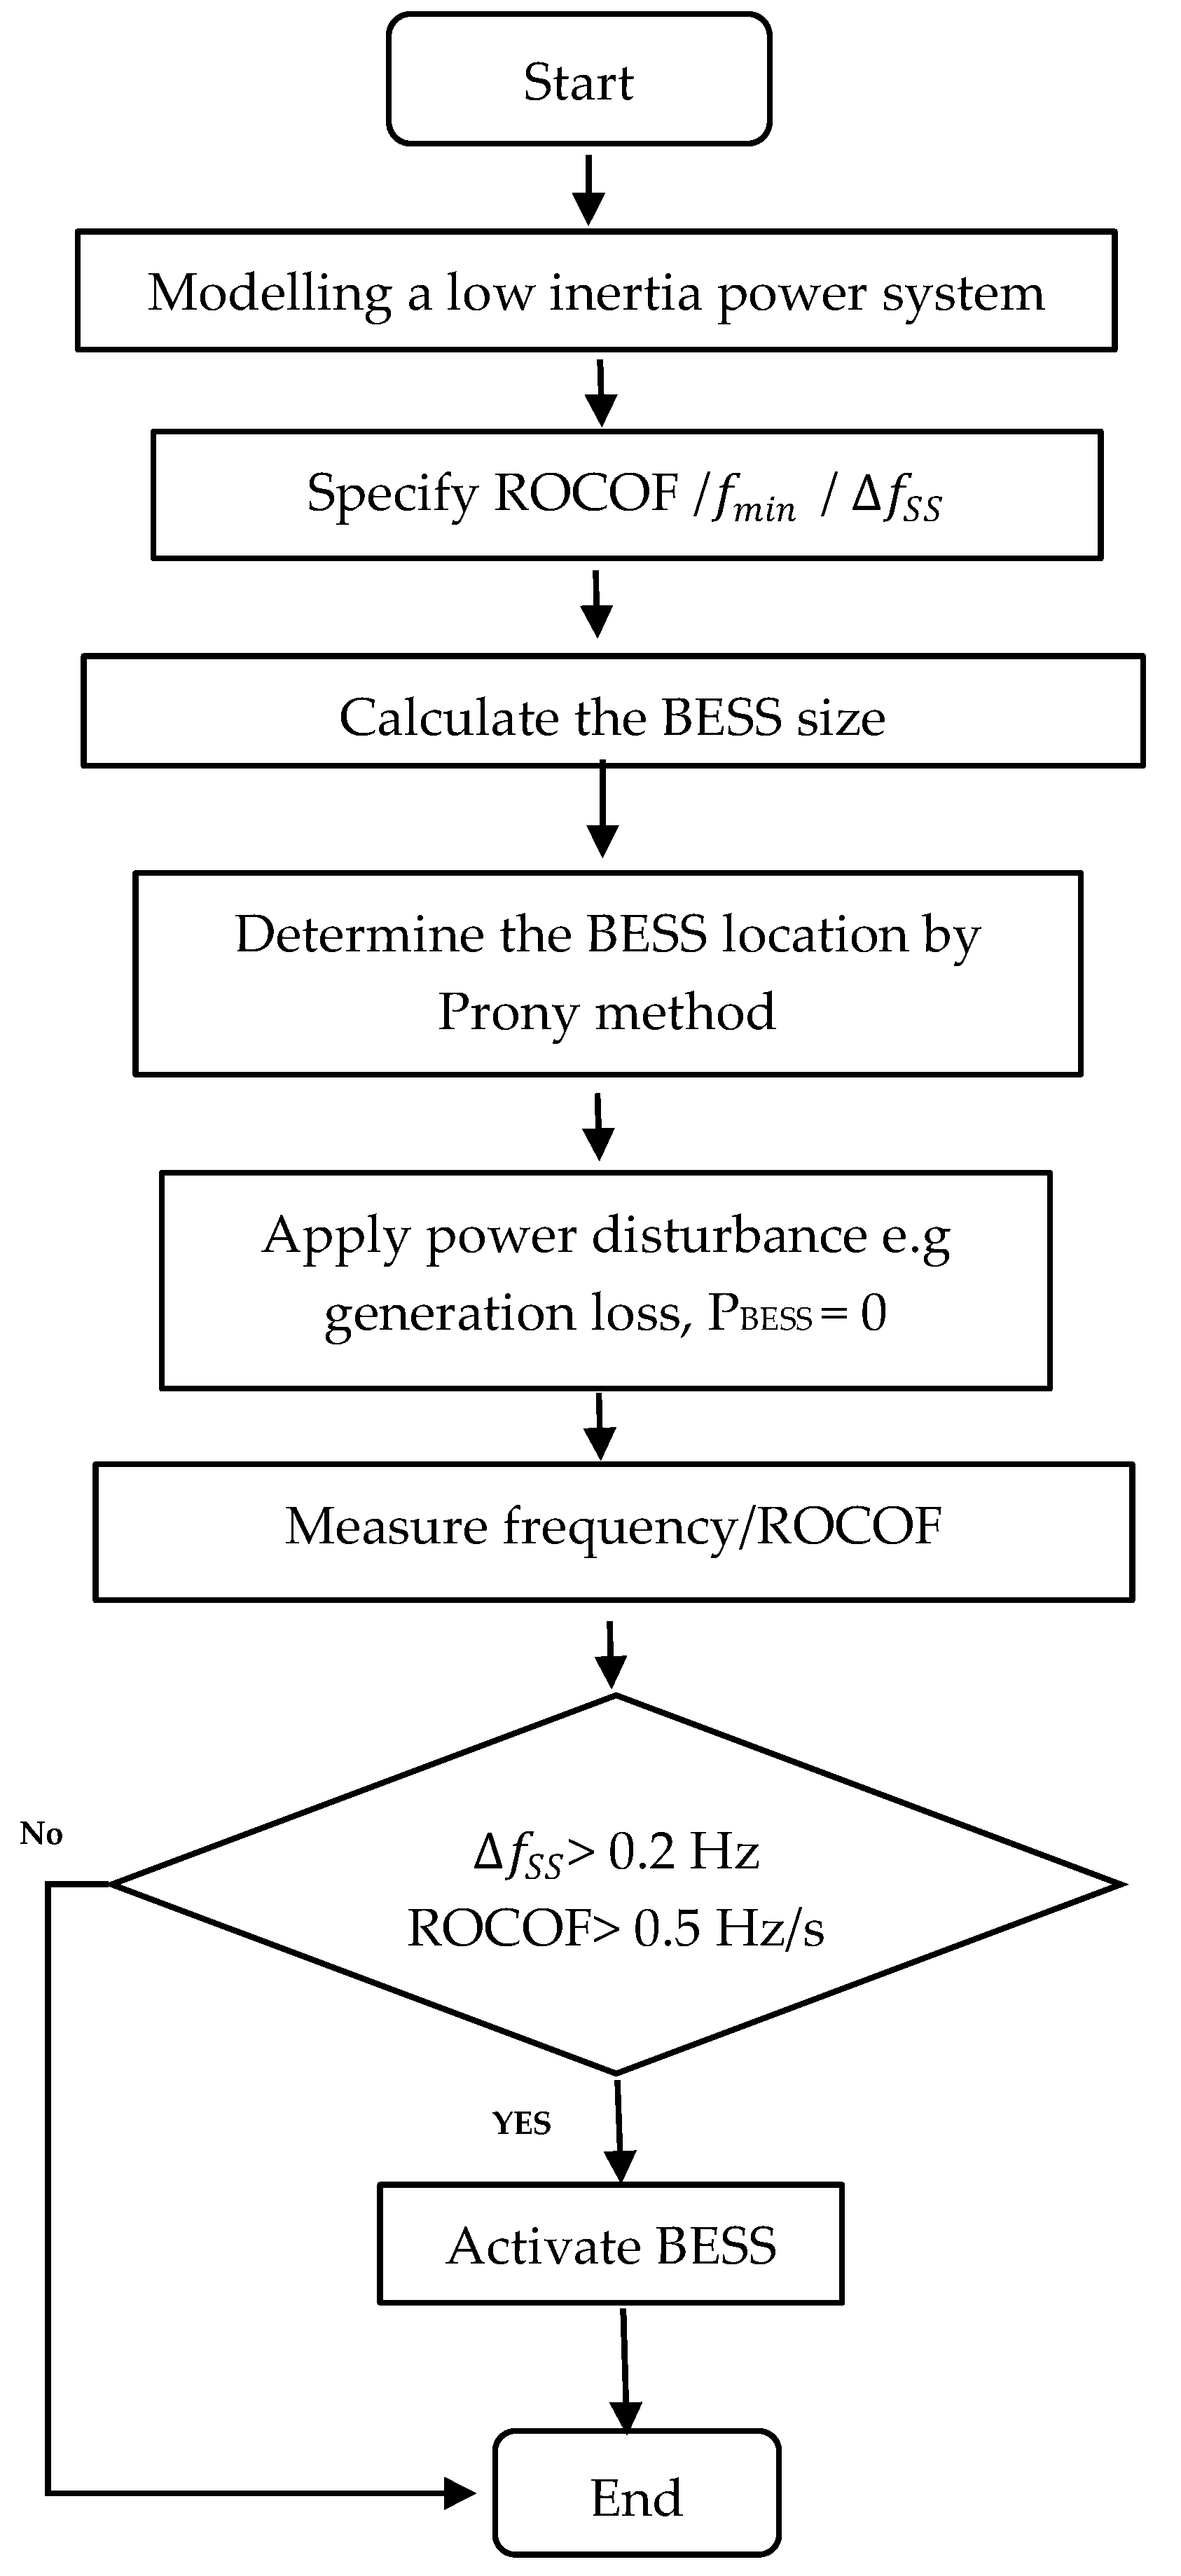
2.4. Proposed Strategy for BESS

The proposed procedure for the sizing, location, and operation of BESS consists of several steps. The strategy is described in Figure 3. The steps are described as follows:
Step 1:
Model a low-inertia power system with a significant renewable penetration level.
Step 2:
Specify the ROCOF, FSS, and minimum frequency of the system.
Step 3:
Calculate the required size of the BESS using (6) and (8). The required size depends on the contingency type; in this study, 350 MVA loss of generation power was considered.
Step 4:
Determine the best location of the BESS by using the Prony method and damping ratio analysis, which is detailed in Section 3.3.
Step 5:
Apply a considerably large contingency, e.g., loss of a power generator unit, considering BEES size = 0 MW.
Step 6:
By measuring the ROCOF and system frequency, determine if ROCOF > 0.5 Hz and/or frequency deviation > 0.2 Hz. If yes, activate the BESS. Otherwise, end the process.

3. Results

3.1. System Overview

The single-line diagram of the test system based on a two-area system [32] is shown in Figure 4. The system consists of four synchronous generators that are connected to four step-up transformers with a voltage ratio of 20/230 kV. All four generators exhibit identical characteristics. The BESS plant is connected to the electrical grid at area-1 at bus-2 via a 0.6/20 kV step-up transformer. The location of BESS is selected based on the proposed BESS locating method, which will be detailed in Section 3.3. The system is composed of two load buses. Load 1 has an active power demand of 1767 MW and a reactive power demand of 100 MVAr, while load 2 has an active power demand of 967 MW and a reactive power demand of 100 MVAr. System loads are commonly referred to as PQ loads. The reactive power supply by shunt capacitor at bus 7 and 9 are 200 MVar and 350 MVar, respectively. The detailed parameters of the system generators are shown in Table A1 in Appendix A.

3.2. Simulation and Analysis

Simulation investigations were conducted in MATLAB/SIMULINK to assess the effectiveness of BESS in mitigating frequency oscillation and facilitating higher wind power penetration levels. The threshold for wind power penetration level is determined when the synchronous generator unit is substituted by the wind farm. In this case study, the wind farm is assumed to function at its maximum operational capacity, generating power equivalent to that of the generator units.
The present study demonstrates the BESS sizing and placing strategy by examining three scenarios, each with different levels of wind penetration. A sudden reduction in the output generation of G2 by 350 MVA is applied to each case to cause a deviation in the system frequency from its designated value of 60 Hz. For each scenario, the required BESS sizes are computed. The maximum value of the ROCOF is set to 0.5 Hz/s, and the steady state ( Δ f ss ) is set to 0.2 Hz [9]. The droop of the BESS   R BESS is set to 0.004 [13], while the value of H BESS is selected to be 30 s by applying (12), considering the IR control gain ( K IR ) equal to 1. The simulation is repeated after connecting the BESS to the grid to examine the effectiveness of the BESS in maintaining the frequency within acceptable limits.

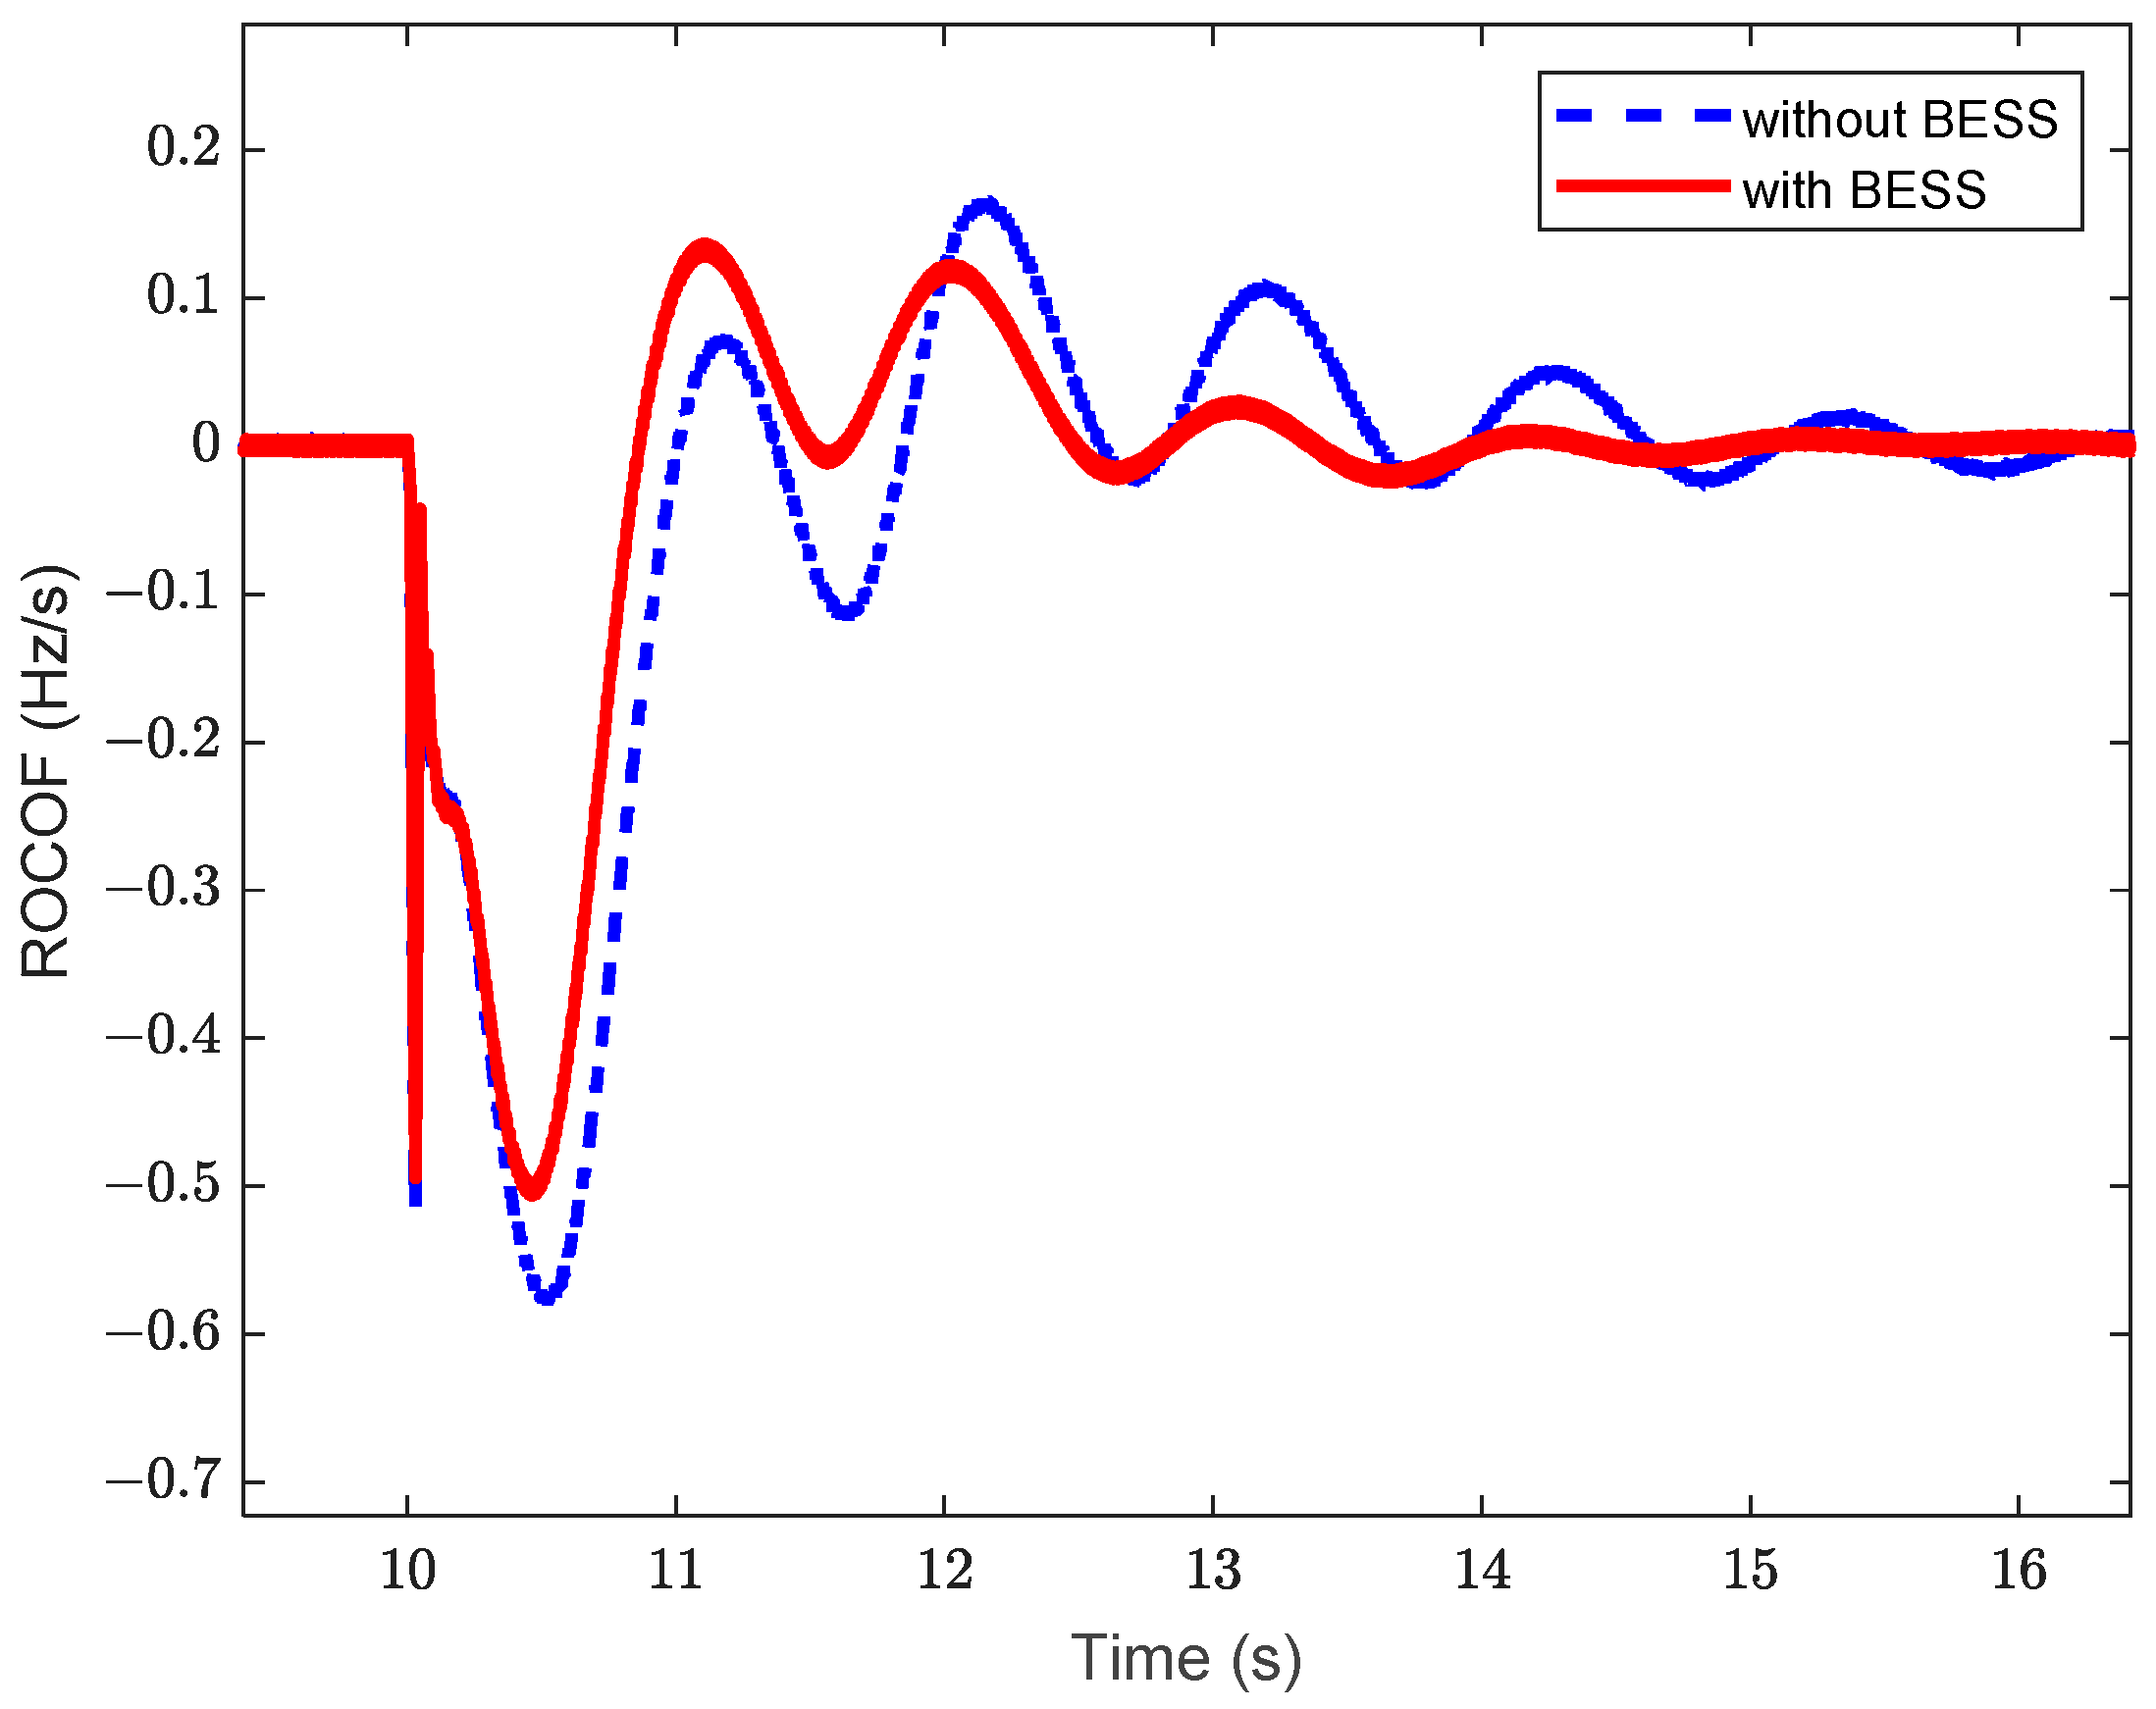
3.2.1. Case 1: 25% Wind Penetration

About 25% of the generation capacity of the system is replaced by wind penetration. To achieve this, a conventional generation unit G1 is removed from the system and replaced by a wind farm with an equivalent rating. A sudden reduction in the generation of G2 by 350 MVA is simulated at t = 10 s. The investigation focuses on the inertial capability of the system to provide system frequency damping during a significant sudden generation loss. The simulation is conducted again after the connection of the BESS to the grid to assess the efficacy of the BESS in regulating the frequency within the accepted thresholds.
Figure 5 shows the frequency response during the event with and without BESS incorporation. Without BESS, the steady-state frequency f ss   after disturbance drops to 59.76 Hz, while the frequency nadir is 59.62 Hz. After connecting BESS to the grid, the f ss   becomes 59.82 Hz, and the frequency nadir is 59.71 Hz. Figure 6 shows that after connecting the BESS, the ROCOF is improved from 0.58 Hz/s to 0.5 Hz/s. The simulation results after connecting the BESS to the system show improvements in ROCOF, f ss   , and frequency nadir, and the results are maintained within the set limits. The response time for BESS to recover the frequency to the target value is 2 s., while the system reaches a steady state at t = 13.92 s.
The BESS sizing calculation is performed for the IR and PFR requirements stated in (6) and (8). The required capacity of BESS for IR is 44.58 MW, while the PFR is 99 MW. Accordingly, the BESS capacity is set to meet the higher power requirements, at 99 MW. Figure 7 shows the power output of the BESS during the event; the maximum power reached 102 MW, which is close to the calculated size.

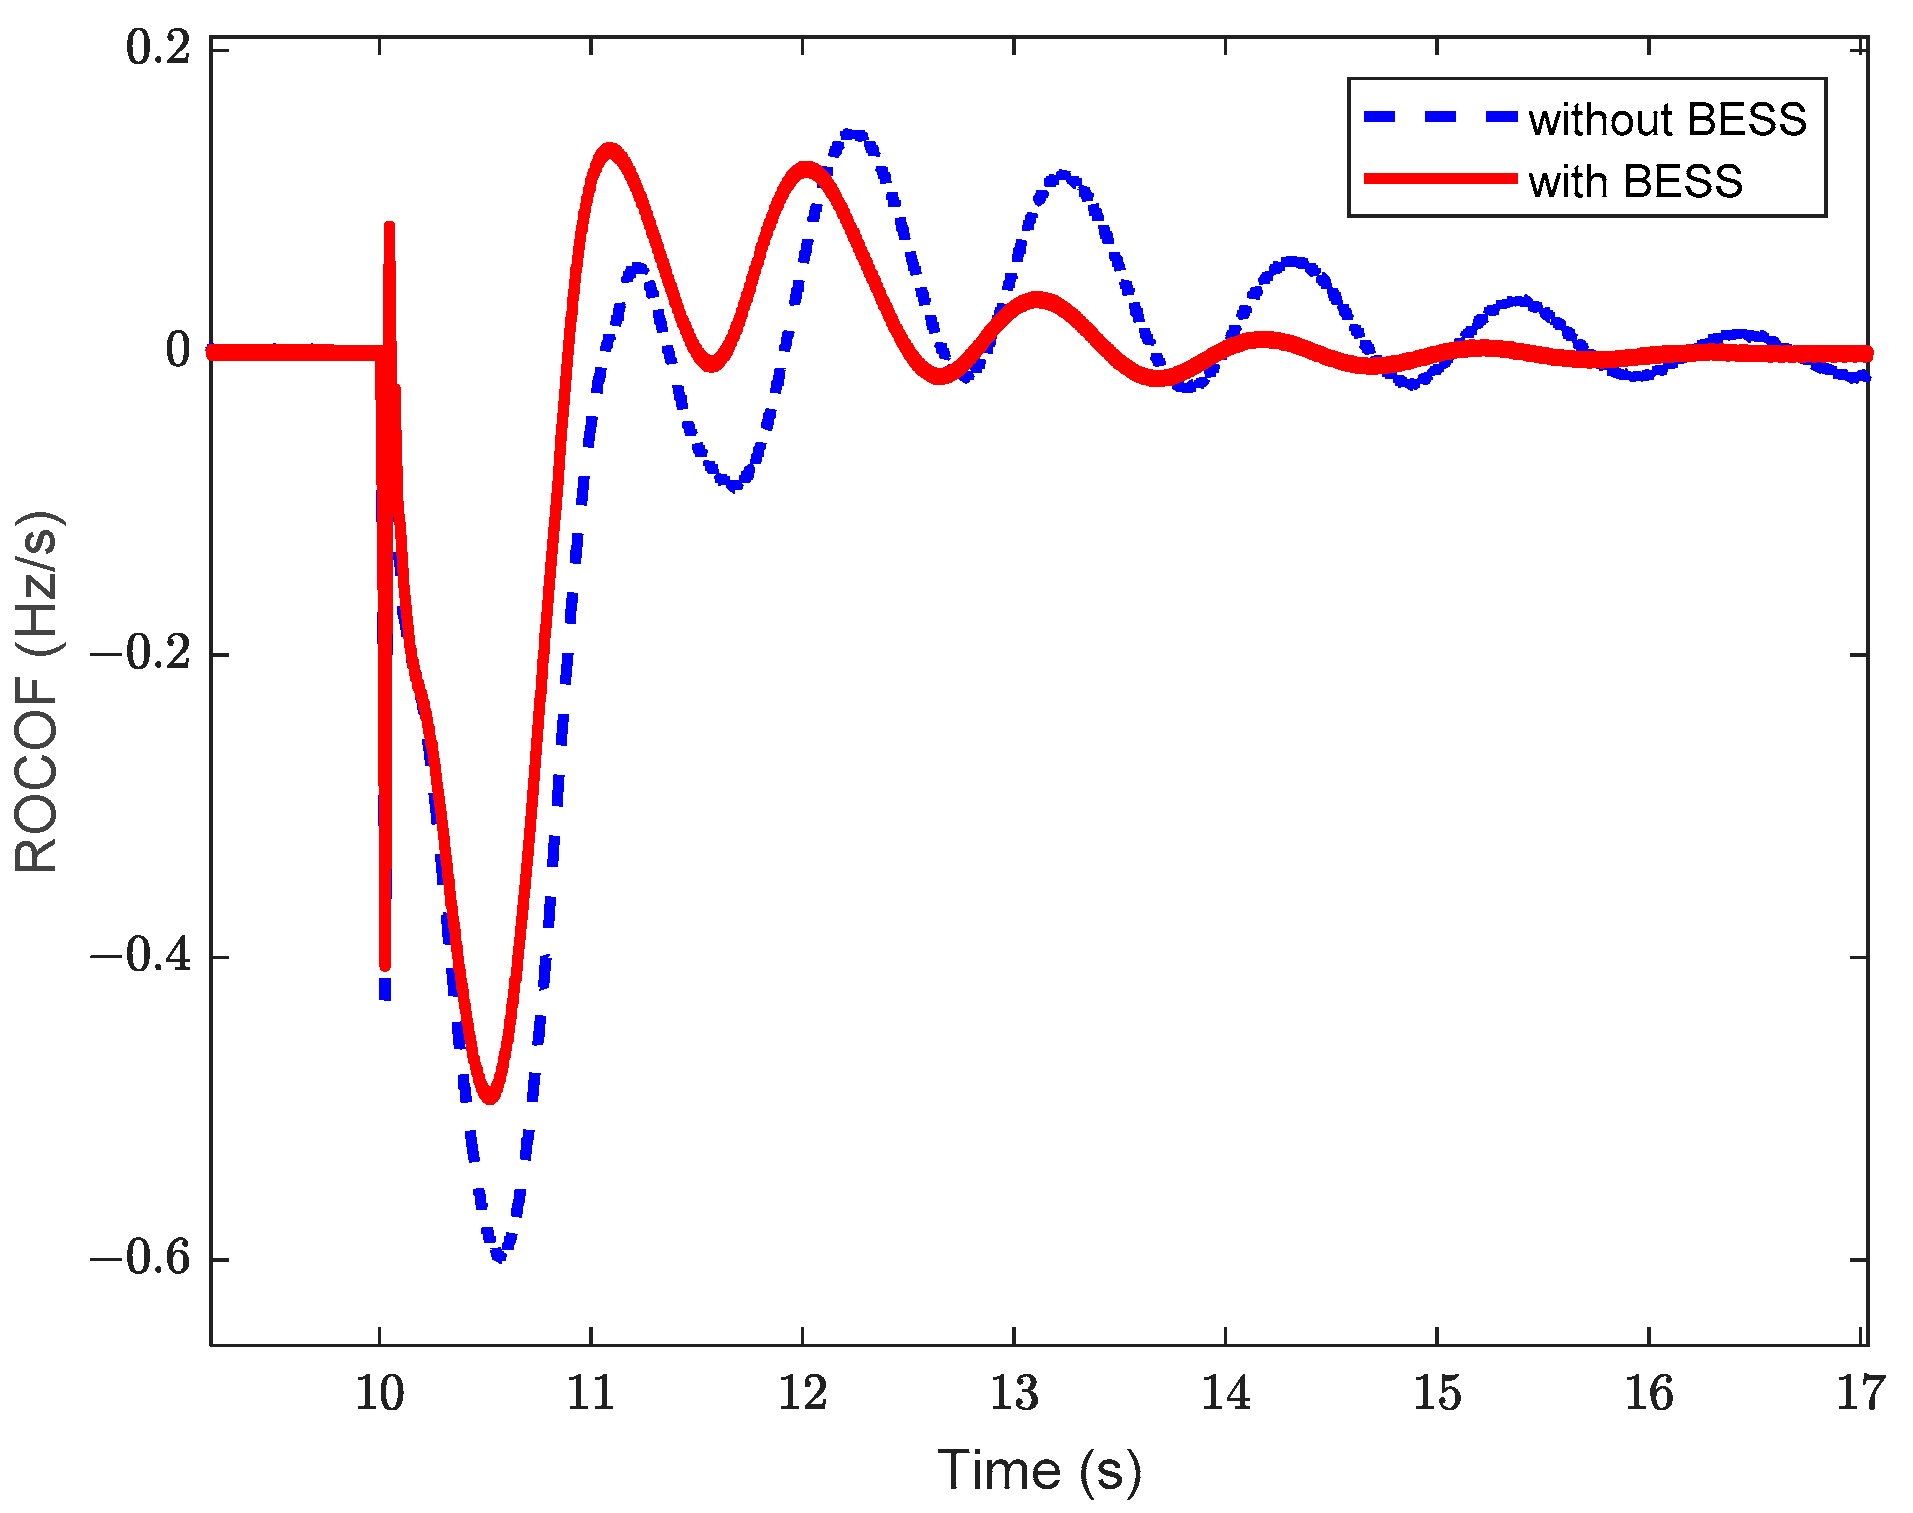
3.2.2. Case 2: 35% Wind Penetration

In this case, about 35% of the generation capacity of the system is replaced by wind penetration. To achieve this, conventional generation unit G1 of 700 MW, in addition to 280 MW from G4, is removed from the system and replaced by a wind farm with an equivalent rating. Similarly, a sudden reduction in the power output of generator G2 by 350 MVA is simulated at t = 10 s. Figure 8 illustrates the frequency response during the disturbance with and without the BESS contribution.
Before BESS incorporation, the system’s steady-state frequency f ss   after disturbance reached 59.75 Hz, while the frequency nadir was 59.58 Hz. When BESS is connected to the grid, the f ss   is improved to 59.83 Hz, while the frequency nadir is 59.68 Hz. Figure 9 shows that after connecting the BESS, the ROCOF improved from 0.6 Hz/s to 0.48 Hz/s. The simulation results after connecting the BESS to the system show enhancements in ROCOF, f ss   , and frequency nadir, and the results are maintained within the set limits. The response time for BESS to recover the frequency to the target value is 1.88 s, while the system frequency reaches a steady state at t = 14 s.
The sizing calculation for the required capacity of BESS for IR is 91 MW, while the PFR is 143 MW. Accordingly, the BESS capacity is set to the higher power requirement, which is 143 MW. Figure 10 shows that the maximum power output of the BESS during the event is 136 MW, which is close to the calculation of the size that was calculated.

3.2.3. Case 3: 50% Wind Penetration
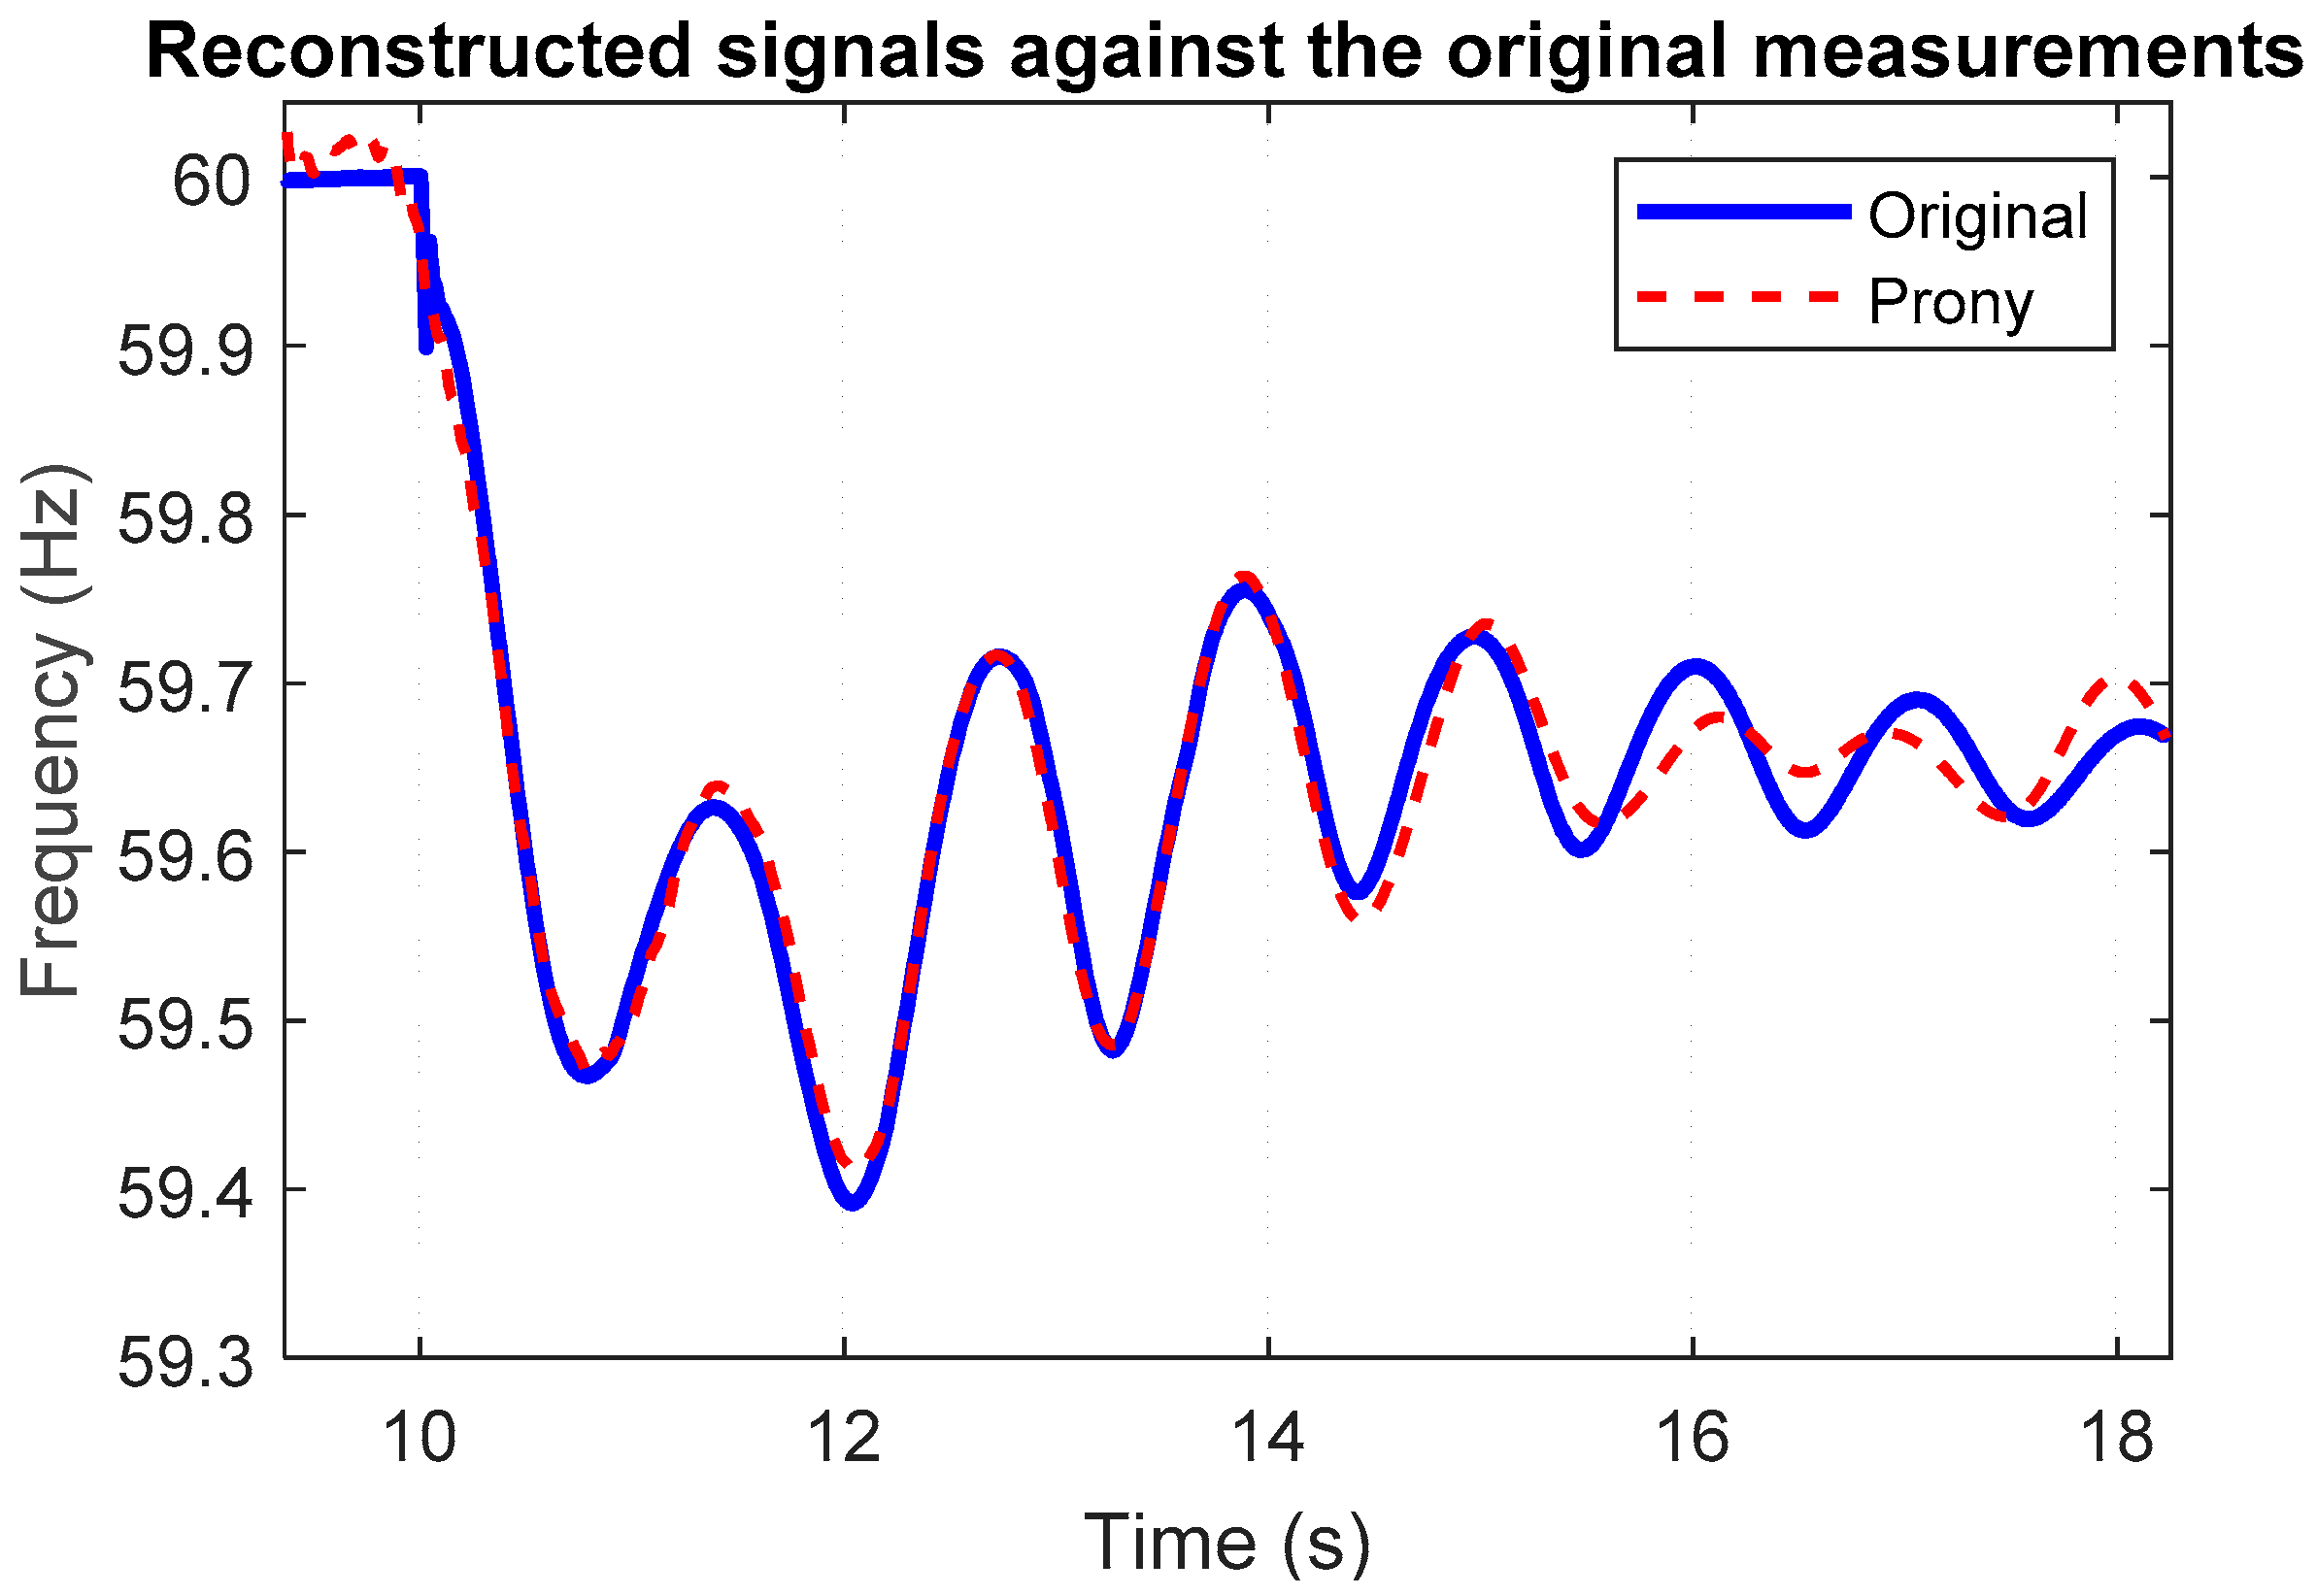
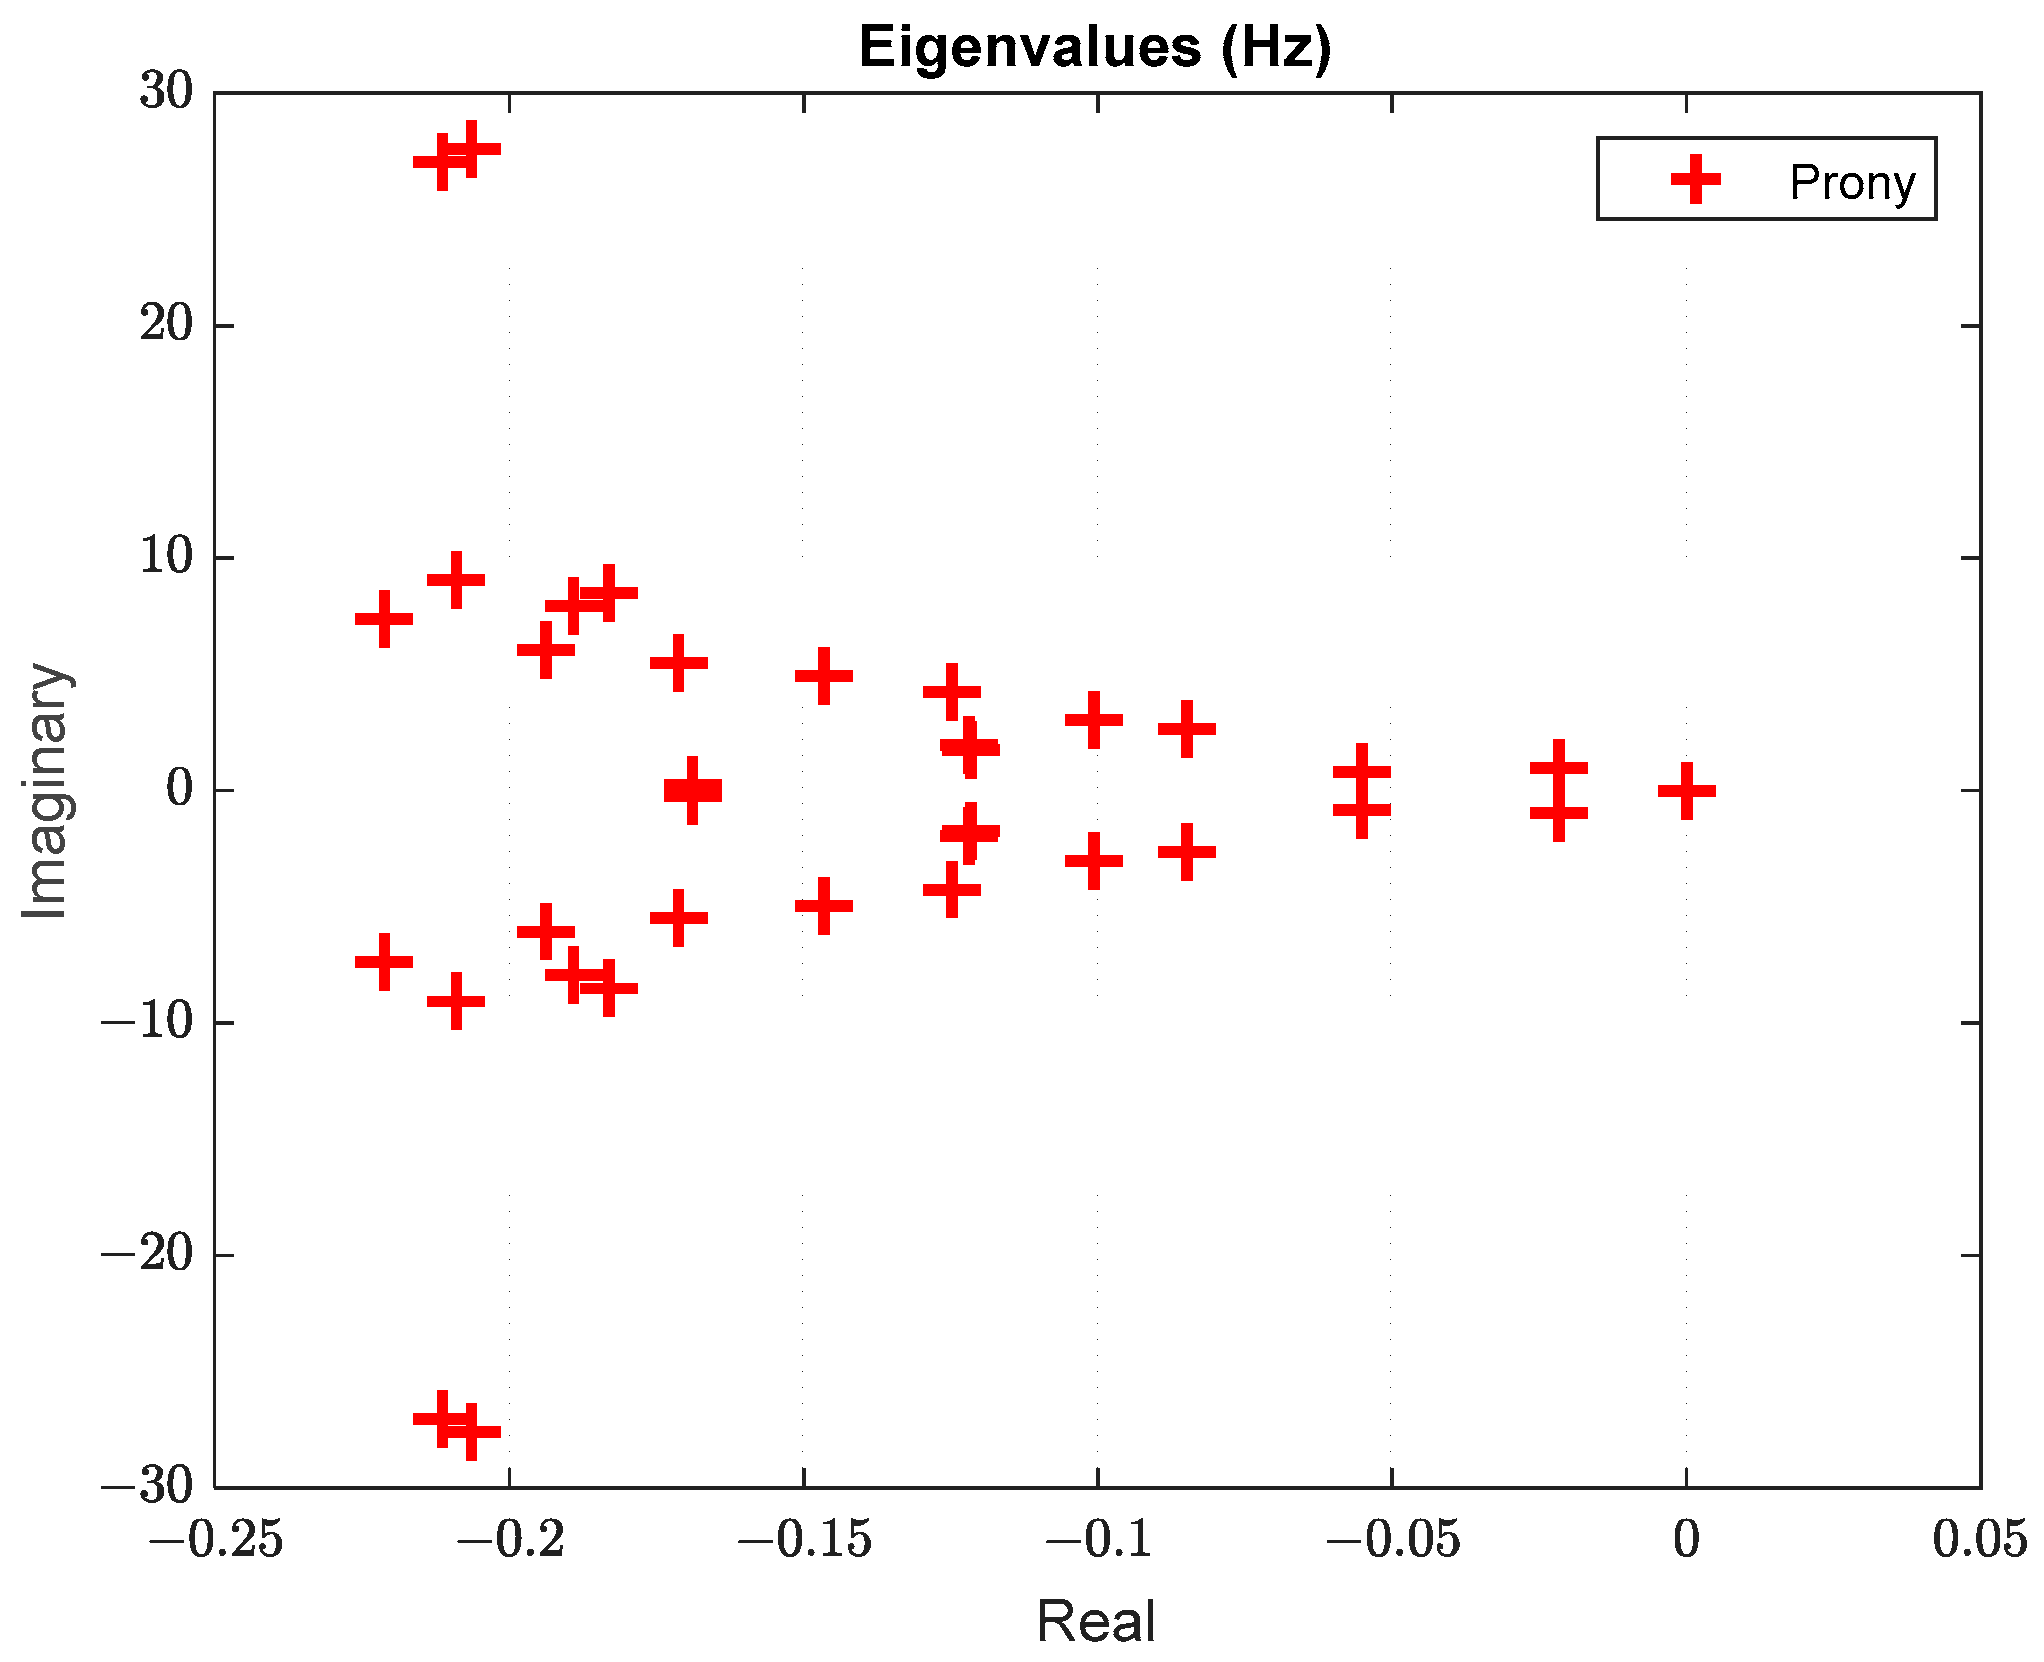
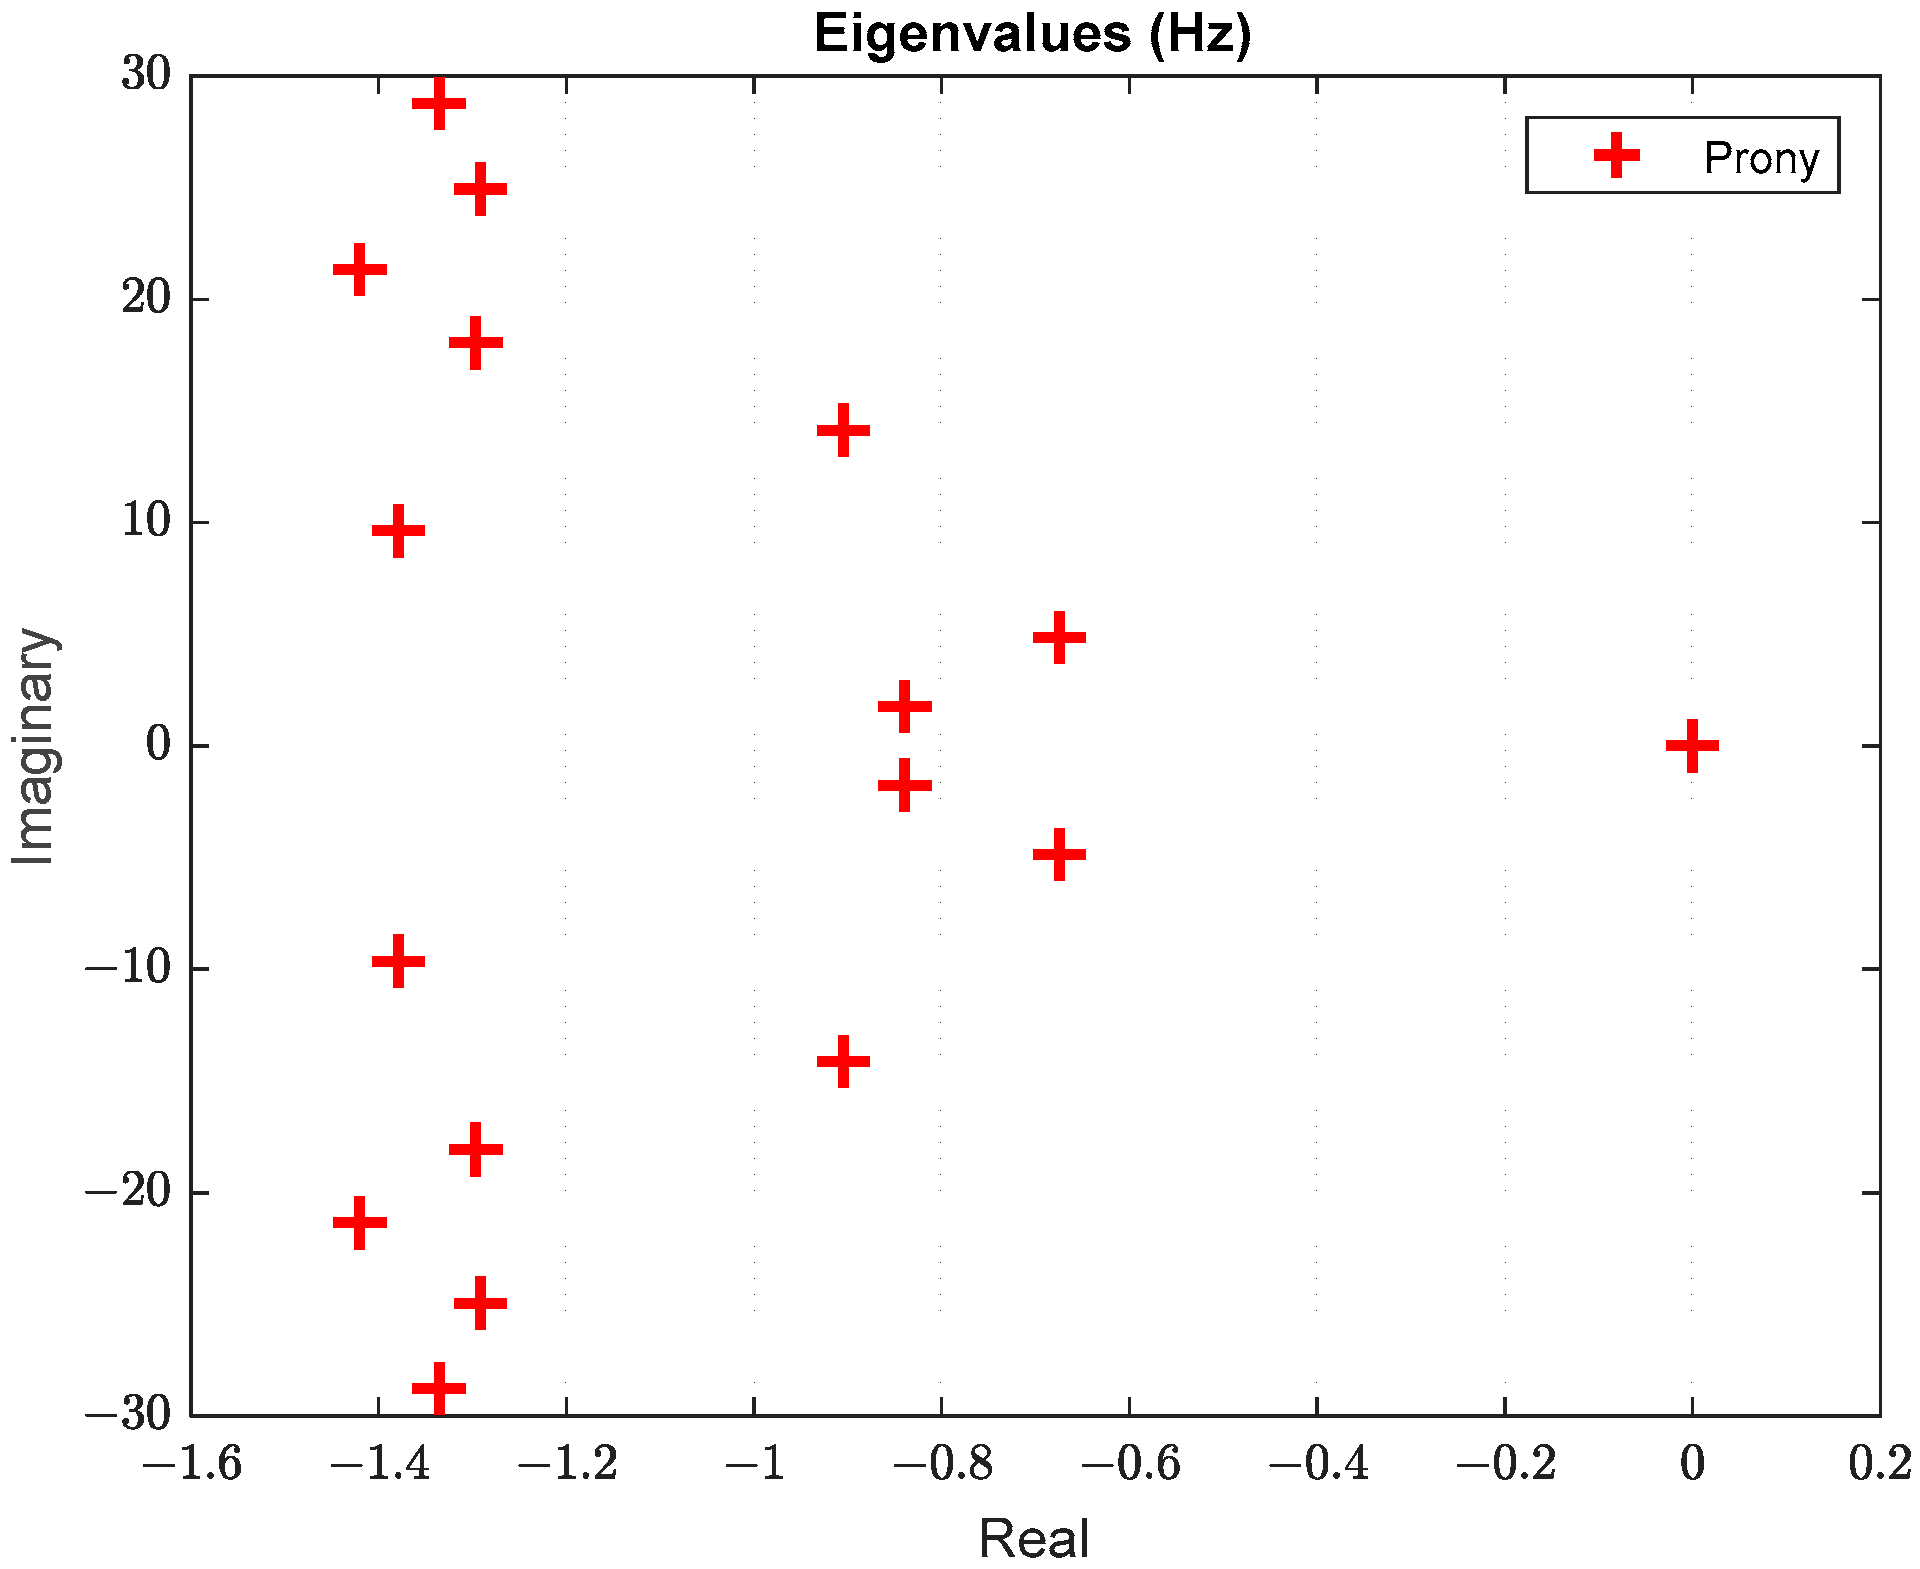
About 50% of the generation capacity of the system is replaced by wind penetration. Two conventional synchronous generator units, G1 and G3, are removed from the system and replaced by a wind farm with an equivalent rating. The investigation focuses on the inertial capability of the system to provide system damping during a significant sudden reduction of the power output of the generator of G2 by 350 MVA at t = 10 s. Figure 11 illustrates that without BESS, the steady-state frequency f ss   after disturbance reaches around 59.65 Hz, while the frequency nadir reaches 59.38 Hz.
The system experiences an increase in oscillation due to a reduction in power generation inertia. In this case, the calculated capacity of BESS is 188 MW, which is required to recover the system frequency. The maximum power output of the BESS of the simulation is 193.5 MW, as shown in Figure 12, which is close to the calculated value.
The results show that the BESS effectively reduces the frequency oscillation. The simulation results after connecting the BESS to the system show an improvement in ROCOF from 0.69 Hz/s to 0.49 Hz/s, as demonstrated in Figure 13. The frequency nadir improved from 59.38 Hz to 59.65 Hz, and as a result the BESS maintained the system frequency within acceptable limits. The time required for the BESS to restore the frequency to the target value is 1.8 s, whereas the system reaches a stable state at t = 14.225 s. On the other hand, if the first stage of under-frequency load shedding (UFLS) is activated at 59.5 Hz as per the NERC most commonly used settings [33], the load shedding can be avoided after implementing the BESS in the system.
In summary, as shown in Table 1, the accuracy of the methodology of BESS sizing is demonstrated by the simulation results. From Table 1, it can be concluded that the proposed method has a maximum of 4.9% error in BESS sizing, which is relatively small. Consequently, the proposed BESS sizing method can help the system planners design the BESS and increase the reliability of the system, in addition to avoiding over- or under-sizing the BESS.
Table 2 summarises the improvement in the ROCOF, Δ f ss   , and frequency nadir by using the BESS with a specified capacity, which is calculated by the proposed BESS sizing method. It can be seen that frequency and ROCOF are significantly improved with BESS. Thus, by selecting the proper size and location of the BESS using the proposed methodology, the system operators can maintain the frequency stability and ROCOF within an acceptable range.

3.3. Prony Analysis

In this section, the Prony method is used to extract the eigenvalue from a frequency signal and evaluate the stability of the system. The best location of BESS is determined by the eigenvalue and damping ratio analyses. Figure 14 shows the reconstruction of the frequency signal for the original system for Case 3 without the contribution of the BESS. The eigenvalue results for the frequency signal are shown in Figure 15.
The reconstruction of the frequency signal after adding the BESS to the system is shown in Figure 16. The results show a significant reduction of the frequency oscillation, as demonstrated in Figure 17. For further evaluations of the best locations for the BESS in the power grid, the simulations are repeated while the BESS is connected to different buses of the system, and an eigenvalue analysis is performed for each scenario. Accordingly, the best location for BESS is selected based on an evaluation of the minimum damping ratio as described in (17) and (18) [34].
λ = σ + i ω
ζ = σ σ 2 + ω 2
where λ represents the eigenvalues, and ζ represents the damping ratio.
The eigenvalue analysis results of the frequency signal with and without BESS are compared and illustrated in Figure 18. This figure shows that the BESS integration increases the real part of the system and accordingly increases the damping ratio compared to the system without BESS. It is found that the results show that the best location of the BESS is bus 2, as presented in Table 3. The minimum damping ratio is improved from 0.00748 to 0.0464, which means that the system stability is significantly improved by the proper selection of the size and location of the BESS within the test system.
The proposed BESS locating method based on the Prony method can help to analyse the frequency signal and find the highest minimum damping ratio to select the best bus to install and operate the BESS for frequency regulation. After selecting the required size of the BESS, the simulation is performed by placing the BESS at each bus consecutively, and then the frequency signal is analysed by the Prony method to find the highest minimum damping ratio among the system buses. The location of the BESS at bus 2 has an impact on increasing the frequency nadir and consequently on improving the frequency response of the system after considerably large contingencies. The eigenvalues analysis shows that the system is more stable as the minimum damping ratio increases significantly after implementing the BESS into the system, resulting in improved system stability during the disturbance.

4. Discussions

By applying the proposed strategy for size, location, and operation of the BESS to the test system under large contingencies of power loss and different levels of renewable energy penetration, the effectiveness of the applied method in enhancing frequency stability is illustrated in the study cases.
The effectiveness of the BESS sizing approach is shown by the simulation results presented in Table 1. The case studies in Section 3 show a significant improvement in steady state frequency deviation, frequency nadir, and ROCOF after implementing BESS. The frequency oscillations after significant power loss can be damped by using BESS, as demonstrated in Table 2. All the above improvements demonstrate that the suggested BESS size approach proposed in this paper can assist system planners in designing and maintaining the reliability of the system by using BESS. It also helps prevent the BESS from being oversized or undersized.
The most important frequency-related security constraint is UFLS. According to NERC, the most commonly practised first stage of UFLS operation usually occurs around 59.5 Hz to 59.3 Hz [33]. Therefore, one of the main benefits of integrating the BESS into the power grid is to avoid UFLS by making proper selections of size, location, and operating strategy for the BESS within the power grid.
By analysing the frequency signal and identifying the bus with the highest minimum damping ratio, the proposed BESS locating method based on the Prony method can determine which bus is optimal for installing and operating the BESS for frequency regulation. The location of the BESS at bus 2 has resulted in an increase in the frequency nadir, which has enhanced the system’s frequency response following considerable large contingencies. The analysis of eigenvalues indicates that the system is more stable after the BESS is implemented on bus 2, resulting in improved system stability.

5. Conclusions

With the high penetration of renewable energy into power grids, frequency stability and oscillation have become big concerns due to the reduced system inertia. The application of BESS is considered one of the options to deal with frequency stability and oscillation. This paper proposes:
(a)
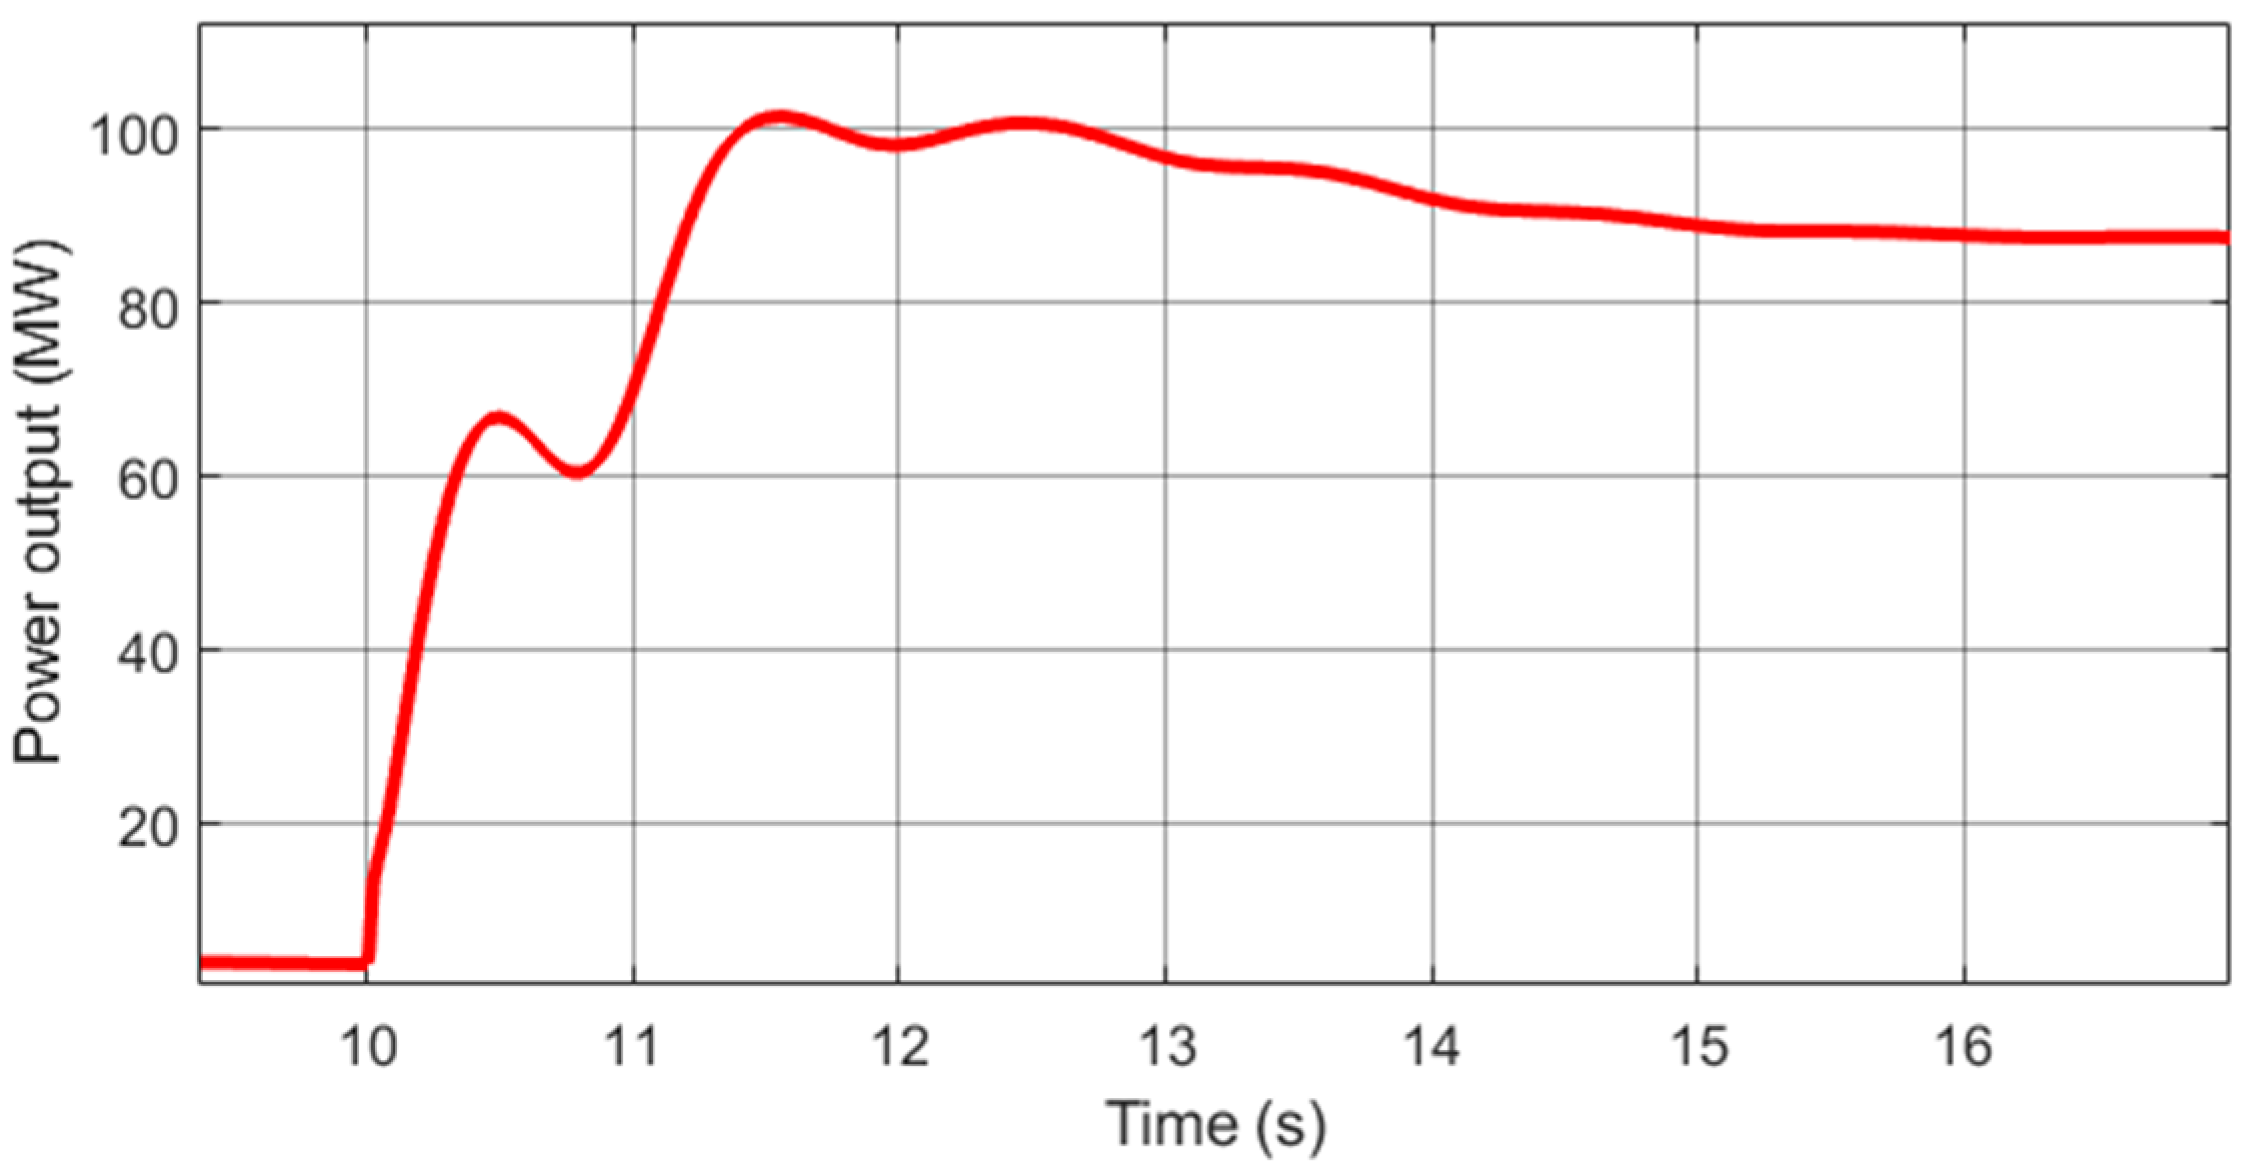
A system design strategy for power system frequency control by using BESS, including sizing ESS for IR and PFR, and therefore investigating how sizing capacity is related to renewable energy penetration levels. It has been shown that the sizing capacity of BESS is very close to that of the actual dynamic response capacity of BESS. Based on case studies, it has been found that at a penetration level of 25%, the sizing capacity for BESS is set to 102 MW; at a penetration level of 35%, the sizing capacity for BESS is set to 136 MW; and at a penetration level of 50%, the sizing capacity for BESS is set to 188 MW. In other words, with the increase in renewable energy, the capacity of BESS for frequency control needs to be increased.
(b)
A BESS locating approach to determine the best location of the BESS by analysing system oscillation using the Prony method, which is easy to implement based on measurements while actual physical system models are not required. This will make the Prony method suitable for large-scale real power grid analysis based on measurements. The proposed Prony method for system stability and oscillation analysis has been demonstrated on the Kundur 4-machine, 11-bus test system. In particular, it has been shown that with BESS, system damping can be improved in comparison to that without BESS. The case studies demonstrated a significant enhancement in steady-state frequency deviation, frequency nadir, and ROCOF after the implementation of BESS at the chosen bus. Integrating BESS into the power grid can effectively prevent UFLS by choosing the appropriate size, placement, and operation strategy for the BESS.
Future research work includes a coordination between BESS and UFLS stages and other protective relays in the power grid, and the comparative analysis with established methods for sizing and locating the large-scale BESS.

Author Contributions

Conceptualization, S.A.A.; methodology, S.A.A. and X.-P.Z.; software, S.A.A.; validation, S.A.A., N.C. and X.-P.Z.; formal analysis, S.A.A.; investigation, S.A.A.; resources, S.A.A.; data curation, S.A.A.; writing—original draft preparation S.A.A. and N.C.; writing—review and editing, N.C. and X.-P.Z.; visualization, S.A.A., X.-P.Z. and N.C.; supervision, X.-P.Z. and N.C. All authors have read and agreed to the published version of the manuscript.

Funding

This research received no external funding.

Data Availability Statement

Data are contained within the article.

Conflicts of Interest

The authors declare no conflicts of interest.

Appendix A

Table A1. Kundur two-area power system parameters [32].
Power PlantPower Rating (MVA)Active Power (MW)Droop (R)Inertia Constant (s)
G19007004.7%6.5
G29007004%6.5
G39007194.7%6.175
G49007004%6.175

References

  1. Tielens, P.; Van Hertem, D. The relevance of inertia in power systems. Renew. Sustain. Energy Rev. 2016, 55, 999–1009. [Google Scholar] [CrossRef]
  2. Poolla, B.K.; Bolognani, S.; Dorfler, F. Optimal Placement of Virtual Inertia in Power Grids. IEEE Trans. Autom. Control 2017, 62, 6209–6220. [Google Scholar] [CrossRef]
  3. Nguyen, H.T.; Yang, G.; Nielsen, A.H.; Jensen, P.H. Combination of Synchronous Condenser and Synthetic Inertia for Frequency Stability Enhancement in Low-Inertia Systems. IEEE Trans. Sustain. Energy 2019, 10, 997–1005. [Google Scholar] [CrossRef]
  4. Brogan, P.V.; Best, R.J.; Morrow, D.J.; McKinley, K.; Kubik, M.L. Effect of BESS Response on Frequency and RoCoF during Underfrequency Transients. IEEE Trans. Power Syst. 2019, 34, 575–583. [Google Scholar] [CrossRef]
  5. Chen, S.; Zhang, T.; Gooi, H.B.; Masiello, R.D.; Katzenstein, W. Penetration Rate and Effectiveness Studies of Aggregated BESS for Frequency Regulation. IEEE Trans. Smart Grid 2016, 7, 167–177. [Google Scholar] [CrossRef]
  6. Zhu, Y.; Liu, C.; Wang, B.; Sun, K. Damping control for a target oscillation mode using battery energy storage. J. Mod. Power Syst. Clean Energy 2018, 6, 833–845. [Google Scholar] [CrossRef]
  7. Zhu, Y.; Liu, C.; Sun, K.; Shi, D.; Wang, Z. Optimization of Battery Energy Storage to Improve Power System Oscillation Damping. IEEE Trans. Sustain. Energy 2019, 10, 1015–1024. [Google Scholar] [CrossRef]
  8. Cai, Z.; Bussar, C.; Stöcker, P.; Moraes, L.; Magnor, D.; Leuthold, M.; Sauer, D.U. Application of Battery Storage for Compensation of Forecast Errors of Wind Power Generation in 2050. Energy Procedia 2015, 73, 208–217. [Google Scholar] [CrossRef]
  9. Knap, V.; Chaudhary, S.K.; Stroe, D.-I.; Swierczynski, M.; Craciun, B.-I.; Teodorescu, R. Sizing of an Energy Storage System for Grid Inertial Response and Primary Frequency Reserve. IEEE Trans. Power Syst. 2016, 31, 3447–3456. [Google Scholar] [CrossRef]
  10. Datta, U.; Kalam, A.; Shi, J. The relevance of large-scale battery energy storage (BES) application in providing primary frequency control with increased wind energy penetration. J. Energy Storage 2019, 23, 9–18. [Google Scholar] [CrossRef]
  11. Salman, U.T.; Al-Ismail, F.S.; Khalid, M. Optimal Sizing of Battery Energy Storage for Grid-Connected and Isolated Wind-Penetrated Microgrid. IEEE Access 2020, 8, 91129–91138. [Google Scholar] [CrossRef]
  12. Xie, H.; Teng, X.; Xu, Y.; Wang, Y. Optimal Energy Storage Sizing for Networked Microgrids Considering Reliability and Resilience. IEEE Access 2019, 7, 86336–86348. [Google Scholar] [CrossRef]
  13. Alsharif, H.; Jalili, M.; Hasan, K.N. Power system frequency stability using optimal sizing and placement of Battery Energy Storage System under uncertainty. J. Energy Storage 2022, 50, 104610. [Google Scholar] [CrossRef]
  14. Metwaly, M.K.; Teh, J. Probabilistic Peak Demand Matching by Battery Energy Storage Alongside Dynamic Thermal Ratings and Demand Response for Enhanced Network Reliability. IEEE Access 2020, 8, 181547–181559. [Google Scholar] [CrossRef]
  15. Oudalov, A.; Chartouni, D.; Ohler, C. Optimizing a Battery Energy Storage System for Primary Frequency Control. IEEE Trans. Power Syst. 2007, 22, 1259–1266. [Google Scholar] [CrossRef]
  16. Ngamroo, I. An optimization technique of robust load frequency stabilizer for superconducting magnetic energy storage. Energy Convers. Manag. 2005, 46, 3060–3090. [Google Scholar] [CrossRef]
  17. Moon, H.-J.; Yun, A.-Y.; Kim, E.-S.; Moon, S.-I. An Analysis of Energy Storage Systems for Primary Frequency Control of Power Systems in South Korea. Energy Procedia 2017, 107, 116–121. [Google Scholar] [CrossRef]
  18. Zhu, Y.; Liu, C.; Dai, R.; Liu, G.; Xu, Y. Optimal Battery Energy Storage Placement for Transient Voltage Stability Enhancement. In Proceedings of the 2019 IEEE Power & Energy Society General Meeting (PESGM), Atlanta, GA, USA, 4–8 August 2019; pp. 1–5. [Google Scholar]
  19. Ramos, A.F.; Ahmad, I.; Habibi, D.; Mahmoud, T.S. Placement and sizing of utility-size battery energy storage systems to improve the stability of weak grids. Int. J. Electr. Power Energy Syst. 2023, 144, 108427. [Google Scholar] [CrossRef]
  20. Abdel-Mawgoud, H.; Kamel, S.; Khasanov, M.; Khurshaid, T. A strategy for PV and BESS allocation considering uncertainty based on a modified Henry gas solubility optimizer. Electr. Power Syst. Res. 2021, 191, 106886. [Google Scholar] [CrossRef]
  21. Padhee, M.; Pal, A.; Mishra, C.; Vance, K.A. A Fixed-Flexible BESS Allocation Scheme for Transmission Networks Considering Uncertainties. IEEE Trans. Sustain. Energy 2020, 11, 1883–1897. [Google Scholar] [CrossRef]
  22. Das, C.K.; Mahmoud, T.S.; Bass, O.; Muyeen, S.M.; Kothapalli, G.; Baniasadi, A.; Mousavi, N. Optimal sizing of a utility-scale energy storage system in transmission networks to improve frequency response. J. Energy Storage 2020, 29, 101315. [Google Scholar] [CrossRef]
  23. Golpira, H.; Atarodi, A.; Amini, S.; Messina, A.R.; Francois, B.; Bevrani, H. Optimal Energy Storage System-Based Virtual Inertia Placement: A Frequency Stability Point of View. IEEE Trans. Power Syst. 2020, 35, 4824–4835. [Google Scholar] [CrossRef]
  24. Akram, U.; Mithulananthan, N.; Shah, R.; Pourmousavi, S.A. Sizing HESS as inertial and primary frequency reserve in low inertia power system. IET Renew. Power Gener. 2021, 15, 99–113. [Google Scholar] [CrossRef]
  25. Akram, U.; Nadarajah, M.; Shah, R.; Milano, F. A review on rapid responsive energy storage technologies for frequency regulation in modern power systems. Renew. Sustain. Energy Rev. 2020, 120, 109626. [Google Scholar] [CrossRef]
  26. El-Bidairi, K.S.; Nguyen, H.D.; Mahmoud, T.S.; Jayasinghe, S.D.G.; Guerrero, J.M. Optimal sizing of Battery Energy Storage Systems for dynamic frequency control in an islanded microgrid: A case study of Flinders Island, Australia. Energy 2020, 195, 117059. [Google Scholar] [CrossRef]
  27. Yoo, Y.; Jung, S.; Jang, G. Dynamic Inertia Response Support by Energy Storage System with Renewable Energy Integration Substation. J. Mod. Power Syst. Clean Energy 2020, 8, 260–266. [Google Scholar] [CrossRef]
  28. Silva Jr, S.S.; Assis, T.M.L. Adaptive underfrequency load shedding in systems with renewable energy sources and storage capability. Electr. Power Syst. Res. 2020, 189, 106747. [Google Scholar] [CrossRef]
  29. Zhao, M.; Yin, H.; Xue, Y.; Zhang, X.-P.; Lan, Y. Coordinated Damping Control Design for Power System with Multiple Virtual Synchronous Generators Based on Prony Method. IEEE Open Access J. Power Energy 2021, 8, 316–328. [Google Scholar] [CrossRef]
  30. Thi Nguyen, H.; Yang, G.; Hejde Nielsen, A.; Højgaard Jensen, P.; Pal, B. Applying Synchronous Condenser for Damping Provision in Converter-dominated Power System. J. Mod. Power Syst. Clean Energy 2021, 9, 639–647. [Google Scholar] [CrossRef]
  31. Trudnowski, D.J.; Smith, J.R.; Short, T.A.; Pierre, D.A. An application of Prony methods in PSS design for multimachine systems. IEEE Trans. Power Syst. 1991, 6, 118–126. [Google Scholar] [CrossRef]
  32. Kundur, P. Power Systems Stability and Control; McGraw-Hill: New York, NY, USA, 1994. [Google Scholar]
  33. NERC. Reliability Guideline Recommended Approaches for UFLS Program Design with Increasing Penetrations of DERs; NERC: Atlanta, GA, USA, 2021. [Google Scholar]
  34. Kanchanaharuthai, A.; Chankong, V.; Loparo, K.A. Transient Stability and Voltage Regulation in Multimachine Power Systems Vis-à-Vis STATCOM and Battery Energy Storage. IEEE Trans. Power Syst. 2015, 30, 2404–2416. [Google Scholar] [CrossRef]
Figure 1. Frequency response stages as defined by the ENTSO-E [24,25].
Inventions 09 00003 g001
Figure 2. Block diagram of ESS control.
Inventions 09 00003 g002
Figure 3. The proposed BESS sizing and locating strategy.
Inventions 09 00003 g003
Figure 4. Modified single-line diagram of the Kundur two-area system test system.
Inventions 09 00003 g004
Figure 5. Frequency response for Case 1.
Inventions 09 00003 g005
Figure 6. ROCOF for Case 1.
Inventions 09 00003 g006
Figure 7. BESS output power for Case 1.
Inventions 09 00003 g007
Figure 8. Frequency response for Case 2.
Inventions 09 00003 g008
Figure 9. ROCOF for Case 2.
Inventions 09 00003 g009
Figure 10. BESS output power for Case 2.
Inventions 09 00003 g010
Figure 11. Frequency response for Case 3.
Inventions 09 00003 g011
Figure 12. BESS output power for Case 3.
Inventions 09 00003 g012
Figure 13. ROCOF for Case 3.
Inventions 09 00003 g013
Figure 14. Reconstructed system frequency without BESS.
Inventions 09 00003 g014
Figure 15. Eigenvalue analysis of the frequency signal without BESS.
Inventions 09 00003 g015
Figure 16. Reconstruction of the frequency signal with BESS.
Inventions 09 00003 g016
Figure 17. Eigenvalues analysis of the frequency signal with BESS.
Inventions 09 00003 g017
Figure 18. Eigenvalues analysis of the frequency signal with and without BESS.
Inventions 09 00003 g018
Table 1. Summary of the accuracy of BESS sizing methodology for three cases.
ScenarioCalculation Results of BESS Size (MW)Simulation Results of BESS Size (MW)|Error|
Case 1991022.2%
Case 21431364.9%
Case 3193.51882.8%
Table 2. Summary of the simulation results.
ScenarioROCOF (Hz/s) Δ f ss   (Hz)Frequency Nadir (Hz)
Without BESSWith BESSWithout BESSWith BESSWithout BESSWith BESS
Case 10.580.500.240.1859.6259.71
Case 20.600.480.250.1759.5859.68
Case 30.690.490.350.1759.3859.65
Table 3. Eigenvalues and minimum damping ratio ζ min .
SystemEigenvalue ζ min  
Without BESS0 ± j00.00748
−0.0217 ± j0.9858, −0.0551 ± j0.8163,
−0.0849 ± j2.6332, −0.1006 ± j 3.0462,
−0.1216 ± j1.746, −0.1218 ± j1.9425,
−0.1248 ± j4.2571, −0.1465 ± j4.9476,
−0.1688 ± j0.2237, −0.1713 ± j5.4736,
−0.183 ± j8.5048, −0.189 ± j0.1937,
−0.2064 ± j27.587, −0.209 ± j9.062,
−0.2114 ± j27.0249, −0.2212 ± j7.3659
With BESS located at Bus 20 ± j00.0464
−0.6743 ± j4.8589, −0.8391 ± j1.7627,
−0.9046 ± j14.1408, −1.2914 ± j24.9384
−1.2965 ± j18.0661, −1.3356 ± j28.7655
−1.3789 ± j9.6421, −1.4198 ± j21.3423
Disclaimer/Publisher’s Note: The statements, opinions and data contained in all publications are solely those of the individual author(s) and contributor(s) and not of MDPI and/or the editor(s). MDPI and/or the editor(s) disclaim responsibility for any injury to people or property resulting from any ideas, methods, instructions or products referred to in the content.

