Numerical Study of the Influence of the Type of Gas on Drag Reduction by Microbubble Injection
Abstract
:1. Introduction
2. Numerical Simulation Scheme and Physical Model
2.1. Establishment of the Water Tunnel Experiment [7] and Numerical Simulation Scheme
2.2. Physical Model Description
3. Numerical Model Study
3.1. Governing Equations
3.2. Turbulence Model
3.3. Interphase Force
3.3.1. Drag Force
3.3.2. Lift
3.3.3. Virtual Mass Force
3.3.4. Surface Tension
3.4. Population Balance Model
3.4.1. Luo Coalescence Model
3.4.2. Laakkonen Breakup Model
3.5. Interphase Mass Transfer Model
3.5.1. Equilibrium Concentration
3.5.2. Convective Mass Transfer
3.6. Component Transport Equation
3.7. UDF and Calculation Domain
3.7.1. Writing of UDF
3.7.2. Calculation Domain and Boundary Conditions
4. Result Analyses and Discussion
4.1. Numerical Result Verification
4.2. Influence of the Type of Gas on Drag Reduction by Microbubble Injection
- (1)
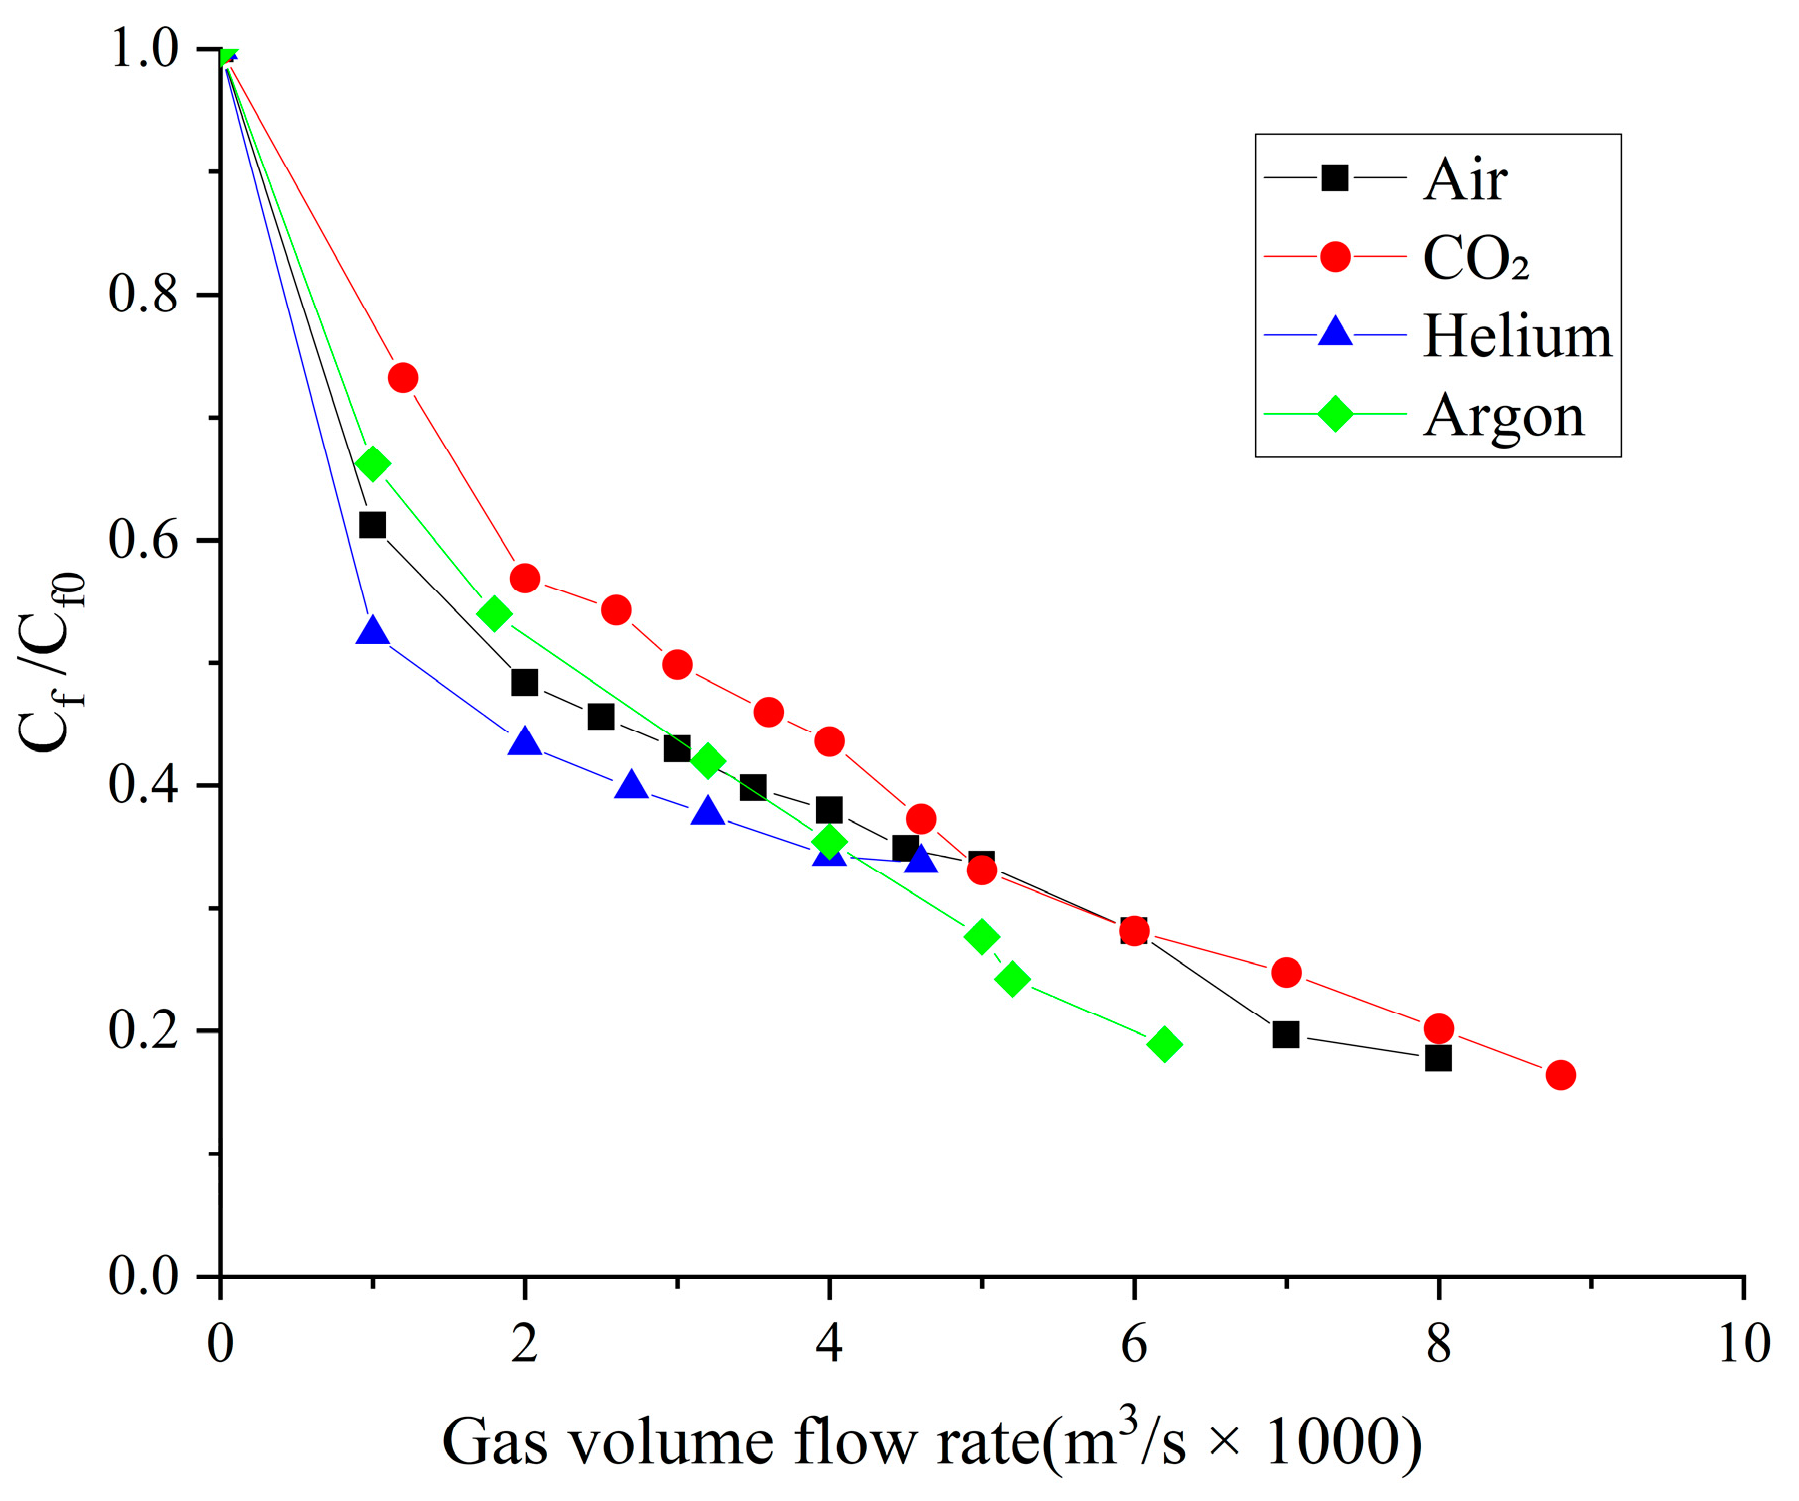
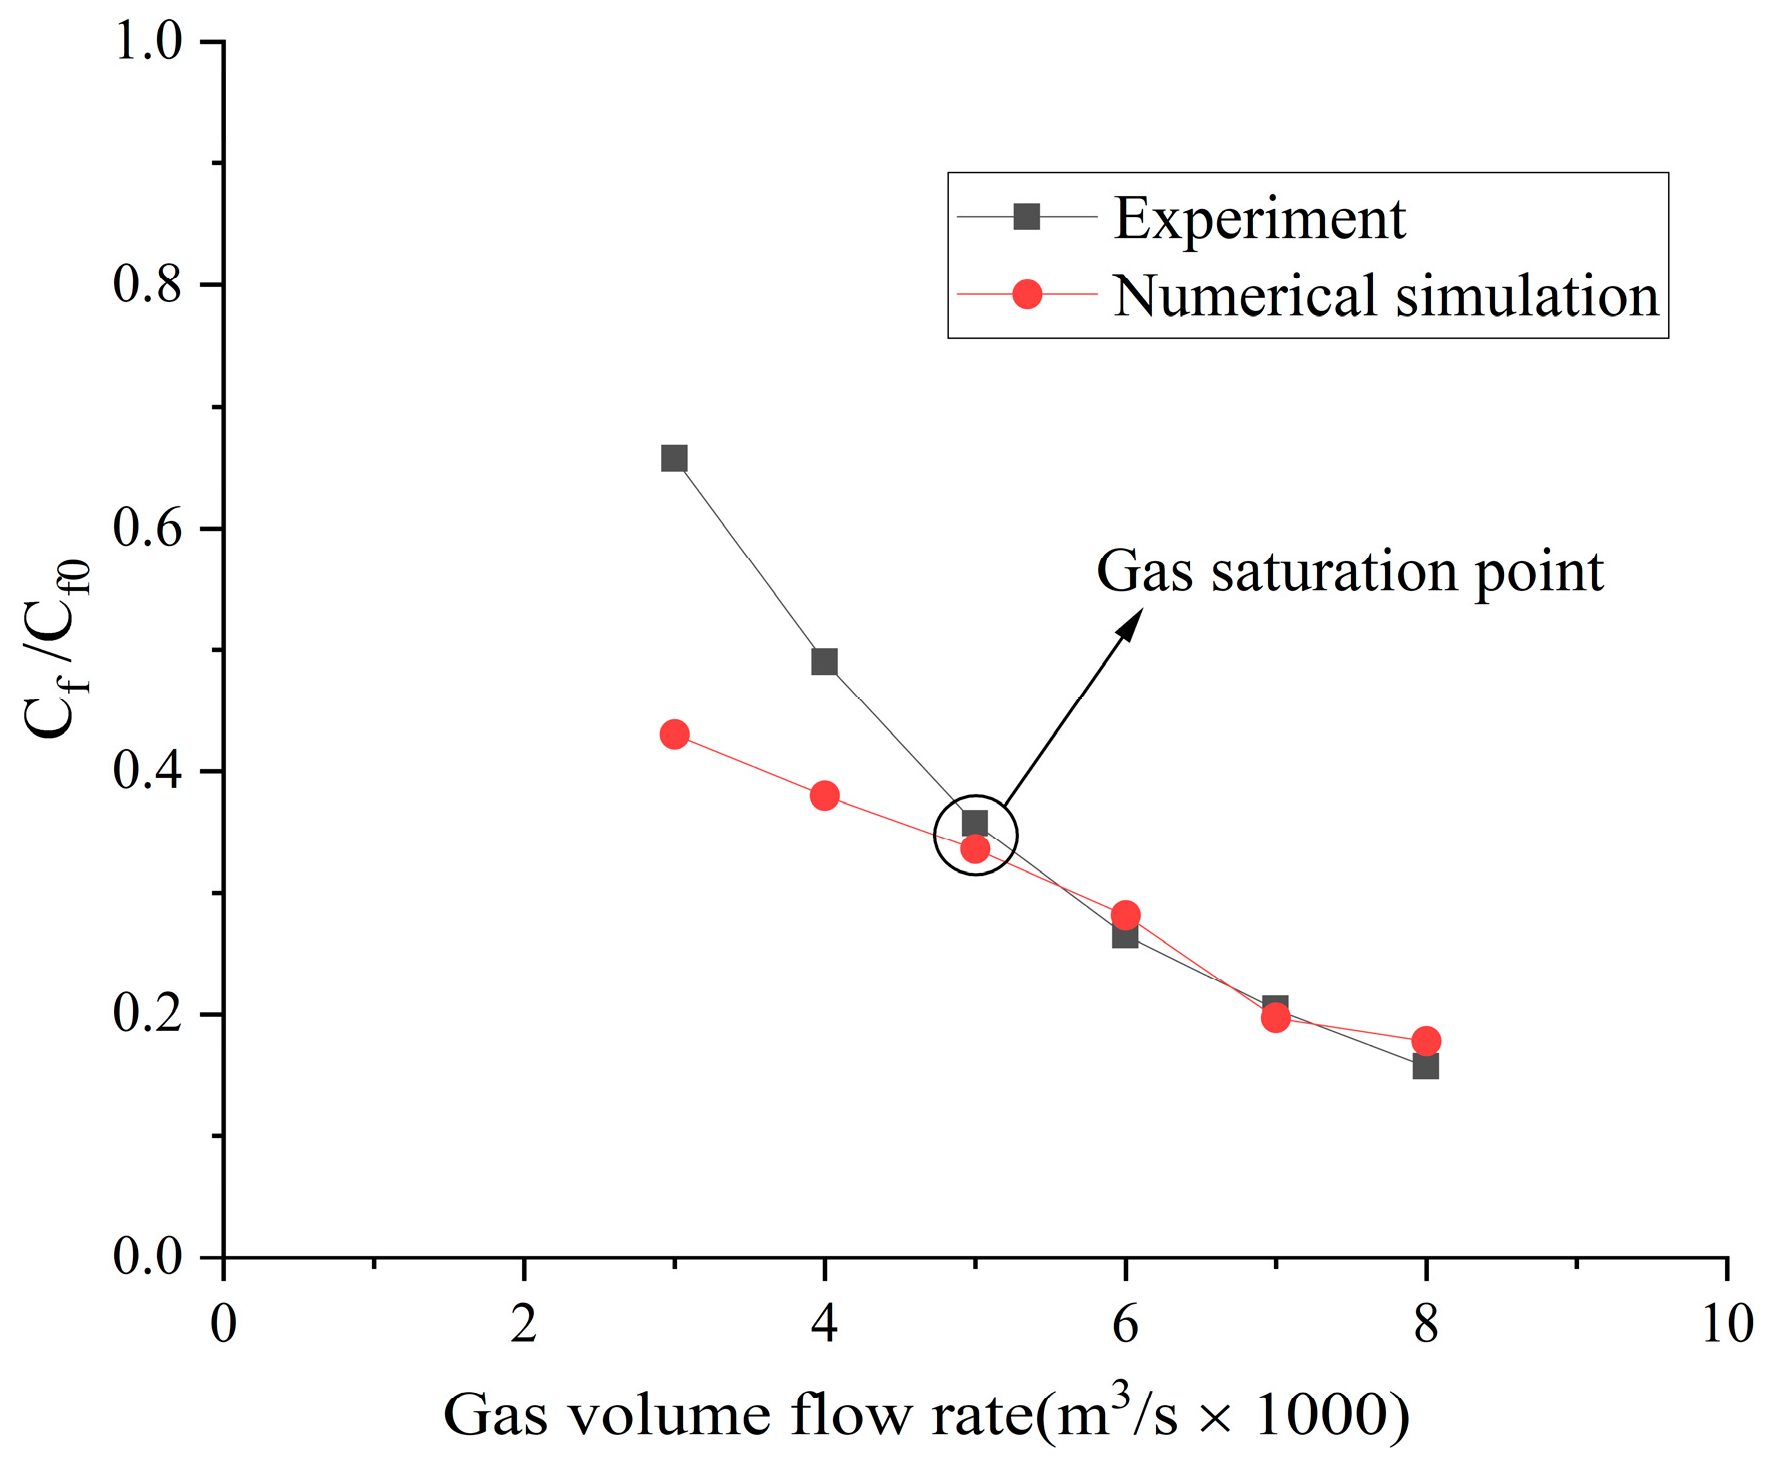
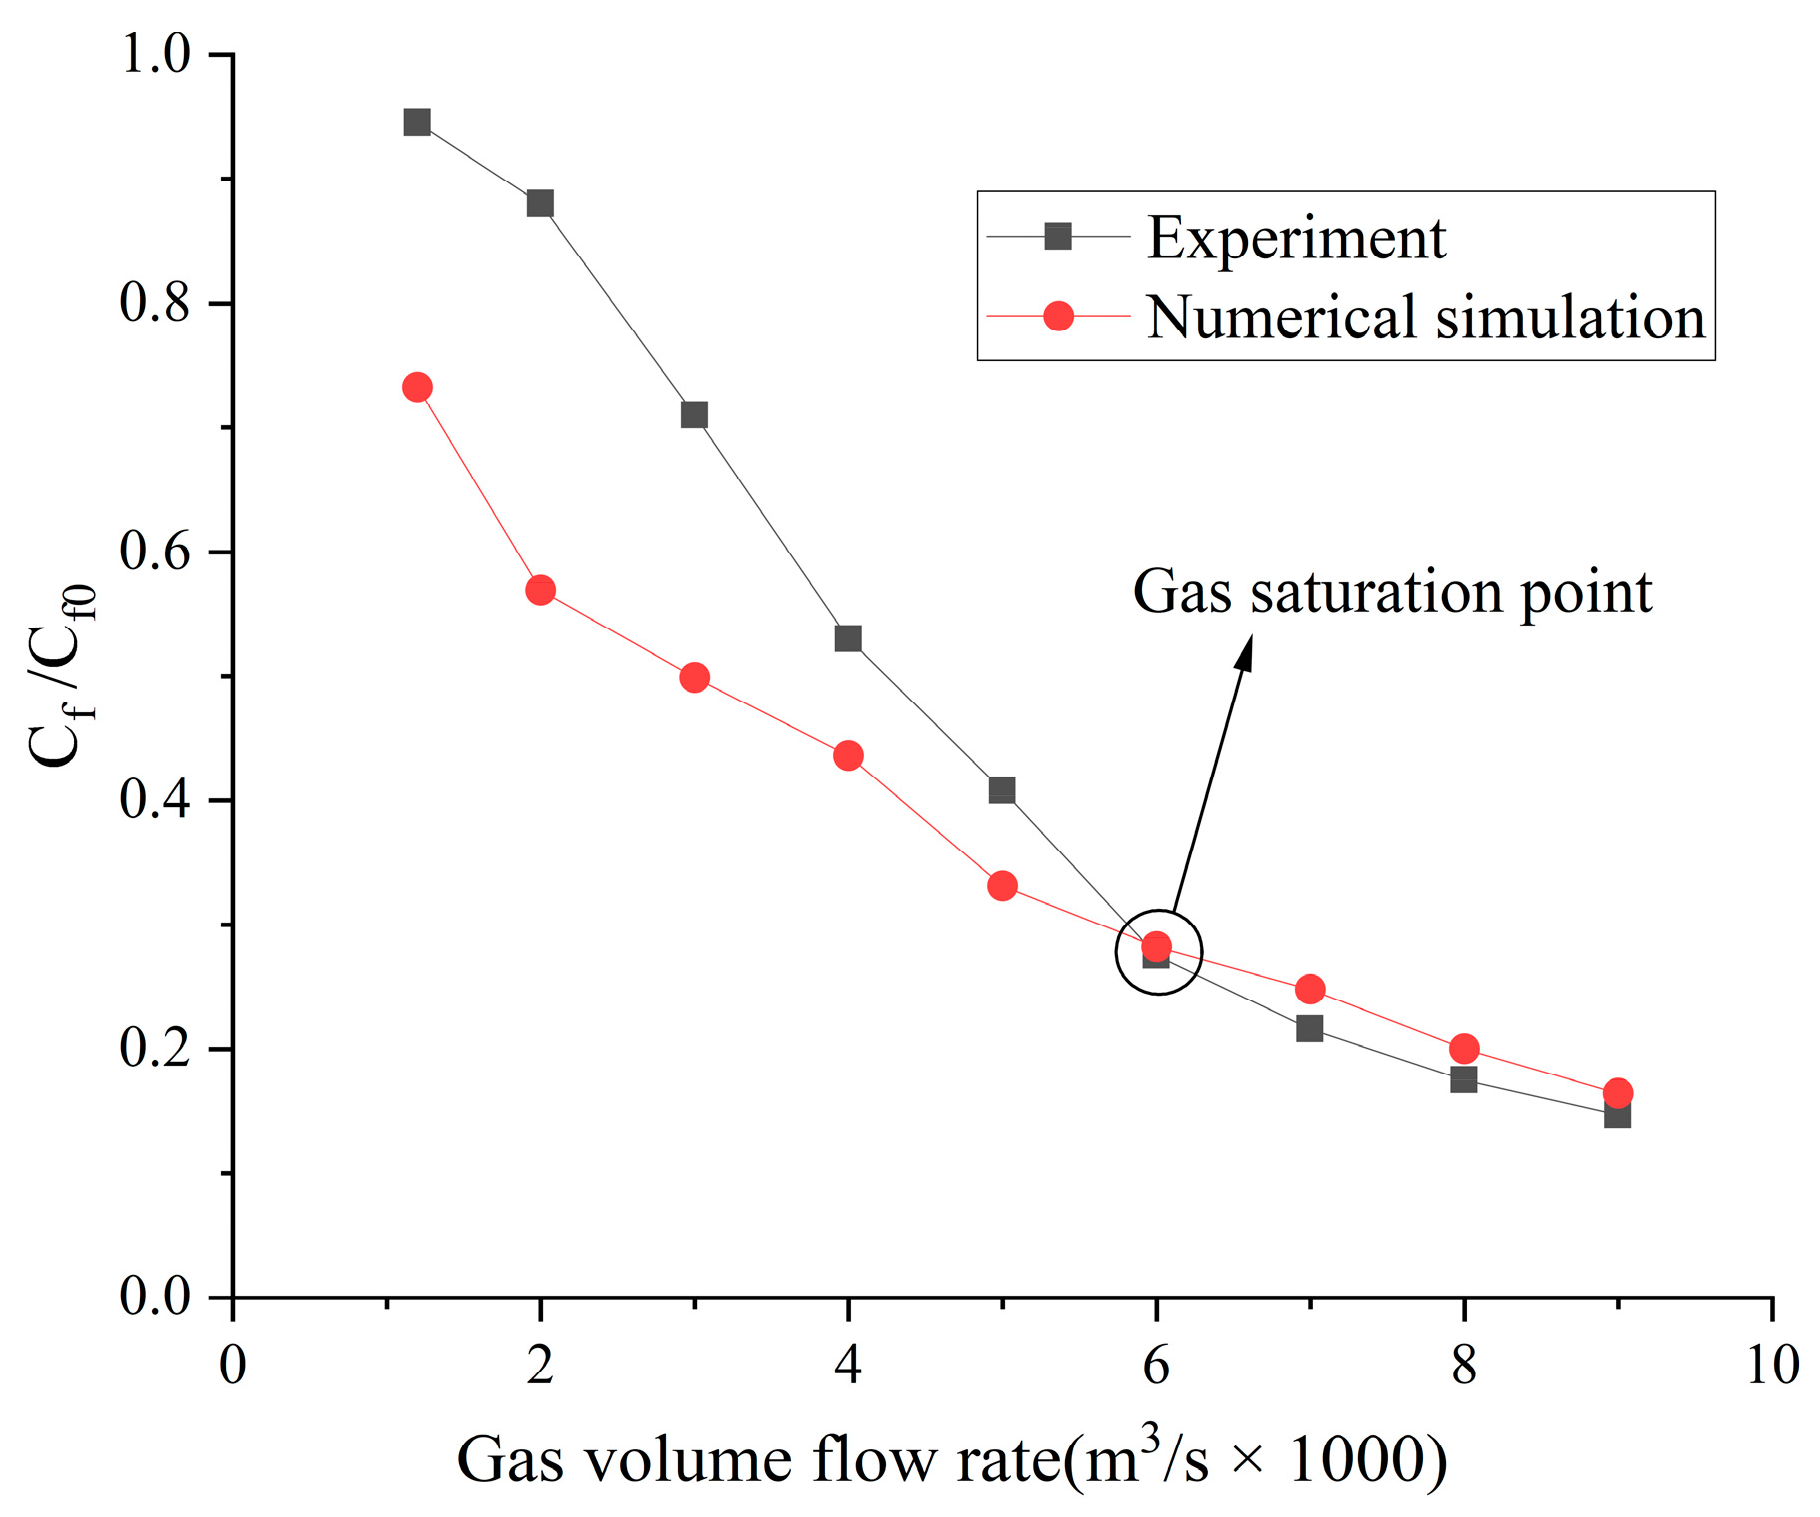
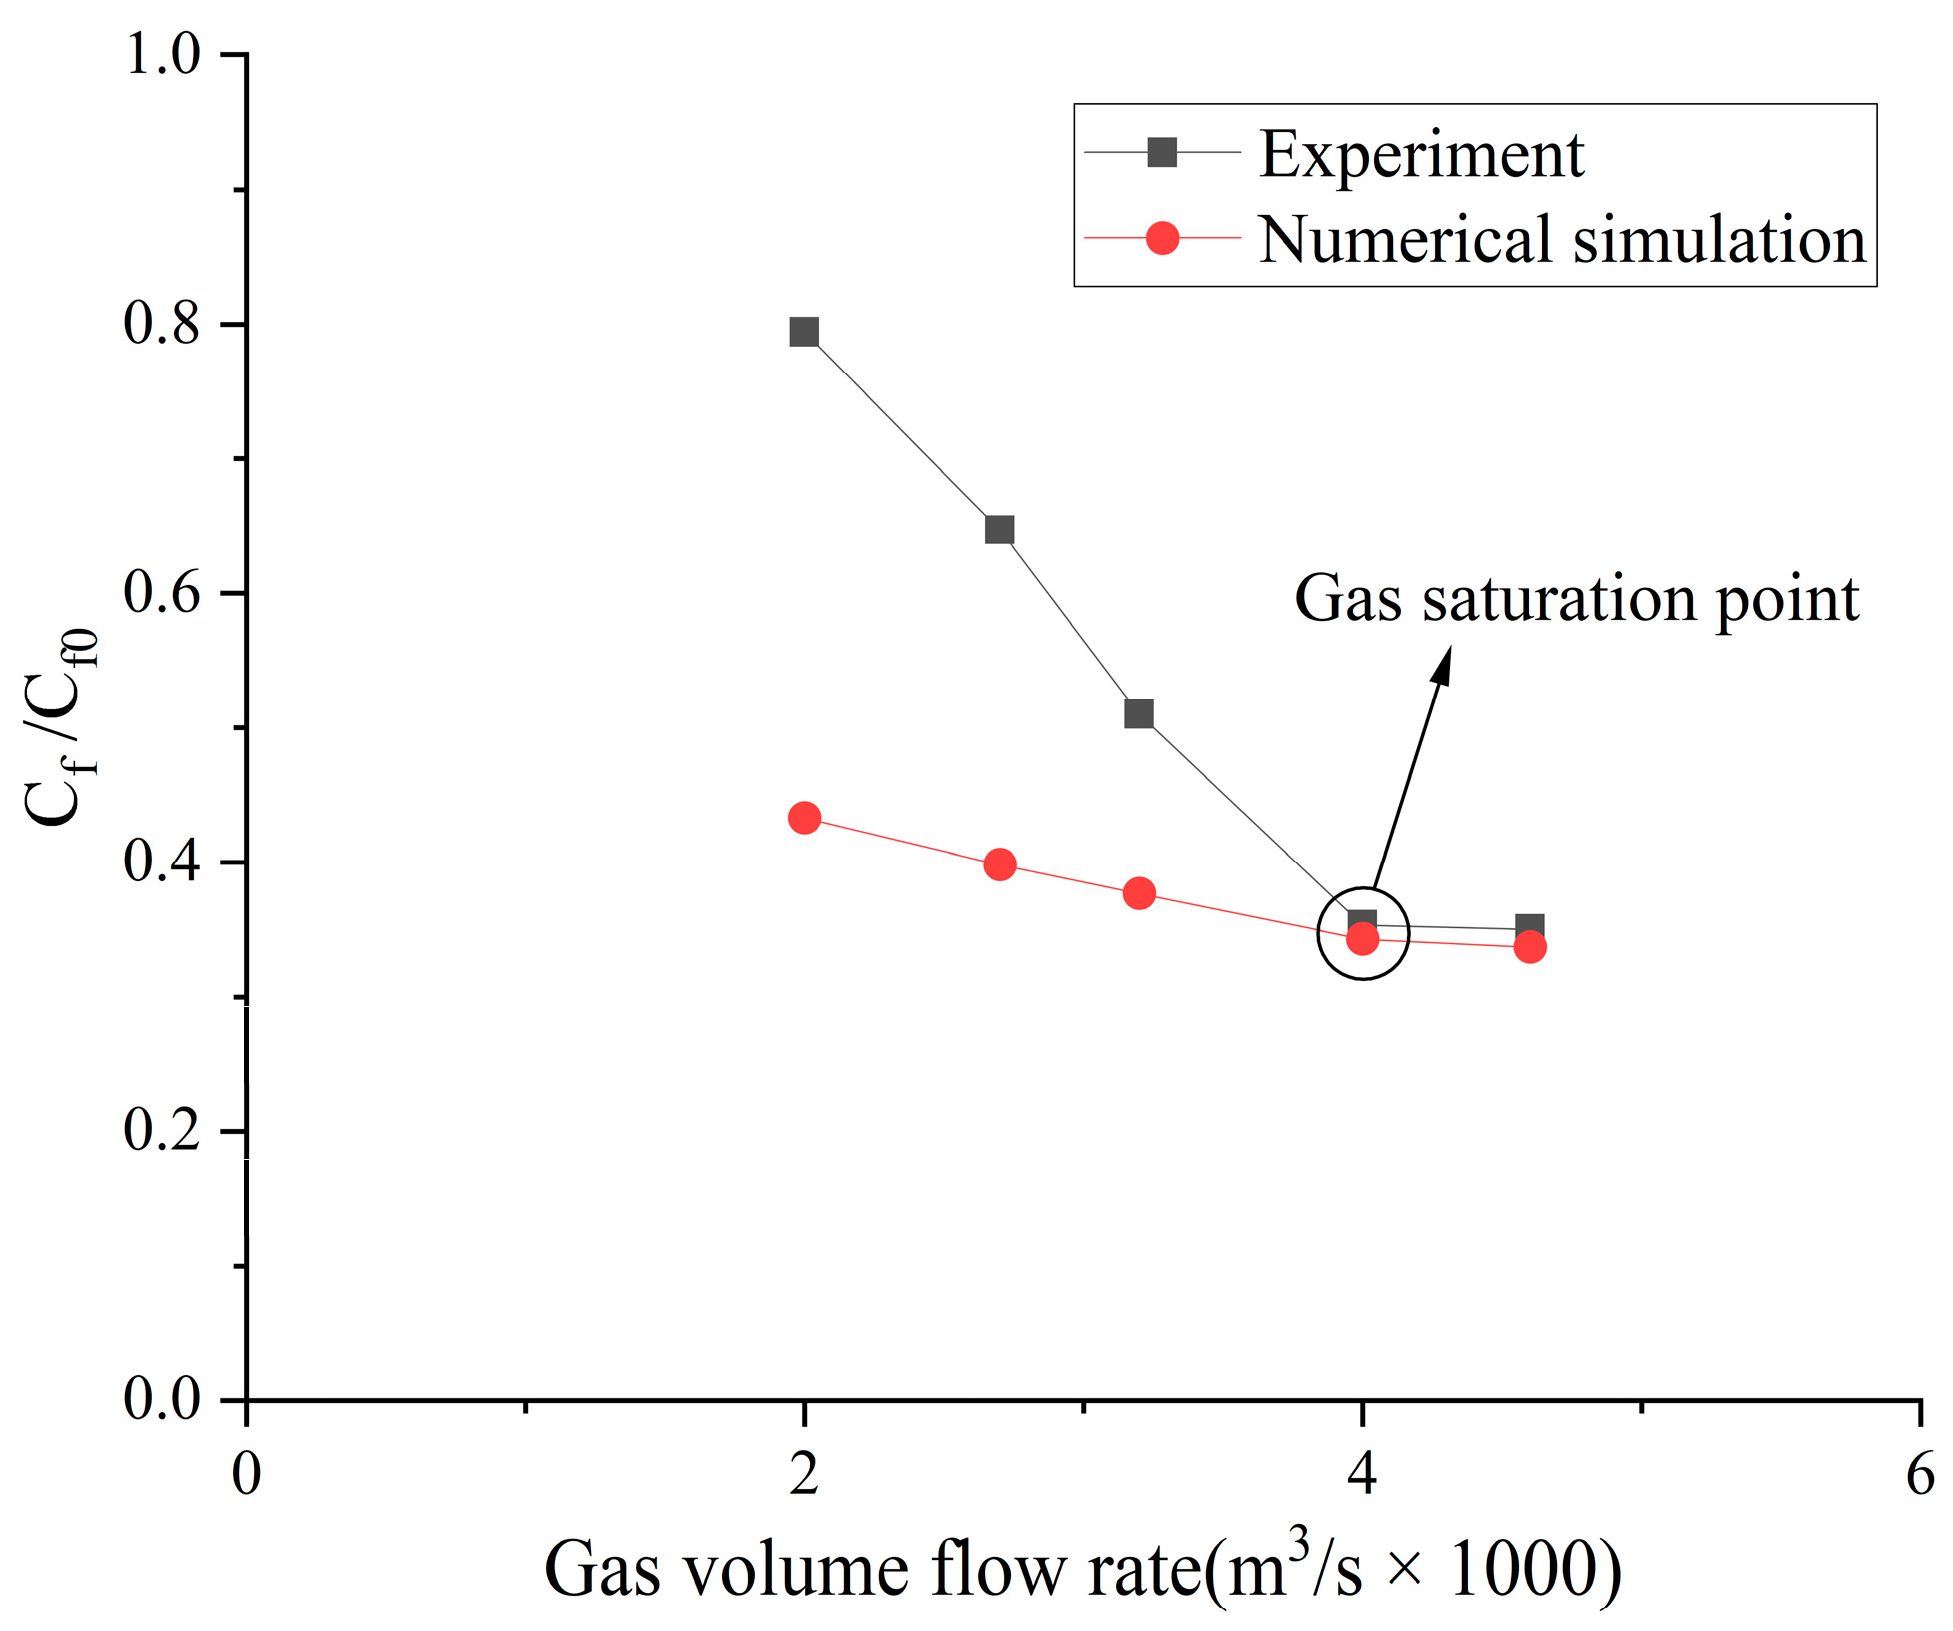
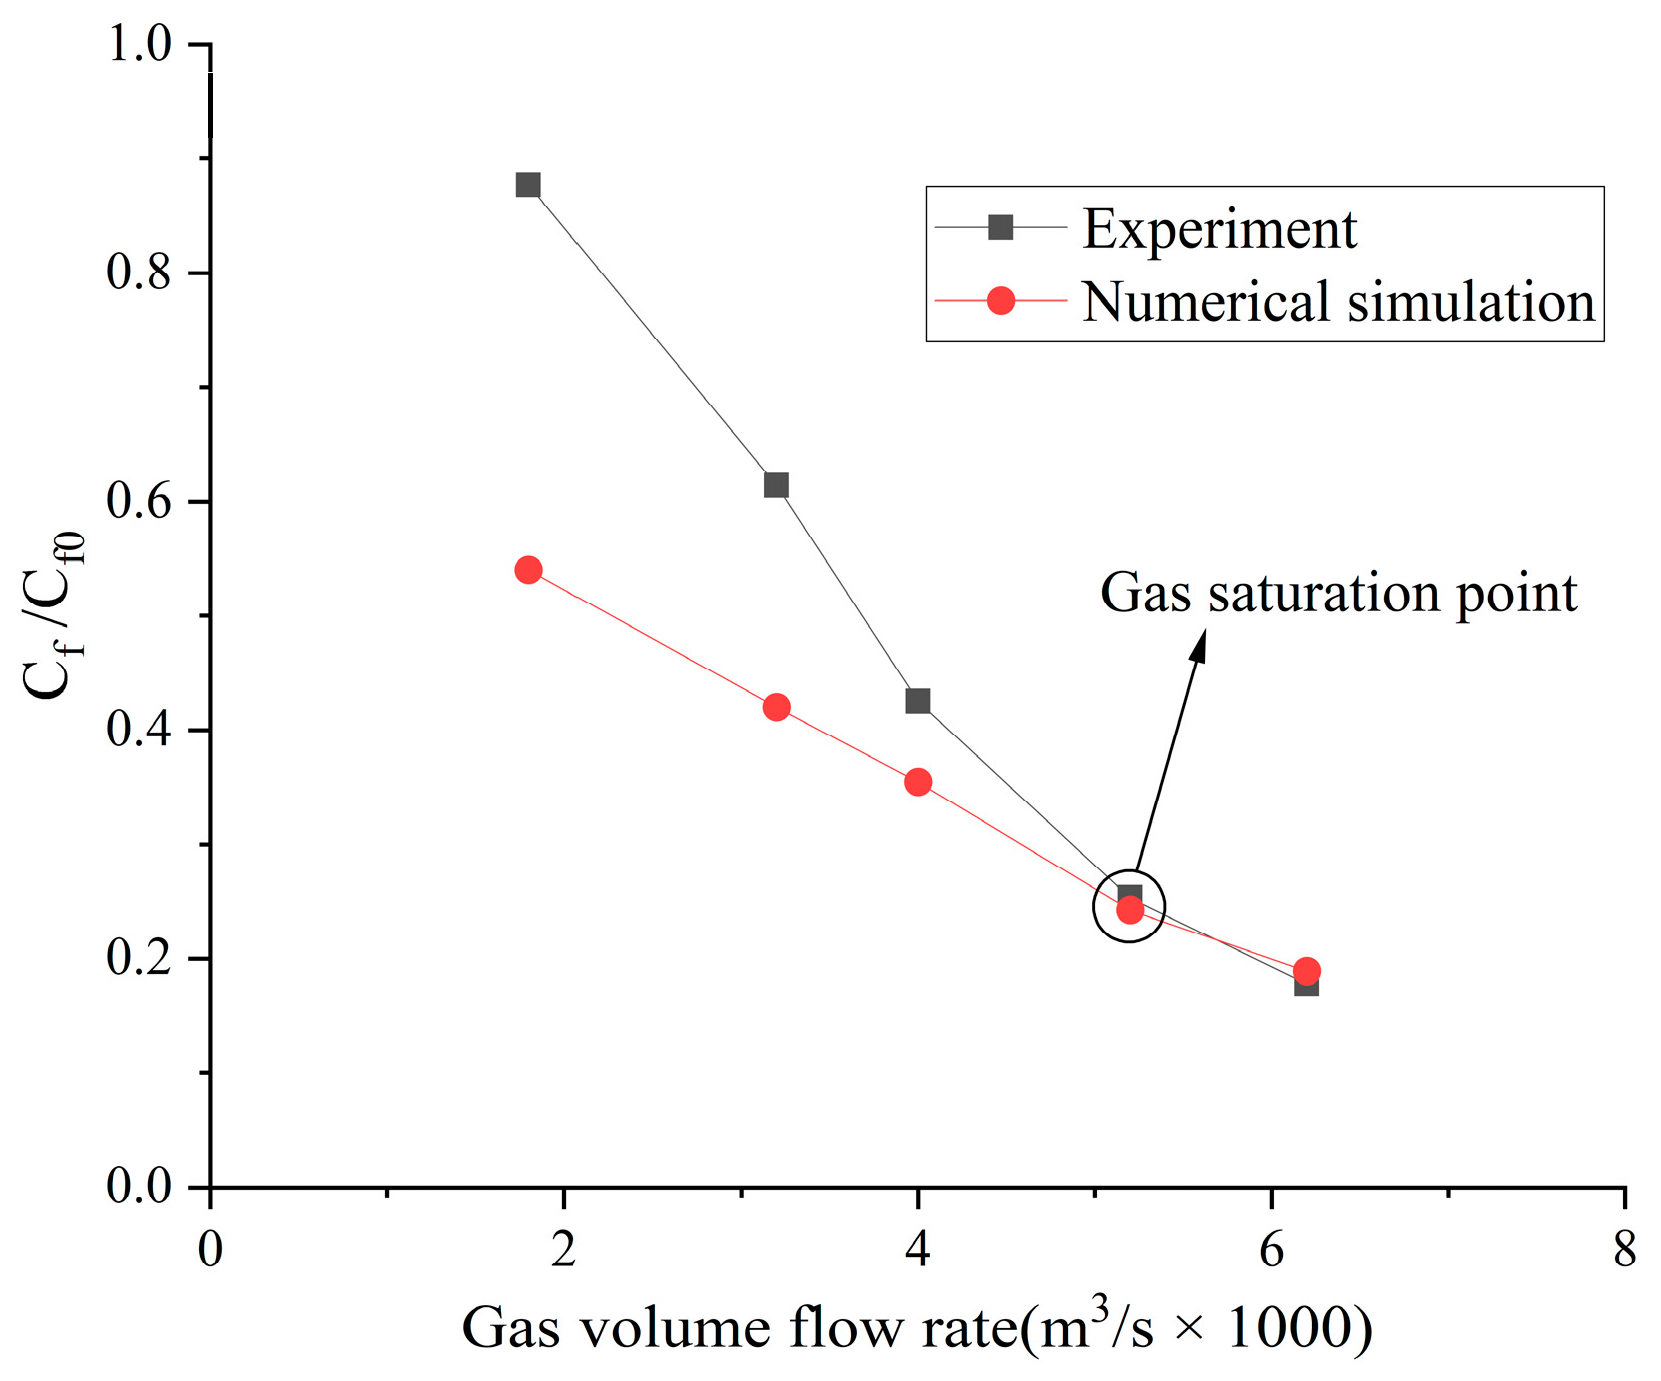
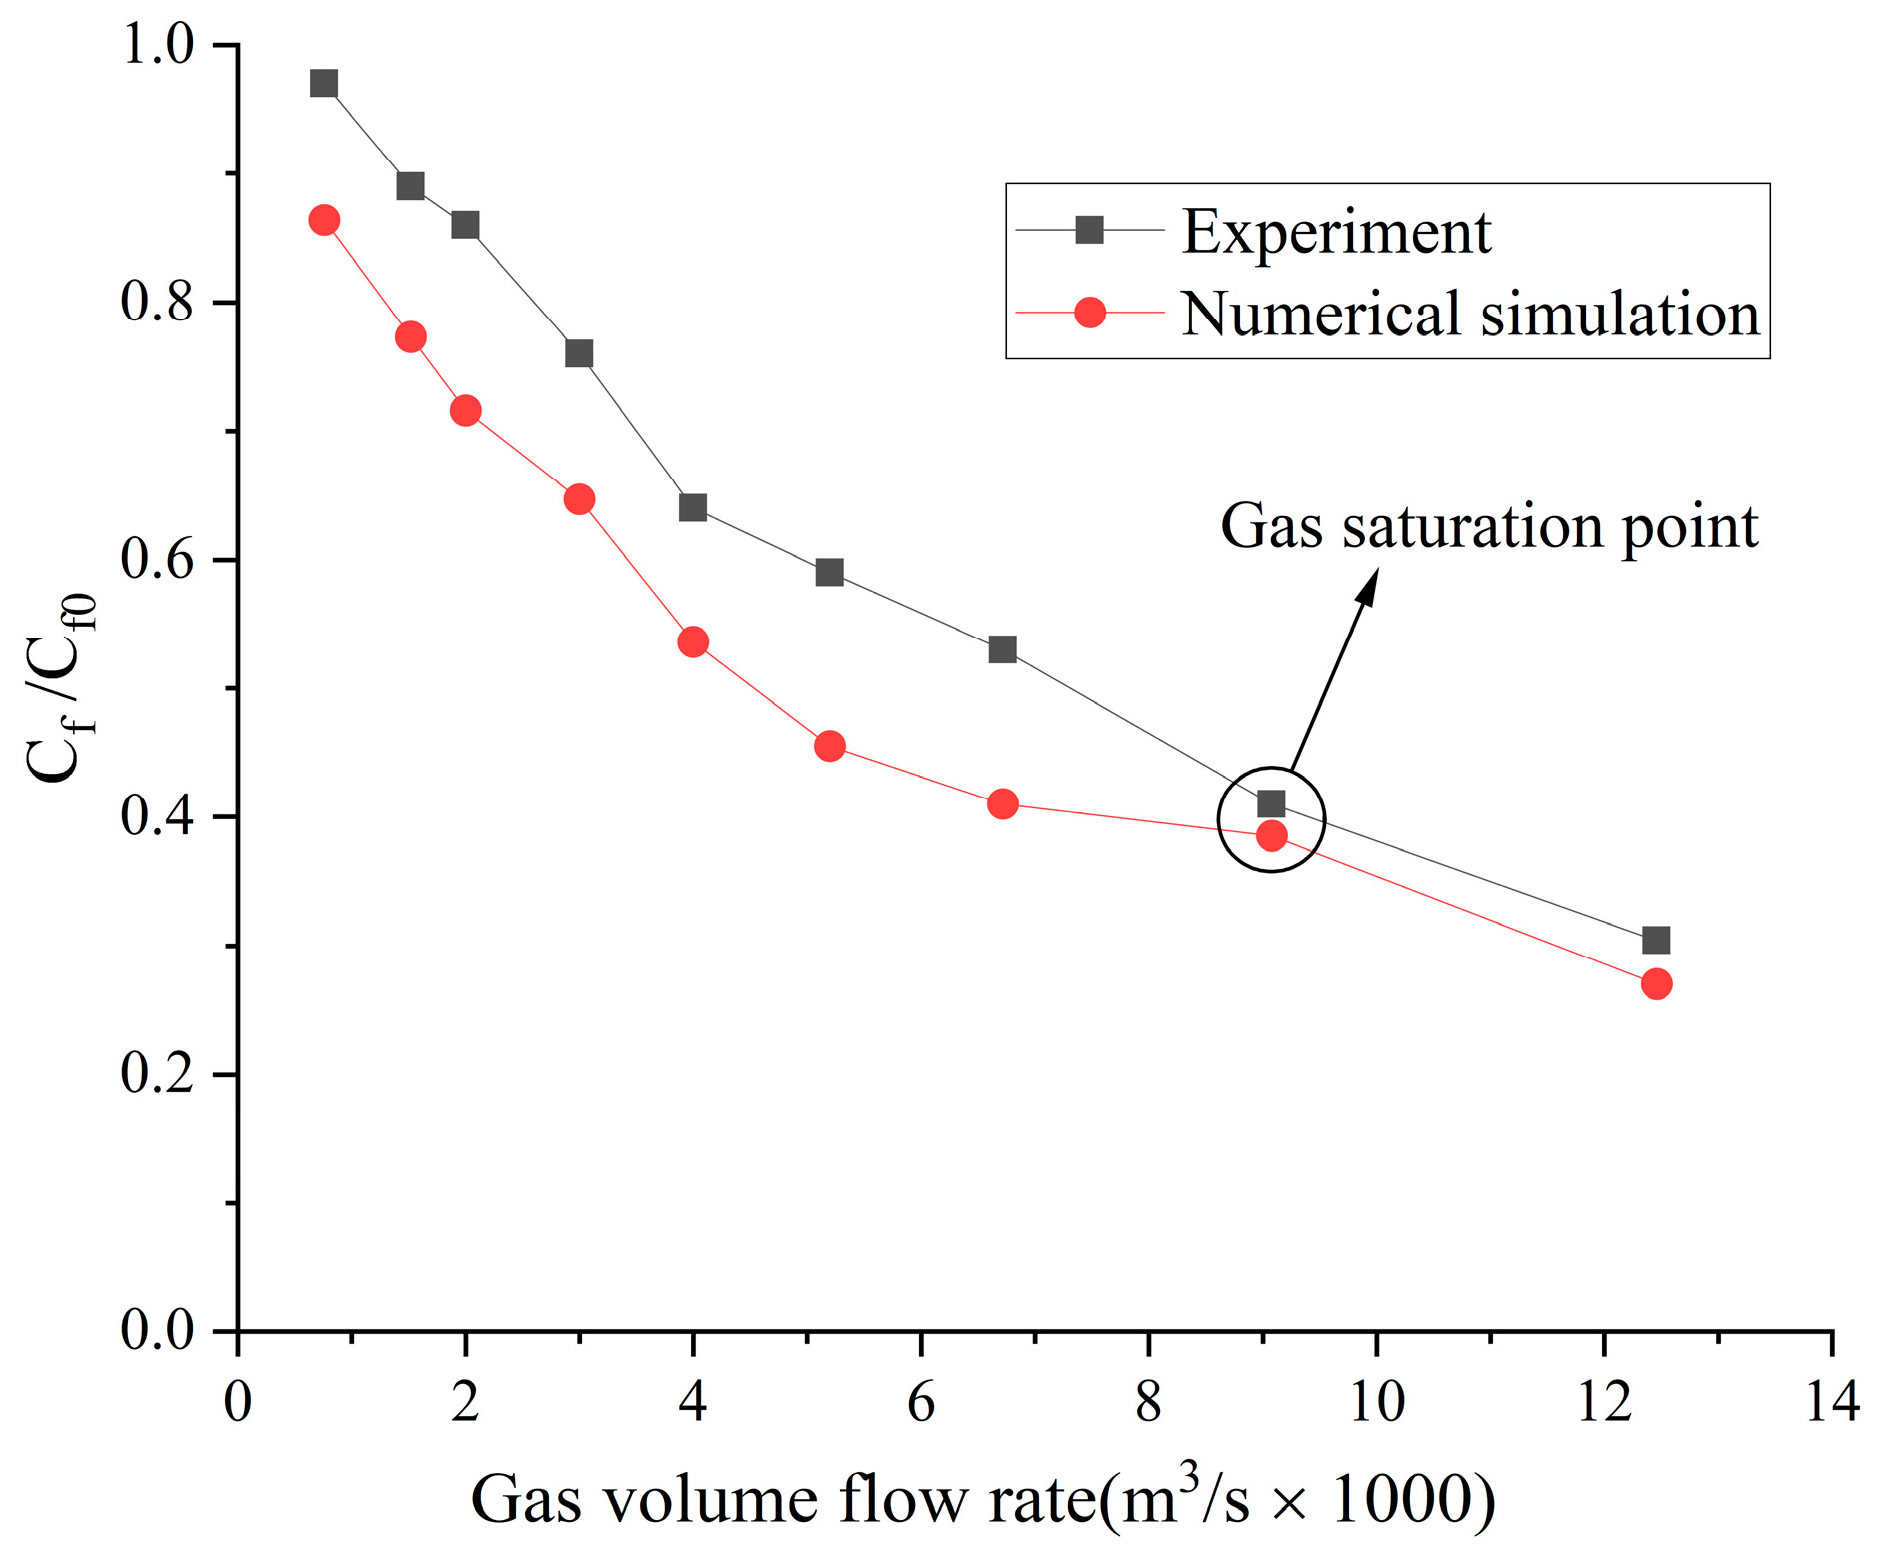
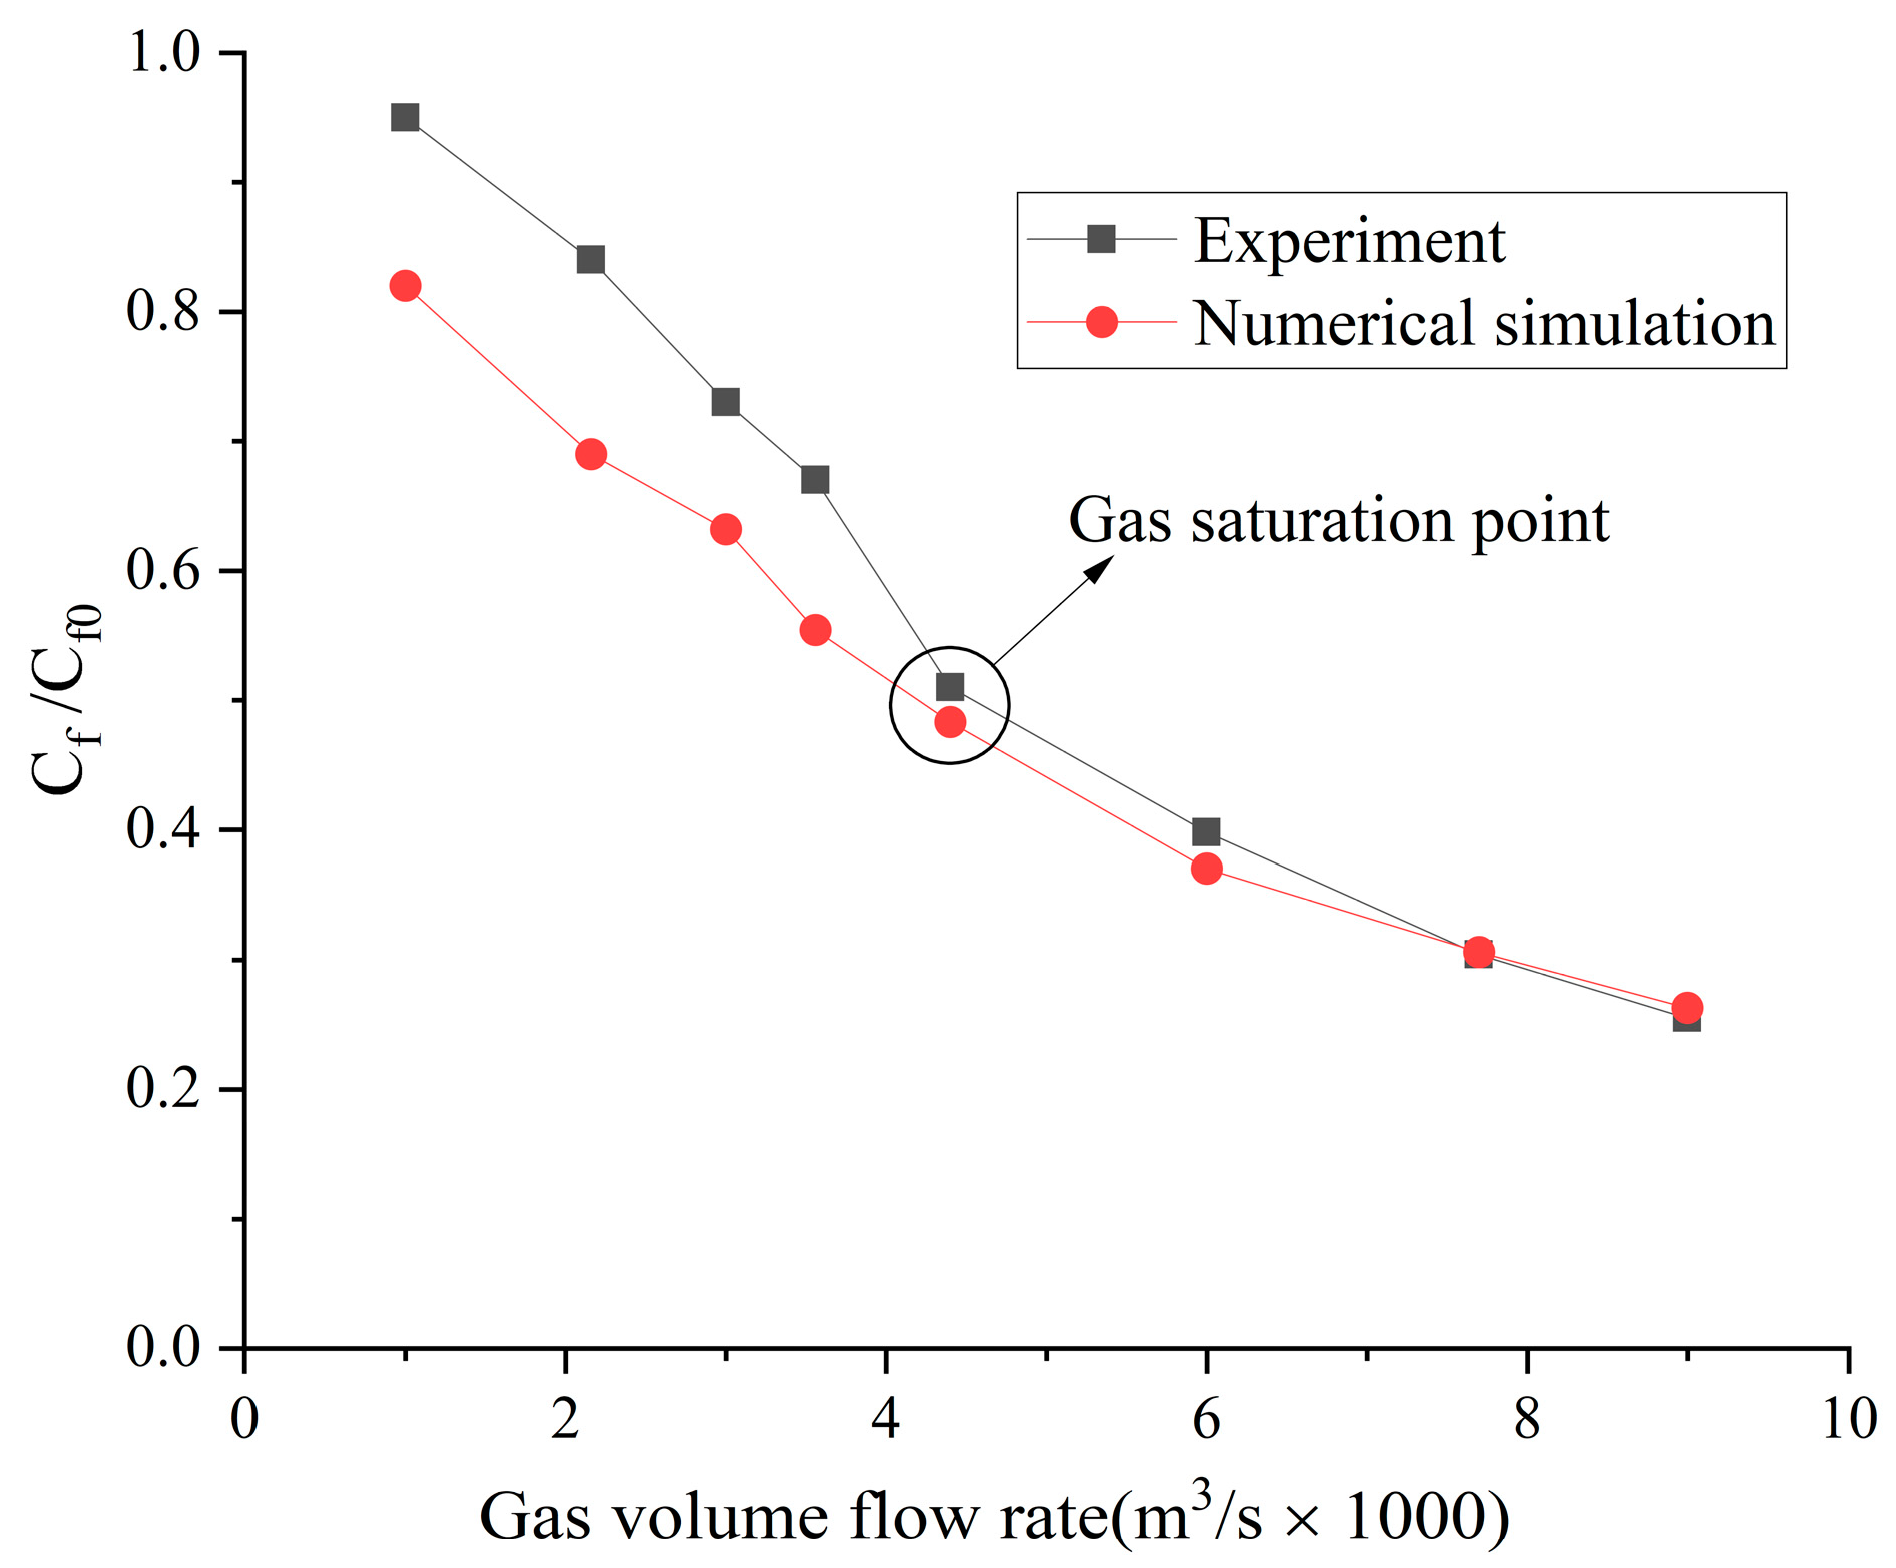
- When the volume flow rate of the gas injection is small, the experimental data of the drag reduction ratio is obviously larger than the numerical simulation results, and for different types of gases, their drag reduction ratio decreases at different rates. This is mainly due to the fact that the opening holes ratio in the numerical simulation is larger than that in the experiment. In the case of the same volume flow rate for gas injection, the gas injection speed of simulation is different from that of the experiment due to the difference of the opening holes rate. According to the microbubble drag reduction mechanism, the drag reduction ratio is mainly affected by the diameters of the microbubbles in the boundary layer, which are determined by the gas injection speed [40], and the gas dissolution in the boundary layer further increases this influence. Finally, there is a big gap between the simulation results and the experimental data of the drag reduction ratio;
- (2)
- With the increase in the volume flow rate of gas injection, when the volume flow rate reaches a certain value, the value of the drag reduction ratio in the experiment is very close to the numerical simulation result, and this close point is marked in the figure, which is defined as the gas saturation point. The existence of the gas saturation point indicates that the gas injection velocity no longer influences the diameters of the microbubbles in the boundary layer. Observing Figure 7, Figure 8, Figure 9 and Figure 10, it can be seen that there are gas saturation points for different types of gases, but these points correspond to different volume flow rates. Observing the volume flow rate of the gas saturation point, it can be seen that helium is about 0.004 m3/s, air and argon are about 0.005 m3/s, argon is slightly larger than air and carbon dioxide is about 0.006 m3/s. The reason why the volume flow rate of these gas saturation points is different is that among these gases, helium has the smallest solubility in water and the smallest influence on the formation of microbubbles in the boundary layer. Therefore, the saturation point of helium corresponds to a smaller gas injection flow rate. Air is more soluble than helium, and argon is slightly more soluble than air. The solubility of carbon dioxide is the largest, which also has the largest influence on the formation of microbubbles in the boundary layer, so the gas saturation point of carbon dioxide corresponds to a larger gas injection flow rate;
- (3)
- As can be seen from Figure 7, Figure 8, Figure 9 and Figure 10, where the gas saturation point is passed, if the volume flow rate of gas injection continues to increase, the numerical simulation results of the drag reduction ratio of all gases are basically consistent with the experimental data. This is because the gas injection speed and dissolution in the boundary layer no longer affect the diameters of microbubbles in the boundary layer, and the drag reduction ratio completely depends on the volume flow rate of the gas injection. Under the condition that the volume flow rate is the same, the numerical results are basically the same as the experimental data;
- (4)
- As can be seen from Figure 11, Figure 12 and Figure 13, the comparison between the simulation results and the experimental data of MBDR of different types of gases after the water tunnel pressure increases is consistent with Figure 7, Figure 8, Figure 9 and Figure 10. The volume flow rate of different types of gas injection still has a gas saturation point, but the volume flow rate corresponding to the gas saturation point increases after the water tunnel pressure increases. In addition, by comparing Figure 7 with Figure 11, Figure 8 with Figure 12 and Figure 9 with Figure 13, it can be seen that the solubility of different types of gases in water is also greatly affected by the water tunnel pressure. Carbon dioxide has the largest solubility, so its gas saturation point corresponds to the largest change in volume flow rate, followed by air, with helium being the smallest. The comparison between the simulation results and the experimental data is in accordance with the law of gas solubility variation with water pressure, which proves the correctness of the numerical model.
5. Conclusions
- (1)
- Gas solubility cannot be ignored in the process of MBDR. The drag reduction ratio of gas with greater solubility decreases more slowly, and the drag reduction efficiency of gas with smaller solubility is higher;
- (2)
- When the volume flow rate of injected gas is small, gas dissolution has a great influence on the drag reduction ratio of different types of gases. The larger the solubility of gas, the larger the drag reduction ratio and the lower the drag reduction efficiency. When the volume flow rate of injected gas is large, the influence of gas dissolution on drag reduction ratio of different types of gases is small;
- (3)
- When the volume flow rate of the injected gas is small, for the same type of gas, if the volume flow rate of the injected gas is the same, but the injection speed is different, the drag reduction ratio is also different, and the greater the solubility of the gas, the greater the difference in the drag reduction ratio.
Author Contributions
Funding
Data Availability Statement
Conflicts of Interest
Nomenclature
| Area of the gas–liquid interface | |
| Breakup rate at which the bubbles of volume break into the bubbles of volume | |
| Coalescence rate of bubbles with volumes and | |
| Bubble coalescence rate | |
| Drag coefficient | |
| Lift coefficient | |
| Virtual mass force coefficient | |
| Bubble diameter | |
| Liquid phase diffusion coefficient | |
| Diffusion coefficient of the qth component in the fluid | |
| Henry coefficient | |
| Drag force | |
| Lift | |
| Virtual mass force | |
| Surface tension | |
| Bubble breakage rate | |
| Turbulent kinetic energy caused by buoyancy | |
| Turbulent kinetic energy caused by mean velocity gradient | |
| Diffusion flux of the qth component in the fluid | |
| Gas–liquid interface mass transfer coefficient | |
| Mass transfer from the pth phase to the qth phase | |
| Molar mass of the qth phase | |
| Number density of bubbles | |
| Equilibrium pressure of the solute in the gas phase | |
| Probability that a collision will result in a convergence | |
| Bubble Reynolds number | |
| Interaction force between phases | |
| Source term of the coalescence and breakup of bubble groups | |
| Turbulence Schmidt number | |
| Mass transfer rate generated by the qth phase from any source | |
| Representative bubble velocity | |
| Collision characteristic velocity of two bubbles with diameters and and densities and | |
| Inter-phase velocity | |
| Velocity of the qth phase | |
| Bubble slip velocity | |
| Actual molar fraction of the solute in the liquid phase | |
| Molar fraction of the solute at equilibrium in the liquid phase | |
| Influence of turbulent pulsating flow on the total dissipation rate | |
| Concentration of the qth component in the fluid | |
| Gas phase volume fraction of the qth phase | |
| Probability density function of the bubble of volume breaking into the bubble of volume | |
| Number of sub-bubbles of volume | |
| Vortex dissipation in liquid phase | |
| Surface curvature | |
| Bulk viscosity of the qth phase | |
| Turbulent viscosity | |
| Represents the liquid viscosity | |
| Shear viscosity of the qth phase | |
| Turbulence viscosity coefficient | |
| Average volume density | |
| Density of the qth phase | |
| Turbulent Prandtl numbers of the turbulent kinetic energy | |
| Turbulent Prandtl numbers the dissipation rate | |
| Tension coefficient between the qth phase and the pth phase | |
| Stress tensor of the qth phase | |
| Gas content | |
| Collision frequency |
References
- Pavlov, G.A.; Yun, L.; Bliault, A.; He, S.L. Air Lubricated and Air Cavity Ships: Development, Design, and Application; Springer: New York, NY, USA, 2020; p. 28. [Google Scholar]
- Elbing, B.R.; Winkel, E.S.; Lay, K.A.; Ceccio, S.L.; Dowling, D.R.; Perlin, M. Bubble-induced skin-friction drag reduction and the abrupt transition to air-layer drag reduction. J. Fluid Mech. 2008, 612, 201–236. [Google Scholar] [CrossRef]
- An, H.; Pan, H.; Yang, P. Research Progress of Air Lubrication Drag Reduction Technology for Ships. Fluids 2022, 7, 319. [Google Scholar] [CrossRef]
- McCormick, M.E.; Bhattacharyya, R. Drag Reduction of a Submersible Hull by Electrolysis. Nav. Eng. J. 1973, 85, 11–16. [Google Scholar] [CrossRef]
- Pal, S.; Deutsch, S.; Merkle, C.L. A comparison of shear stress fluctuation statistics between microbubble modified and polymer modified turbulent boundary layers. Phys. Fluids A 1989, 1, 1360–1362. [Google Scholar] [CrossRef]
- Deutsch, S.; Castano, J. Microbubble skin friction reduction on an axisymmetric body. Phys. Fluids 1986, 29, 3590–3597. [Google Scholar] [CrossRef]
- Fontaine, A.A.; Deutsch, S. The influence of the type of gas on the reduction of skin friction drag by microbubble injection. Exp. Fluids 1992, 13, 128–136. [Google Scholar] [CrossRef]
- Deutsch, S.; Money, M.; Fontaine, A.; Petrie, H. Microbubble Drag Reduction in Rough Walled Turbulent Boundary Layers. In Proceedings of the ASME FEDSM’03 4th ASME/JSME Joint Fluids Engineering Conference, Honolulu, HI, USA, 6–10 July 2003; pp. 665–673. [Google Scholar]
- Zhu, R.; Zhang, H.; Wen, W.; He, X.; Zhao, C.; Liu, Y.; Zhuang, Q.; Liu, Z. Flow-drag reduction performance of a resident electrolytic microbubble array and its mechanisms. Ocean Eng. 2023, 268, 113496. [Google Scholar] [CrossRef]
- Skudarnov, P.V.; Lin, C.X. Drag reduction by gas injection into turbulent boundary layer: Density ratio effect. J. Heat Fluid Flow 2006, 27, 436–444. [Google Scholar] [CrossRef]
- Mattson, M.; Mahesh, K. Simulation of bubble migration in a turbulent boundary layer. Phys. Fluids 2011, 23, 045107. [Google Scholar] [CrossRef]
- Pang, M.J.; Wei, J.J.; Yu, B. Numerical study on modulation of microbubbles on turbulence frictional drag in a horizontal channel. Ocean Eng. 2014, 81, 58–68. [Google Scholar] [CrossRef]
- Rawat, S.; Chouippe, A.; Zamansky, R.; Legendre, D.; Climent, E. Drag modulation in turbulent boundary layers subject to different bubble injection strategies. Comput. Fluids 2019, 178, 73–87. [Google Scholar] [CrossRef]
- Velasco, L.J.; Venturi, D.N.; Fontes, D.H.; de Souza, F.J. Numerical simulation of drag reduction by microbubbles in a vertical channel. Eur. J. Mech. B-Fluid 2022, 92, 215–225. [Google Scholar] [CrossRef]
- Mohanarangam, K.; Cheung, S.C.P.; Tu, J.Y.; Chen, L. Numerical simulation of micro-bubble drag reduction using population balance model. Ocean Eng. 2009, 36, 863–872. [Google Scholar] [CrossRef]
- Yan, W. Numerical Simulation of Microbubble Drag Reduction and Mechanism Analysis. Master’s Thesis, Harbin Engineering University, Harbin, China, 2013. (In Chinese). [Google Scholar]
- Pang, M.; Zhang, Z. Numerical Investigation on Turbulence Drag Reduction by Small Bubbles in Horizontal Channel with Mixture Model Combined with Population Balance Model. Ocean Eng. 2018, 162, 80–97. [Google Scholar] [CrossRef]
- Qin, S.; Chu, N.; Yao, Y.; Liu, J.; Huang, B.; Wu, D. Stream-wise distribution of skin-friction drag reduction on a flat plate with bubble injection. Phys. Fluids 2017, 29, 037103. [Google Scholar] [CrossRef]
- Zhang, X.; Wang, J.; Wan, D. Euler–Lagrange study of bubble breakup and coalescence in a turbulent boundary layer for bubble drag reduction. Phys. Fluids 2021, 33, 037105. [Google Scholar] [CrossRef]
- Lyu, X.; Tang, H.; Sun, J.; Wu, X.; Chen, X. Simulation of microbubble resistance reduction on a suboff model. Brodogradnja 2014, 65, 23–32. [Google Scholar]
- Wang, T.; Sun, T.; Wang, C.; Xu, C.; Wei, Y. Large Eddy Simulation of Microbubble Drag Reduction in Fully Developed Turbulent Boundary Layers. J. Mar. Sci. Eng. 2020, 8, 524. [Google Scholar] [CrossRef]
- Zhao, X.-J.; Zong, Z.; Jiang, Y.-C.; Pan, Y. Numerical simulation of micro-bubble drag reduction of an axisymmetric body using OpenFOAM. J. Hydrodyn. 2019, 31, 900–910. [Google Scholar] [CrossRef]
- Wang, B. Numerical Simulation and Mechanism Research on Drag Reduction of Ship by Microbubbles. Master’s Thesis, Harbin Engineering University, Harbin, China, 2012. (In Chinese). [Google Scholar]
- Shih, T.-H.; Liou, W.W.; Shabbir, A.; Yang, Z.; Zhu, J. A new k-ε eddy viscosity model for high reynolds number turbulent flows. Comput. Fluids 1995, 24, 227–238. [Google Scholar] [CrossRef]
- Schiller, L.; Naumann, A. A drag coefficient correlation. Z. Ver. Deutsch. Ing. 1935, 77, 318–320. [Google Scholar]
- Drew, D.A.; Lahey, R.T. Application of general constitutive principles to the derivation of multidimensional two-phase flow equations. Int. J. Multiph. Flow 1979, 5, 243–264. [Google Scholar] [CrossRef]
- Legendre, D.; Magnaudet, J. The lift force on a spherical bubble in a viscous linear shear flow. J. Fluid Mech. 1998, 368, 81–126. [Google Scholar] [CrossRef]
- Magnaudet, J.J. The forces acting on bubbles and rigid particles. In Proceedings of the ASME Fluids Engineering Division Summer Meeting, FEDSM, Vancouver, BC, Canada, 22–26 June 1997; pp. 22–26. [Google Scholar]
- Yeoh, G.H.; Tu, J. Computational Techniques for Multi-Phase Flows; Elsevier Butterworth Heinemann; Elsevier Ltd.: London, UK, 2010; pp. 351–456. [Google Scholar]
- Luo, H. Coalescence, Breakup and Liquid Circulation in Bubble Column Reactors. Ph.D. Thesis, Norwegian Institute of Technology, Trondheim, Norway, 1993. [Google Scholar]
- Laakkonen, M.; Alopaeus, V.; Aittamaa, J. Validation of bubble breakage, coalescence and mass transfer models for gas–liquid dispersion in agitated vessel. Chem. Sci. 2006, 61, 218–228. [Google Scholar] [CrossRef]
- Sander, R. Compilation of Henry’s law constants (version 5.0.0) for water as solvent. Atmos. Chem. Phys. 2023, 23, 10901–12440. [Google Scholar] [CrossRef]
- Resnick, W.; Gal-Or, B. Gas-liquid dispersions. Adv. Chem. Eng. 1968, 7, 295–395. [Google Scholar]
- Higbie, R. The rate of absorption of a pure gas into a still liquid during short periods of exposure. Trans. Am. Inst. Chem. Eng. 1935, 31, 365–389. [Google Scholar]
- Danckwerts, P.V. Significance of Liquid-Film Coefficients in Gas Absorption. Ind. Eng. Chem. Res. 1951, 43, 1460–1467. [Google Scholar] [CrossRef]
- Balcázar-Arciniega, N.; Antepara, O.; Rigola, J.; Oliva, A. A level-set model for mass transfer in bubbly flows. Int. J. Heat Mass Transf. 2019, 138, 335–356. [Google Scholar] [CrossRef]
- Macfarlan, L.H.; Phan, M.T.; Bruce Eldridge, R. A volume-of-fluid methodology for interfacial mass transfer. Chem. Eng. Sci. 2023, 275, 118720. [Google Scholar] [CrossRef]
- Li, W.-L.; Wang, J.-H.; Lu, Y.-C.; Shao, L.; Chu, G.-W.; Xiang, Y. CFD analysis of CO2 absorption in a microporous tube-in-tube microchannel reactor with a novel gas-liquid mass transfer model. Int. J. Heat Mass Transf. 2020, 150, 119389. [Google Scholar] [CrossRef]
- The Engineering ToolBox. Gases Solved in Water—Diffusion Coefficients. 2008. Available online: https://www.engineeringtoolbox.com/diffusion-coefficients-d_1404.html (accessed on 13 December 2023).
- Hashim, A.; Yaakob, O.B.; Koh, K.K.; Ismail, N.; Ahmed, Y.M. Review of micro-bubble ship resistance reduction methods and the mechanisms that affect the skin friction on drag reduction from 1999 to2015. J. Teknol. 2015, 74, 105–114. [Google Scholar]
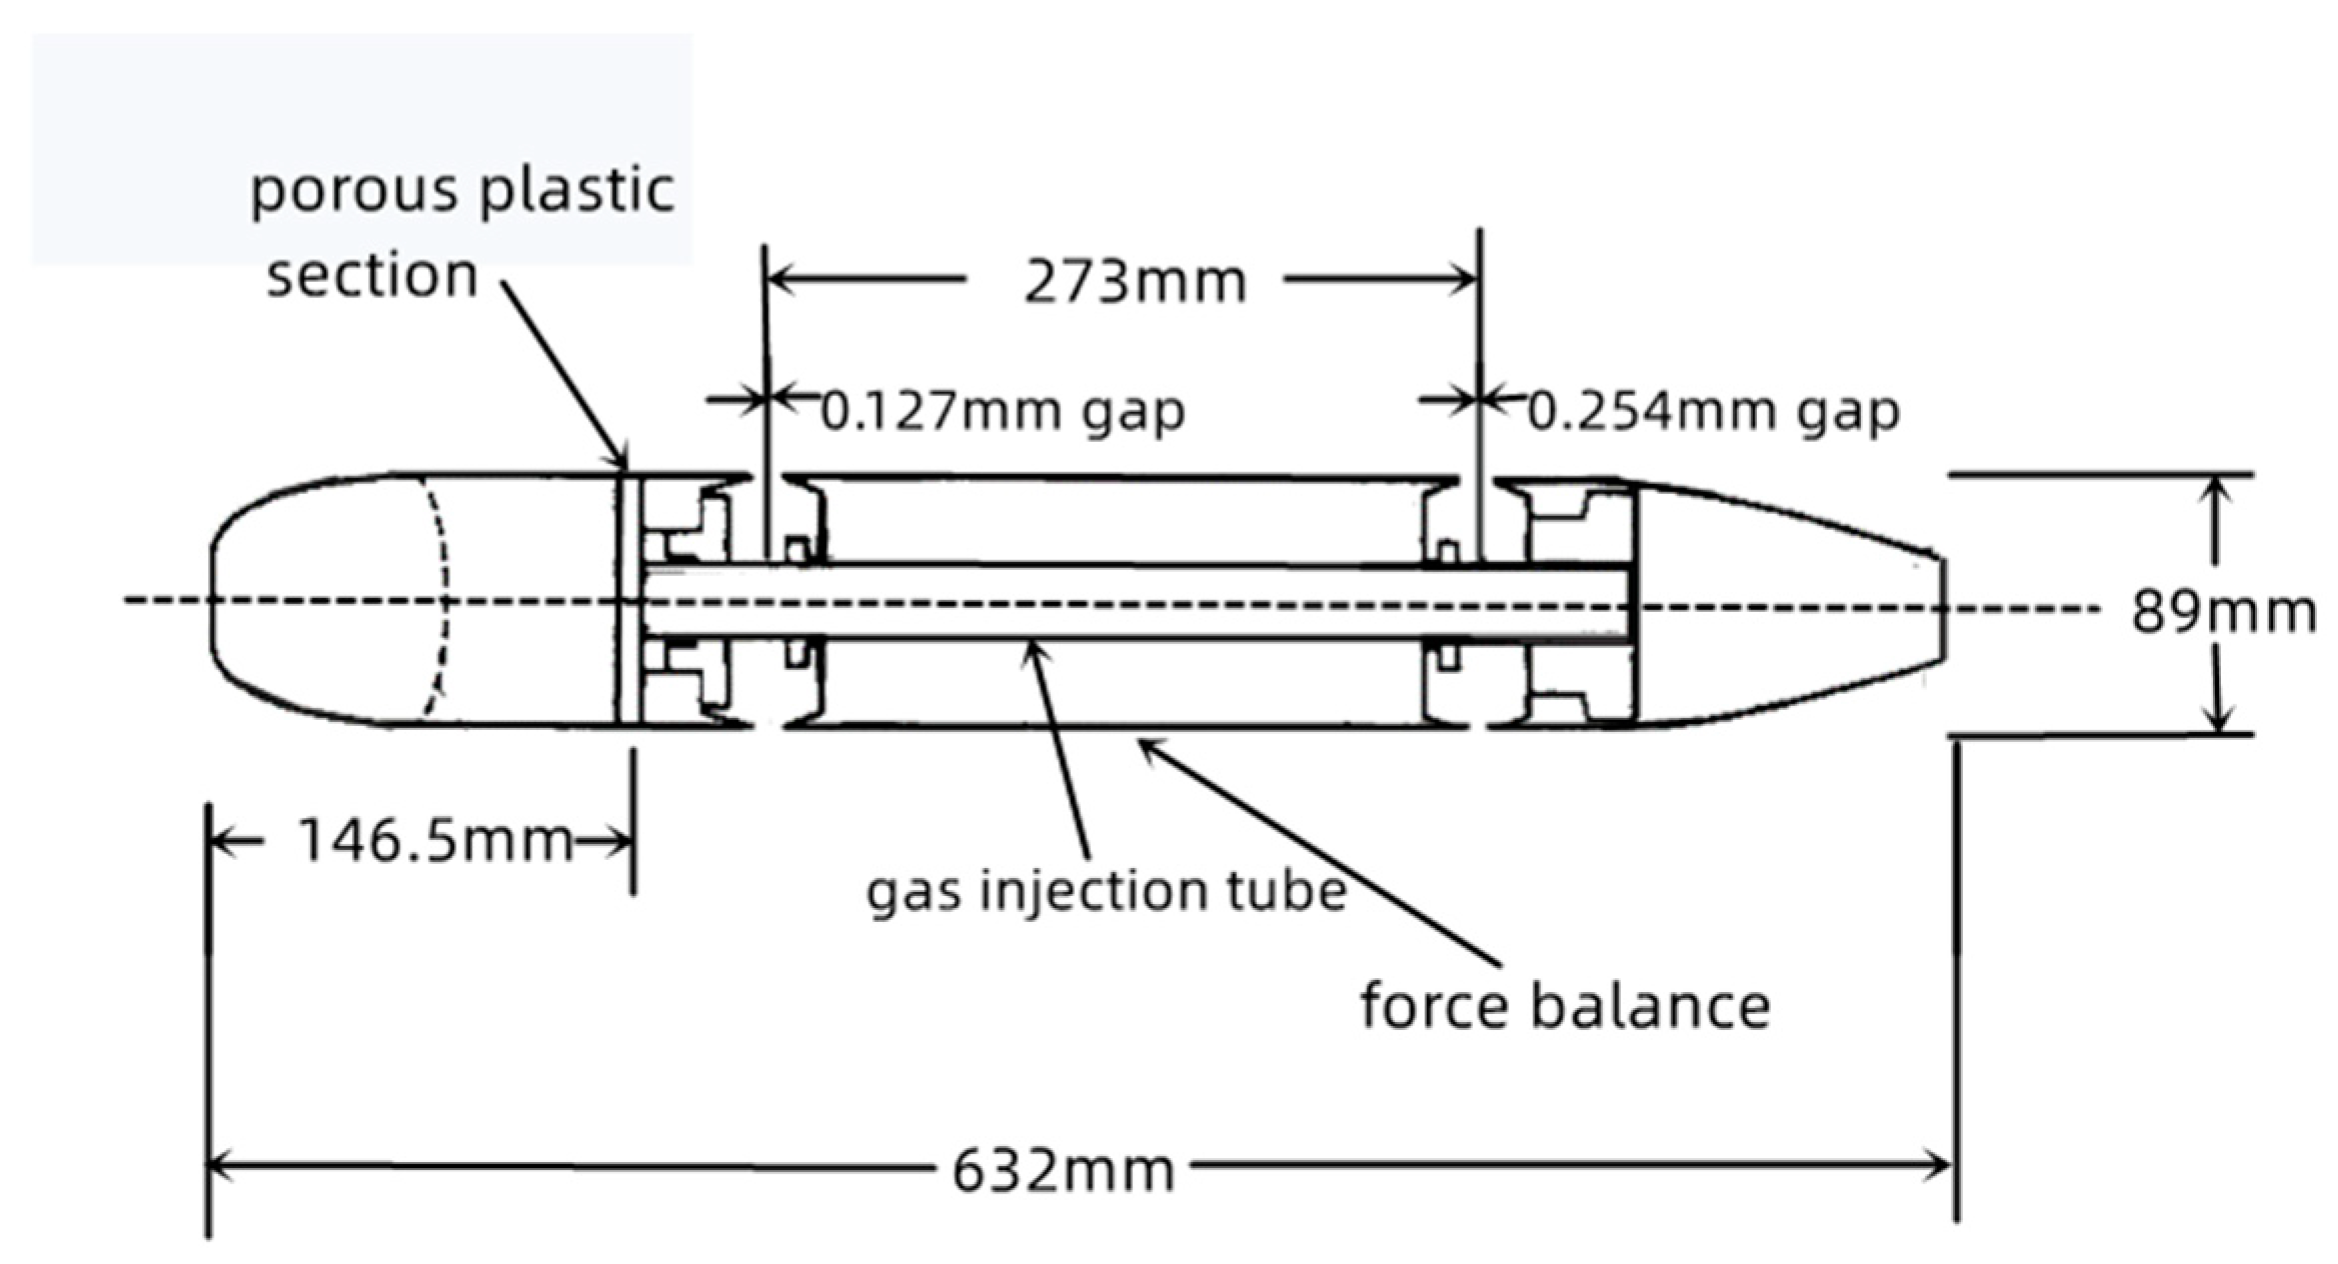
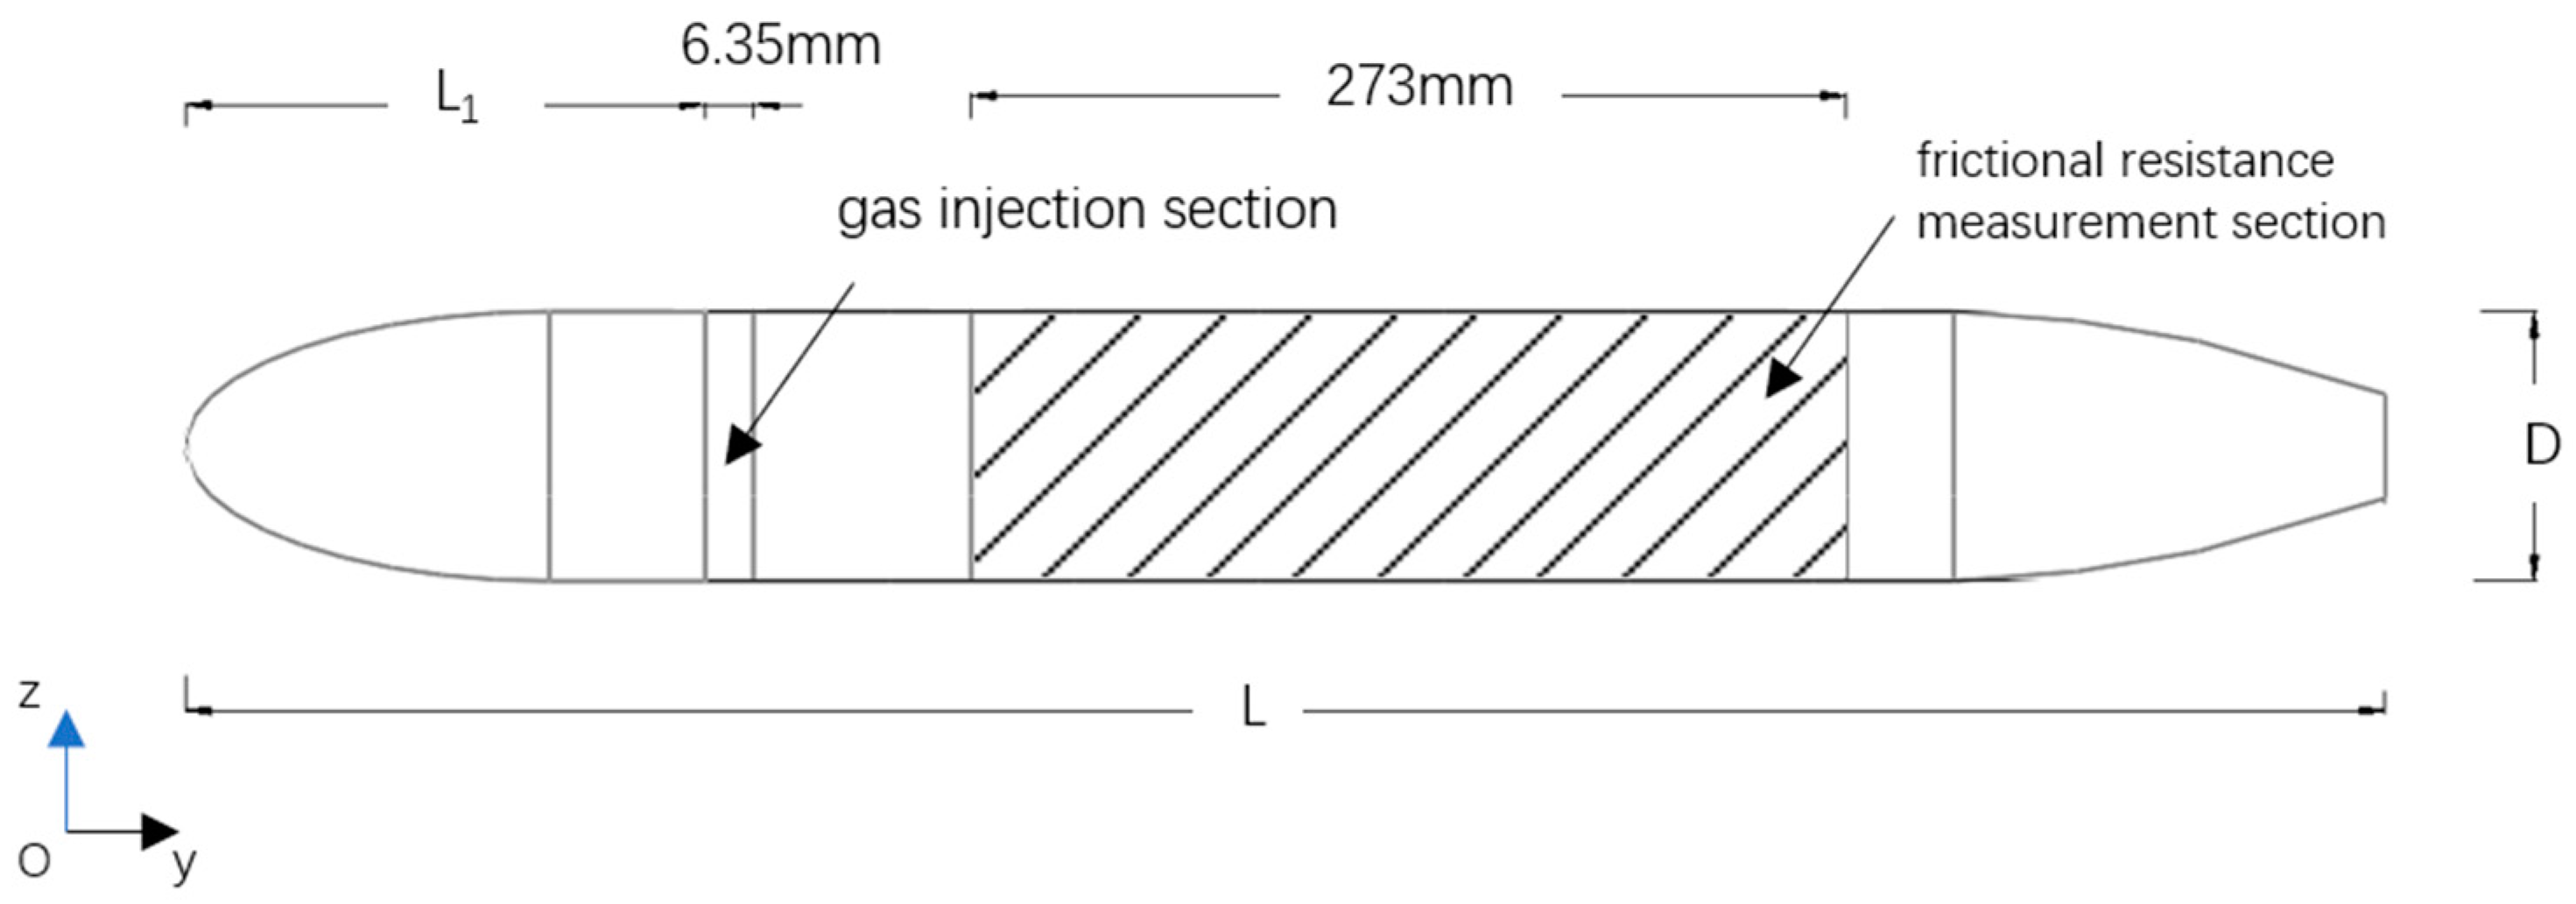
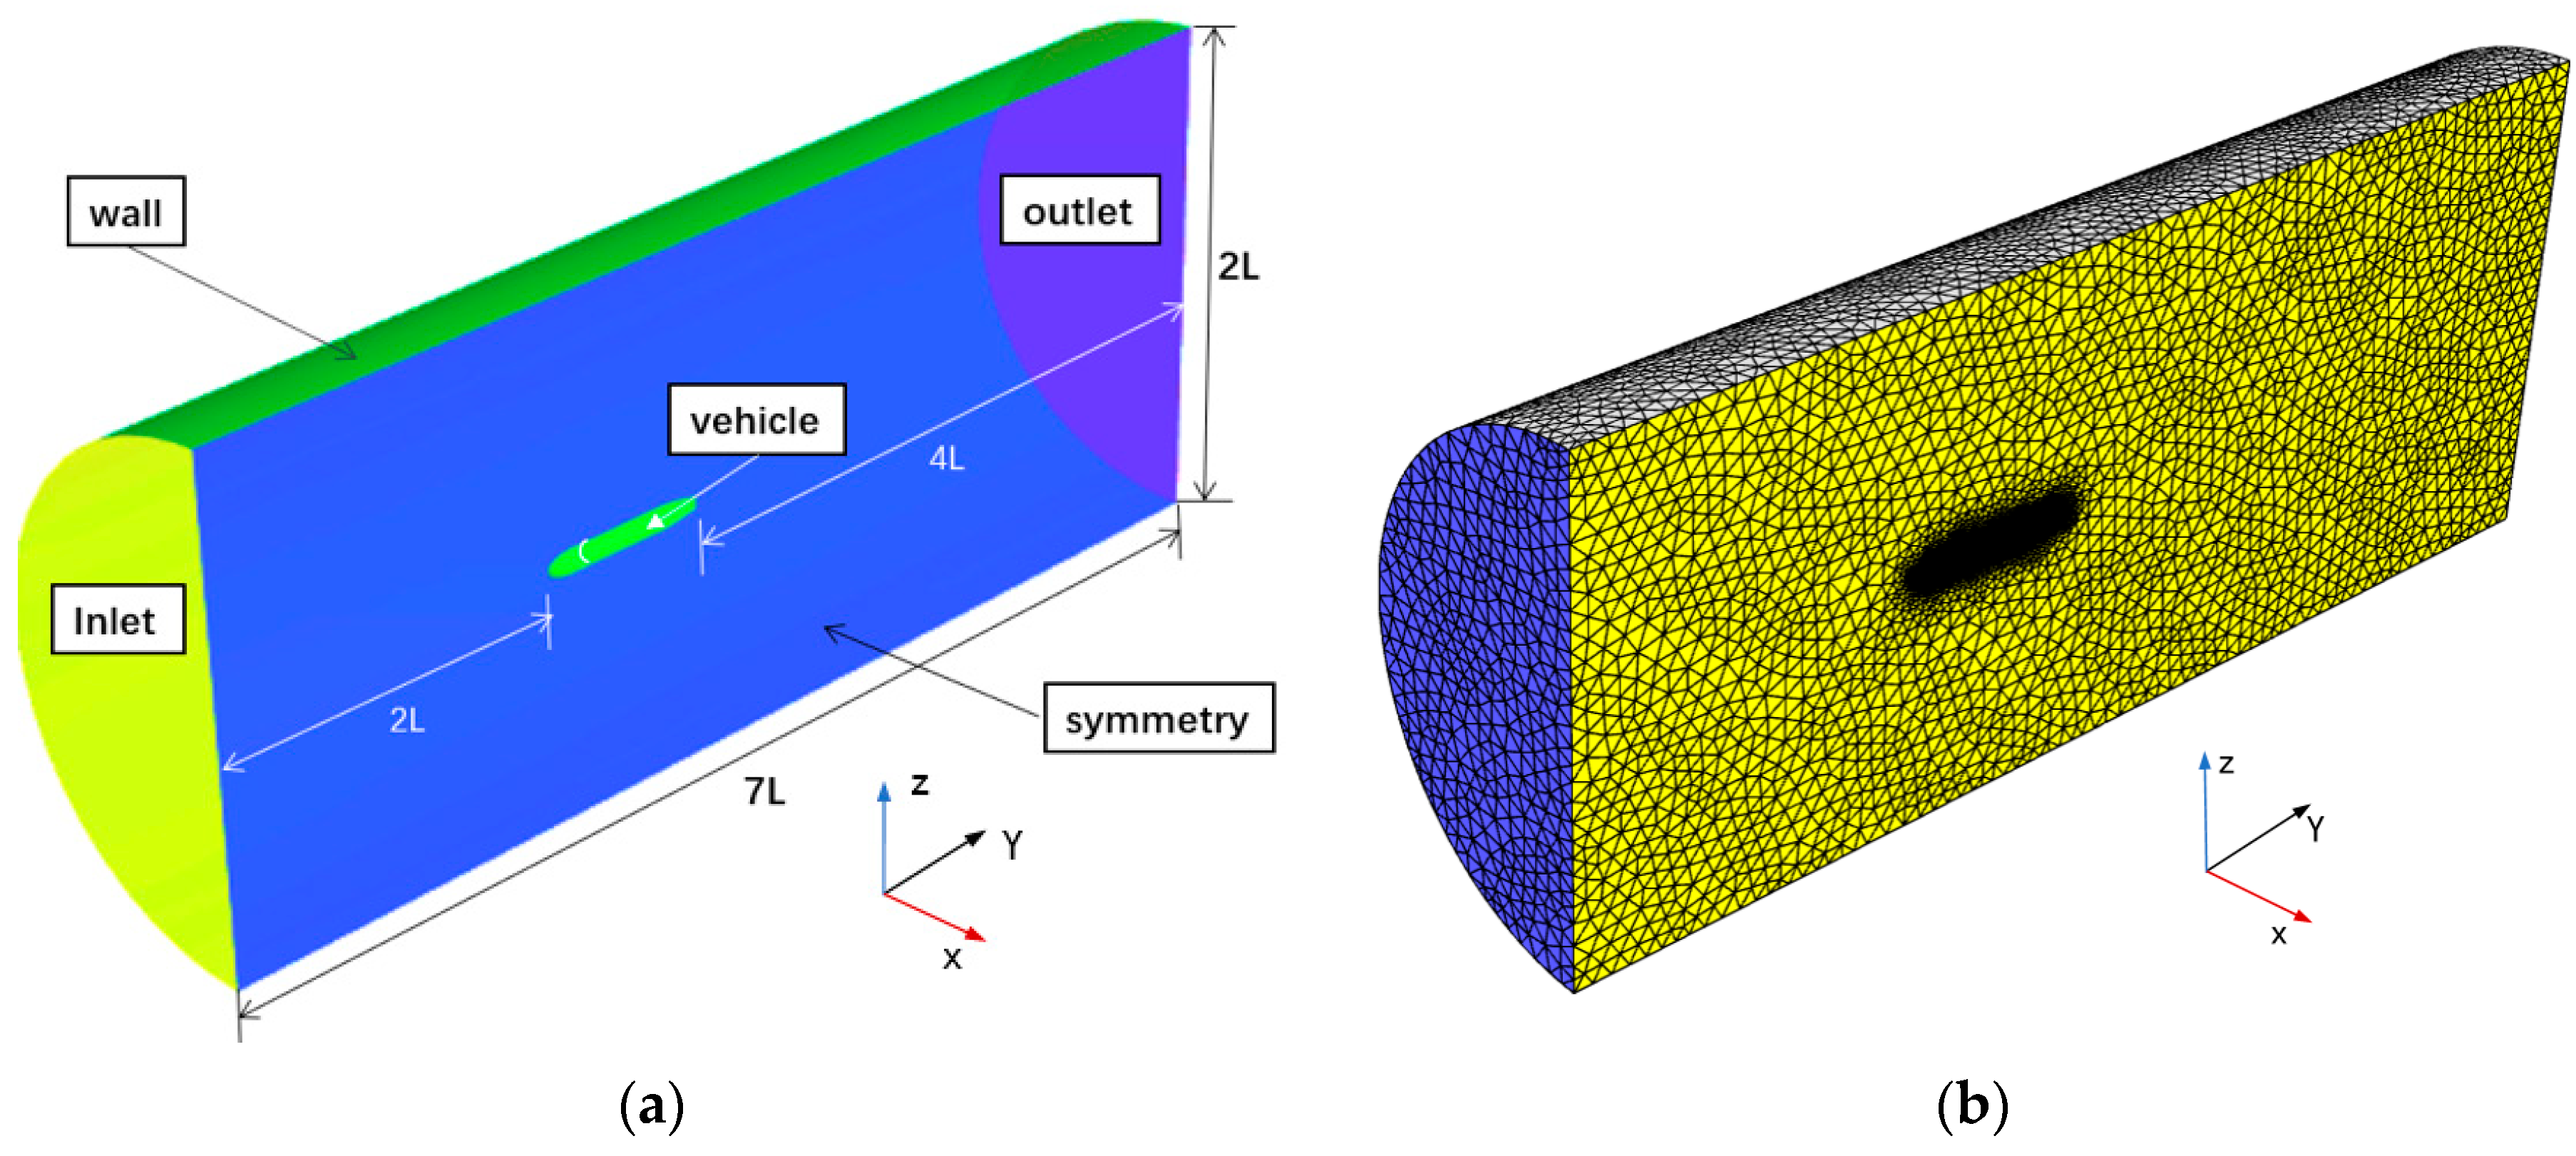



| Model Length L (mm) | Diameter of the Model D (mm) | Location of Gas Injection L1 (mm) |
|---|---|---|
| 632 | 89 | 146.5 |
| Gases | ) |
|---|---|
| helium | 2.839 × 10⁵ |
| air | 1.359 × 10⁵ |
| carbon dioxide | 3.09 × 10² |
| argon | 7.14 × 10³ |
| Gases | Diffusivity Coefficient |
|---|---|
| helium | 4.8 × 10⁻⁹ |
| air | 3.23 × 10⁻⁹ |
| carbon dioxide | 1.99 × 10⁻⁹ |
| argon | 2.5 × 10⁻⁹ |
| Parameters | Values |
|---|---|
| Inlet Velocity | 13.7 m/s |
| Temperature | 20 °C |
| Density of Water | 998 kg/m3 |
| Viscosity of Water | 1.003 × 10⁻³ kg/m |
| Inlet Pressure (Gauge) | 0 Pa |
| Outlet Pressure (Gauge) | 0 Pa |
| Tunnel Pressure | 15 psi, 30 psi |
| Mesh Generation | Grid Size (mm) | Number of Grids (million) | Time Step (ms) | Courant | Drag Reduction Rate (%) |
|---|---|---|---|---|---|
| Fine grid | 0.8 | 3.5 | 0.06 | 1 | 83.73 |
| Medium Grid | 1.3 | 1.8 | 0.10 | 1 | 84.61 |
| Coarse grid | 2.1 | 1.2 | 0.16 | 1 | 86.87 |
| Gases | Tunnel Pressure (psi) | Free-Stream Speed (m/s) | Gas Volume Flow Rate (m3/s × 103) |
|---|---|---|---|
| air | 15 | 13.7 | 1, 2, 3, 4, 5, 6, 7, 8. |
| carbon dioxide | 15 | 13.7 | 1.2, 2, 3, 4, 5, 6, 7, 8, 9. |
| helium | 15 | 13.7 | 1, 2, 2.7, 3.2, 4, 4.6. |
| argon | 15 | 13.7 | 1.8, 3.2, 4, 5.2, 6.2. |
| Gases | Tunnel Pressure (psi) | Free-Stream Speed (m/s) | Gas Volume Flow Rate (m3/s × 103) |
|---|---|---|---|
| air | 30 | 13.7 | 0.73, 1.5, 2, 3, 4, 5.2, 6.7, 8, 9.1, 12.5. |
| carbon dioxide | 30 | 13.7 | 0.88, 2, 3, 3.9, 4.9, 6.5, 8.4, 9.6, 12. |
| helium | 30 | 13.7 | 1, 2.2, 3, 3.6, 4.4, 6, 7.7, 9. |
Disclaimer/Publisher’s Note: The statements, opinions and data contained in all publications are solely those of the individual author(s) and contributor(s) and not of MDPI and/or the editor(s). MDPI and/or the editor(s) disclaim responsibility for any injury to people or property resulting from any ideas, methods, instructions or products referred to in the content. |
© 2024 by the authors. Licensee MDPI, Basel, Switzerland. This article is an open access article distributed under the terms and conditions of the Creative Commons Attribution (CC BY) license (https://creativecommons.org/licenses/by/4.0/).
Share and Cite
An, H.; Yang, P.; Zhang, H.; Liu, X. Numerical Study of the Influence of the Type of Gas on Drag Reduction by Microbubble Injection. Inventions 2024, 9, 7. https://doi.org/10.3390/inventions9010007
An H, Yang P, Zhang H, Liu X. Numerical Study of the Influence of the Type of Gas on Drag Reduction by Microbubble Injection. Inventions. 2024; 9(1):7. https://doi.org/10.3390/inventions9010007
Chicago/Turabian StyleAn, Hai, Po Yang, Hanyu Zhang, and Xinquan Liu. 2024. "Numerical Study of the Influence of the Type of Gas on Drag Reduction by Microbubble Injection" Inventions 9, no. 1: 7. https://doi.org/10.3390/inventions9010007
APA StyleAn, H., Yang, P., Zhang, H., & Liu, X. (2024). Numerical Study of the Influence of the Type of Gas on Drag Reduction by Microbubble Injection. Inventions, 9(1), 7. https://doi.org/10.3390/inventions9010007


