Abstract
The current scenario of radioactive waste management requires innovative and automated solutions to ensure its effectiveness and safety. In response to this need, the Proximity Imaging System for Sort and Segregate Operations (PI3SO) project was proposed. It is a gamma radiation proximity scanner system for radioactive waste with the primary goal of speeding up some aspects of the waste management cycle while reducing direct human operations. The system will provide proximity imaging for hot-spot finding and spectral analysis for radiological characterization, enabling semiautomatic recognition, sorting and separation of radioactive waste. The core of the proposed scanning system consists of an array of 128 CsI(Tl) scintillators, 1 cm3 size, coupled with silicon photomultipliers (SiPMs), installed on a motorized bridge sliding along a suitable table in order to scan the materials under investigation.
1. Introduction
Nuclear power has played a significant role in global energy production for decades. However, along with the benefits come significant challenges, one of which is the management of radioactive waste from power plants still in operation or under decommissioning. This waste is the inevitable by-product of the nuclear fuel cycle and nuclear power generation, as well as of any activity that makes use of radioactive material. In the current energy landscape, the issue of radioactive waste has become a topic of great interest, with particular attention directed toward its (re)conditioning [1]. Reducing the quantity of harmful radioactive waste and recovering previously classified nuclear material that can be used again are the two main goals of reconditioning. Efficient nuclear waste management is a key part of the mission to decommission and dismantle nuclear power plants, as the amount of waste generated by decommissioning activities is substantial and continues to grow [2,3]. Currently, much of nuclear waste management relies on human operators wearing personal protective equipment, such as gloves or air-fed suits, to manually dismantle equipment, or on remotely controlled robots to cut waste [4,5,6,7]. This approach is labor-intensive and poses significant safety and health risks to operators, as they must operate in close proximity to the waste or rely on cameras to see what they are doing. Additionally, the skills and understanding needed on the part of operators represent a large part of the present operational decisions. The big amount of existing nuclear waste and that expected from future decommissioning processes pose a major challenge to the nuclear decommissioning program. Reducing the costs and accelerating the implementation of decommissioning plans require innovative solutions that allow waste to be moved more quickly and efficiently, while keeping detailed records and ensuring the traceability of all operations and decisions made in the nuclear waste management process [8]. Monitoring and tracking every step of the process is crucial to ensure regulatory compliance, transparency and accountability in dealing with nuclear waste. A key aspect of possible innovative solutions is the focus on operator safety, with a strong effort made to minimize direct human involvement in waste management activities by making the best use of available technology [9]. This approach not only improves the safety and well-being of the operators but also reduces the risk of human error in waste identification and classification, especially in such challenging nuclear-related environments [10].
Decommissioning radioactive facilities produces different categories of radwaste, and its amount depends on the timing of the dismantling operations. Postponing it may reduce the amounts of Intermediate-Level Waste (ILW) and Low-Level Waste (LLW) while increasing the amounts of Very-Low-Level Waste (VLLW) that can be cleared from regulatory control [11,12]. In order to rehabilitate nuclear sites in a safe and economical manner that respects people and the environment, the steps to be considered involve first of all the sorting and segregation of radioactive waste. Proximity Imaging System for Sort and Segregate Operations (PI3SO) focuses on the (re)analysis of VLLW, LLW and ILW that represent the vast majority of the radwaste, packaged into special drums and placed into near-surface disposals [13].
In a context where radioactive materials are already locked up in drums, there is a need for new technologies in order to sort and process them properly. These radioactive wastes usually include gamma emitters of different activities. Gamma identification is very important for managing radioactive waste because if radioactive waste is not properly managed, it can release penetrating gamma radiation that is harmful to both the environment and human health. To maintain safety and regulatory compliance, it is imperative to identify and closely monitor these gamma emissions. Instruments called gamma sensors are used to identify and quantify the gamma radiation that radioactive waste emits. Because of the sensitivity and accuracy of these sensors, operators can closely monitor gamma emissions and take appropriate safety precautions. To enhance radioactive waste management, more focus is being placed on innovation and on the creation of gamma sensors that are more sophisticated and dependable. Furthermore, gamma imaging technology is a significant smart and innovative field for radioactive waste management research and development. With the use of gamma imaging, gamma radiation sources within waste can be seen and mapped, yielding precise data on the location and amount of radioactive materials [14,15,16,17]. This technology is useful for developing more efficient waste management methods as well as for spotting possible leaks or contamination.
It is based on these assumptions that the PI3SO project, the object of this paper, was conceived. The proposed tool is a system that can locate gamma-emitting objects with high sensitivity and produce a corresponding image. Furthermore, the identification of radioactive isotopes is made possible by PI3SO’s capability to conduct gamma spectroscopy. On the basis of these features, PI3SO can be defined as a spectroscopic gamma radiation scanner/imager system suitable for the quick semi-automatic sorting and segregation of low- and intermediate-level radioactive waste. This operation is typically required for the decommissioning of nuclear power plants, the packaging of radwaste and the reconditioning of old radwaste in order to remove exempt waste from still activated materials in the storage sites. Furthermore, an easy-to-handle automatic system can strongly reduce the need for human operators close to activated materials, according to the As Low As Reasonably Achievable (ALARA) criterion [18,19] (which means avoiding exposure to radiation that does not have a direct benefit, even if the dose is small). Indeed, the three main basic protective measures in radiation safety, namely time, distance, and shielding, are likely fulfilled by the proposed tool.
Similar systems have been proposed recently, mainly focused on high-resolution spectroscopy and thus relying on germanium detectors [6,7]. However, despite featuring superior radioisotope identification, such a system has poor spacial resolution because of the detector size, which has to be large (1″–2″). Moreover, the cost of a germanium detector and the related electronics is rather high; therefore, one makes use of a single detector moved on top of the objects under examination, and this makes this kind of system rather expensive and slow [7]. The much longer scan duration conflicts with the requirement of rapid results, essential when in need of (re)conditioning a large number of radioactive waste packages.
The approach followed in PI3SO is to make use of many small and inexpensive scintillators, with moderate spectroscopic features, to increase the granularity and hence the spatial resolution. As filling a wide area with many detectors would become expensive and complex as well, a trade-off solution was chosen with the use of detectors arranged in a linear array that can slide in one direction to cover the total active area to be scanned. The net advantages of such a solution are speed, lower cost and good spatial resolution, albeit at the price of a worse energy resolution: while the energy resolution worsens from a few per mille to a few percent, the cost decreases by roughly one order of magnitude as well as the typical scan duration.
The strength of the scanning system lies in its versatility and ability as a convenient and affordable solution for the mapping and measurement of radioactivity. The prospect of successfully operating in a wide range of contexts, and to quickly provide reasonably accurate results, could make PI3SO a powerful ally in the monitoring and management of radioactive waste. Moreover, it might be intriguing to consider other possible applications this tool could offer in light of its versatility, which could reveal new perspectives and opportunities for study and applications. In the following sections, a detailed description of the main features of the PI3SO system will be provided, followed by a few illustrative test results.
2. Materials and Methods
The implementation of the PI3SO system aims at two main objectives: to provide proximity images, essential for recognizing radioactive objects, and to offer spectroscopic information in order to investigate the isotopic composition of gamma-emitting hot-spots by combining technological innovation and operational advantages.
2.1. The Mechanical Scanning System
The system features a thin and robust table made of a carbon fiber plate, supported by an aluminum frame and reinforced from below by three additional thin aluminum beams, on which the radwaste under investigation has to be placed. The overall dimensions of the PI3SO prototype tabletop are 120 × 80 cm2. In order to cover the whole effective area with 1 cm2 cross-section detectors, one would need several thousand elements, which would be overly expensive and unrealistic. Indeed, this solution might sound effective but it would require unsustainable costs for the detectors and the electronics, as well as complex procedures for maintenance and handling. To overcome this challenge, the implementation of an array of small detectors in a linear geometry, sliding along the table to cover the sensitive area, sounded a more realistic solution. This strategy ensures complete scanning of the sensitive area with a dramatic cost reduction at the price of increasing the scanning time. A mechanical sliding bridge is implemented, which supports two linear arrays of 64 medium energy resolution gamma-ray detectors, each one of 1 × 1 × 1 cm3 size. The two arrays are placed over and beneath the table, with the bridge sliding forward/backward along the horizontal direction to span the length of the table (Figure 1), with an effective scanning area of 108 × 64 cm2.
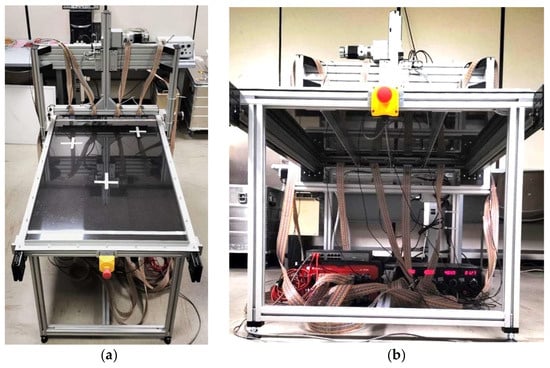
Figure 1.
(a) Top and (b) bottom views of the PI3SO gamma-ray scanner table. Here, 4 + 4 ribbon cables for the signals from the 128 detectors are visible, along with the data acquisition and power supply electronics installed under the table.
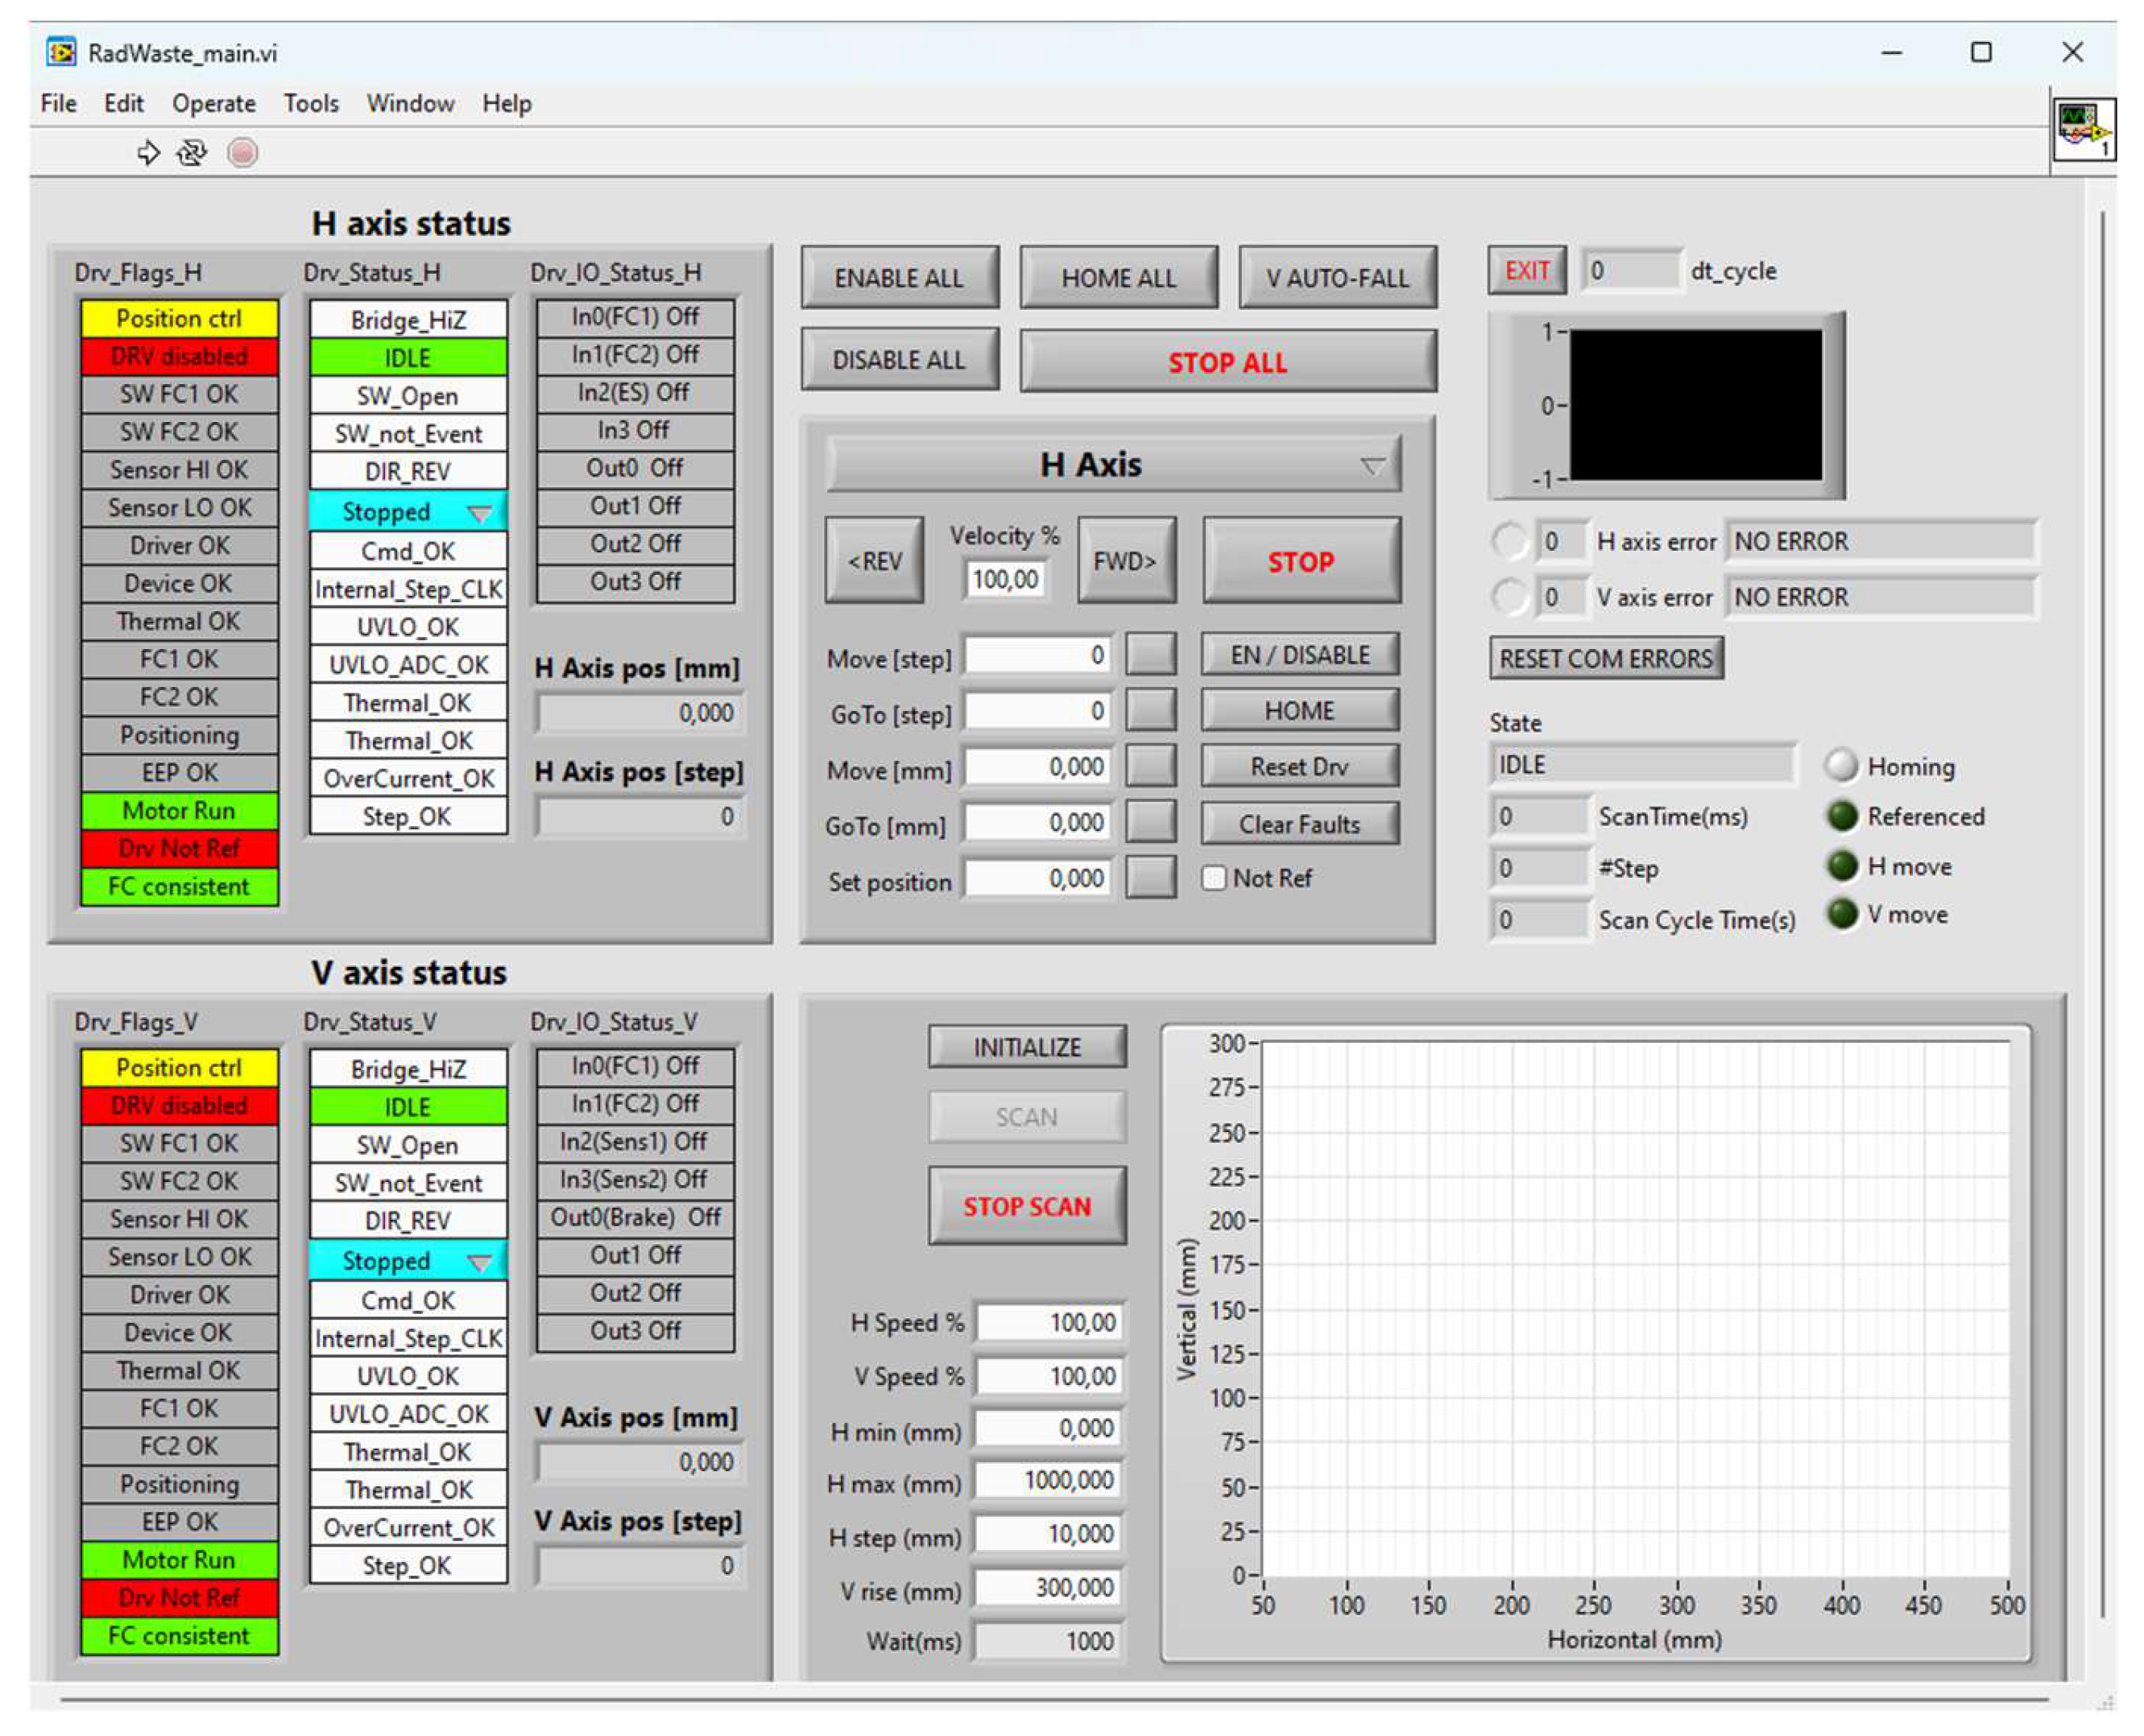
The table was designed and built to our specifications by a local company, which provided a general purpose software tool, a set of software primitives and a driver in order to enable us to develop (and maintain) our own application according to the required scanning sequences. The general purpose tool (Figure 2) was employed for all the tests described in this paper, while a dedicated software application that fully integrates the mechanical motion, data acquisition and display is currently being developed.
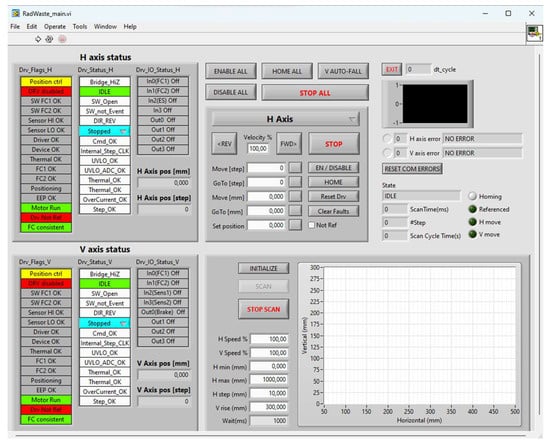
Figure 2.
Screenshot of the control panel of the general purpose tool for the mechanical motion.
The moving bridge is driven by two belts located at the sides of the table and synchronously propelled by a stepper motor. The upper detector array is installed on the bridge by means of an up/down movable arm, so that the scanning of vertically extended objects up to 30 cm is possible. The speed of both the horizontal (bridge) and vertical (arm) motion can be freely chosen between 0.5 and 54 mm/s.
The two detector arrays can be moved to traverse the table surface, acquiring data according to a freely defined stepping scheme. For instance, one can decide to move the bridge in fixed steps (e.g., 10 mm) with a predefined data acquisition time interval or until a predefined minimum number of counts is reached, according to prescribed statistical parameters. Or else one can opt for a slow continuous scan across the full area or part of it. Once a first quick scan is performed, on the basis of the two count rate data images, one can define a region of interest (ROI) and start a longer spectral measurement on a selected area to (try to) identify the gamma emitters. The sliding bridge is also equipped with an optical proximity sensor, which prevents collisions with prominent objects on the table, and the software has the capability of lifting the vertical arm until the possible collision condition is removed and the scan can continue.
The capability to provide double view proximity images, which is made possible by the top and bottom linear arrays operating simultaneously, is an essential feature of this linear scanner system, making the visual data more functional. Additionally, a camera mounted above the system takes images in visible light that, when compared with gamma images, provide a comprehensive view that is helpful for identifying objects while pinpointing radioactive hot-spots. For a more in-depth analysis, the scan duration can also be increased to help detect very-low-activity hot-spots and/or filter specific isotopes by selecting their gamma energy peaks and facilitating the creation of additional spectroscopic pictures.
The decision to employ the double scanner array was not made at random: with the aim of providing a more complete observation of the gamma-emitting objects, we chose the double detection configuration. Indeed, flat objects like flanges or metal plates could exhibit radioactivity on one side only, thus being partially self-shielded, or there could be thick metal plates covering (shielding) radioactive items. The double view imaging should overcome this kind of inconvenience.
2.2. The Detectors
The main guideline of the project was to use well-known materials and properties in order to obtain small, inexpensive, robust, easy-to-use and reliable detectors, avoiding overly sophisticated technologies that would have led to expensive and delicate components. The system relies on count rate measurement, hot-spot finding and gamma spectrometry to locate, identify and characterize radioactive objects scattered on the table, i.e., determine where, what and how much.
In this context, a series of radiation detectors suitable for measuring gamma rays was required. To be suitable for mass deployment, these detectors must be robust, reasonably inexpensive, compact, and reliable. There are a wide variety of devices and techniques on the market, generally of relevant cost and thus unsuitable for fast, cheap and easy-to-handle gamma-ray detection and for mass deployment. One of the most convenient methods adopted for the detection and spectroscopy of gamma radiation is the use of scintillators, i.e., materials that produce so-called scintillation light when hit by radiation. The main features required for a scintillator are as follows:
- Good scintillation efficiency to transform the radiation energy into detectable light.
- Linearity, i.e., the light yield ought to be proportional to the deposited energy over as wide a range as possible.
- The induced luminescence decay time should be short enough to prevent a pile-up.
- The material has to be transparent to the wavelength of its own emission and possess good optical quality and uniformity.
- Its refractive index should preferably be close to that of glass (∼1.5) to ease the optical coupling to photodetectors, which convert the light pulses into electrical ones.
The widespread use of scintillators in radiation detection and spectroscopy comes from their ability to offer a rapid and accurate response to radiation, making them key instruments in a wide range of applications. However, scintillators alone are not sufficient for radiation detection. In fact, this would be impossible without the availability of devices to convert the extremely weak light output of a scintillation pulse into a corresponding electrical signal. In order to do that, photomultipliers are employed. Currently, two types are mainly used: photomultiplier tubes and solid-state photomultipliers. For the purpose of photon detection, in this project the interest focused on silicon photomultipliers (SiPMs) [20,21,22,23]. This device consists of an array of identical, independent photodiode cells of micrometric size with the output terminals connected together. The cells are inversely polarized, slightly above their breakdown voltage, in order to operate in the Geiger regime. In this way, the common output signal is the analog sum of the signals from the independent cells, and the SiPM operates as a quasi-digital photon counter, the characteristic feature of which is the sensitivity to individual photons. Whenever a visible photon interacts, it creates an electron–hole pair in the conduction band; the electron and the hole start moving in the high electric field toward electrodes of opposite polarity. Because of the surge, the electron, whose mobility is higher, may have enough kinetic energy to strike and release other electrons, thus generating an avalanche. To prevent a full breakdown and burning of the device, each cell is inherently protected by a built-in quench resistor that temporarily lowers the effective voltage by turning off the device and effectively stopping avalanches. The number of electrons produced in response to a photon interaction is known as the gain of the SiPM. Therefore, one photon releases one electron, which in turn produces an avalanche of n (i.e., gain) overall electrons corresponding to the charge stored in the cell capacity. The gain, or avalanche multiplication factor, is contingent upon the bias voltage and the signal that is produced is quasi-digital, meaning that it is the result of superimposing several identical signals, one for each triggered cell (either by photons or even by internal noise). Depending on the device size, the SiPM usually has thousands or tens of thousands of cells. The different kinds of SiPMs on the market currently range in size from 1 × 1 mm2 to 6 × 6 mm2.
The choice of the scintillator fell on a 1 × 1 × 1 cm3 inorganic crystal unit made from thallium-doped cesium iodide (CsI(Tl)). It is well known for its high-quality detection properties in terms of the detection efficiency, light yield, and energy resolution at reasonable cost, which represents a convenient option for gamma counting and medium resolution spectroscopy [24,25]. The chosen size is a trade-off between the gamma detection efficiency and the desired position resolution. Table 1 lists the main characteristics of the CsI(Tl) scintillator material.

Table 1.
The main characteristics of the CsI(Tl) scintillator material.
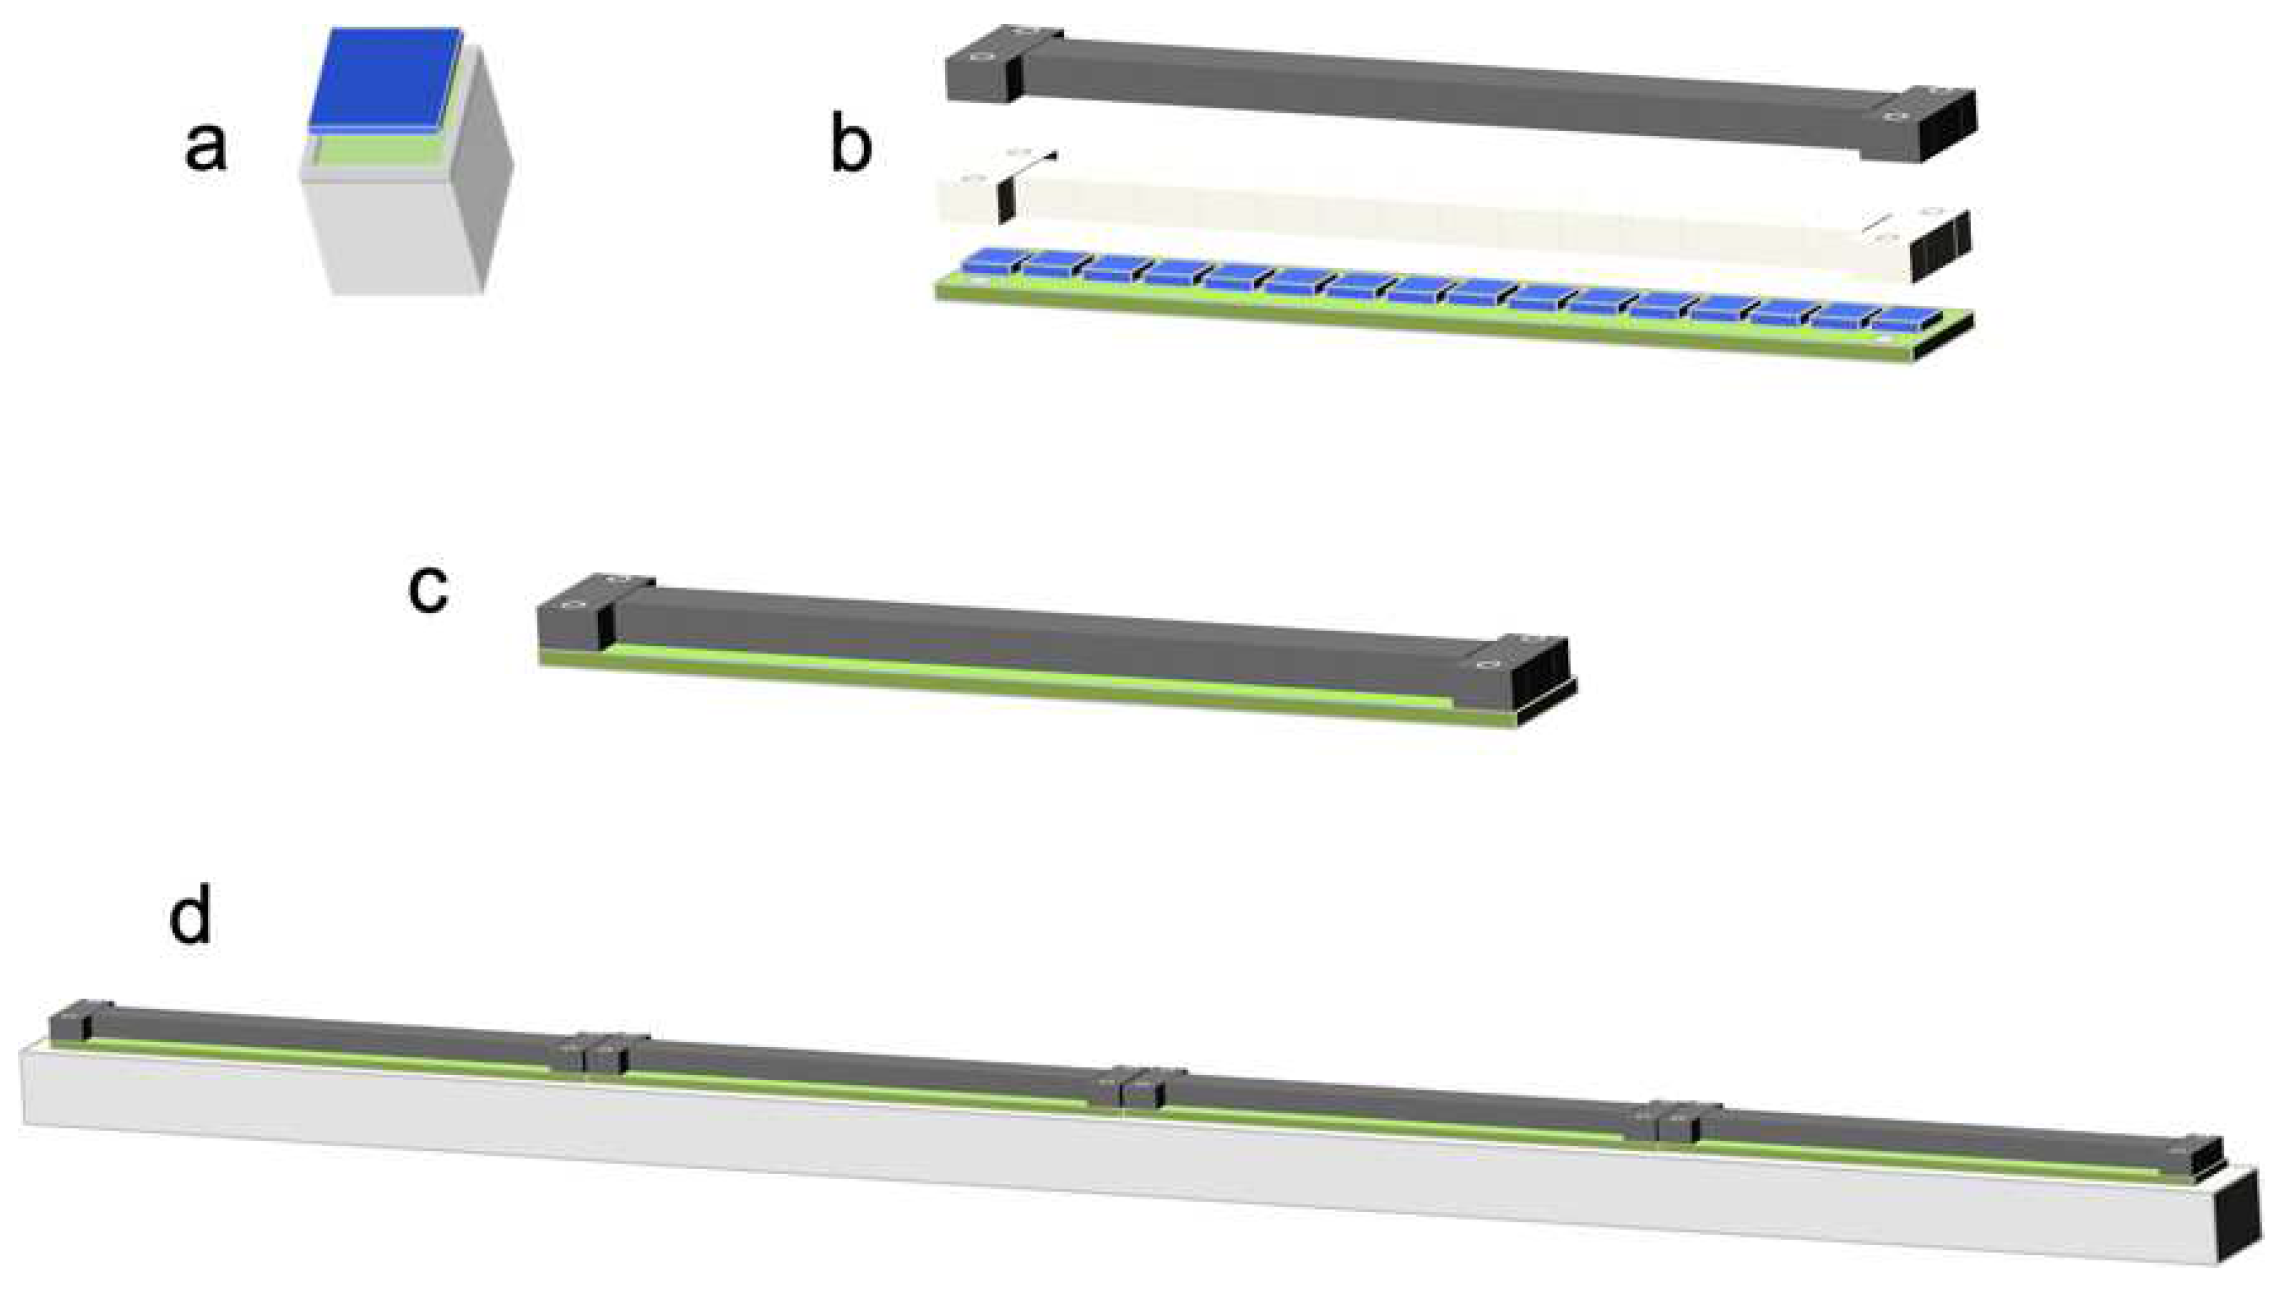
The chosen SiPM was the Multi-Pixel Photon Counter (MPPC) S14160-6050HS produced by Hamamatsu, which has a 6 × 6 mm2 area with 14,331 microcells and basically no dead frame around the active region [26]. Taking advantage of the SiPM features, along with those of the CsI(Tl) scintillating crystal, a full set of gamma-ray detectors was developed to be arranged in the form of two linear arrays for the scanner. The 128 detectors were assembled into groups of 16 for a total of 8 groups. Each group was encapsulated into a matrix made of white reflective resin. Each scintillator crystal was optically coupled via one of its faces to an SiPM by means of a silicone grease with a refractive index n ≈ 1.5. The SiPM response down to single optical photons allows for optimal sensitivity to gamma radiation, particularly when using small scintillators. In order to prevent external light crossing the white resin and blinding the SiPMs, a cover was 3D-printed in black plastic and lined internally with 200 µm thick black tape. A printed circuit board was designed, which hosts sixteen SiPMs along with their simple polarization and readout networks. The bias voltage, unique for all the SiPMs, can be provided via either one of two connectors placed on the board sides. A central dual-in-line 34-pin connector provides the sixteen output signals. The choice of using a single bias voltage for the SiPMs was made in order to simplify the overall system structure and reduce the costs, at the price of having slightly different electronic gain channel by channel. However, having identical gain would not be possible anyhow, even if fine-tuning the individual bias voltages; therefore, a channel by channel energy calibration represents an effective solution. An even stronger simplification at the moment consists of providing only two bias voltages, to the top and the bottom SiPM arrays, respectively. Figure 3 shows a sketch of the detector assembly, Figure 4a a real view of the components of one detector group, and Figure 4b the eight groups assembled and ready to be installed on the sliding bridge.

Figure 3.
(a) Coupling of an SiPM (blue) with the CsI(Tl) crystal (green) surrounded by the reflective resin case (grey). (b) Exploded view of the electronic board hosting 16 SiPMs, the group of 16 scintillators, and the external light shield. (c) Assembled view of one group. (d) Sketch of one linear array made of four groups fixed on a support rod.

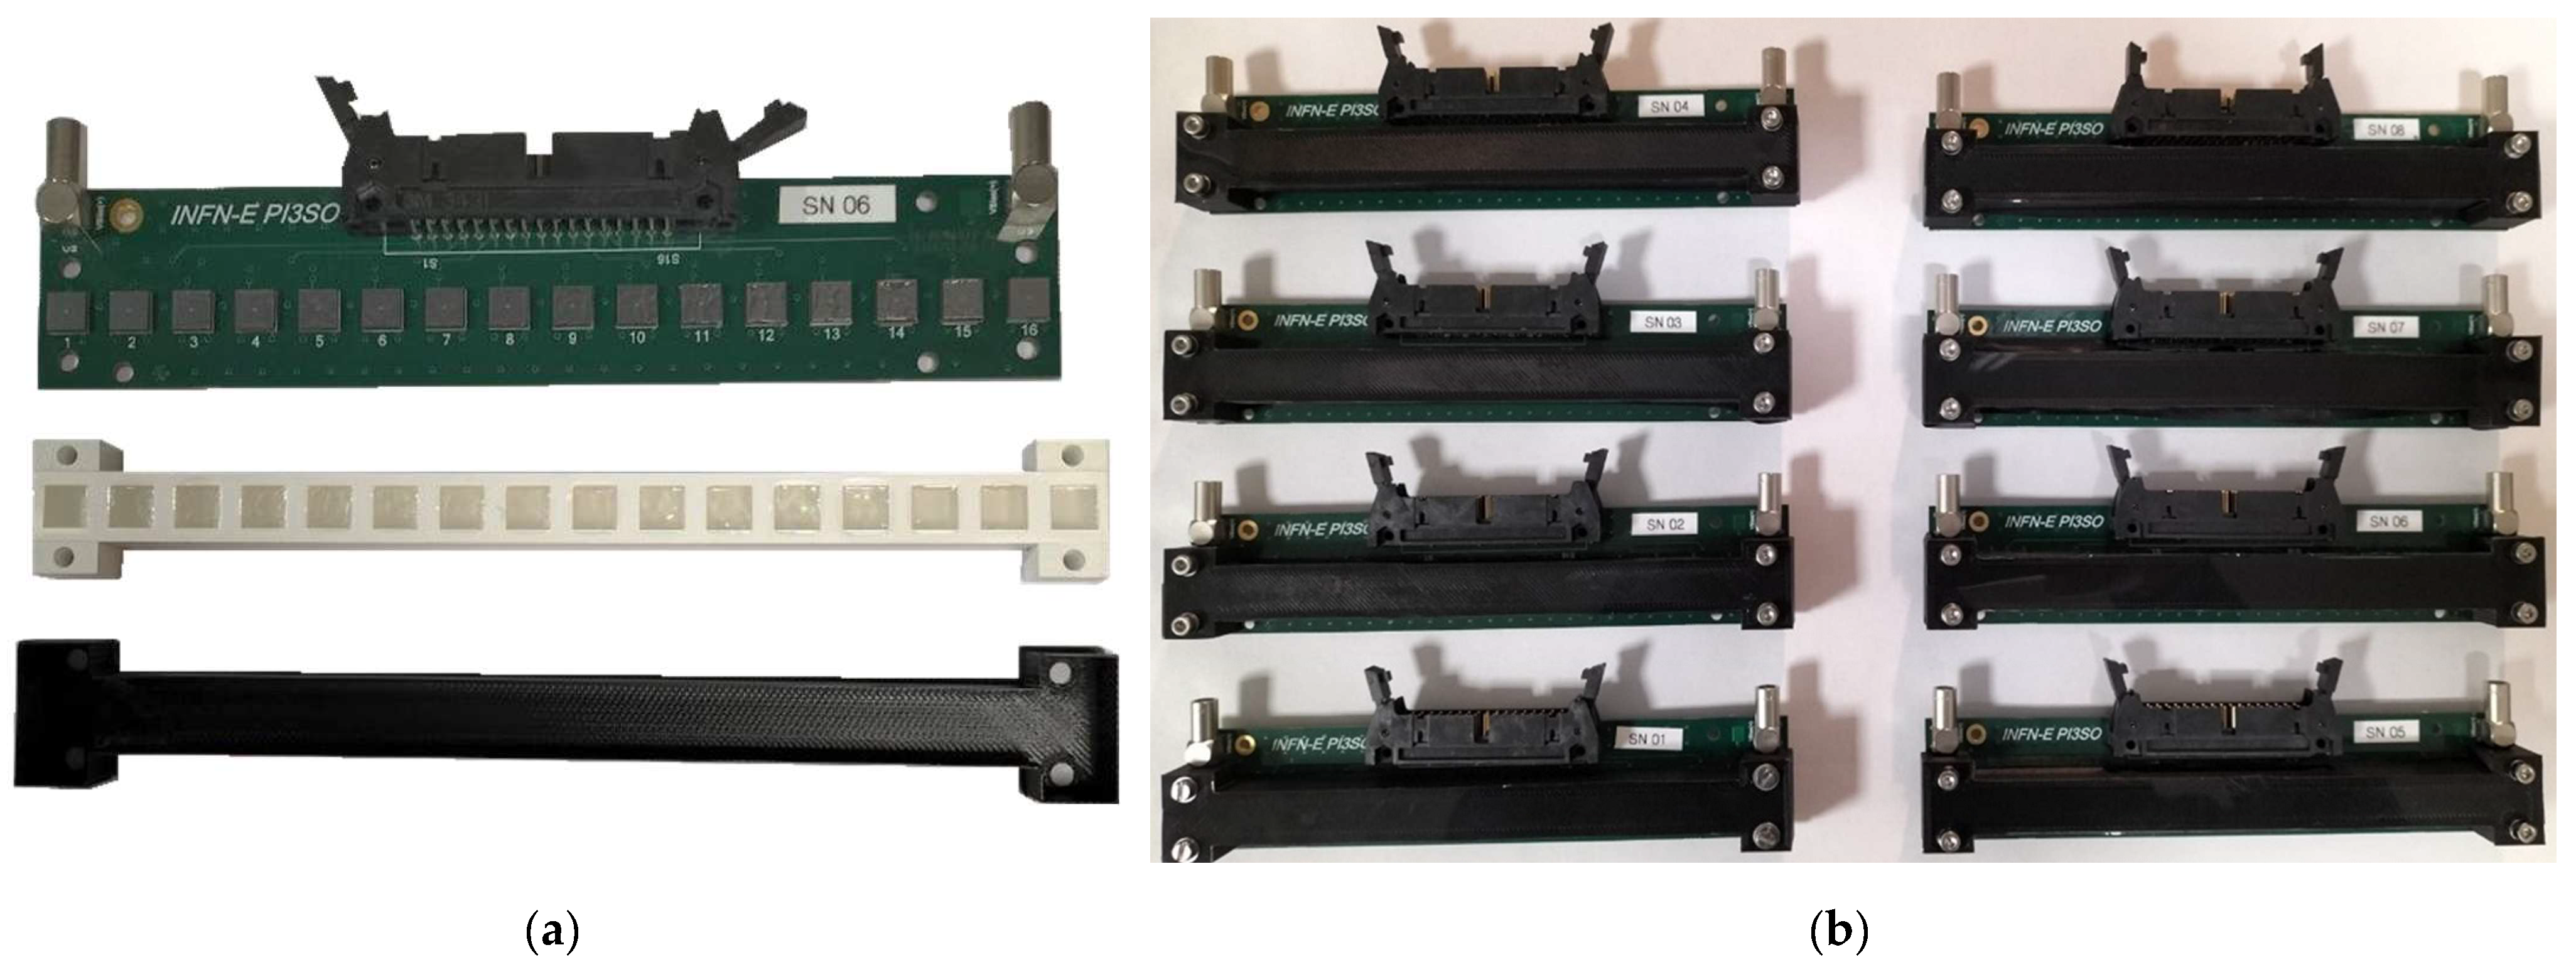
Figure 4.
(a) Real view of the detector group components: the electronic board hosting 16 SiPMs, the 16 scintillators encased in white reflective resin, the black external light shield. (b) The 8 detector groups assembled and ready to be installed on the sliding bridge.
2.3. Data Acquisition Electronics
The front-end and data acquisition are handled by two 64-channel digital signal processors for radiation detectors, namely VX2745 digitizer modules produced by CAEN [27]. This instrument offers excellent performance and is capable of digitizing and recording waveforms if needed, but mainly and more importantly it is capable of performing multichannel analysis for nuclear spectroscopy with many different types of detectors, including scintillation detectors. Each channel digitizes the analog input signal with a 16-bit analog-to-digital converter (ADC) running at 125 MSample/s. The digital pulse-processing sequence is managed by an onboard Field Programmable Gate Array (FPGA) at the firmware level. Depending on the specific configuration and acquisition mode required by the end user, different types of firmware can be loaded into the digitizer. The firmware selected for PI3SO was the charge integration one. The two digitizers are operated in free-running mode, i.e., each channel is self-triggered whenever its input signal overcomes a predefined threshold. On a trigger occurrence, the module integrates the signal charge on the involved channel with a programmable integration gate that at the moment was selected as 20 µs. Several programmable parameters make it possible to take care of the baseline fluctuations and other possible inconveniences, ensuring that only relevant signals are captured and analyzed, thus optimizing the digital results. The data acquisition software employed for the current phase and tests was COMPASS [28]. It will not be the final software for PI3SO, as it does not foresee a way to integrate and synchronize with the mechanical motion of the bridge. A simpler dedicated software package is currently under development to enable the integrated management of the full system, from the scan to the data acquisition and display. All the current data discussed in this paper have been acquired by manual synchronization of the independent software for the scan motion and the data acquisition.
3. Results
3.1. Single Detector Features
Before starting to build PI3SO, a set of preliminary tests had been conducted. The tests involved gamma radiation measurements with detector elements identical to those used in the final system. These tests are described in ref. [24], which concerns a proof of principle square detector array, and in ref. [25], which details how a single detector was installed on a small robotic vehicle for a quick dose rate measurement in the framework of the CLEANDEM EU project [29]. In the latter case, the gamma radiation counting in the environment during the robot motion makes it possible to calculate the dose rate, while the spectroscopic information helps to possibly identify the emitting isotopes.
The SiPM employed for PI3SO is different from the one in refs. [24,25], having a smaller number of microcells (14,331 vs. 18,890) and a higher photon detection efficiency (PDE) at 550 nm (≈35% vs. ≈18%). In light of this, the time behavior of the number of active microcells during the light signal development had to be verified in order to make sure that the SiPM output signal would not undergo linearity loss due to multiple microcell hits or an excessive number of inactive microcells in recharge after being hit.
The time evolution of the number of detected photons was calculated under the (strong) hypotheses of 2 MeV energy deposited into the crystal by a gamma ray and all the scintillation light conveyed onto the SiPM. A time step of 5 ns was used, and the multiple hit probability and the effective number of available microcells at each step were taken into account. The microcell recharge time was assumed to be 92 ns according to ref. [30]. Due to the small number of impinging photons per unit time, the effect of multiple hits and cell recharging was negligible, as can be seen in Figure 5, where the number of expected ideal photon hits (dPh/dt·∆t) is basically indistinguishable from the calculated number of microcells successfully fired. Indeed, the calculation showed that the largest non-linearity is expected to occur ≈100 ns after the beginning of the exponentially decreasing light signal. However, even though at that time the number of operational microcells has decreased from 14,331 to ≈10,400, the number of ideal hits expected during that time step is 197 versus the effectively fired 195 microcells. Finally, by comparing the two integrals over the signal duration, one determines that the loss of linearity due to the finite number of SiPM microcells (multiple hits) and to microcells unavailable during their recharge is less than 0.5%. This, in light of the strong initial assumptions (2 MeV and total light conveyed to SiPM), basically means that the detector does not suffer from non-linearities due to the intrinsic SiPM behavior.
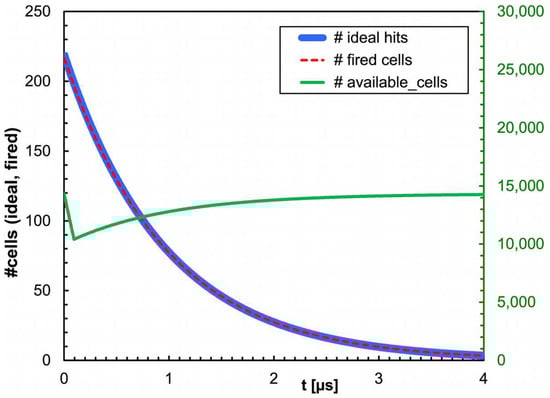
Figure 5.
Calculation of the time evolution of the SiPM response under the assumption of 2 MeV deposited into the crystal and all the scintillation light conveyed onto the SiPM. See the text for details.
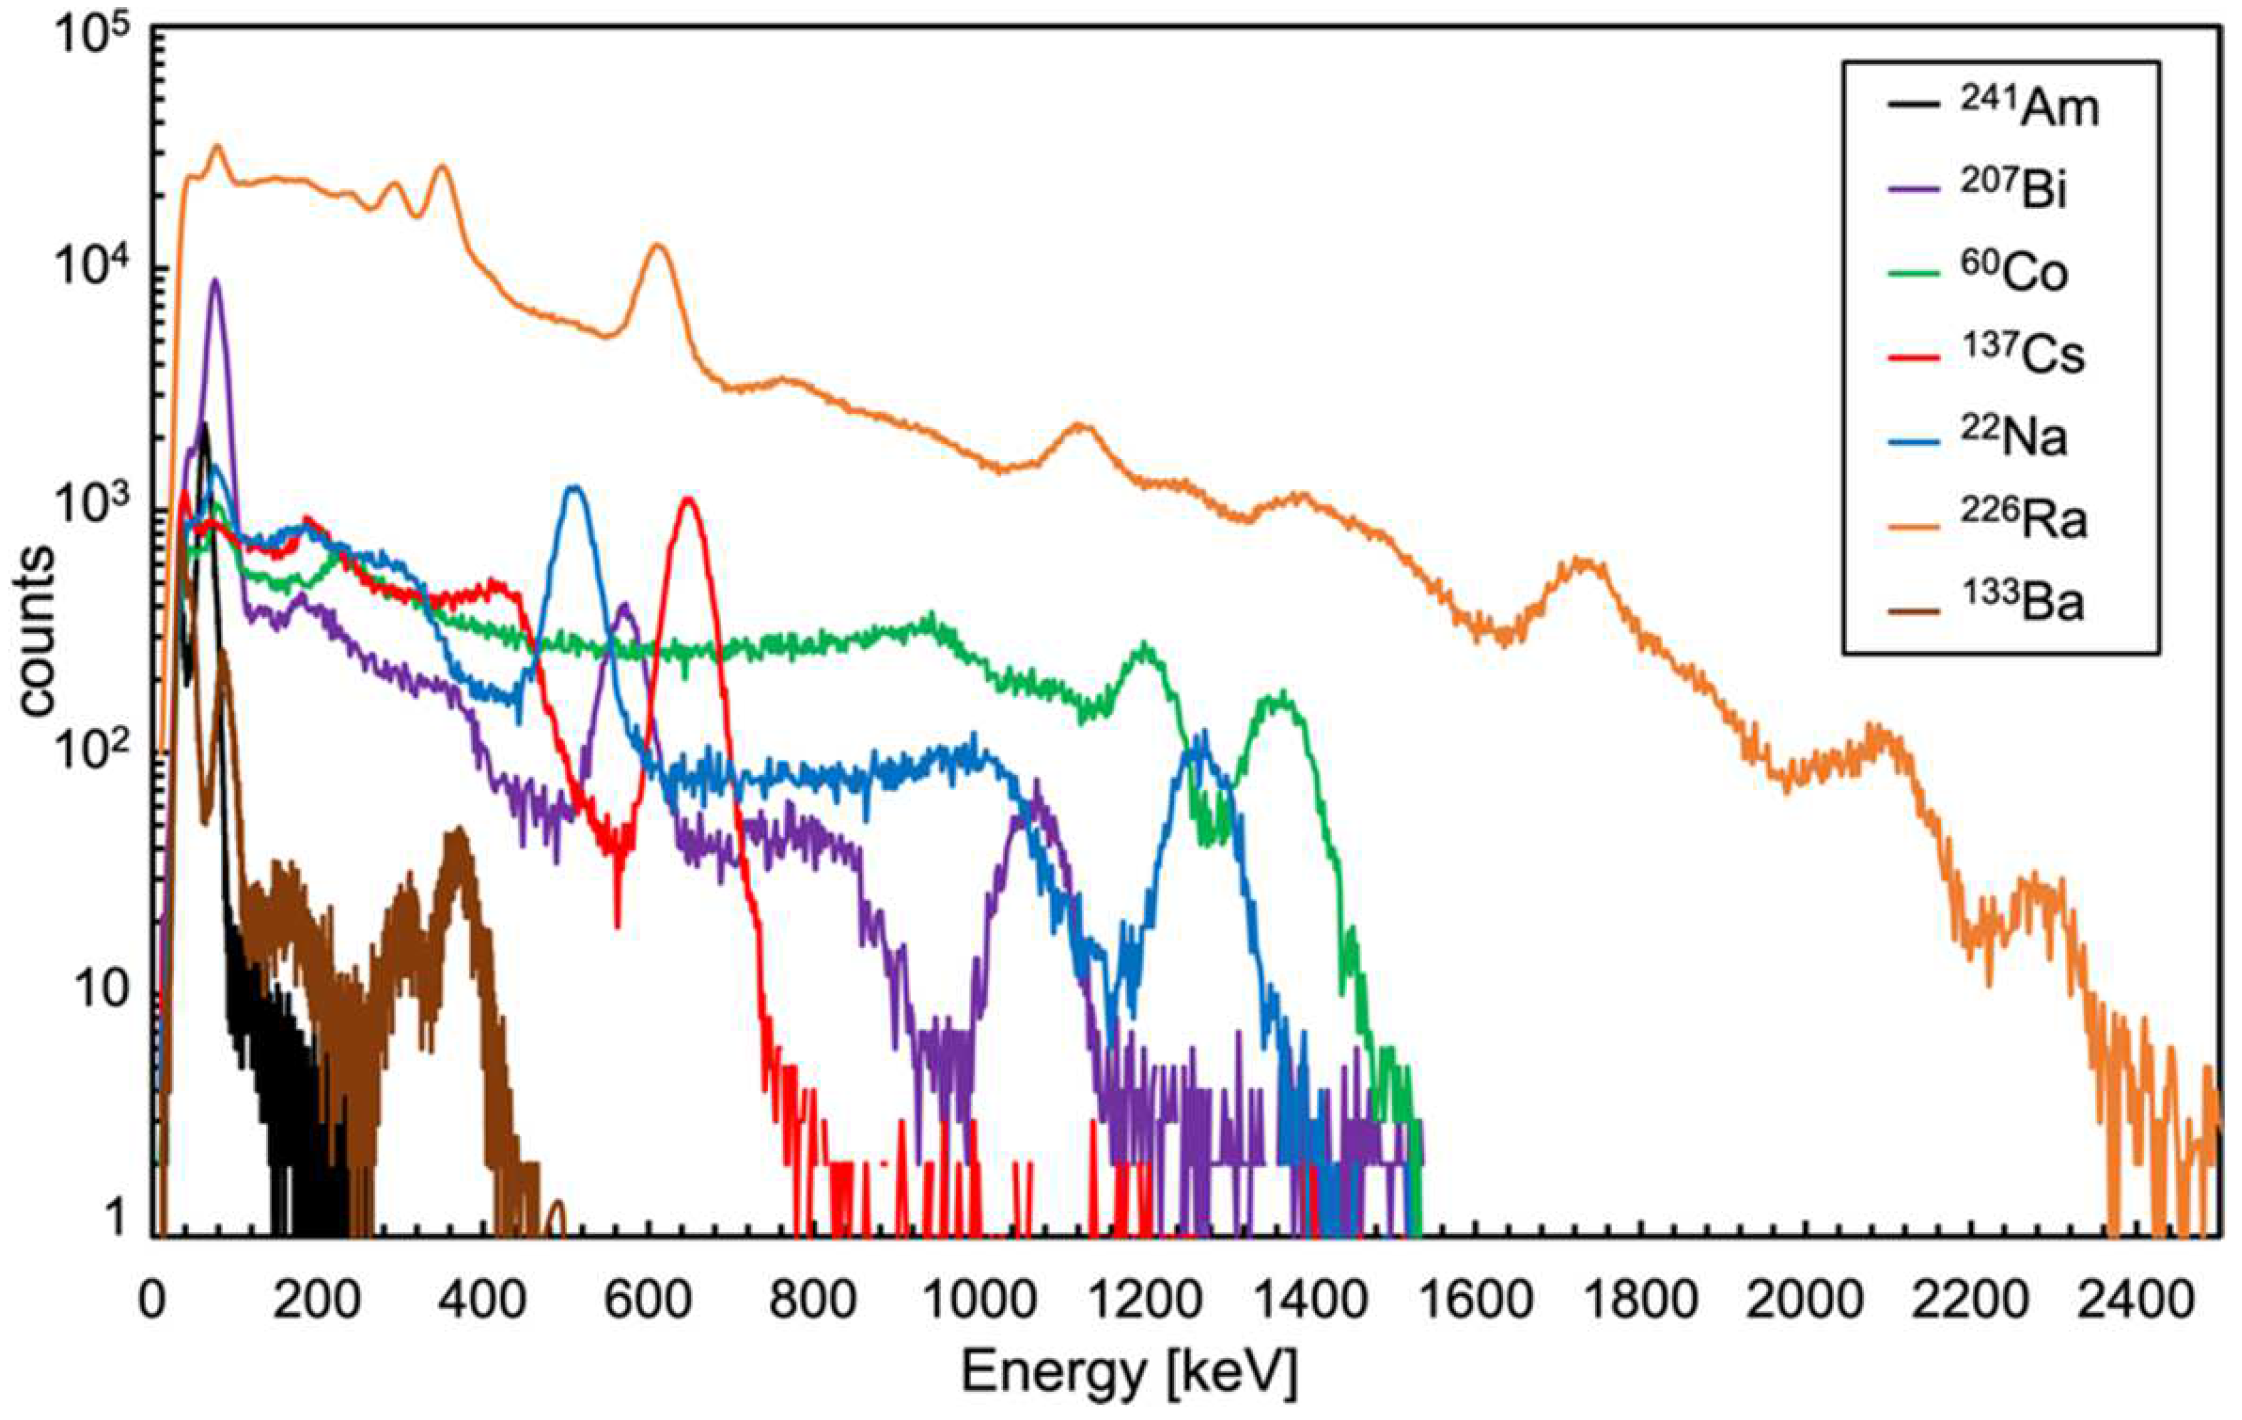
The linearity up to ≈2 MeV was experimentally proved in ref. [25] by exposing the single detector to seven different gamma sources (see Figure 6) and fitting the position of sixteen different peaks. The energy resolution at the 662 keV peak of a 137Cs gamma source was observed to range between 5% and 9%, depending on the SiPM gain, on the front-end electronics, on the analog to digital conversion technique, and mainly, on the stability of the bias supply. The spectroscopic features of the detector, with the observed values for the energy resolution, make it a useful tool for a coarse identification of the gamma emitting isotopes, at least for the commonly expected ones like 137Cs, 60Co and 241Am.
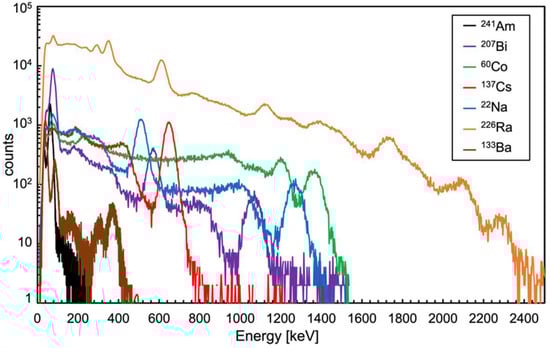
Figure 6.
Calibrated spectra of seven different gamma sources obtained with a single detector [25].
3.2. Characterization of the 128 Detectors
In this section, we report on the energy resolution of each individual detector when operated with a common bias supply in order to assess their uniformity of behavior. In order to test and characterize the modules, three different point-like gamma-ray sources were used. The characteristics of each source are shown in Table 2.
Table 2.
Characteristics of the three point-like gamma-ray sources used for the tests.
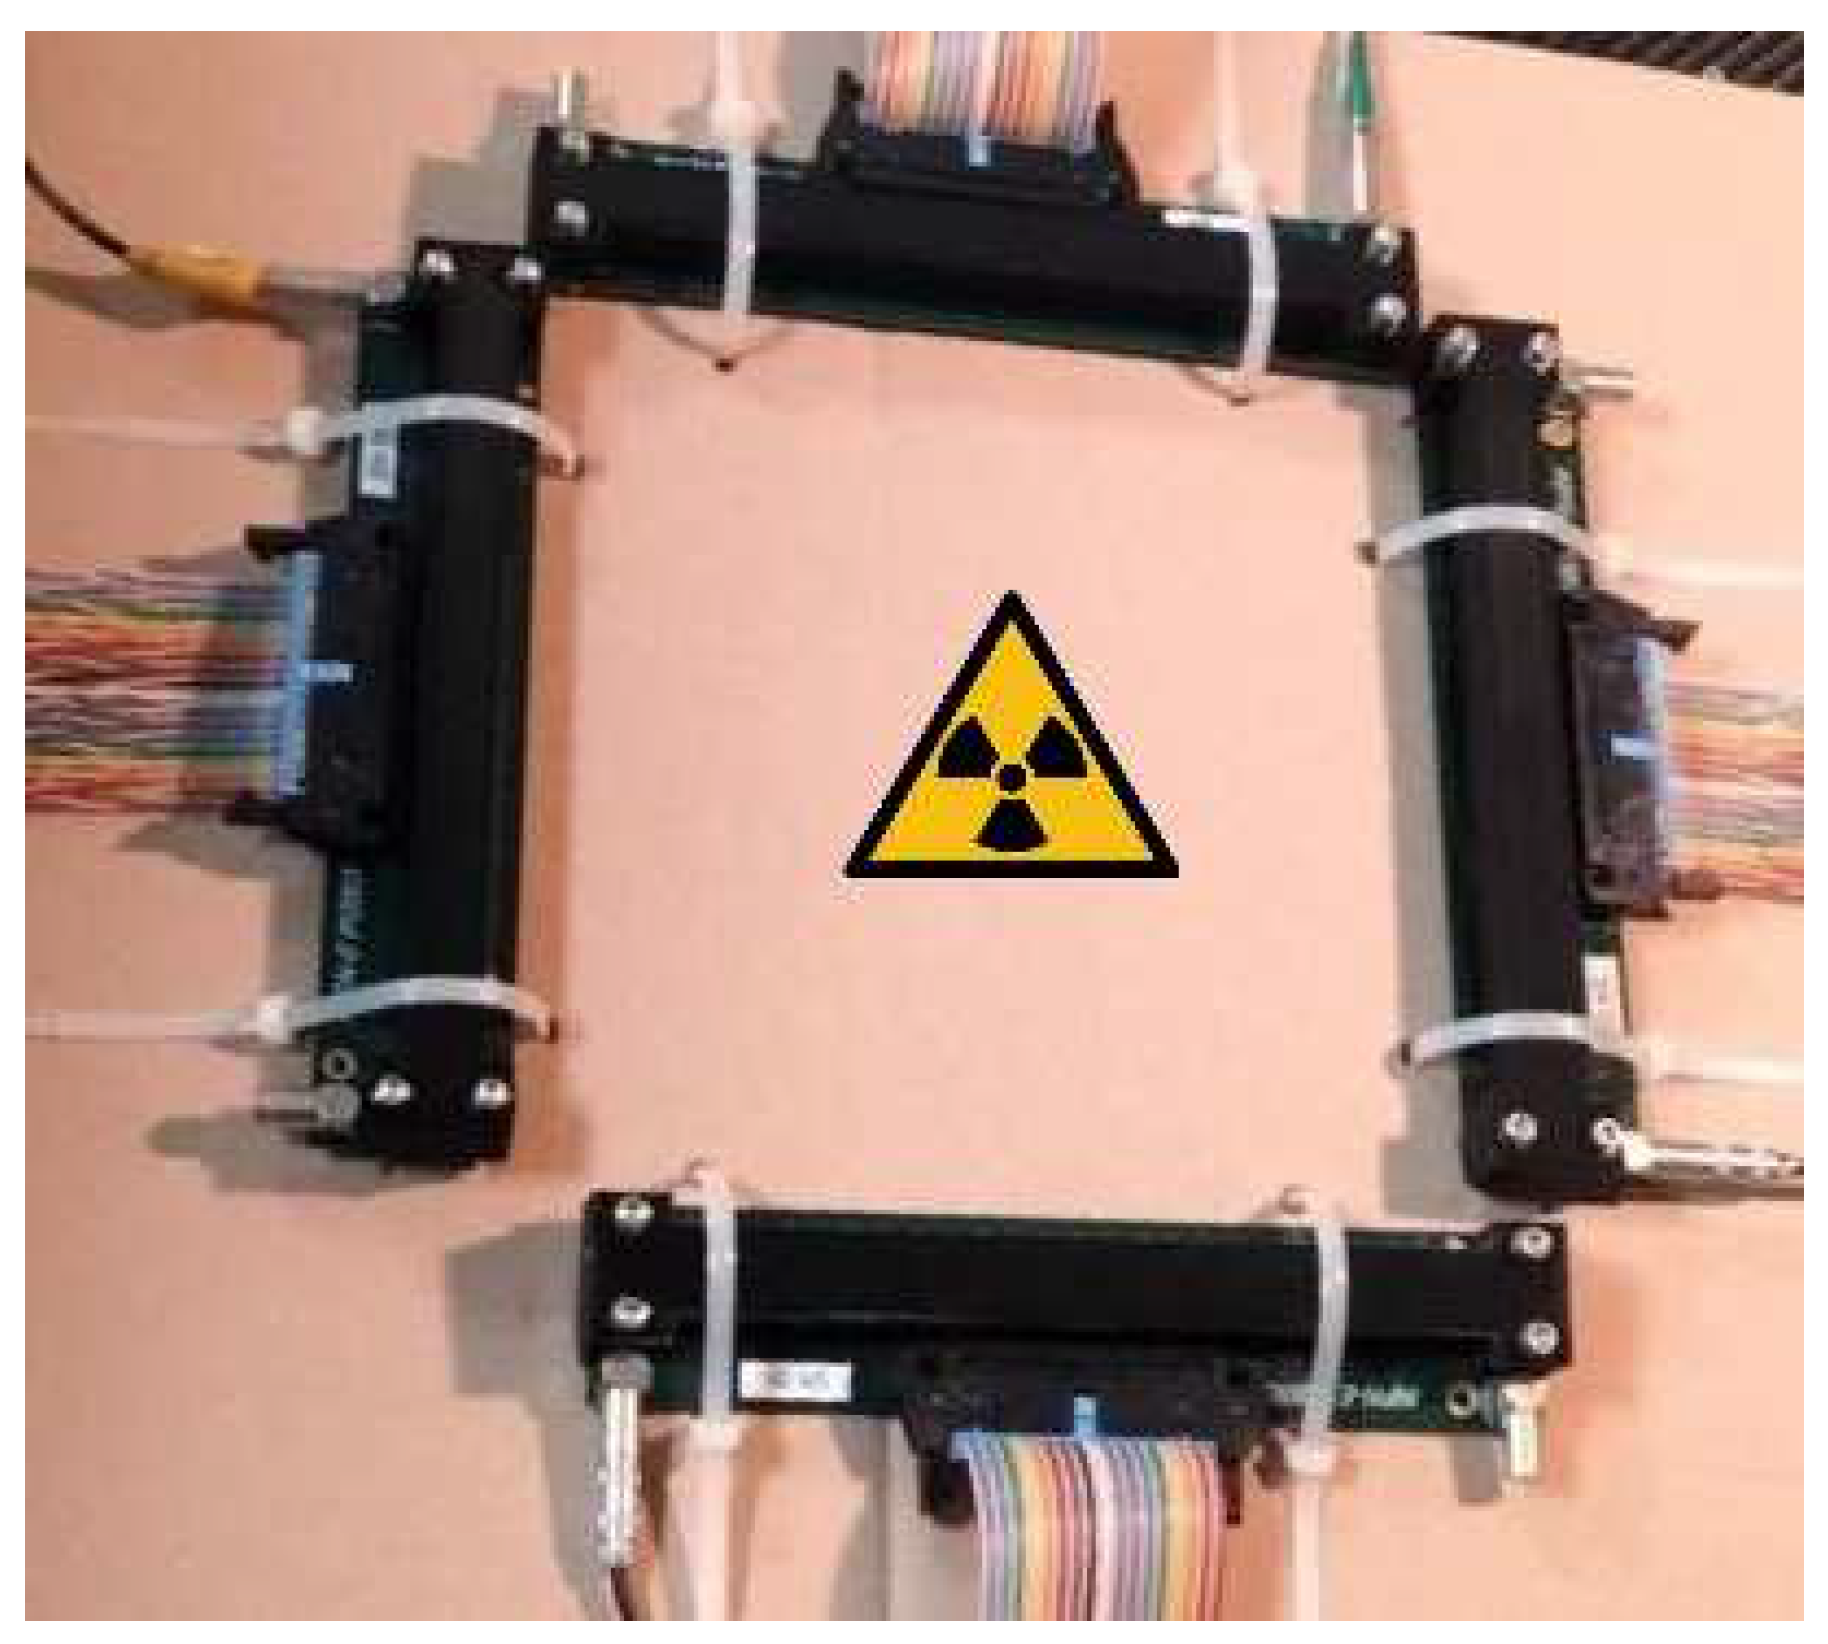
The eight boards of Figure 4b, as denoted from SN01 to SN04 and from SN05 to SN08, each one incorporating sixteen individual detectors, were loosely fixed on two cardboard sheets in a roughly square arrangement and placed one on top of the other. Figure 7 shows this arrangement, although only four boards are visible.
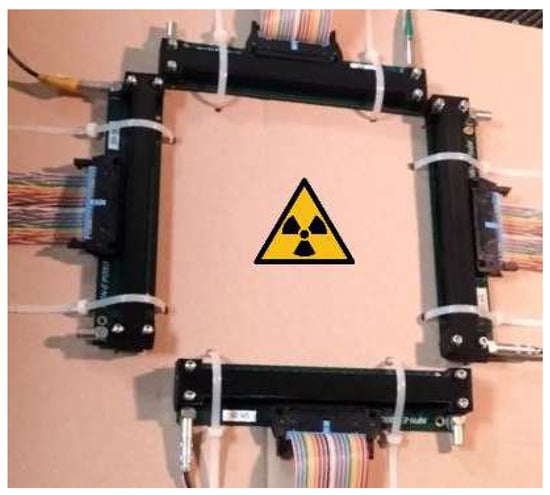
Figure 7.
Arrangement of the detector boards for the energy resolution tests.
A bias voltage of 41.3 V was chosen for all the SiPMs, corresponding to 3.3 V overvoltage (i.e., over the breakdown), and used for all the subsequent tests. Three measurements were performed, with the three gamma sources in turn placed at the center of the squares, and the corresponding 3 × 128 spectra were acquired. The duration of each run, listed in Table 3, was long enough to have at least 105 to 106 total counts in each detector.
Table 3.
Duration and average counting rates for the three calibration measurements.
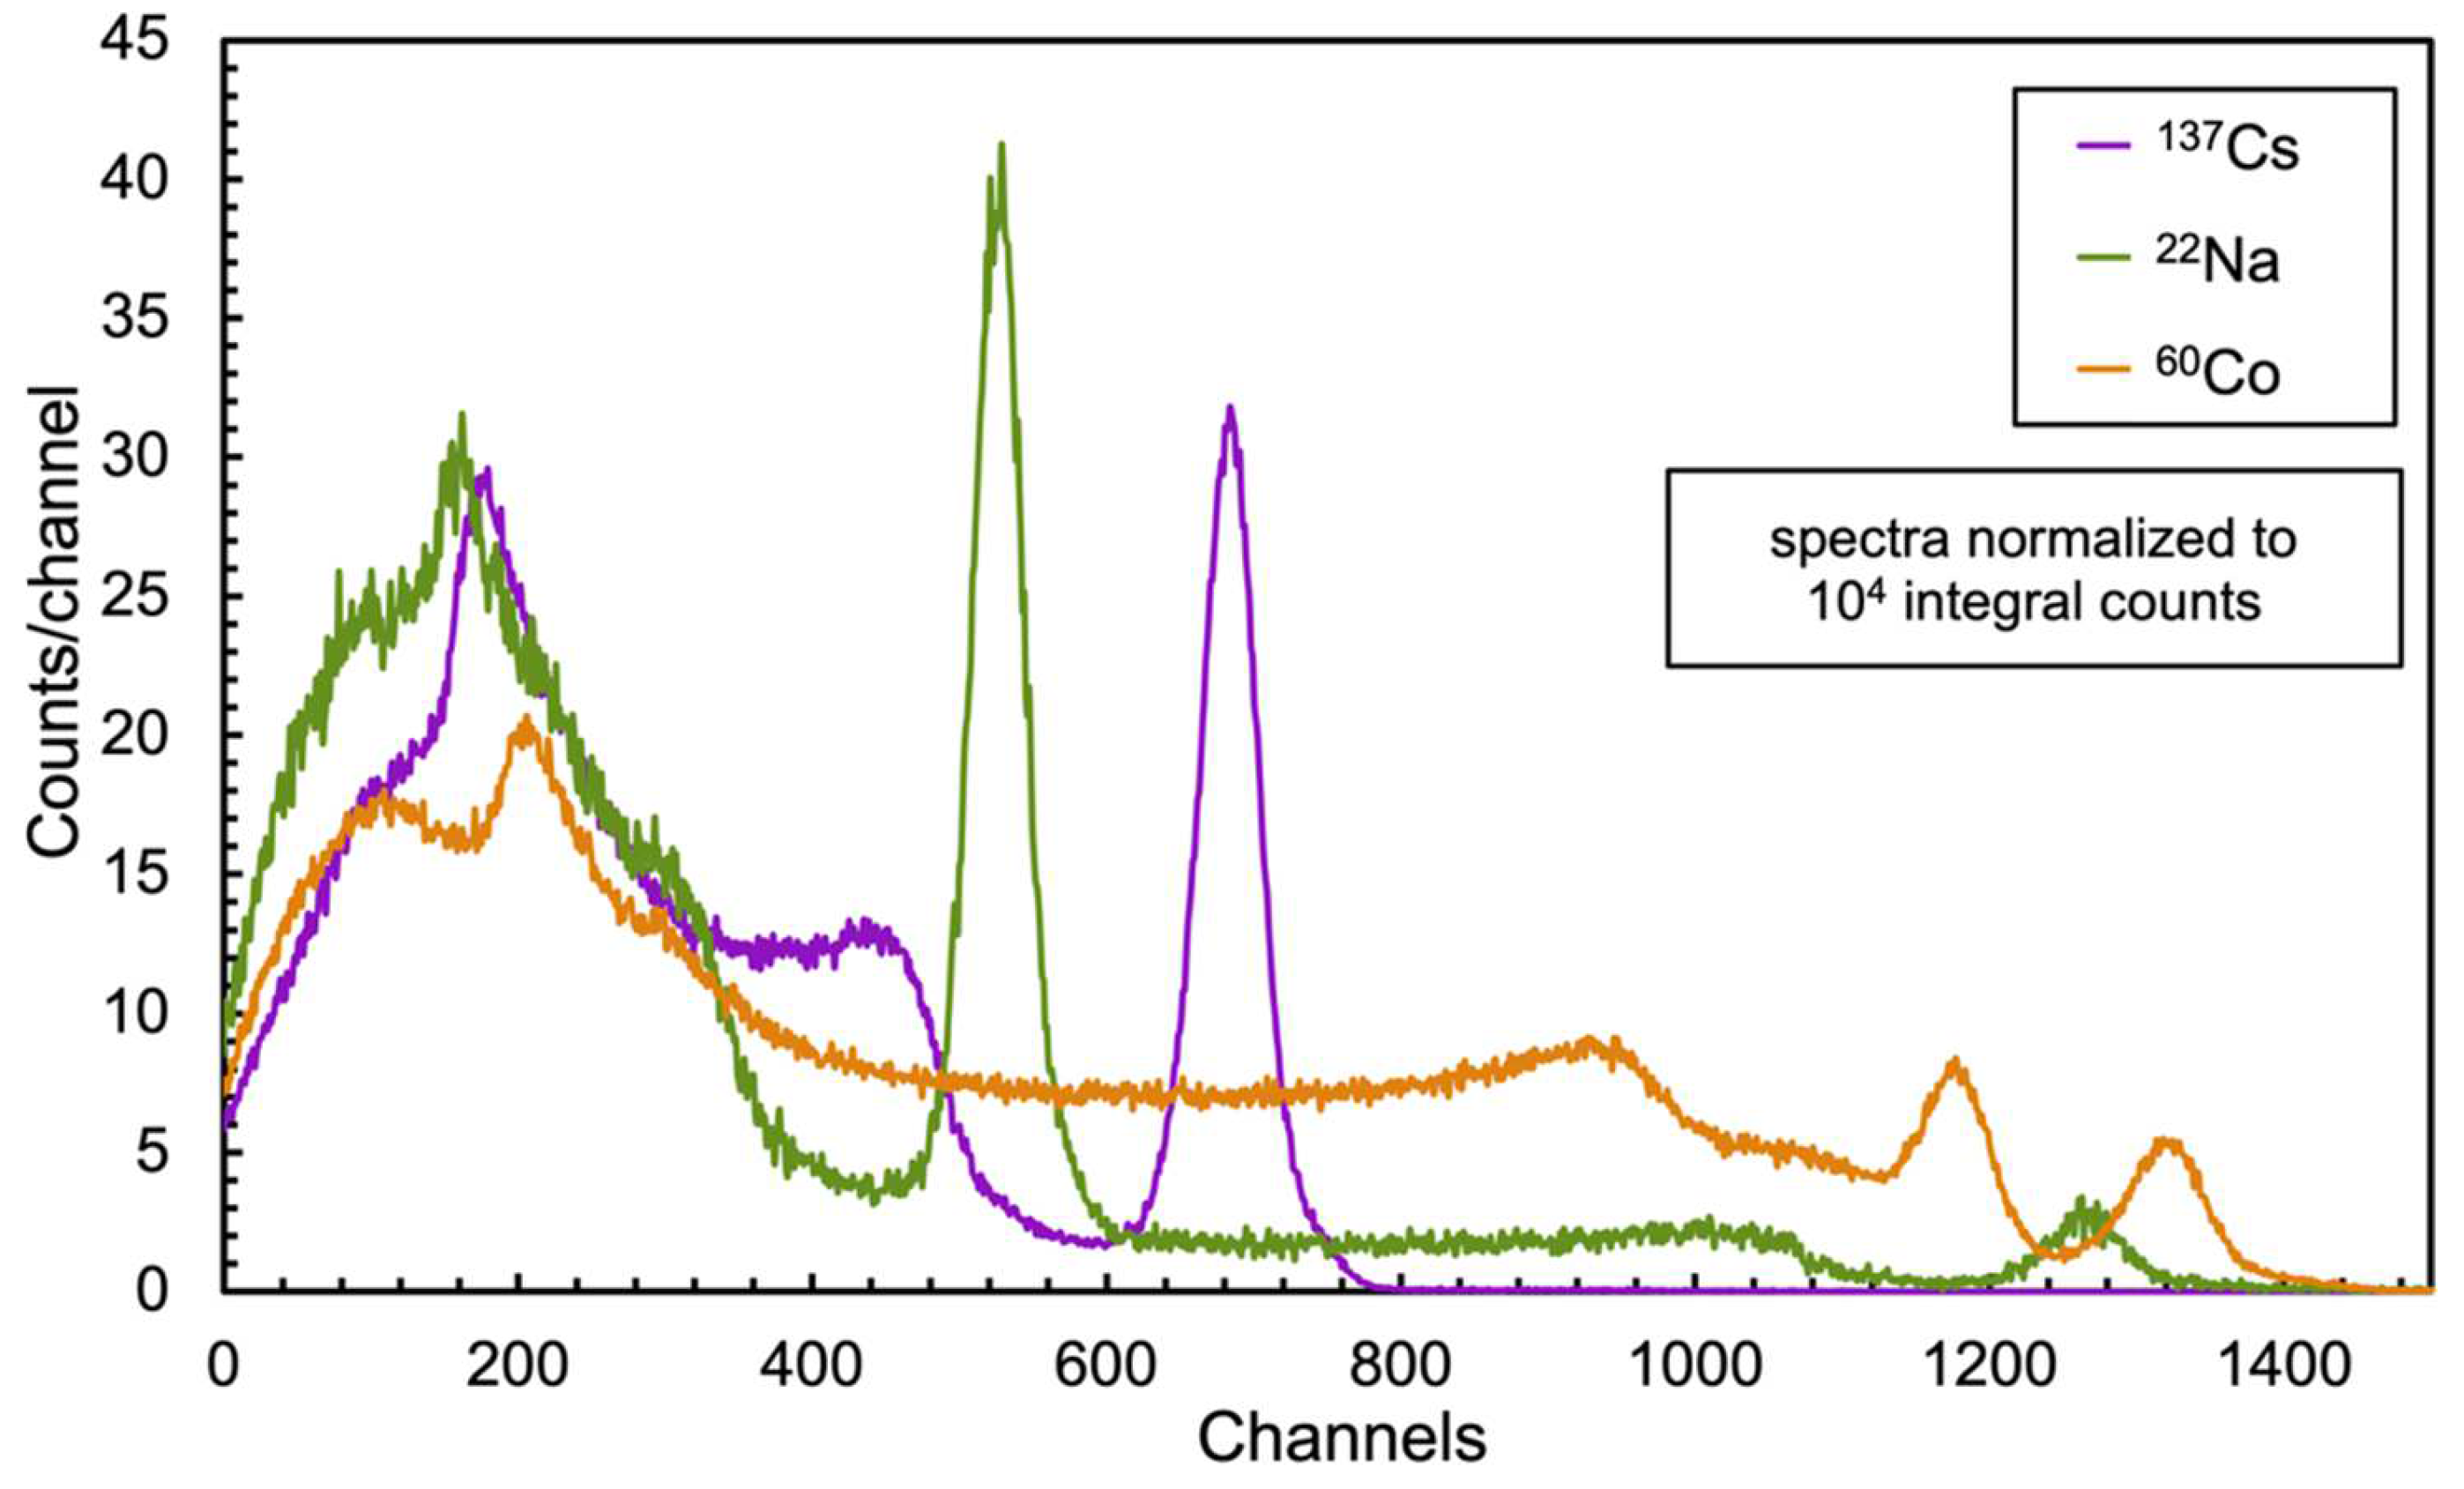
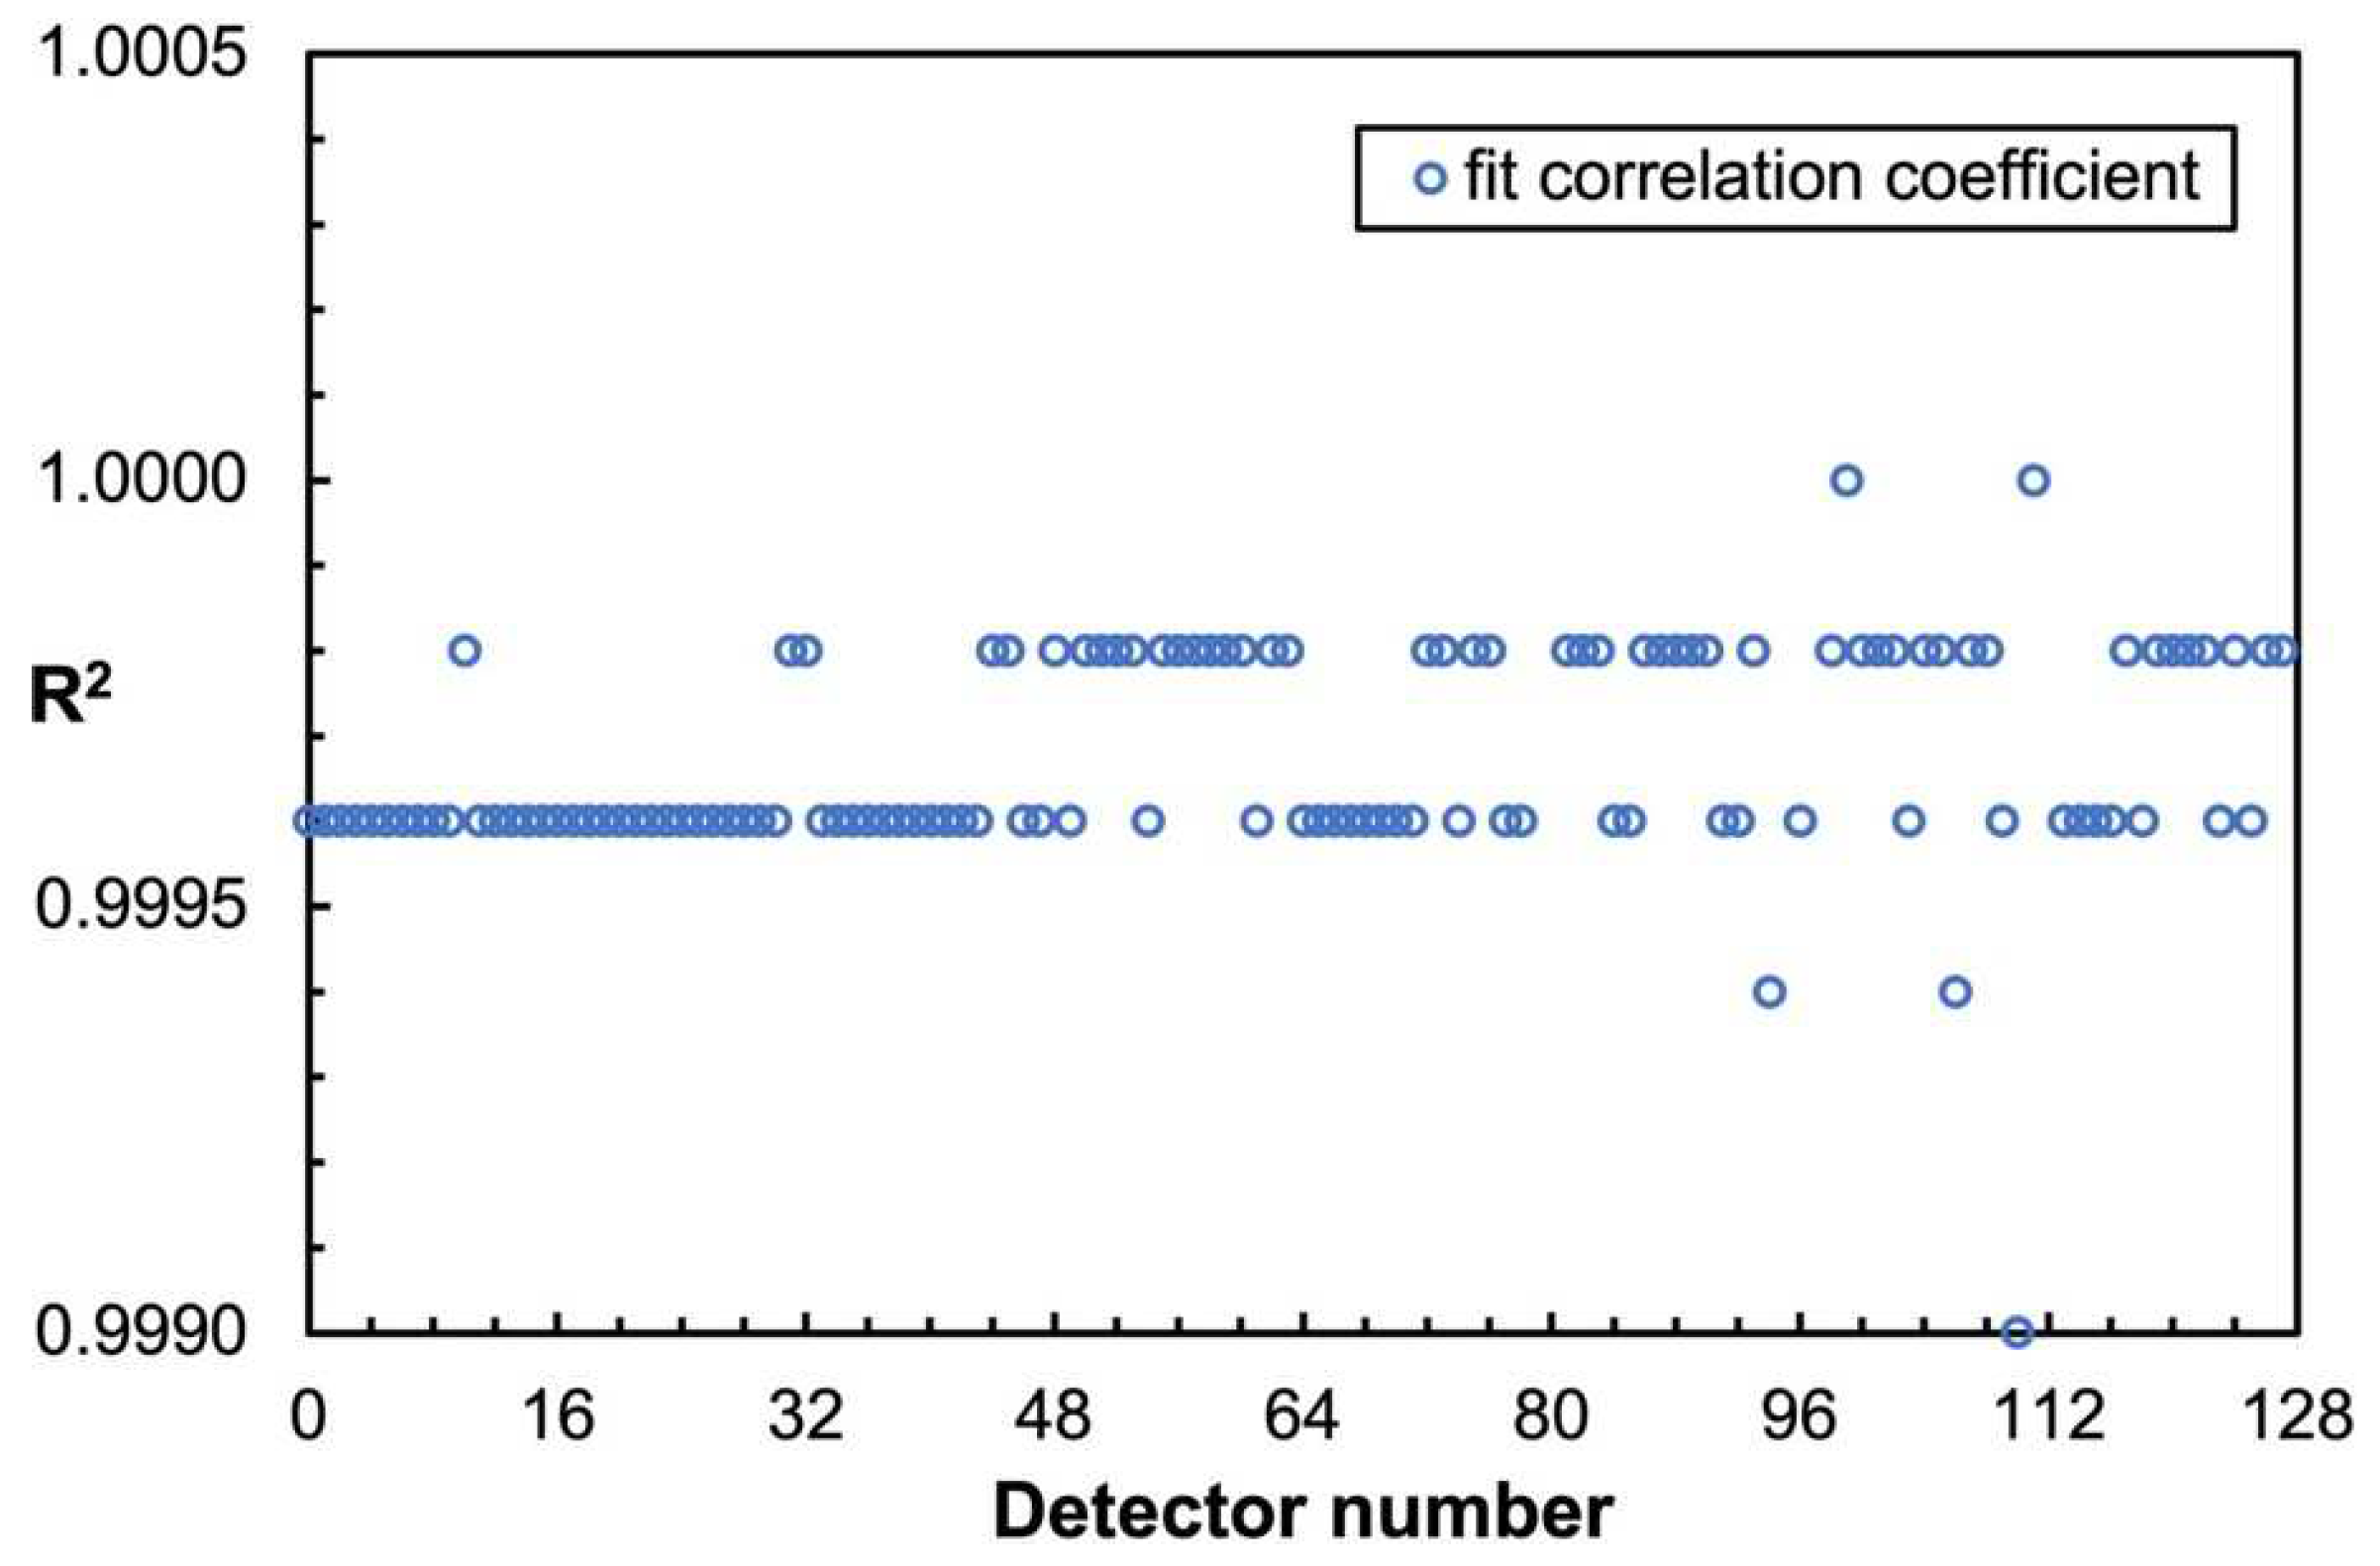
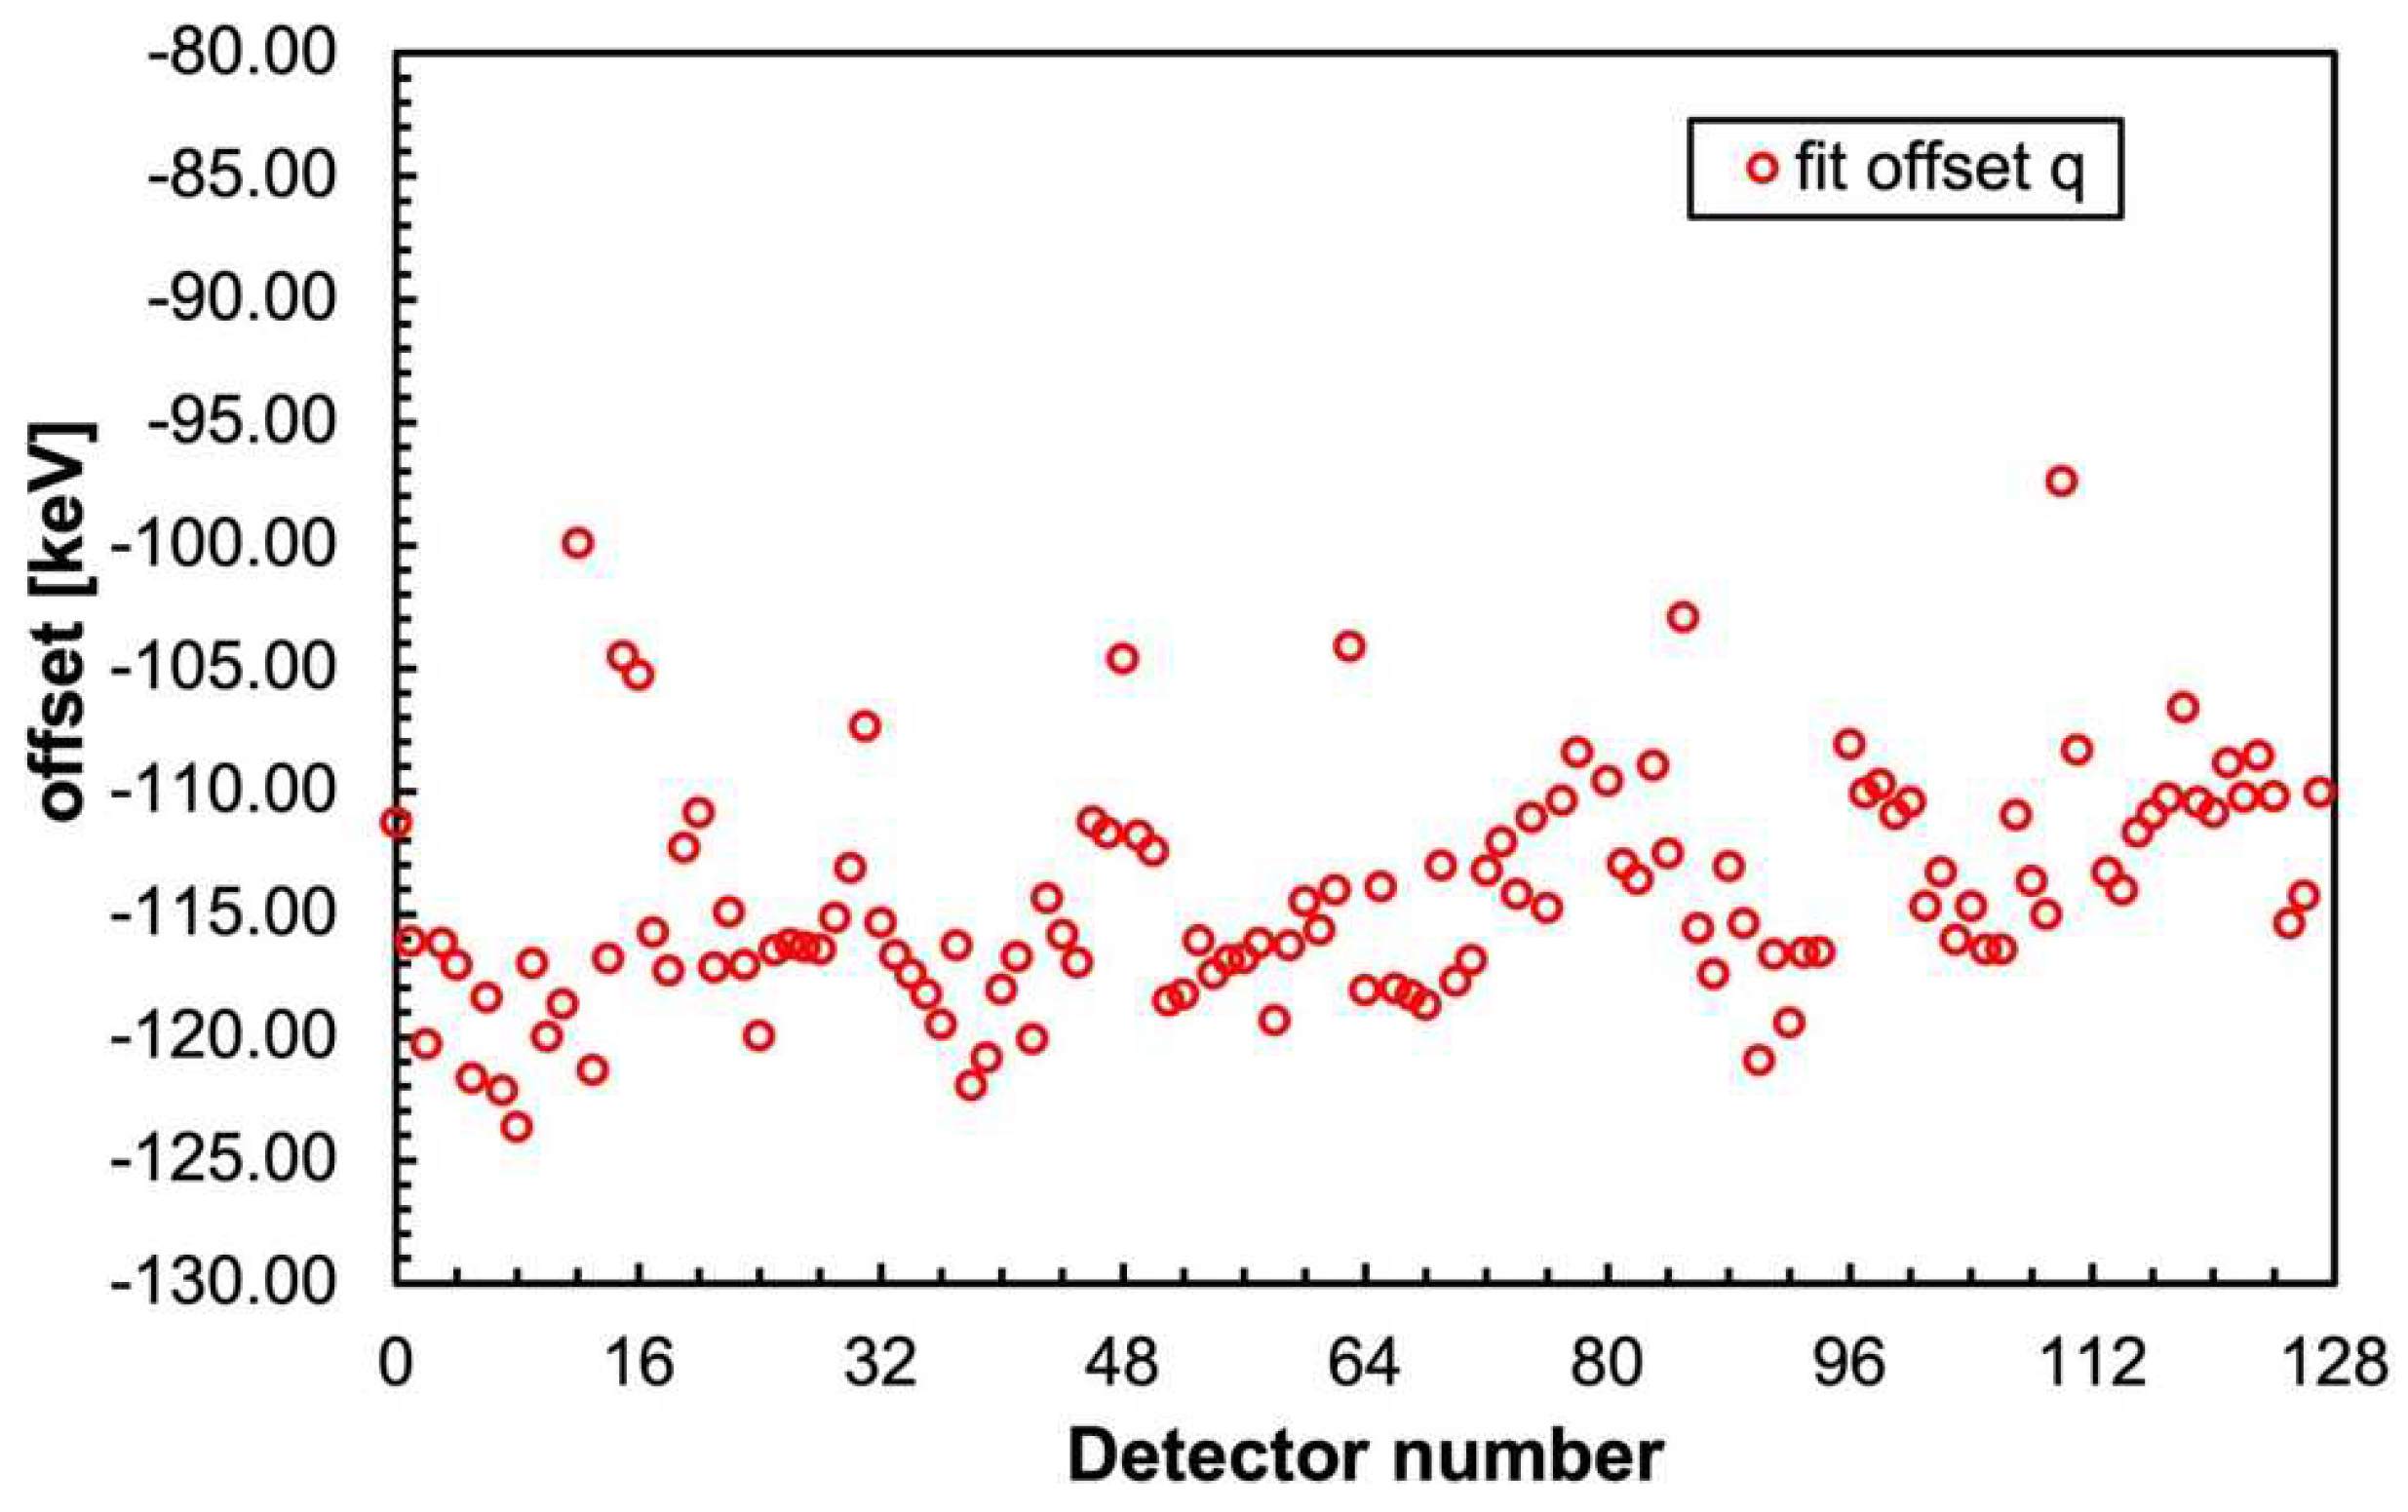
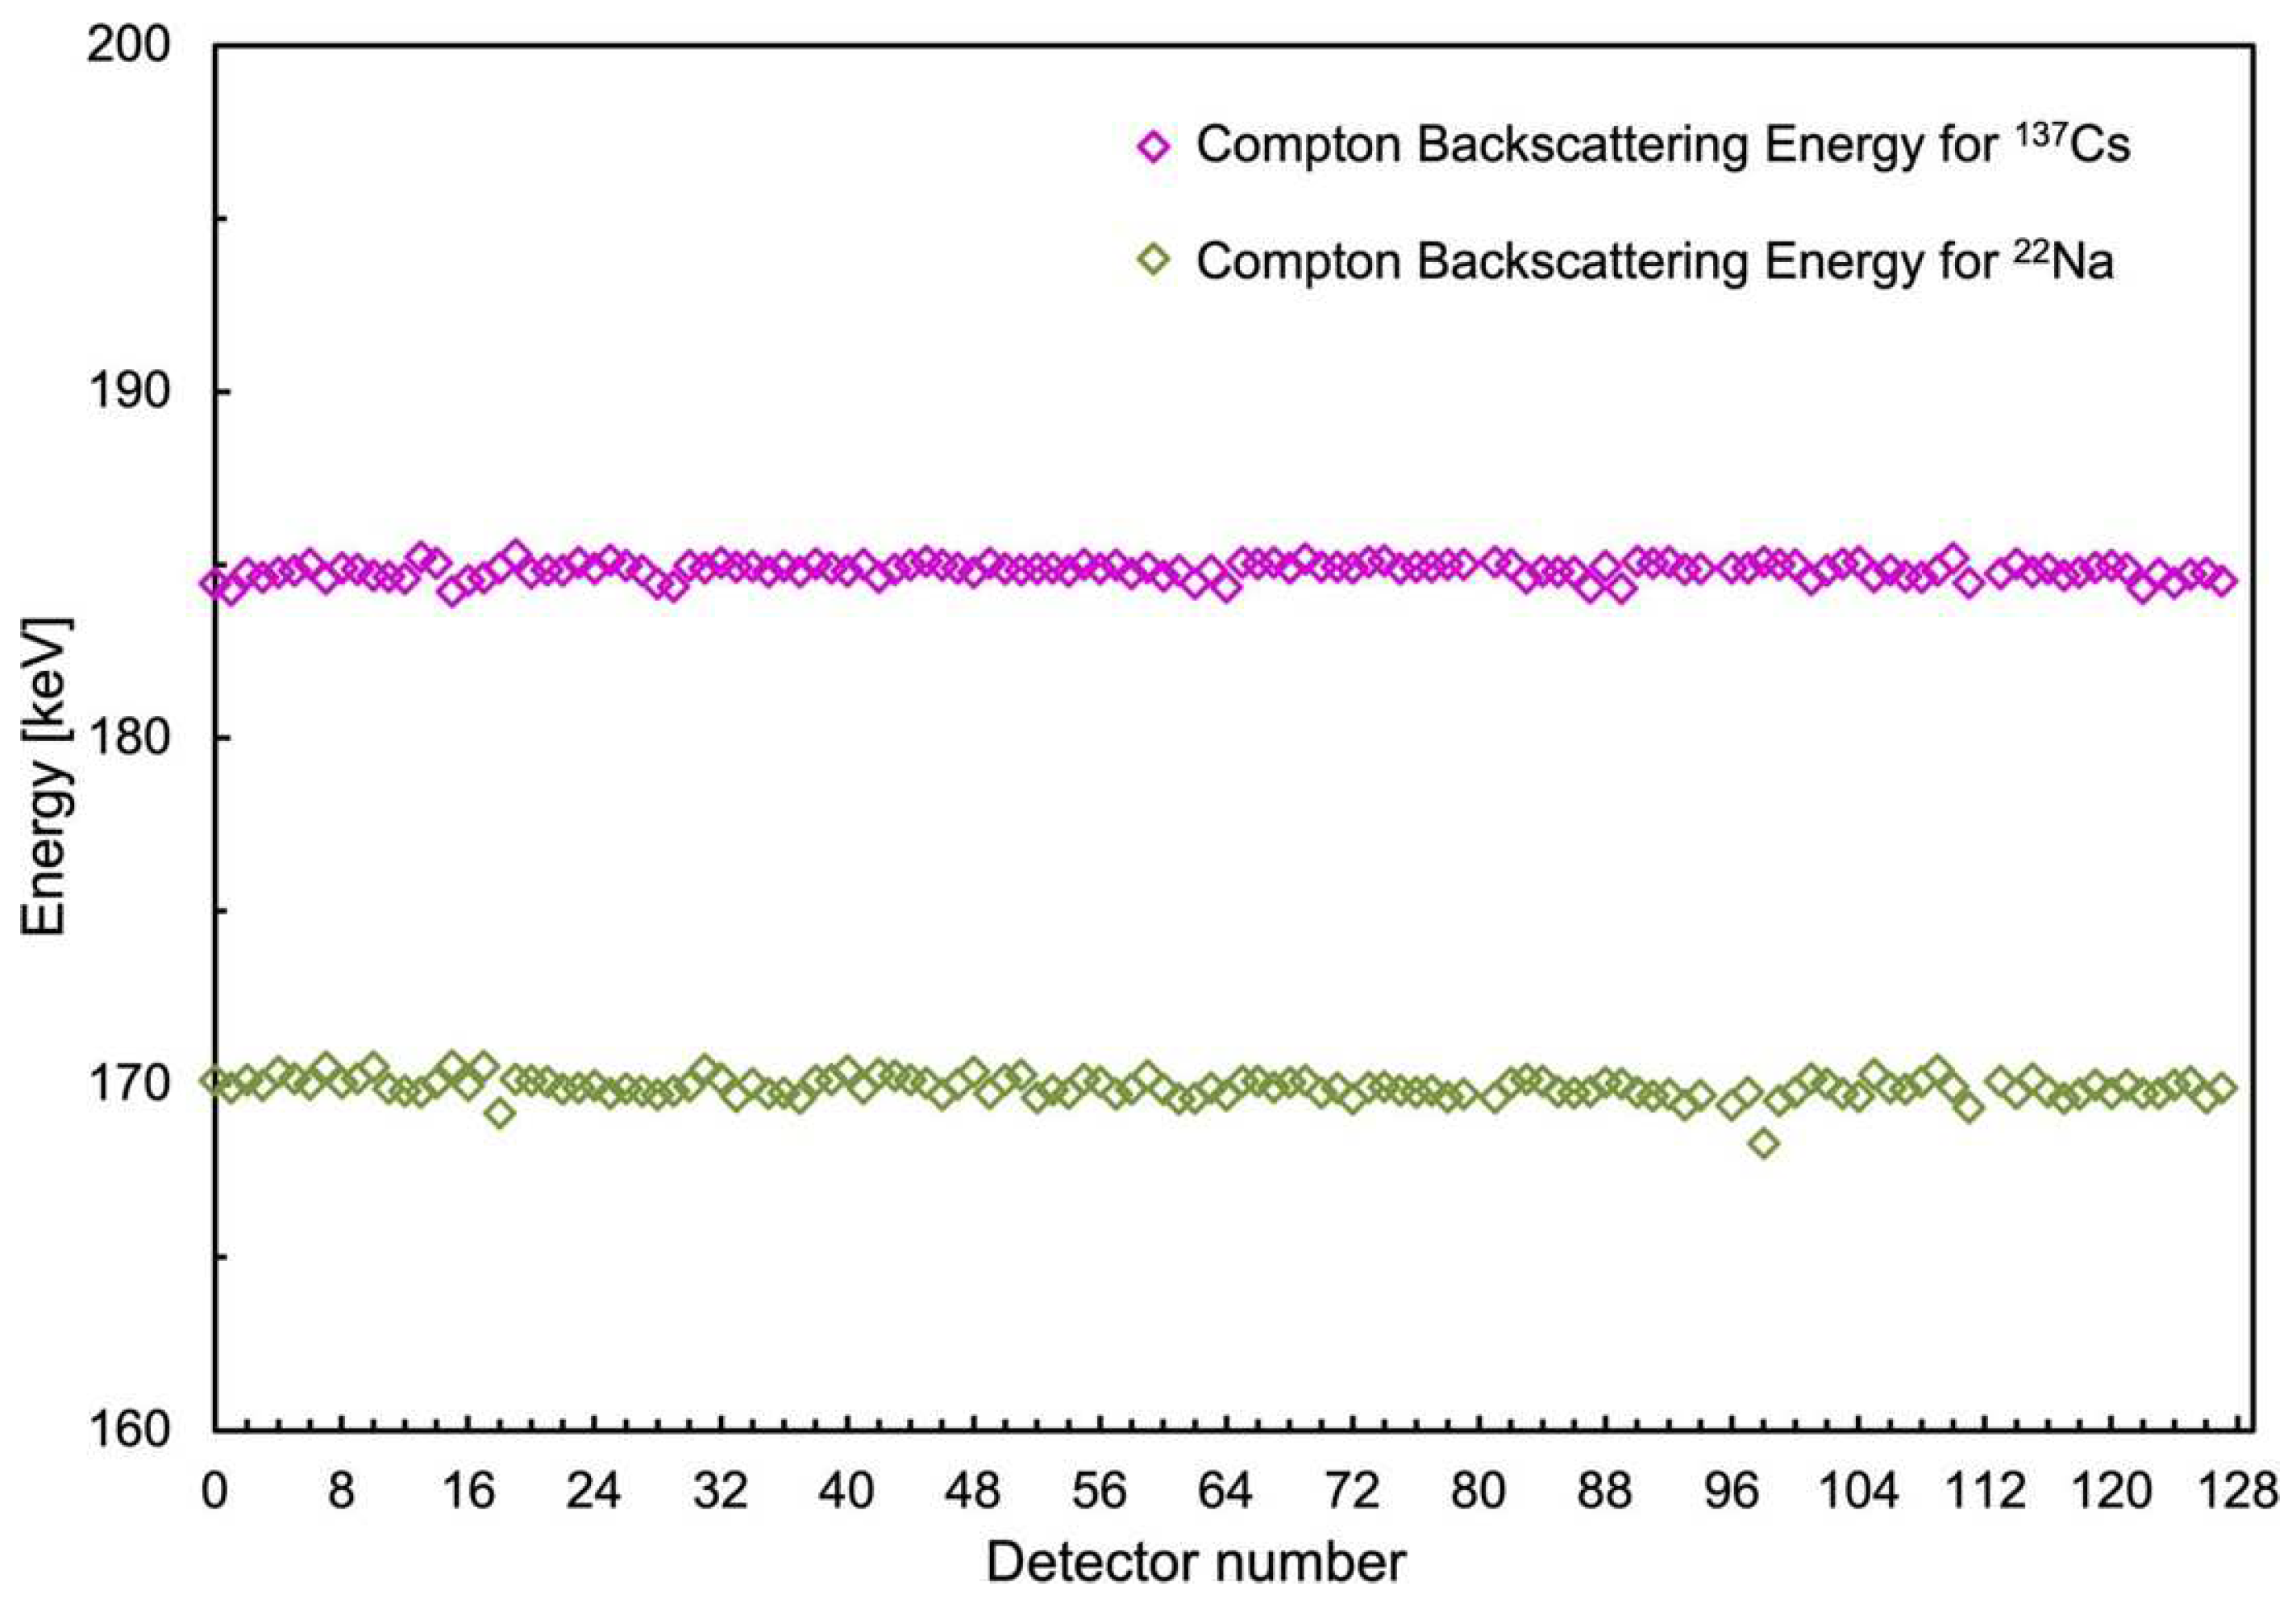
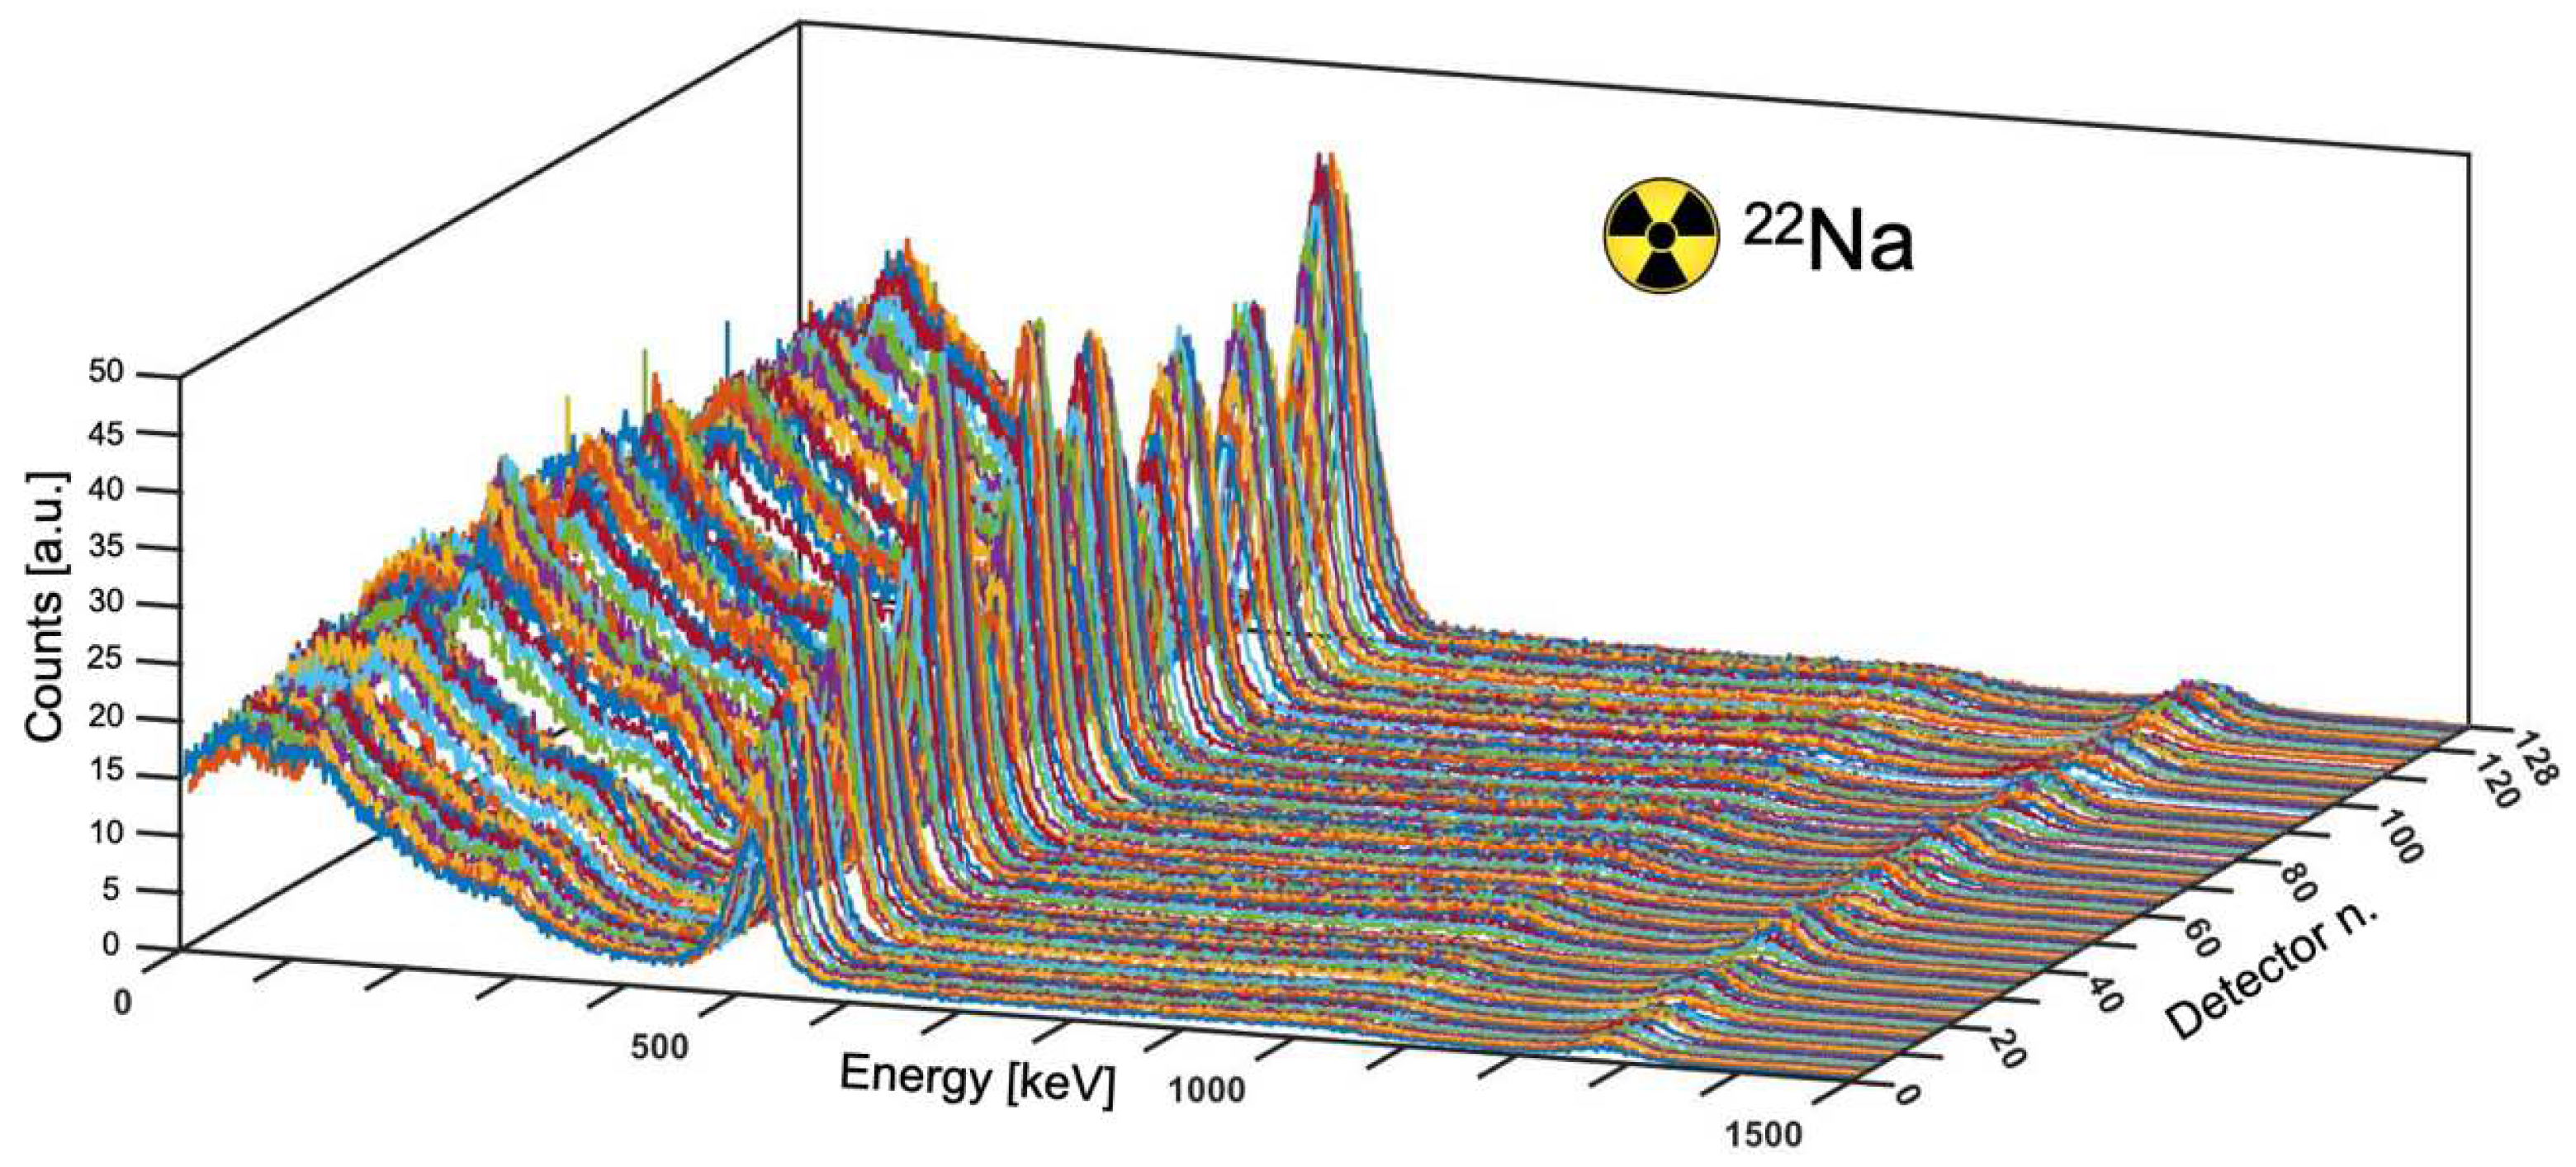
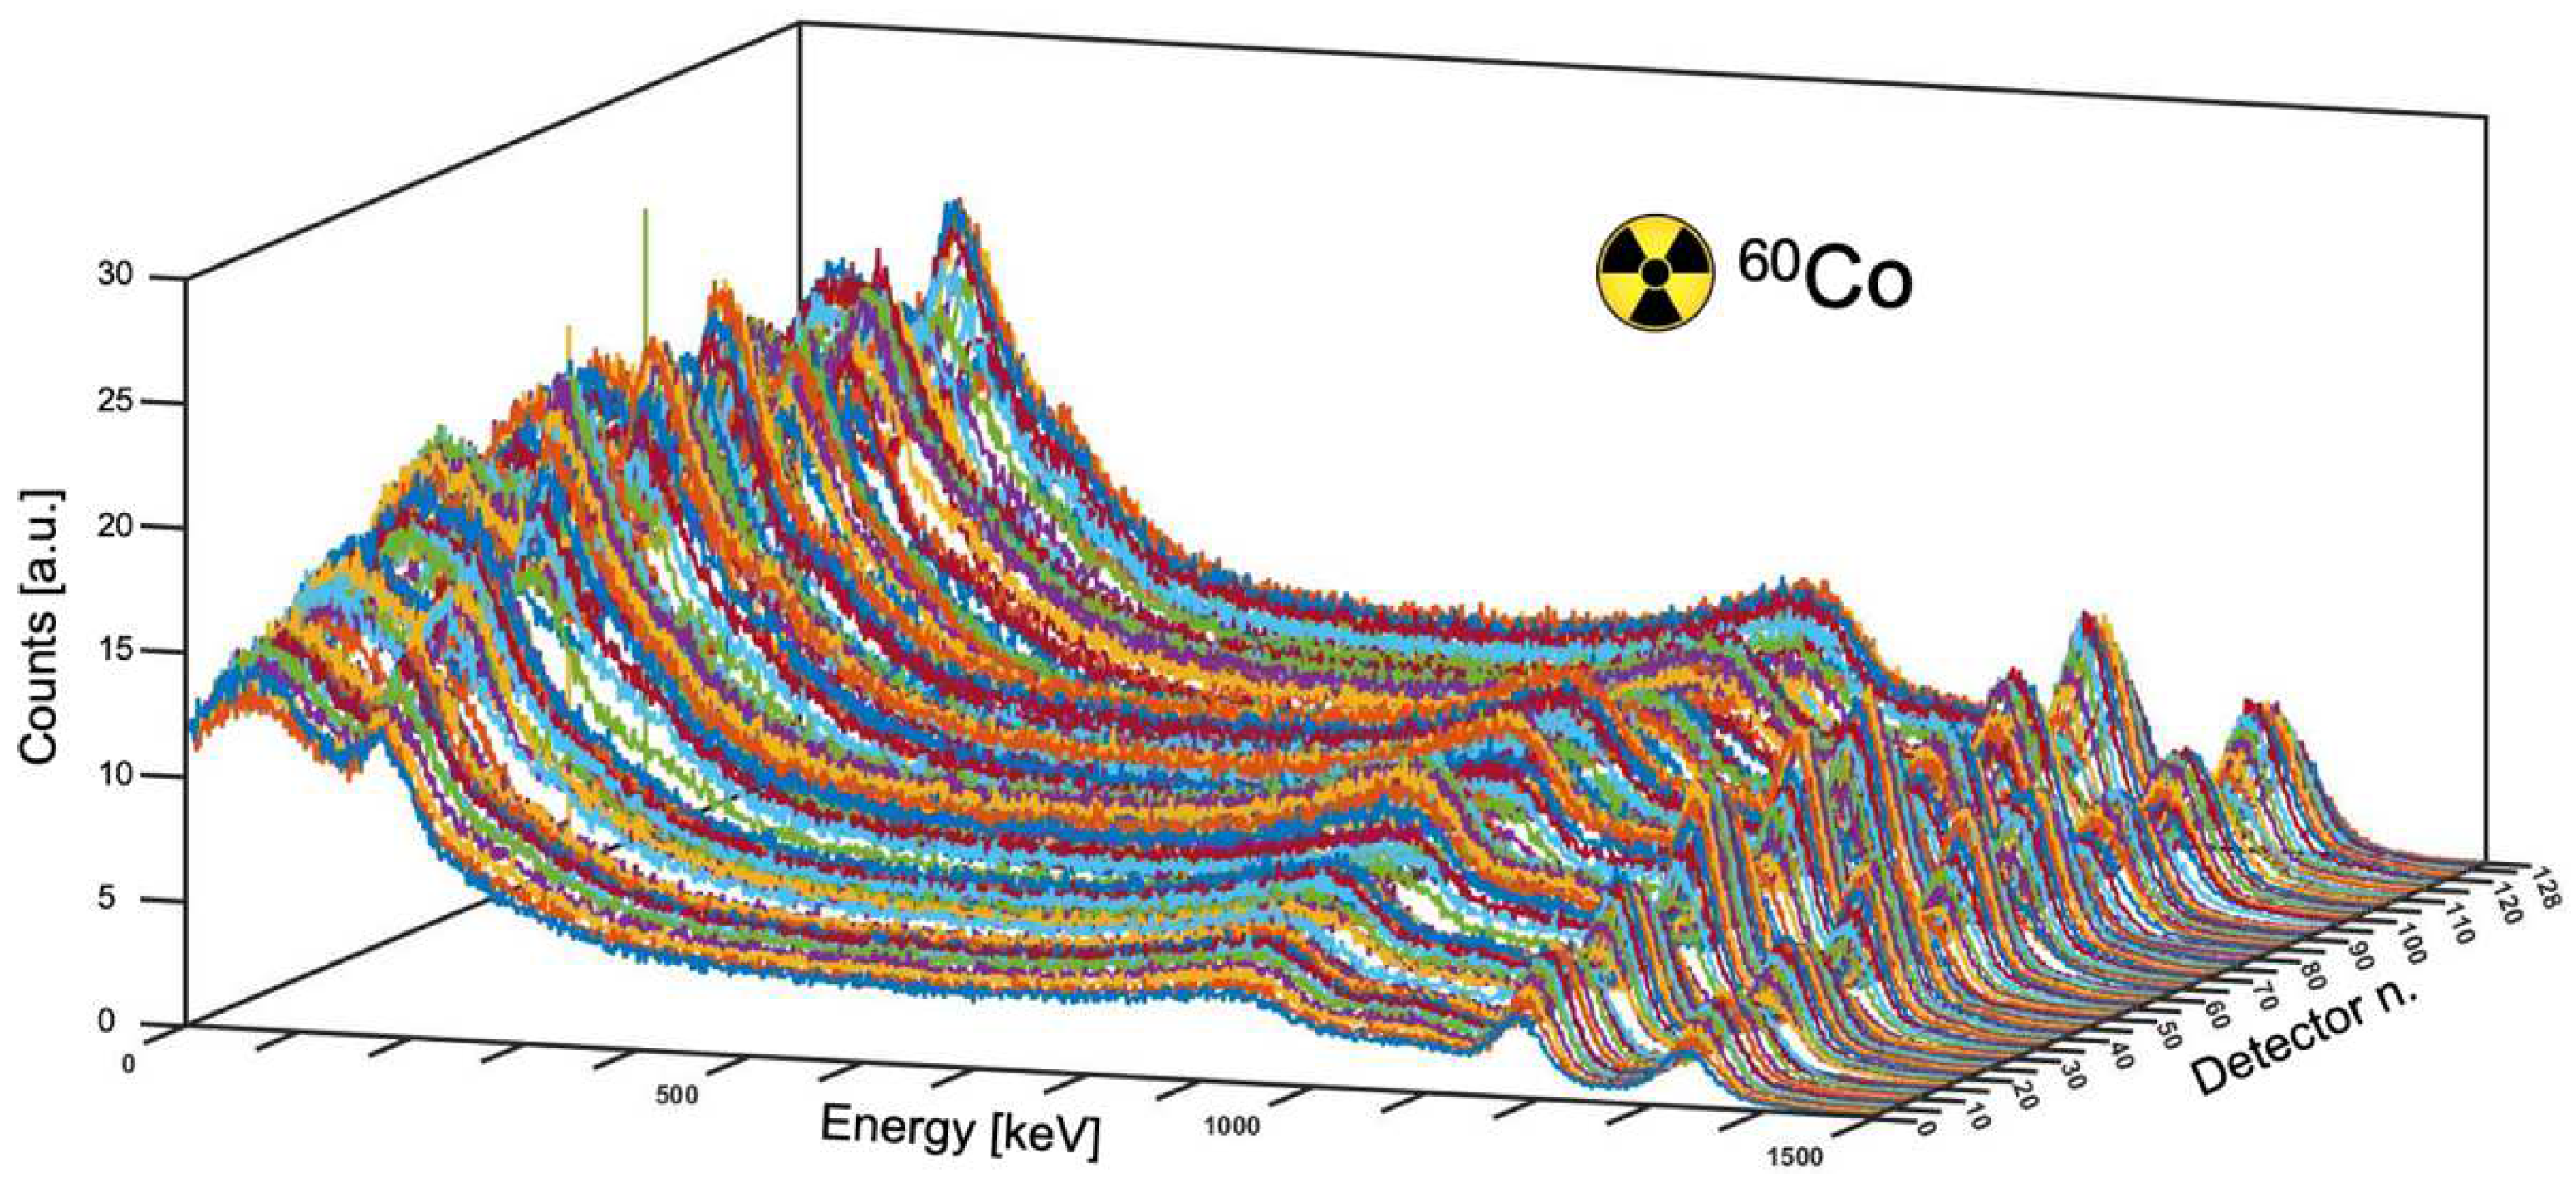
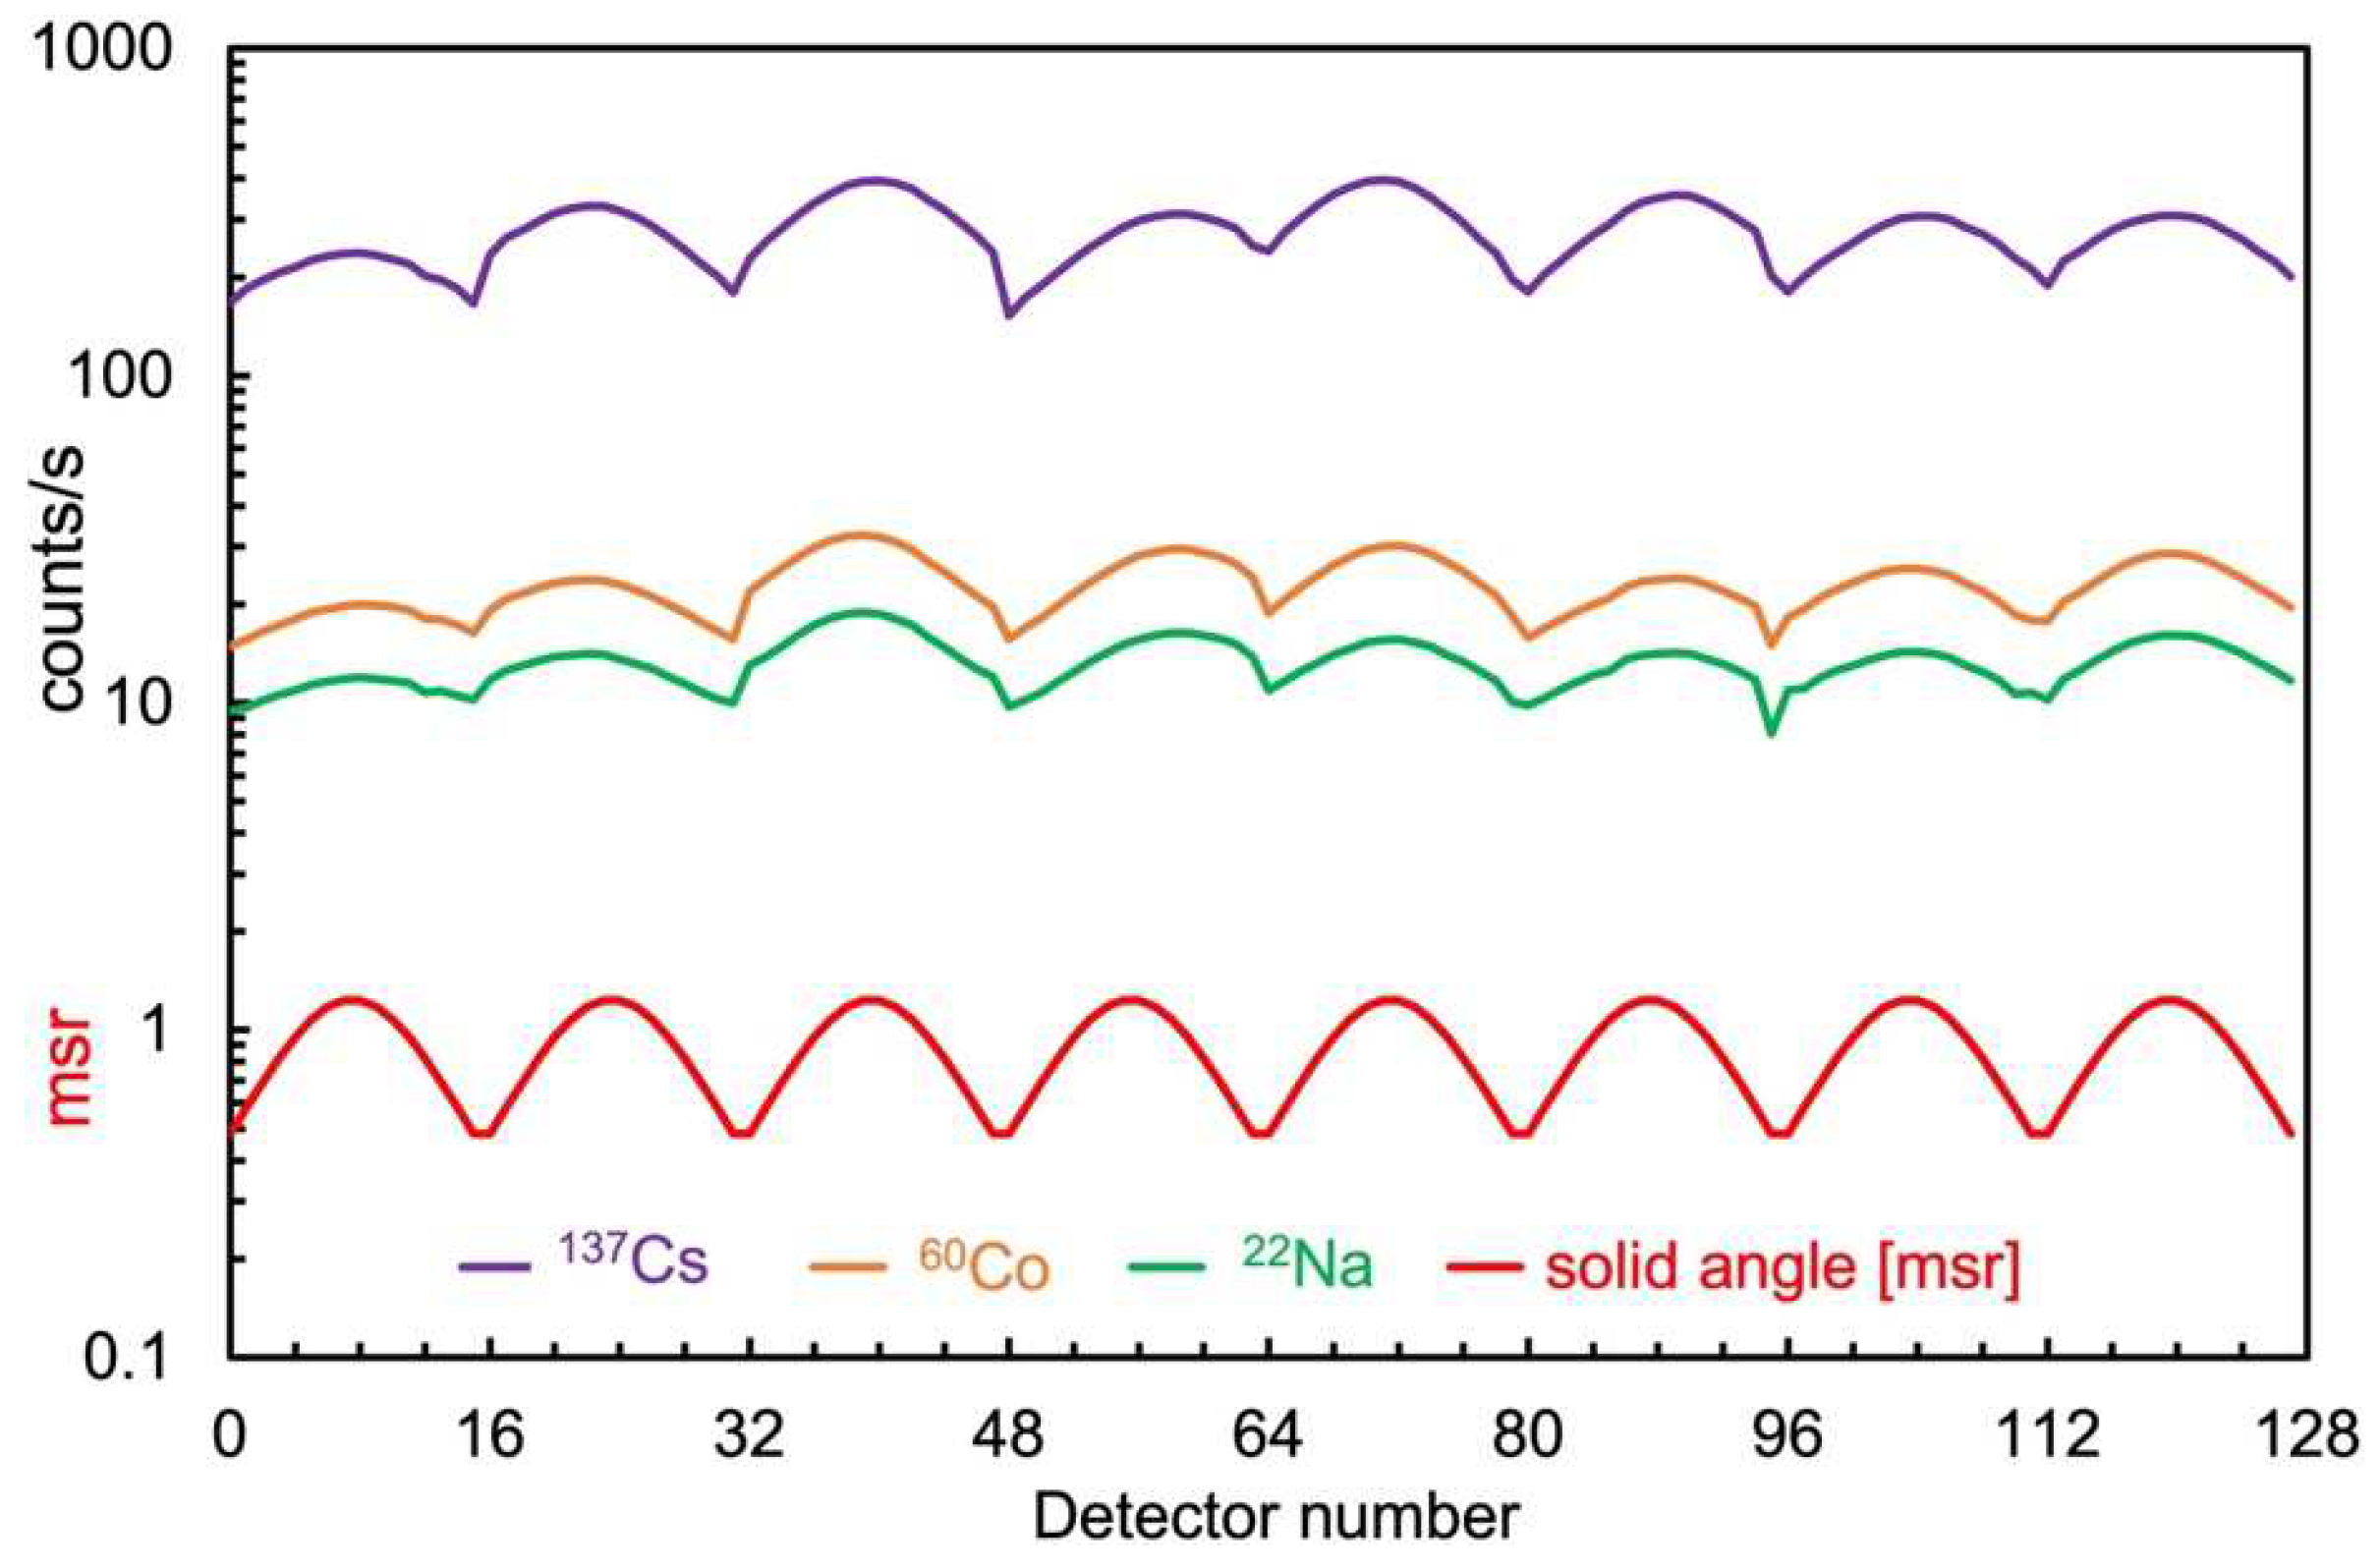
Three sample spectra, namely from detector number 120, are shown in Figure 8 and were normalized to a total integral of 10,000 in order to show them on the same vertical scale. The calibration of each detector was performed using the five peaks from Table 2 for a linear fit and proved to be fairly linear, as visible in Figure 9, where we report the correlation coefficient R2 for each detector. Figure 10 and Figure 11 show the angular coefficient m and the offset q for each detector as resulting from the fit. We remark that the values of the m coefficients for the detectors of boards 5–7 are slightly higher (Figure 10), and this is likely due to a slightly higher voltage bias, and consequently, the higher gain, for these boards. As a further cross-check of the calibration, for each detector we noted the resulting centroid energy of the Compton backscattering peak from the 511 and 662 keV gamma rays, expected at 170 and 184 keV, respectively, and reported them in a plot as a function of the detector number (Figure 12). In Figure 13, we show a 3D representation of the 128 calibrated spectra obtained with the 22Na source in the arrangement of Figure 7 in order to better visualize the goodness of the outcoming energy calibration. The same plots made with the 137Cs and 60Co sources are shown in Figure 14 and Figure 15, respectively. Looking at these plots, one can see a hint of periodic behavior, as expected from the geometric considerations regarding the different distances of individual detectors from the source placed at the center. This is clearly shown in Figure 16, where we plot the integral counting rate as a function of the detector number for the three sources, along with the solid angle subtended by each detector, assuming the perfect square arrangement of the boards.
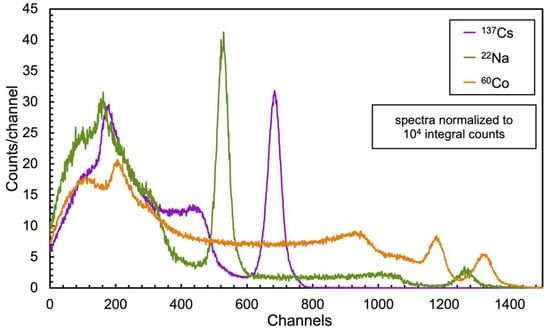
Figure 8.
Sample spectra (detector n. 120) measured with the three sources and calibrated in energy.
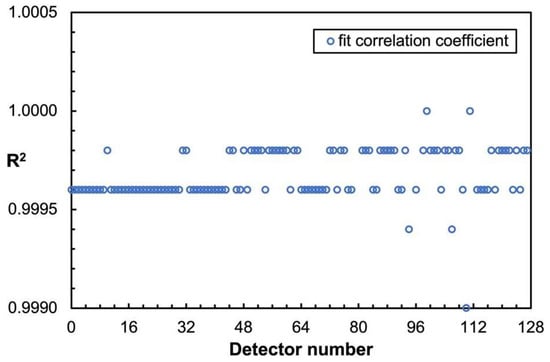
Figure 9.
Correlation coefficient R2 for the energy calibration fit versus the detector number.
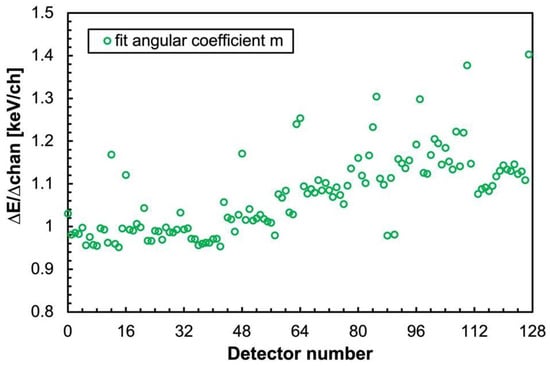
Figure 10.
Angular coefficient m for the energy calibration fit versus the detector number.
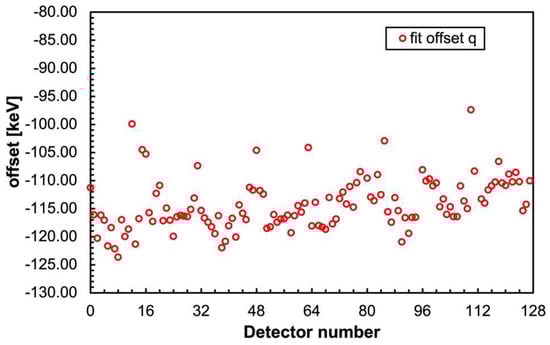
Figure 11.
Offset q for the energy calibration fit versus the detector number.

Figure 12.
Energy calibration cross-check for the 128 detectors: the resulting centroid energy of the Compton backscattering peak for the 511 and 662 keV gamma rays, expected at 170 and 184 keV, respectively, as a function of the detector number.

Figure 13.
The 128 calibrated spectra obtained with the 22Na source in the arrangement in Figure 7.
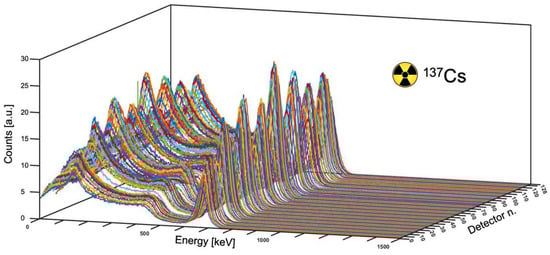
Figure 14.
The 128 calibrated spectra obtained with the 137Cs source in the arrangement in Figure 7.

Figure 15.
The 128 calibrated spectra obtained with the 60Co source in the arrangement in Figure 7.
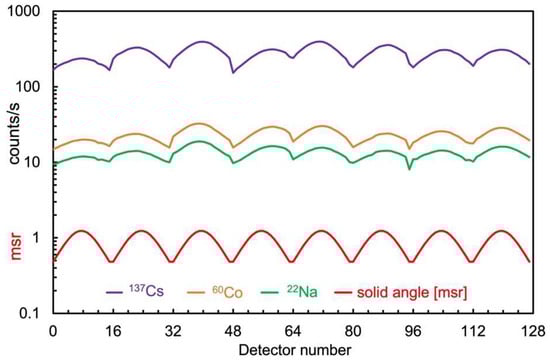
Figure 16.
Total counting rate as a function of the detector number for the three sources. The solid angle subtended by each detector is also plotted, assuming the perfect square arrangement of the boards in the calibration setup.
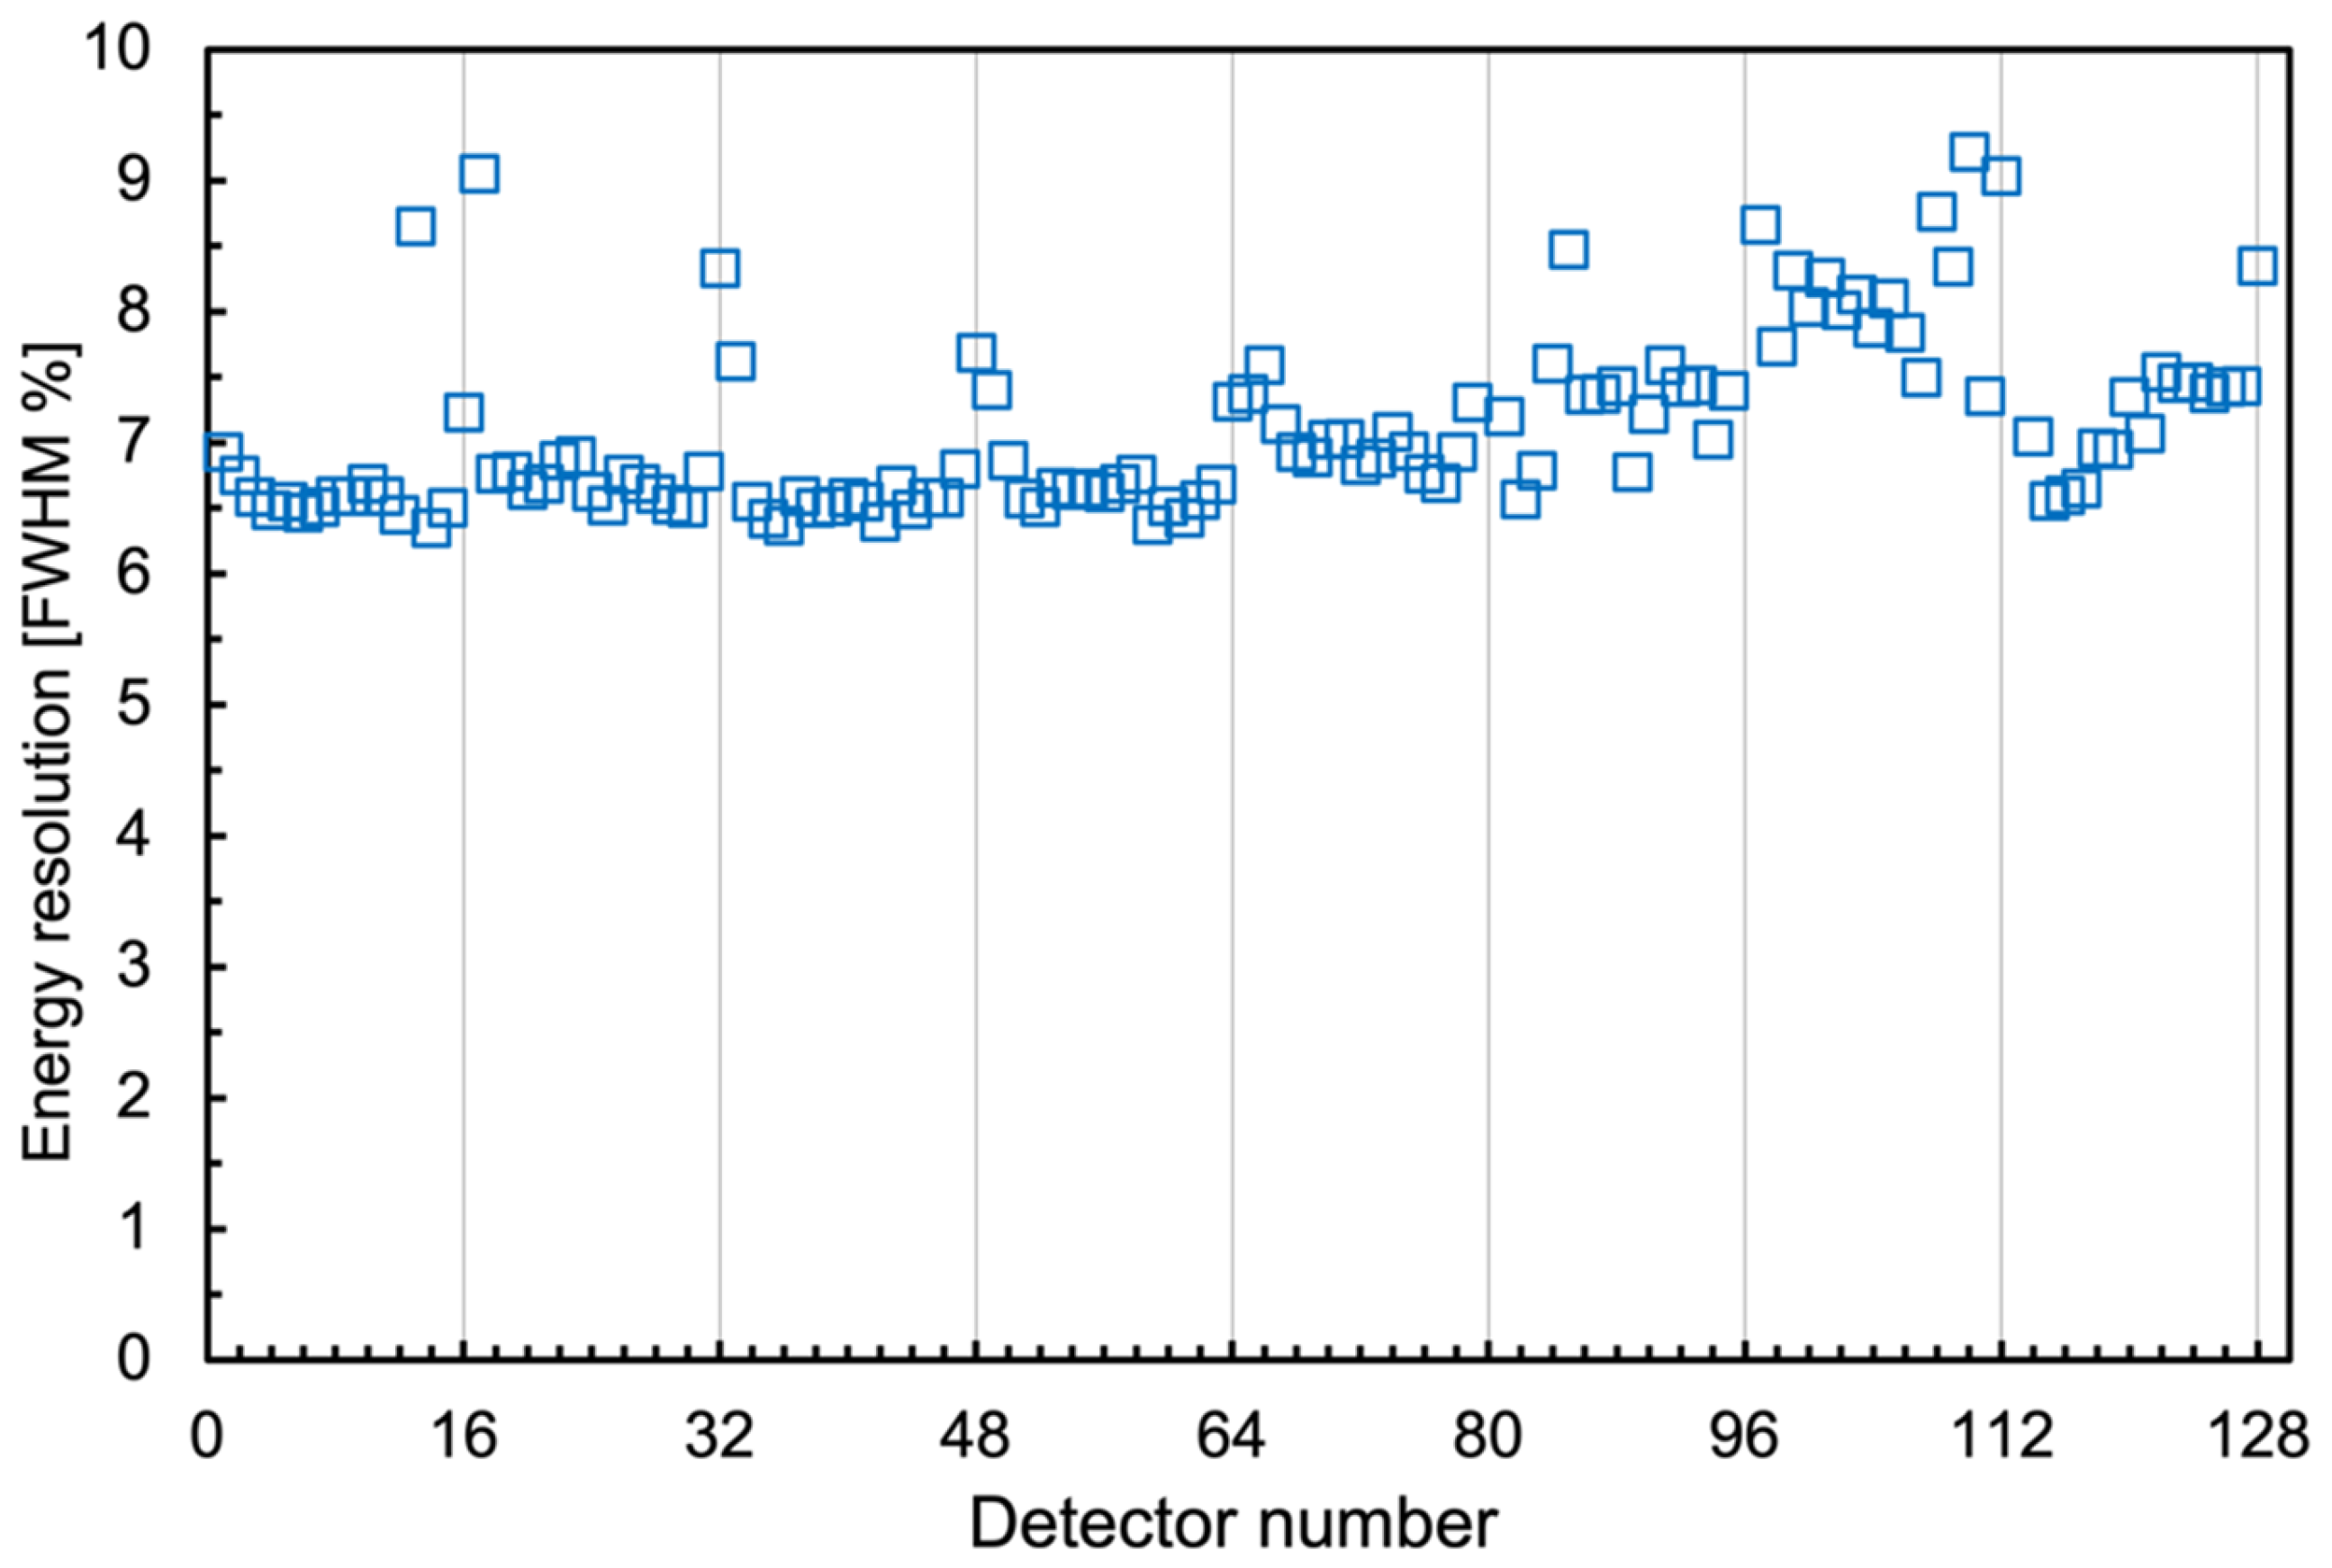
We determined the energy resolution of each detector as the full width at half maximum (FWHM) of the reference 137Cs peak at 662 keV. The values, as usual, were obtained by first fitting the peak with a Gaussian and then multiplying the resulting sigma value by 2.35. The resolution as a function of the detector number is plotted in Figure 17, where we observe a reasonable overall trend of around 7%, with a fraction of the detectors having a worse resolution, which never exceeds 9%. Remarkably, such energy resolution values, along with the full energy peak reconstruction at least up to 2000 keV, sound quite encouraging in light of the small 1 cm3 crystal size and the even smaller 6 × 6 mm2 active area of the SiPM.
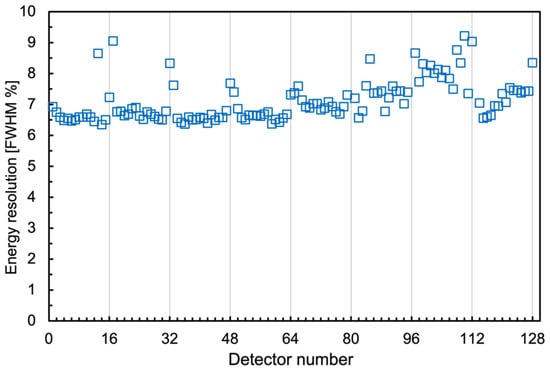
Figure 17.
Energy resolution as a function of the detector number, determined as the FWHM of the 662 keV peak of 137Cs.
3.3. Scanner Tests
The eight detector boards were then assembled into two linear arrays, as in Figure 3d, and fastened on the scanner bridge by means of two small holes on each board through which the fixing screws were inserted. Boards SN01 to SN04 were arranged on the upper arm and SN05 to SN08 on the lower one, in both cases from left to right. The minimum distance between the top detectors and the table surface was 2.5 cm to allow for the source boxes’ height. The fixed distance between the lower detectors and the table was 2.1 cm by construction, but a modification to reduce it to a few mm is under way. The power supply unit and the data acquisition electronics were placed below the table. Extra care was taken to prevent any mechanical interference between the cables and the moving bridge.
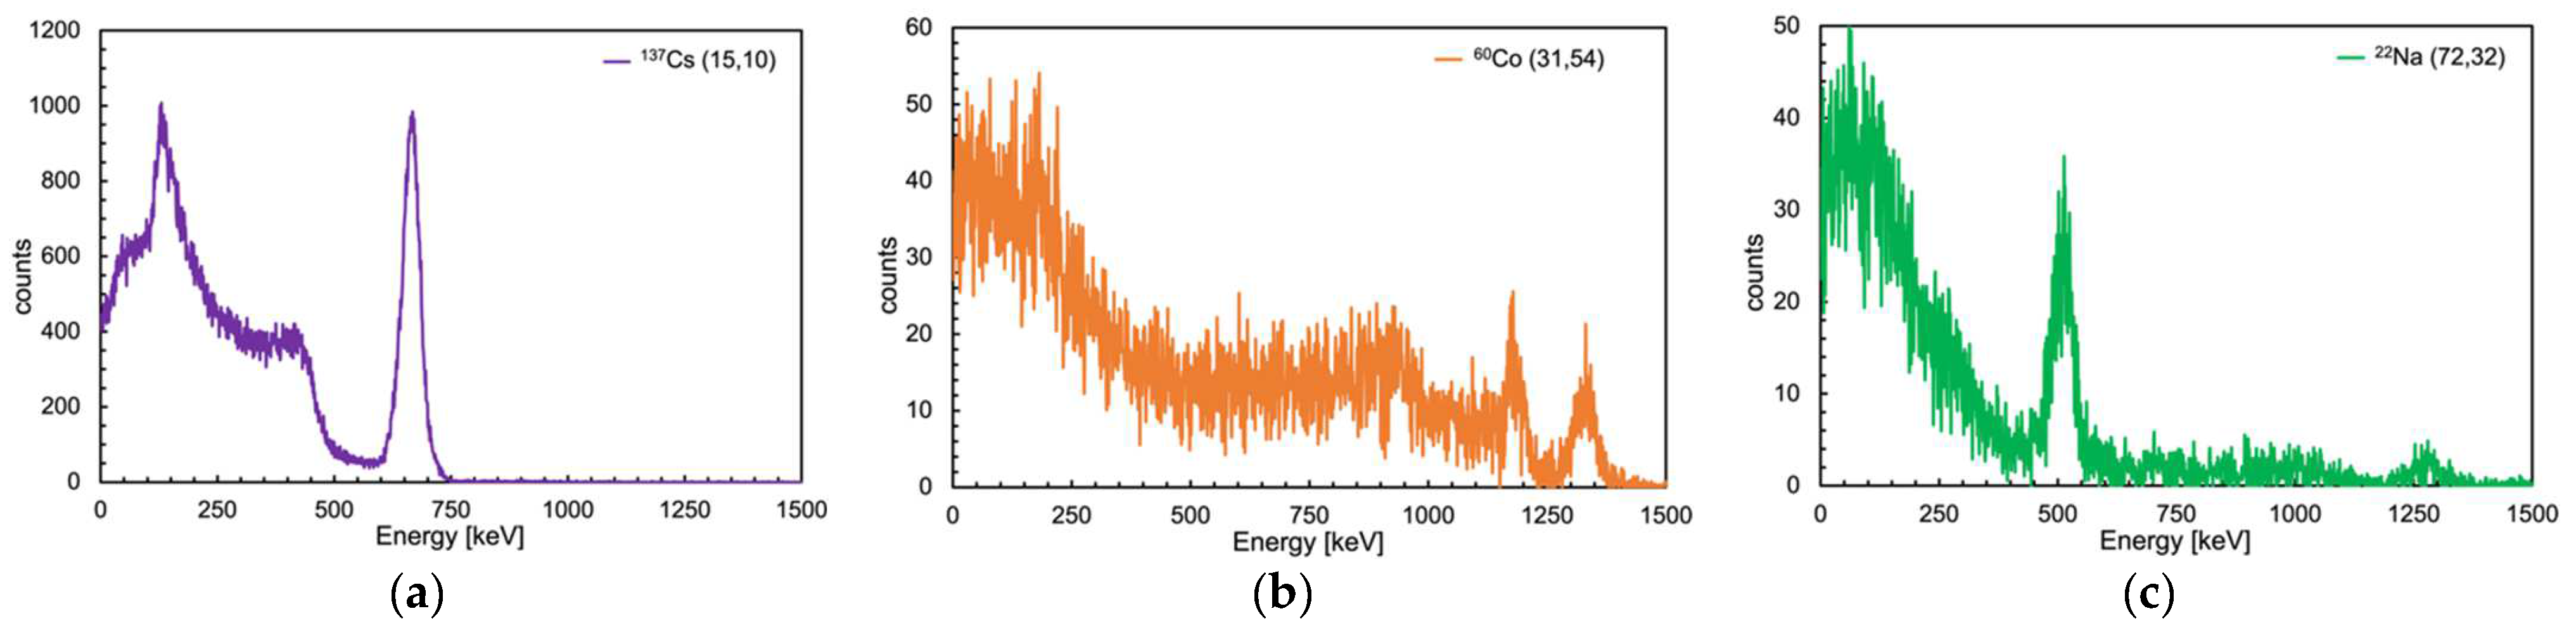
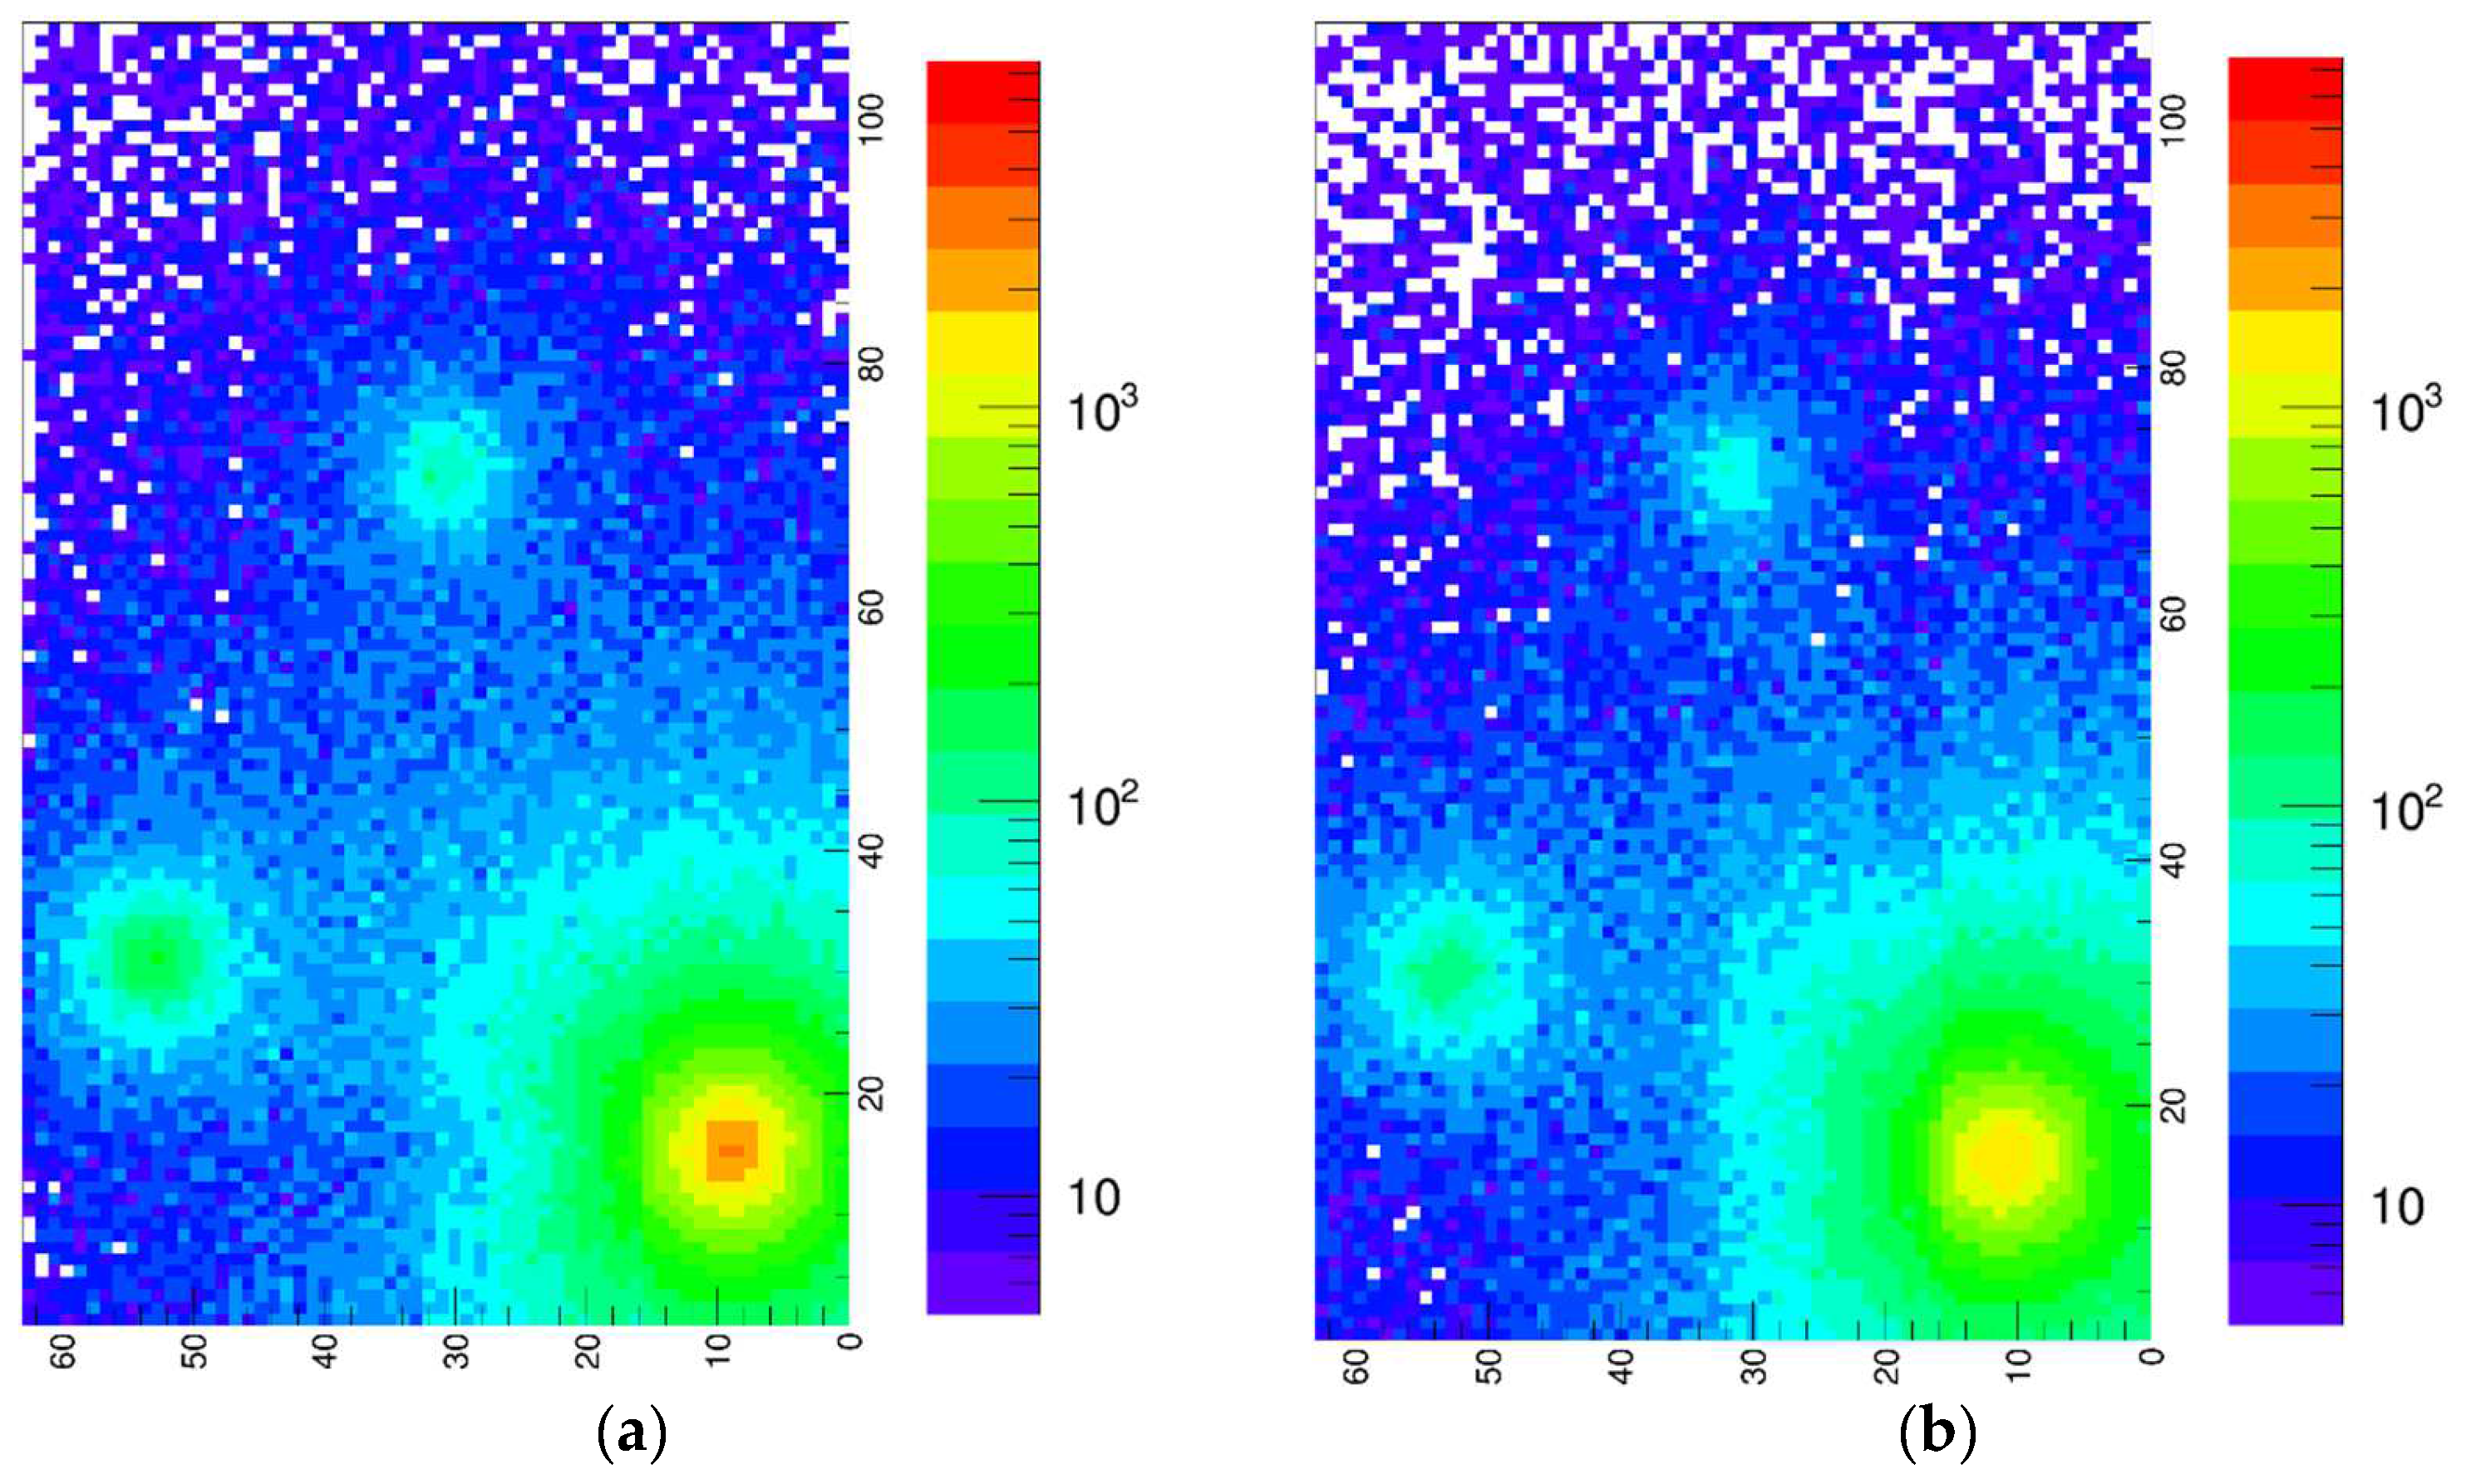
In order to test the scanner, we started by acquiring a fifteen minute background scan, which resulted of the order of 5 counts/s in each detector, and the corresponding images are shown in Figure 18. We remark that in all the images shown in the following, the background was subtracted. We then placed the three gamma sources listed in Table 2 on the table in three predefined positions, as indicated with crosses in Figure 1a, approximately at coordinates (72,32), (31,54), (15,10) (Figure 19b). The sources were located in thin plastic boxes, and the vertical distance between the source and the detector array was 14 mm (top) and 33 mm (bottom), respectively. A scan of fifteen minutes at a constant speed was programmed, i.e., 8.3 s/cm (sliding speed of 0.12 cm/s), which we deemed could provide more than reasonable counting statistics. In Figure 19a,c, we show the results of the scan, both for the top and bottom views, along with the corresponding picture of the setup. Indeed, these are raw data, with the same numerical threshold set for all the detectors. For a more refined analysis, one could use energy-calibrated data and impose a threshold in the energy. Nevertheless, even with raw data, the presence of the three hot-spots is outstanding. We remark that the plot binning is 1 cm on the Y (i.e., the detector size), whereas it is 1 mm on the X (the sliding direction). A dedicated one-minute data acquisition was then performed on the position of each detected hot-spot, and the resulting spectra are shown in Figure 20.
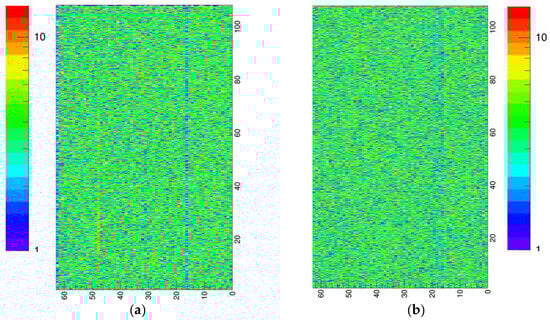
Figure 18.
Background images, i.e., from a scan without sources. (a) Top view. (b) Bottom view.
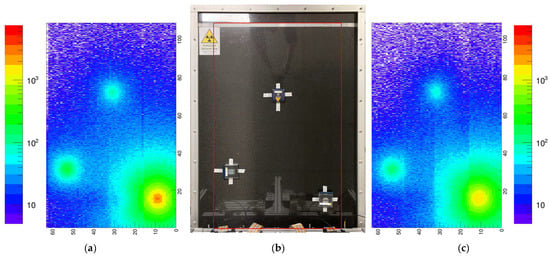
Figure 19.
(a) Result of the gamma scan with the three sources, top view. (b) The three sources placed on the table. (c) Result of the gamma scan with the three sources, bottom view.
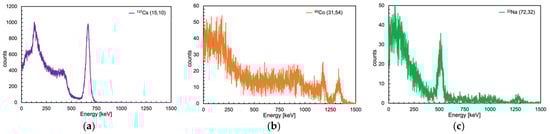
Figure 20.
Spectra from three dedicated one-minute data acquisitions on the three detected hot-spots. (a) 137Cs. (b) 60Co. (c) 22Na.
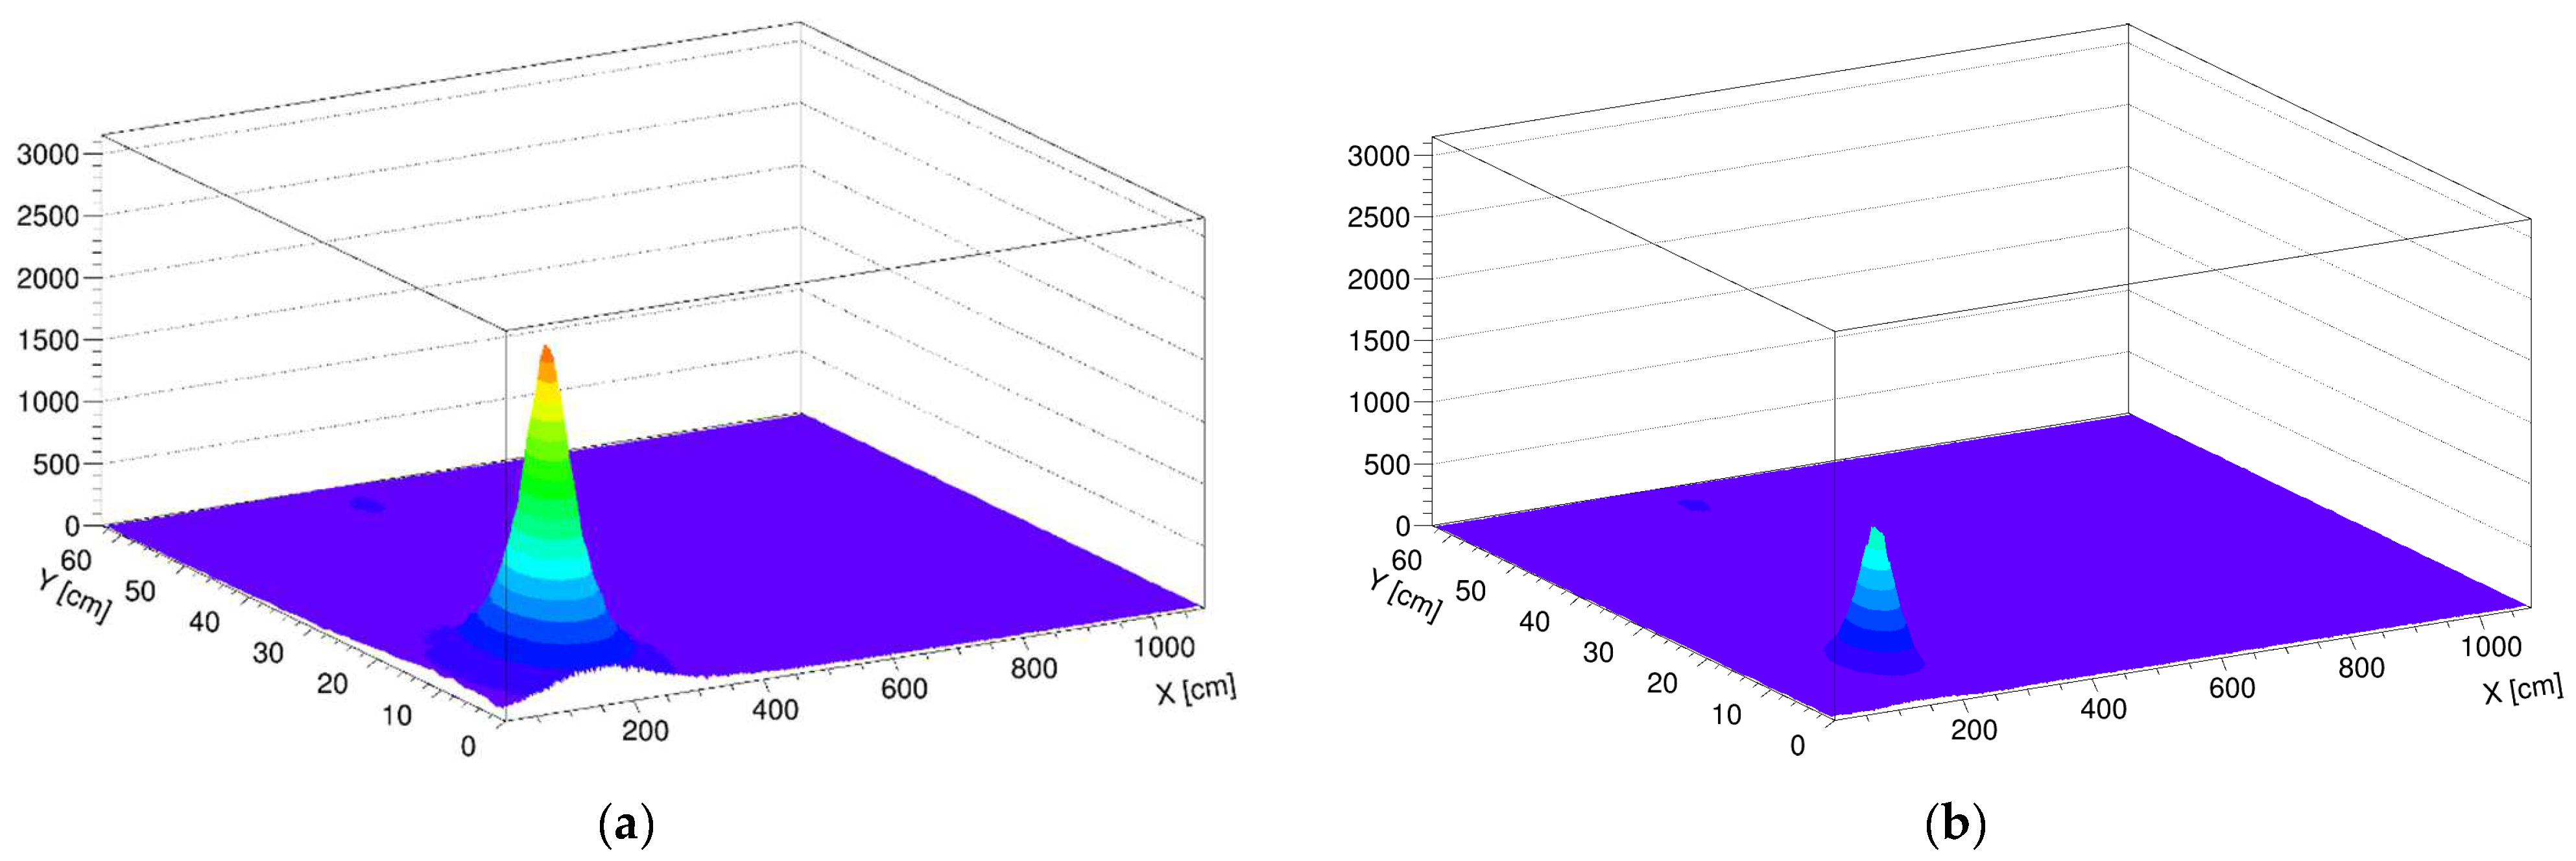
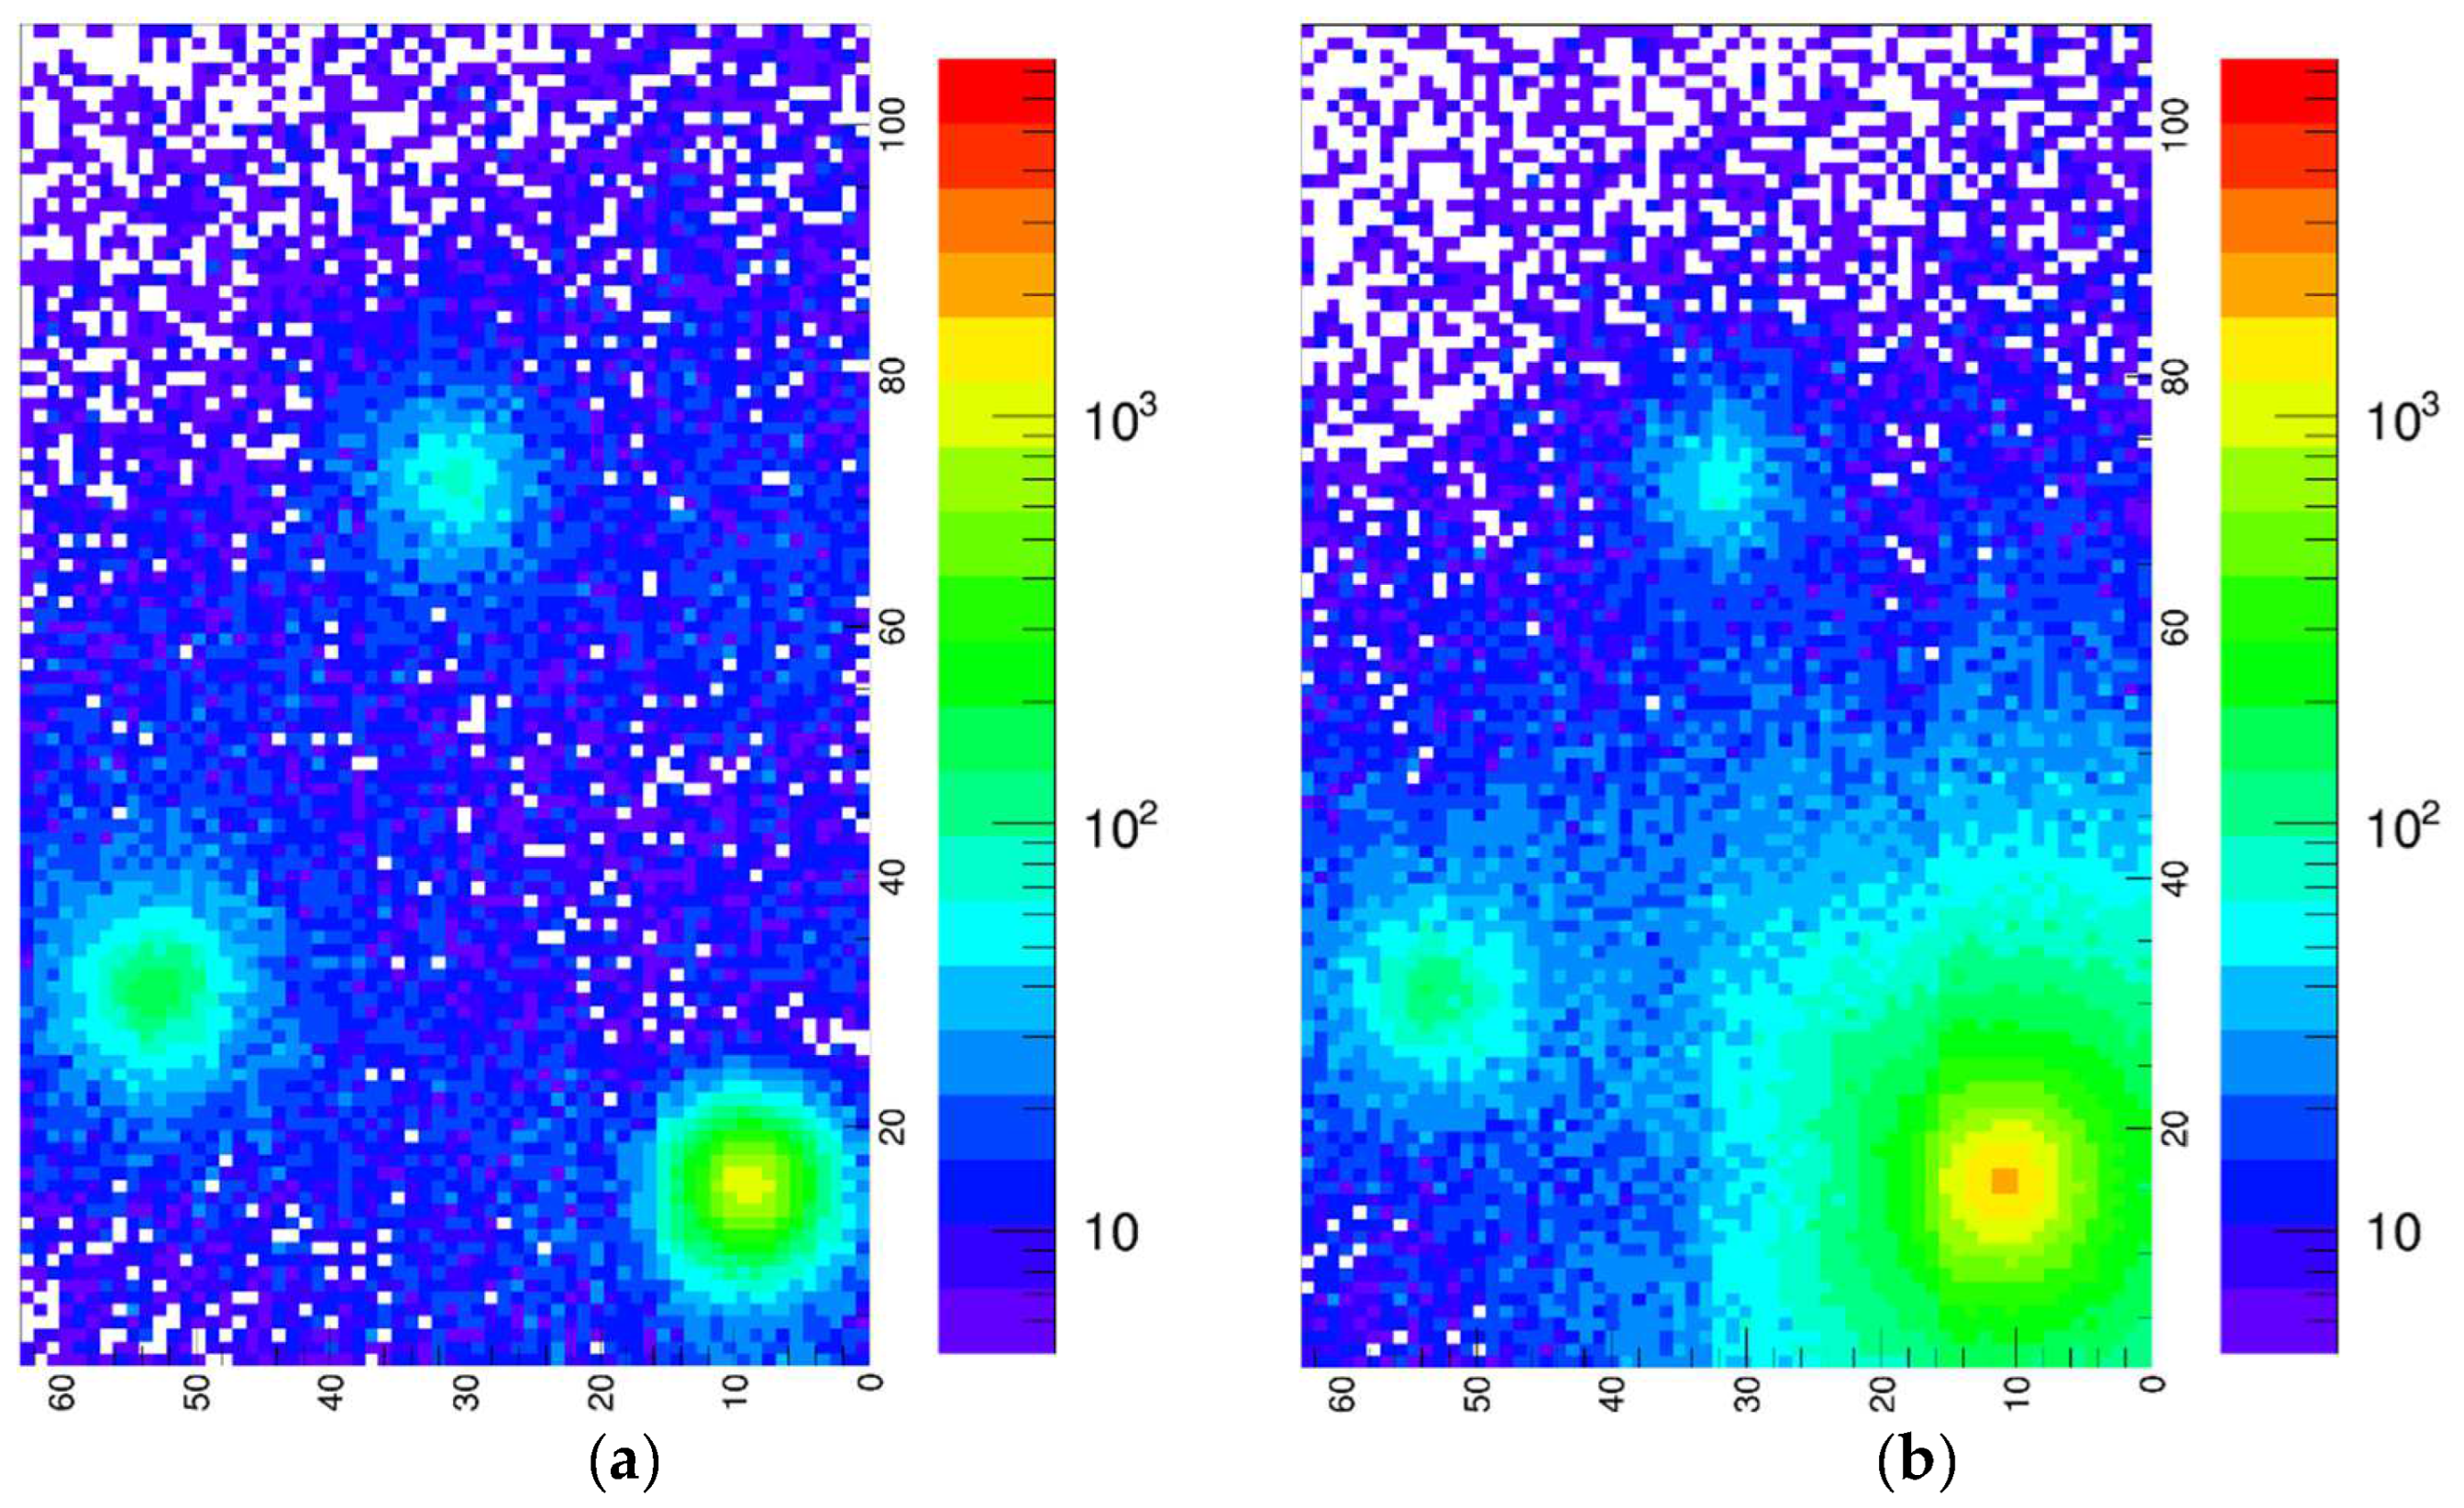
A second test was performed by placing a 1 cm thick lead plate on top of the 137Cs source, and the resulting plots are shown in Figure 21. The hot-spot in the top view is strongly reduced, even though it is still the most intense, as expected, as can be better appreciated in Figure 22, where the top view plots, with and without the lead shield, are shown in a linear scale in a 3D representation. The expected transmission through the lead plate is not easy to evaluate, as the attenuation coefficients provided by NIST [31] are provided for an ideal pencil beam, whereas in our case the radiation comes from a close point-like source. Nonetheless, from the data collected in the 1 × 1 cm2 pixel reporting the maximum number of counts, we calculated the transmission of the 137Cs gamma rays with three different approaches and compared the results with the value deduced using the NIST mass–energy absorption coefficient [31]. In the first approach, we simply calculated the ratio between the integrals of the two spectra. Then, we calculated the same ratio but limiting the integral to the 662 keV peak area. The third approach was to calculate the total deposited energy by summing the energy bin by bin, weighted with the number of counts in the bin. The results, listed in Table 4, show measured values that are basically self-consistent, while there is a difference with respect to the NIST value, which is likely due to the difference between the real and ideal geometry. Indeed, a fraction of the radiation ideally destined for the pixel is scattered away while crossing the lead plate and thus is not recorded in the pixel itself, lowering the measured transmission value.
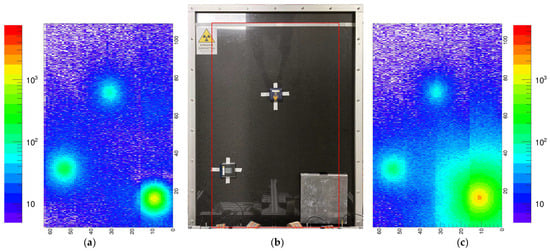
Figure 21.
Result of the gamma scan with the three sources and a lead plate (a) Top view. (b) The three sources placed on the table, the lead plate onto the 137Cs source. (c) Bottom view.
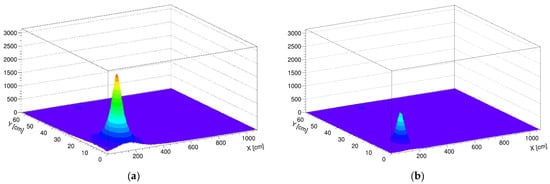
Figure 22.
(a) Top view plot for the scan without the lead plate, in a linear scale in a 3D representation. (b) Same plot for the scan with the lead plate.
Table 4.
The 137Cs gamma-ray transmission through the 1 cm lead plate, as measured with three approaches and calculated via the NIST table [31].
As in real applications the speed can be a relevant requirement, we also tested the data quality at a ten times faster scanning speed, i.e., with a total duration of 1.5 min. In this case, in order to improve the statistics, the plots were also binned at 1 cm along the X (sliding direction). We obtained basically the same images with worse statistics, but the hot-spots are still recognized, as - can be seen in Figure 23 for the free sources scan and in Figure 24 for the case when the lead plate was on the 137Cs source.

Figure 23.
Result of the 1.5 min gamma scan. (a) Top view. (b) Bottom view.
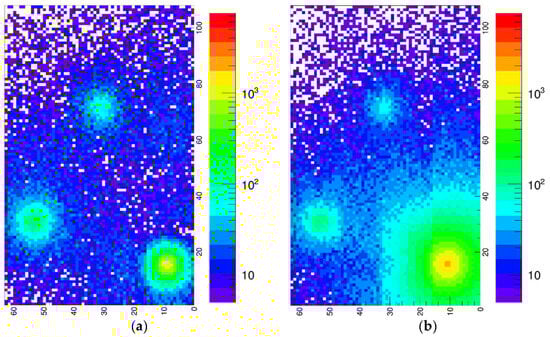
Figure 24.
Result of the 1.5 min gamma scan with the lead plate on the 137Cs source. (a) Top view. (b) Bottom view.
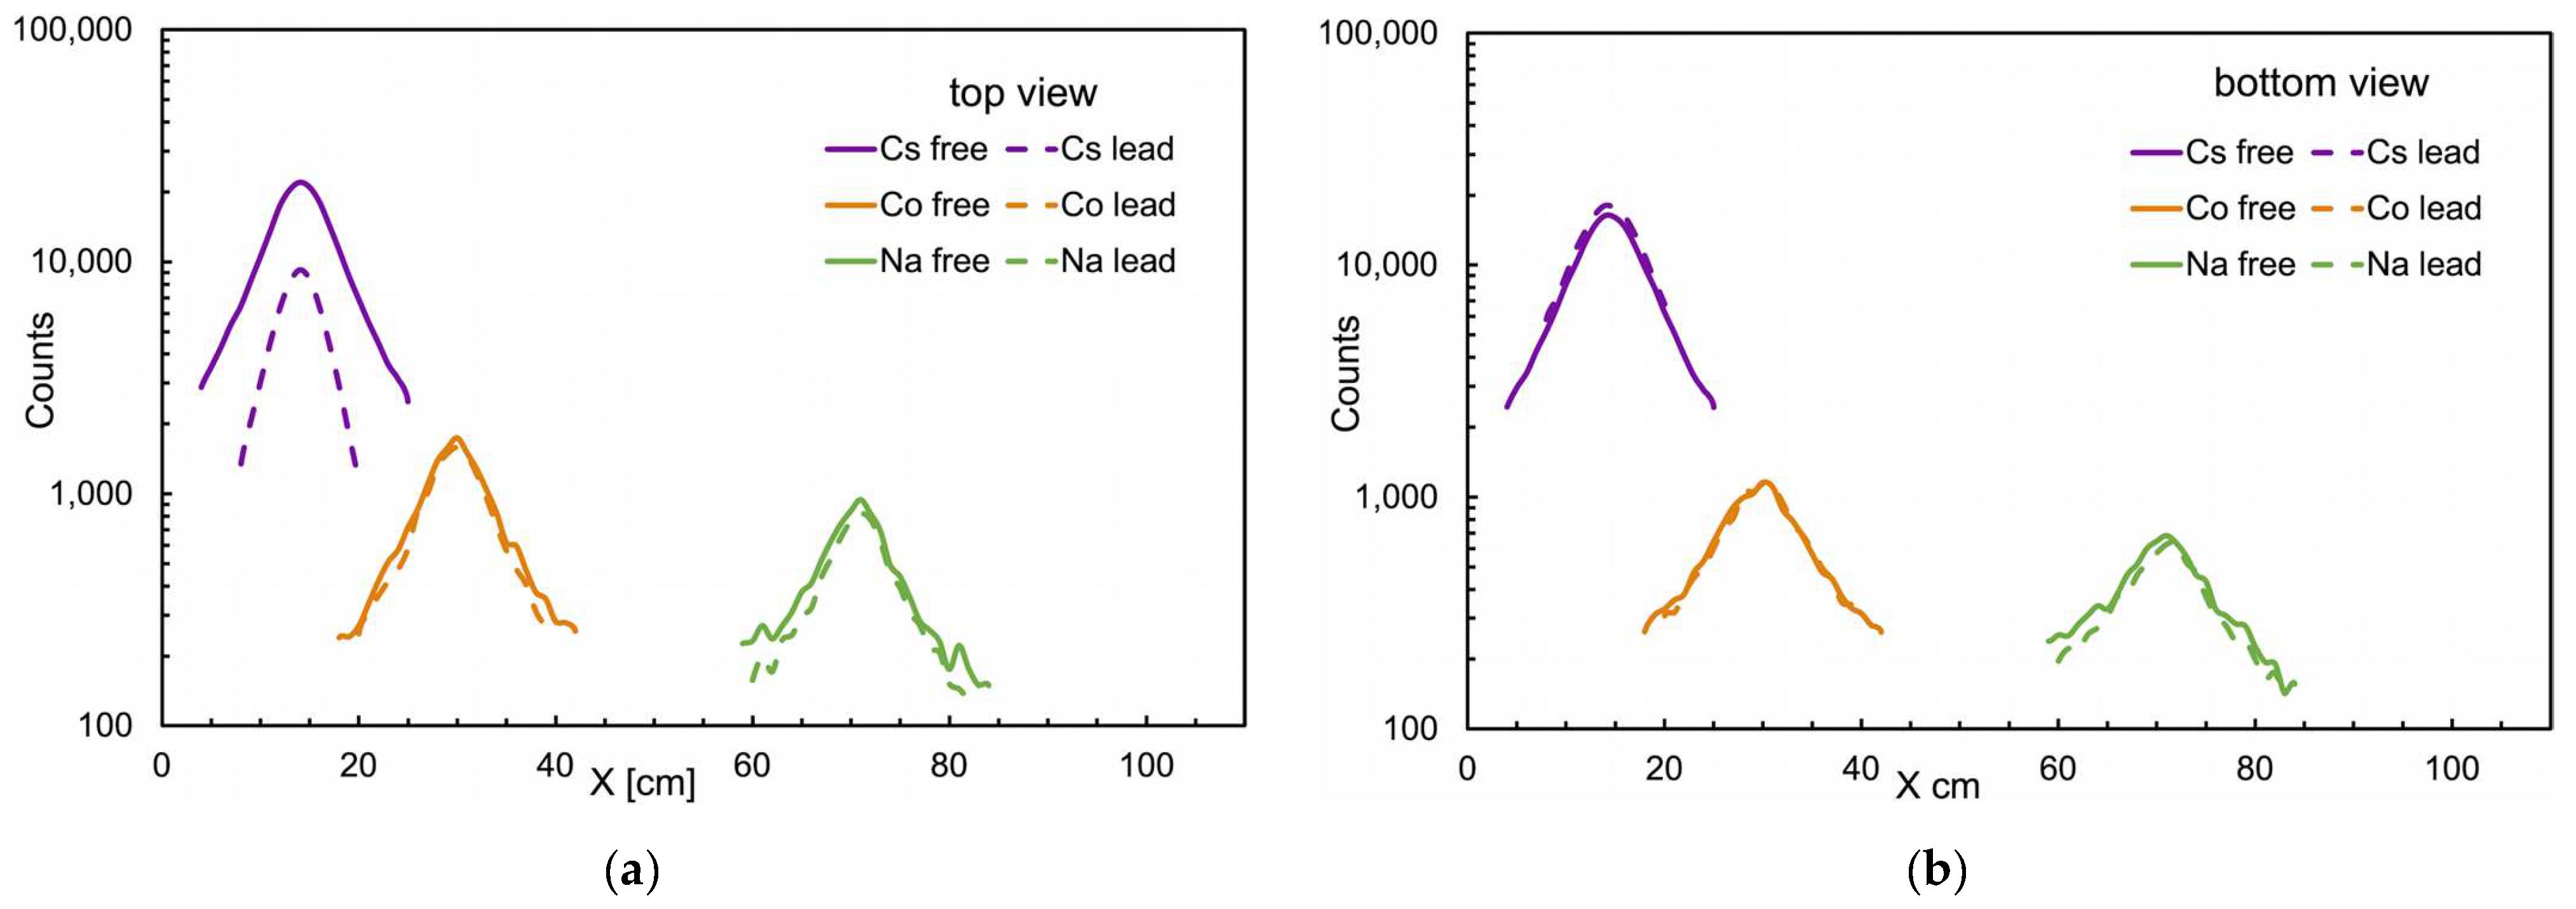
For both 15 min test data, we cut an X and a Y slice, 1 cm wide, on the maximum of each hot-spot, obtaining the 6 × 2 × 2 corresponding bell-shaped curves shown in Figure 25: six X and six Y profiles, from scans with and without lead, in the top and bottom views. The difference between the scans with and without the lead plate on the 137Cs source is evident in the top views. All these curves were fitted with Gaussian functions, and the resulting values are listed in Table 5. Remarkably, the uncertainties are roughly between 2 and 3 cm, and they are of the same order as the distance from the sources.
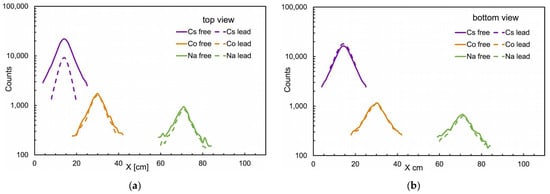
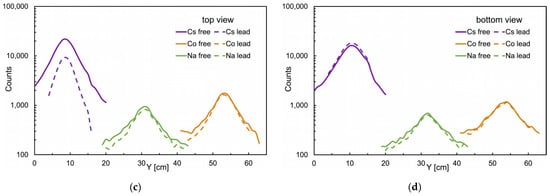
Figure 25.
Plots of 1 cm wide slices cut on the maximum of each hot-spot for the two scans with and without the lead plate on the 137Cs source. (a) In the X direction, top view. (b) In the X direction, bottom view. (c) In the Y direction, top view. (d) In the Y direction, bottom view.
Table 5.
Position and uncertainty resulting from Gaussian fits on the curves in Figure 25.
4. Discussion
The data obtained during the characterization of the detectors make it possible to provide a reasonable estimate of the minimum detectable activity (MDA) for a single detector element. To this end, we referred to the 662 keV gamma rays from a point-like 137Cs source and assume an average background rate of about 5 counts/s, as measured with the employed low threshold (Figure 18). We also assumed that the background is previously evaluated in ten seconds, whereas the count data are collected during one second. The gamma interaction probability in 1 cm of CsI(Tl) is about 0.3 and the geometrical efficiency is a function of the distance between the source and the detector. The MDA values at the 95% confidence level (in Becquerel) were calculated for several distances by means of Equation (1) [32,33,34],
where
Rb = background count rate assumed 5 counts/s,
ts = sample count time assumed 1 s,
tb = background count time assumed 10 s,
E = detector efficiency in counts/decay, i.e., 0.3 times the geometric efficiency that varies with the distance,
C = conversion factor to other units, in our case it is 1.
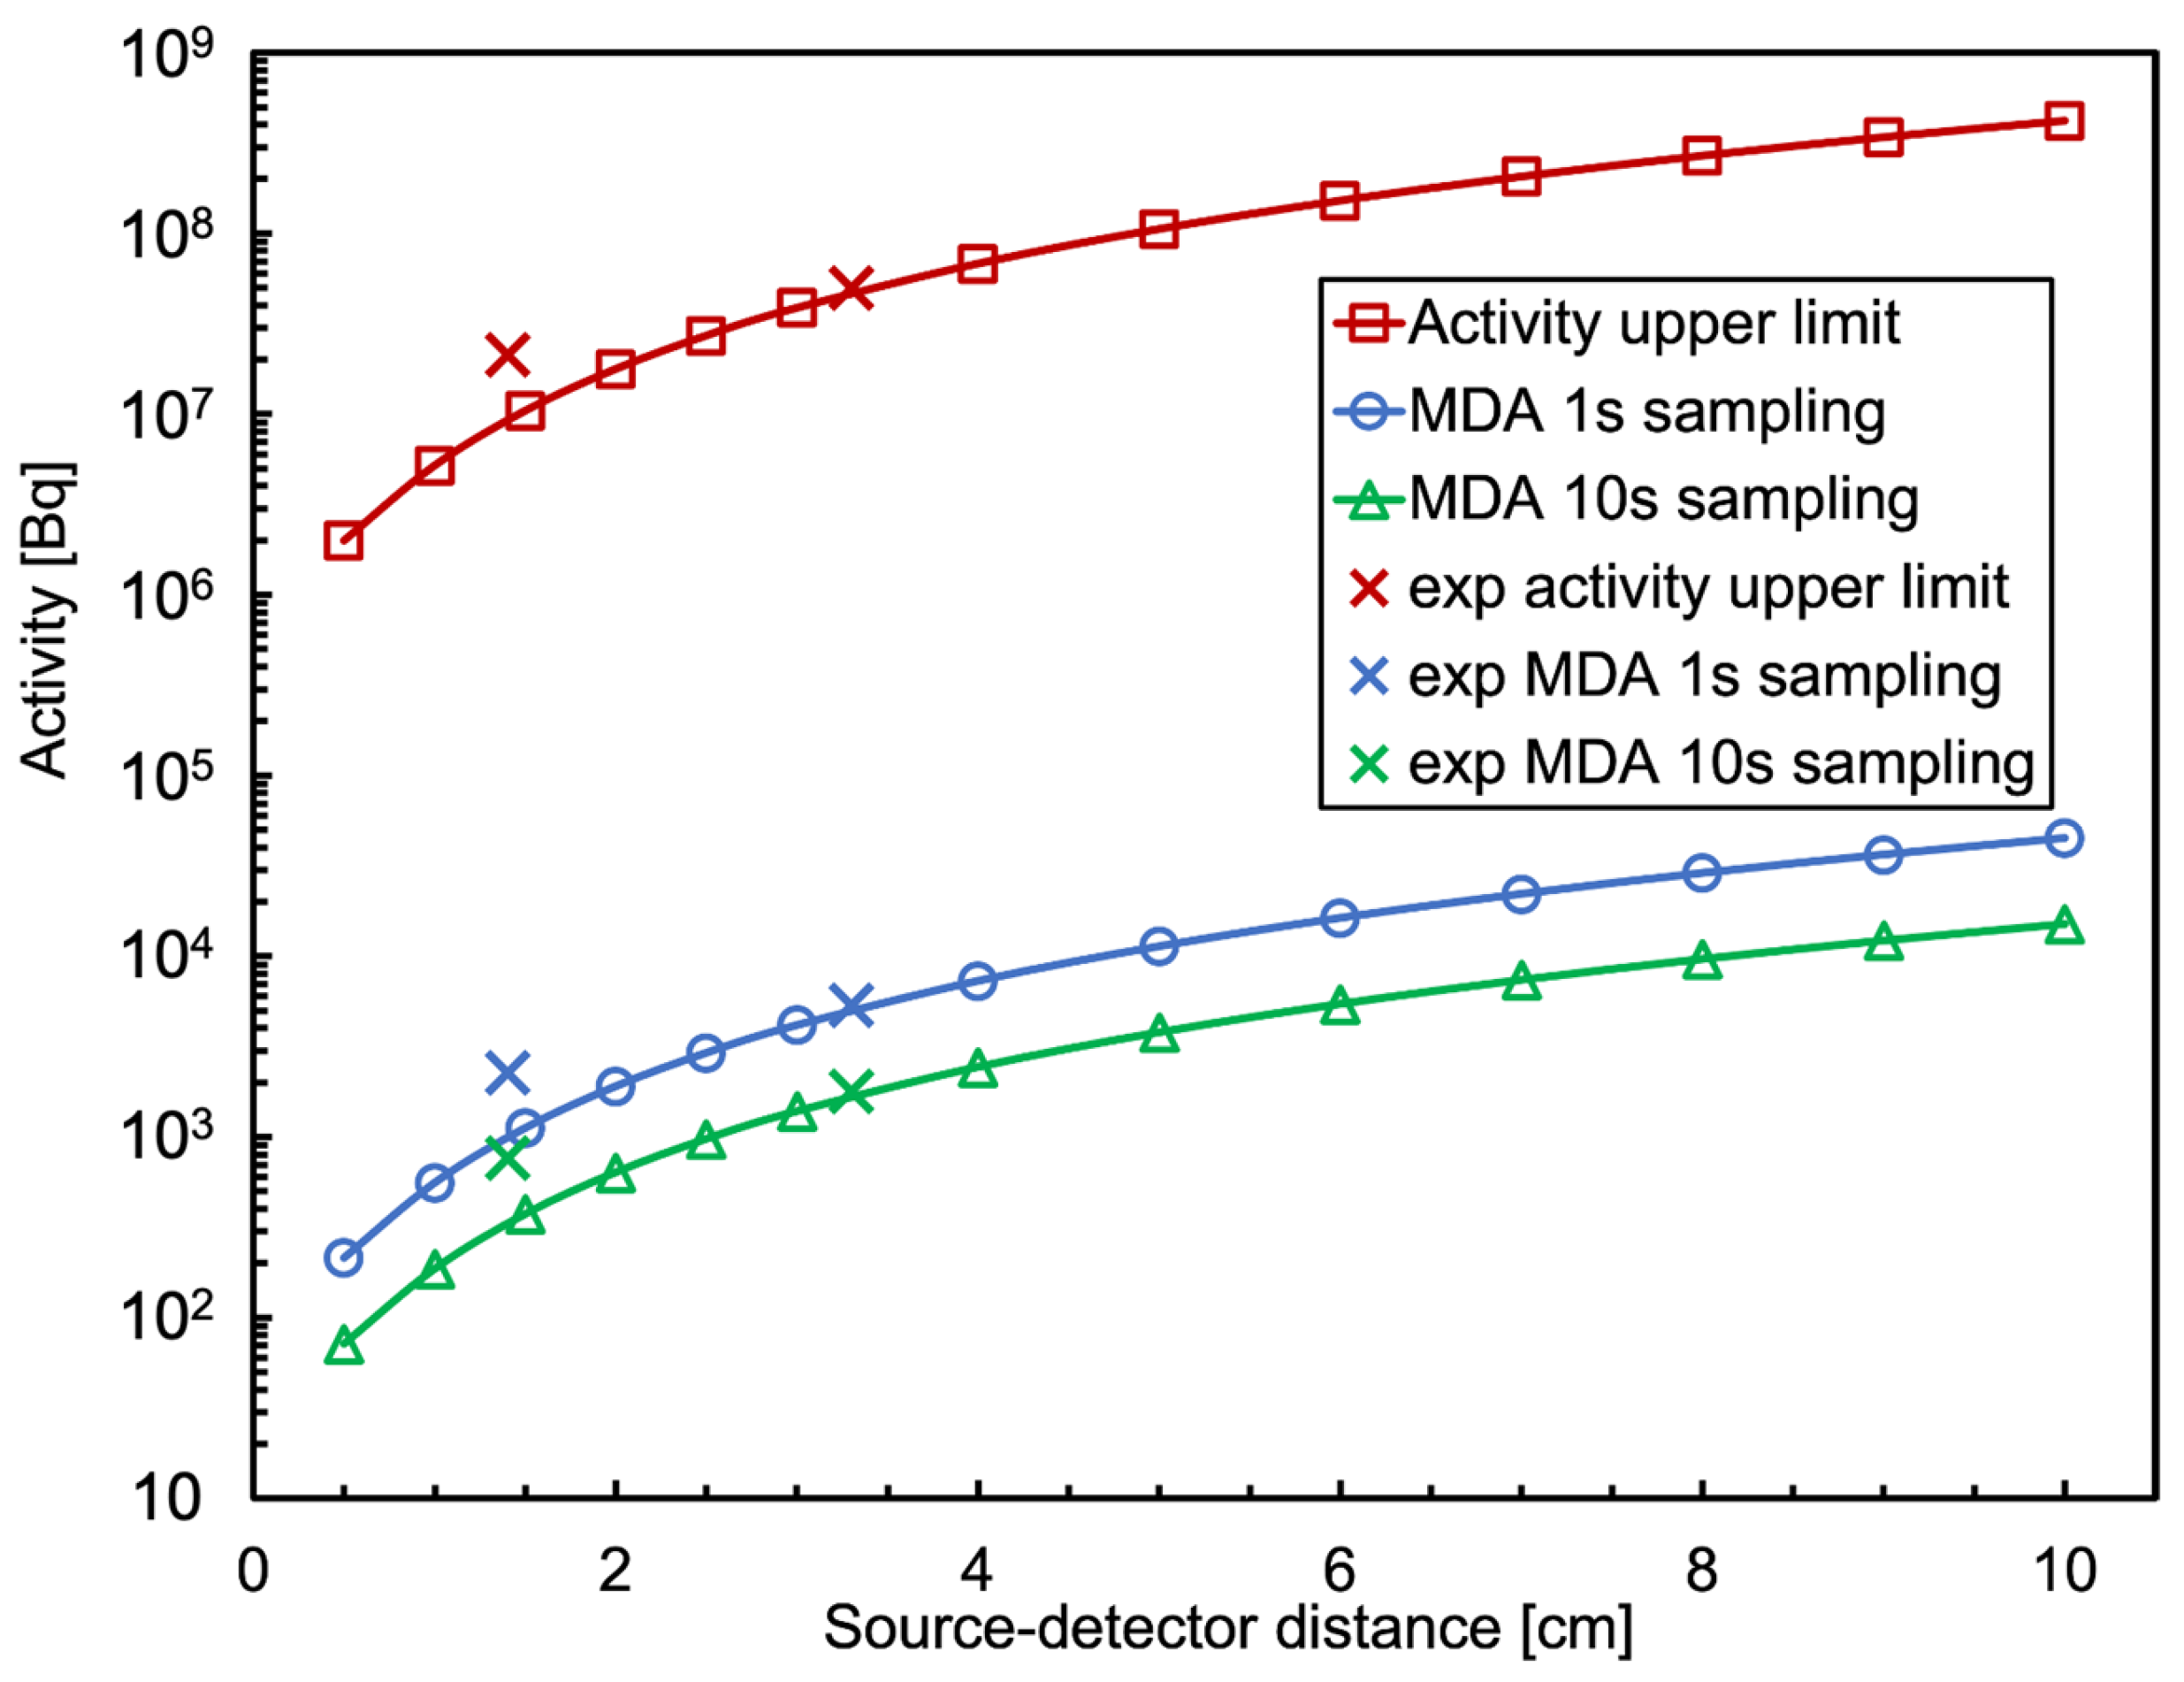
The results are plotted in Figure 26. At a 10 cm distance, the MDA is about 32 kBq, whereas at 0.5 cm, that is when the detector is very close to the carbon fiber plane, it becomes about 200 Bq. This configuration will be made possible in the near future when the bottom detectors will be reassembled in an improved mechanical setup closer to the plane. We remark that these numbers refer to a single 1 cm3 detector and a point-like unshielded source, just to provide some reference figures. In case of a longer sampling time, e.g., 10 s, the MDA improves as also shown in the figure.
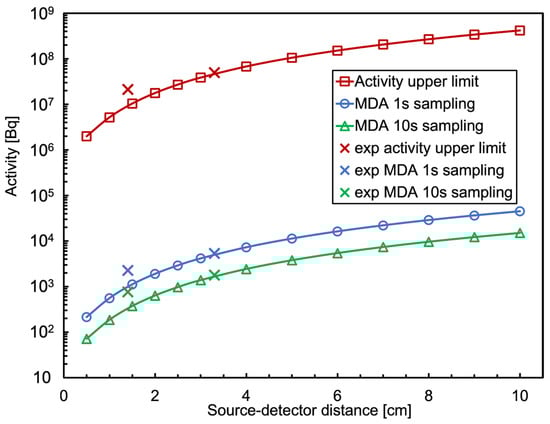
Figure 26.
Operational range of a 1 cm3 CsI(Tl) detector, between minimum detectable activity and activity upper limit, as a function of its distance from a point-like 137Cs source. The points with crosses are experimental values for a short distance (see the text). Shown are two cases with a 1 s and 10 s sampling time, respectively.
However, when the detector is closer to the source, the effective average thickness seen by the radiation decreases due to incident angles far from 90°. This leads to an interaction efficiency less than the above-mentioned value of 0.3, and the effect can be easily appreciated by looking at the measured counting rates. Indeed, starting from the measured counting rate at 14 mm (top detector) and 33 mm (bottom detector), we calculated the expected source activity using an interaction efficiency of 0.3. The results were 0.6 MBq and 1.28 MBq, respectively, to be compared with the real activity of 1.4 MBq. In order to obtain the real activity, one has to assume interaction efficiency of 0.13 and 0.28, respectively. The corresponding MDA values are 2284 Bq at 14 mm (765 Bq with 10 s sampling) and 5357 Bq at 33 mm (1795 Bq with 10 s sampling).
We do not claim these MDA values to be exact, but they can be taken as a reference and prove that a scan of about 1.5 min (i.e., ≈1 s/cm) makes it possible to successfully detect gamma hot-spots with activity in the order of 2000 Bq. The top–bottom dual scan can account for vertically extended radioactive objects by looking at the difference in the counts between corresponding positions. Considering that even a 1 cm thick lead plate does not suppress but only attenuates the 662 keV radiation by about 50%, we are planning for possible coarse 3D reconstructions of the radioactivity though with some large uncertainty in the vertical direction.
Another limitation of the system could be the limited high-rate capability. Indeed, the 20 µs integration time we employed can be reduced to 5 µs with little influence on the energy resolution, thus implying an upper limit in the order of 100,000 counts/s. By means of the previous calculation, we were able to translate this limit into an ideal activity upper limit as a function of the distance and we plotted it in Figure 26 as well. The same considerations regarding the reduced interaction efficiency at a short distance produce here a benefit, because it raises the activity limit at a short distance to a few 107 Bq.
This limit can be improved if one releases the constraint on the energy resolution and employs an even shorter integration gate, or if one makes use of a faster scintillator (e.g., BGO) and gives up on the gamma-ray identification. We are also planning for some development and tests of this strategy.
In light of the high-quality results obtained with small CsI(Tl) crystals coupled to the SiPMs, both in single and in multiple units, and strengthened by the rather low cost (crystal + SiPM about EUR 80), we envisage opening up a field of possible applications. The first one we plan to face could be the monitoring of spent fuel in the cooling pools for safeguarding operations. Indeed, a set of detectors shaped as a “collar” could be assembled into a waterproof box and installed on a vertical sliding arm to scan the full length of the fuel rod assemblies to verify their integrity and historical self-consistency.
5. Conclusions
The PI3SO project at INFN Laboratori Nazionali del Sud was discussed. A low-cost solution was proposed for a spectroscopic gamma-ray-scanning system that maps and locates gamma-emitting radioactive hot-spots by producing space-resolved proximity images from above and below an operational table. A mechanical sliding system and a full set of radiation detectors was designed and optimized for this task. The preliminary system tests showed remarkable mechanical capabilities in terms of the speed and programmability. The developed gamma radiation detectors were confirmed to be reliable, with a good energy resolution and sensitivity. The minimum detectable activity was quantified as a function of the distance from the detectors, as well as the activity upper limit, and looks quite promising in view of the possible mechanical improvements and/or detectors’ replacement with faster ones if required. We are also confident that this work can pave the way for several possible modular applications of our single detection element in the fields of safety, security and safeguards.
Author Contributions
Conceptualization, G.E.P., P.F. and L.C.; methodology, G.E.P. and P.F.; software, G.V., G.E.P., S.A. and P.F.; formal analysis, C.R.F., G.E.P. and P.F.; investigation, G.E.P., C.R.F. and P.F.; resources, F.L.; data curation, C.R.F. and P.F.; writing—original draft preparation, C.R.F. and P.F.; writing—review and editing, P.F., G.E.P., C.R.F., S.A., L.C., F.L. and G.V.; supervision, G.E.P., L.C. and P.F.; project administration, P.F. and L.C.; funding acquisition, G.E.P. All authors have read and agreed to the published version of the manuscript.
Funding
This research was funded by the INFN-Energy committee.
Data Availability Statement
The data presented in this study are available upon request from the corresponding author.
Conflicts of Interest
The authors declare no conflicts of interest.
References
- Decommissioning of Nuclear Installations. Available online: https://www.iaea.org/topics/decommissioning (accessed on 19 July 2024).
- International Atomic Energy Agency. Status of Technology for Volume Reduction and Treatment of Low and Intermediate Level Solid Radioactive Waste; Technical Reports Series No. 360; IAEA: Vienna, Austria, 1994. [Google Scholar]
- International Atomic Energy Agency. Status and Trends in Spent Fuel and Radioactive Waste Management; No. NW-T-1.14 (Rev. 1); IAEA: Vienna, Austria, 2022. [Google Scholar]
- Donovan, J. Robots, AI and 3D Models: How High-Tech Breakthroughs Help Nuclear Decommissioning. Available online: https://www.iaea.org/bulletin/robots-ai-and-3d-models-how-high-tech-breakthroughs-help-nuclear-decommissioning (accessed on 19 July 2024).
- Monk, S.D.; West, C.; Bandala, M.; Dixon, N.; Montazeri, A.; Taylor, C.J.; Cheneler, D. A Low-Cost and Semi-Autonomous Robotic Scanning System for Characterising Radiological Waste. Robotics 2021, 10, 119. [Google Scholar] [CrossRef]
- Querfurth, F. Innovative Robotics for Radwaste Management. 5 April 2022. Available online: https://www.neimagazine.com/features/featureinnovative-robotics-for-radwaste-management-9602466/ (accessed on 14 May 2024).
- Blank, A.; Havenith, A.; Kohn, S.; Querfurth, F.; Zwingel, M.; Metzner, M.; Franke, J. Robotic Technologies for Volume-Optimized Conditioning of Radioactive Waste—VIRERO. In Proceedings of the 9th International Conference on Nuclear Decommissioning, Aachen, Germany, 12–14 November 2020. [Google Scholar]
- MICADO Project. Available online: https://www.micado-project.eu/ (accessed on 19 July 2024).
- Pescatore, C. Safety, safety case and society—Lessons from the experience of the Forum on Stakeholder Confidence and other NEA initiatives. In The Safety Case for Deep Geological Disposal of Radioactive Waste: Proceedings of the 2013 State of the Art. Symposium Proceedings, Paris, France, 7–9 October 2013; NEA: Paris, France; p. 391.
- Radioactive Waste Strategy. Available online: https://assets.publishing.service.gov.uk/government/uploads/system/uploads/attachment_data/file/838828/Radioactive_Waste_Strategy_September_2019.pdf (accessed on 14 May 2024).
- Radioactive Waste Management. Available online: https://world-nuclear.org/information-library/nuclear-fuel-cycle/nuclear-waste/radioactive-waste-management (accessed on 19 July 2024).
- General Safety Guide No. GSG-1; Classification of Radioactive Waste; IAEA Safety Standards: Vienna, Austria, 2009.
- Sort and Segregate Nuclear Waste. Available online: https://assets.publishing.service.gov.uk/media/5f17f6a23a6f40727bf9fe12/Sort_and_Segregate_Nuclear_Waste_Specification.pdf (accessed on 14 May 2024).
- Verbelen, Y.; Martin, P.G.; Ahmad, K.; Scott, T.B. Miniaturised Low-Cost Gamma Scanning Platform for Contamination Identification, Localisation and Characterisation: A New Instrument in the Decommissioning Toolkit. Sensors 2021, 21, 2884. [Google Scholar] [CrossRef] [PubMed]
- Amoyal, G.; Schoepff, V.; Carrel, F.; Michel, M.; Blanc de Lanaute, N.; Angélique, J.C. Development of a hybrid gamma camera based on Timepix3 for nuclear industry applications. Nucl. Instr. Meth. A 2021, 987, 164838. [Google Scholar] [CrossRef]
- Venkataraman, R.; Villani, M.; Croft, S.; McClay, P.; McElroy, R.; Kane, S.; Mueller, W.; Estep, R. An integrated Tomographic Gamma Scanning system for non-destructive assay of radioactive waste. Nucl. Instr. Meth. A 2007, 579, 375. [Google Scholar] [CrossRef]
- Poma, G.E.; Cosentino, L.; Longhitano, F.; Finocchiaro, P. Hot-spots finding with modular gamma-ray system for sort and segregate activities. EPJ Web Conf. 2023, 288, 06007. [Google Scholar] [CrossRef]
- Alara Principle CDC Radiation and Health. Available online: https://www.cdc.gov/nceh/radiation/alara.html (accessed on 14 May 2024).
- European Alara Network. Available online: https://www.eu-alara.net/ (accessed on 14 May 2024).
- Dolgoshein, B.; Balagura, V.; Buzhan, P.; Danilov, M.; Filatov, L.; Garutti, E.; Groll, M.; Ilyin, A.; Kantserova, V.; Kaplin, V.; et al. Status report on silicon photomultiplier development and its applications. Nucl. Instrum. Meth. A 2006, 563, 368. [Google Scholar] [CrossRef]
- Zappa, F.; Tisa, S.; Tosi, A. Cova, Principles and features of single-photon avalanche diode arrays. Sens. Actuators A 2007, 140, 103. [Google Scholar] [CrossRef]
- Finocchiaro, P.; Pappalardo, A.; Cosentino, L.; Belluso, M.; Billotta, S.; Bonanno, G.; Carbone, B.; Condorelli, G.; Di Mauro, S.; Fallica, G.; et al. Characterization of a Novel 100-Channel Silicon Photomultiplier—Part I: Noise. IEEE Trans. Electron. Devices 2008, 55, 2757. [Google Scholar] [CrossRef]
- Finocchiaro, P.; Pappalardo, A.; Cosentino, L.; Belluso, M.; Billotta, S.; Bonanno, G.; Carbone, B.; Condorelli, G.; Di Mauro, S.; Fallica, G.; et al. Characterization of a Novel 100-Channel Silicon Photomultiplier—Part II: Charge and Time. IEEE Trans. Electron Devices 2008, 55, 2765. [Google Scholar] [CrossRef]
- Longhitano, F.; Poma, G.E.; Cosentino, L.; Finocchiaro, P. A Scintillator Array Table with Spectroscopic Features. Sensors 2022, 22, 4754. [Google Scholar] [CrossRef] [PubMed]
- Rossi, F.; Cosentino, L.; Longhitano, F.; Minutoli, S.; Musico, P.; Osipenko, M.; Poma, G.E.; Ripani, M.; Finocchiaro, P. The gamma and neutron sensor system for rapid dose rate mapping in the CLEANDEM Project. Sensors 2023, 23, 4210. [Google Scholar] [CrossRef] [PubMed]
- Hamamatsu Catalog. Available online: https://www.hamamatsu.com/content/dam/hamamatsu-photonics/sites/documents/99_SALES_LIBRARY/ssd/s14160_s14161_series_kapd1064e.pdf (accessed on 14 May 2024).
- VX2745 Digitizer. Available online: https://www.caen.it/products/vx2745/ (accessed on 17 May 2024).
- COMPASS Multiparametric DAQ Software for Physics Applications. Available online: https://www.caen.it/products/compass/ (accessed on 17 May 2024).
- CLEANDEM EU Project Horizon 2020, GA 945335. Available online: https://cordis.europa.eu/project/id/945335/ (accessed on 17 May 2024).
- Ghassemi, A.; Sato, K.; Kobayashi, K. MPPC. Available online: https://www.hamamatsu.com/content/dam/hamamatsu-photonics/sites/documents/99_SALES_LIBRARY/ssd/mppc_kapd9005e.pdf (accessed on 17 May 2024).
- NIST: X-ray Mass Attenuation Coefficients—Lead. Available online: https://physics.nist.gov/PhysRefData/XrayMassCoef/ElemTab/z82.html (accessed on 16 July 2024).
- DOD; DOE; EPA; NRC. Multi-Agency Radiation Survey and Site Investigation Manual (MARSSIM), Revision 1, NUREG-1575, DOE/EH-0624, EPA 402-R-97-016; Department of Defense: Washington, DC, USA, 2000; p. 6.34. [Google Scholar]
- U.S. Nuclear Regulatory Commission (NRC). Derivation of the Currie Equations. Available online: https://www.nrc.gov/docs/ML1717/ML17178A298.pdf (accessed on 19 June 2024).
- Brodsky, A. Exact Calculation of Probabilities of False Positives and False Negatives for Low Background Counting. Health Phys. 1992, 63, 198–204. [Google Scholar] [CrossRef] [PubMed]


Disclaimer/Publisher’s Note: The statements, opinions and data contained in all publications are solely those of the individual author(s) and contributor(s) and not of MDPI and/or the editor(s). MDPI and/or the editor(s) disclaim responsibility for any injury to people or property resulting from any ideas, methods, instructions or products referred to in the content. |
© 2024 by the authors. Licensee MDPI, Basel, Switzerland. This article is an open access article distributed under the terms and conditions of the Creative Commons Attribution (CC BY) license (https://creativecommons.org/licenses/by/4.0/).