Article

Optimizing Selective Laser Melting of Inconel 625 Superalloy through Statistical Analysis of Surface and Volumetric Defects

1
Mechanical Engineering Department, Malayer University, Malayer 7R7X+8M5, Iran
2
Department of Mechanics, Mathematics and Management, Polytechnic University of Bari, Via Orabona 4, 70125 Bari, Italy
3
Department of Industrial, Mechanical and Aerospace Engineering, Buin Zahra Technical and Engineering University, Buin Zahra Q346+GVC, Iran
4
Department of Engineering, School of Science and Technology, Nottingham Trent University, Nottingham NG11 8NS, UK
*
Authors to whom correspondence should be addressed.
Designs 2024, 8(5), 87; https://doi.org/10.3390/designs8050087
Submission received: 24 July 2024 / Revised: 16 August 2024 / Accepted: 20 August 2024 / Published: 28 August 2024
(This article belongs to the Special Issue Post-manufacturing Testing and Characterization of Materials)

Abstract

:
This article delves into optimizing and modeling the input parameters for the selective laser melting (SLM) process on Inconel 625. The primary aim is to investigate the microstructure within the interlayer regions post-process optimization. For this study, 100 layers with a thickness of 40 µm each were produced. Utilizing the design of experiments (DOE) methodology and employing the Response Surface Method (RSM), the SLM process was optimized. Input parameters such as laser power (LP) and hatch distance (HD) were considered, while changes in microhardness and roughness, Ra, were taken as the responses. Sample microstructure and surface alterations were assessed via scanning electron microscopy (SEM) analysis to ascertain how many defects and properties of Inconel 625 can be controlled using DOE. Porosity and lack of fusion, which were due to rapid post-powder melting solidification, prompted detailed analysis of the flaws both on the surfaces of and in terms of the internal aspects of the samples. An understanding of the formation of these imperfections can help refine the process for enhanced integrity and performance of Inconel 625 printed material. Even slight directional changes in the columnar dendrite structures are discernible within the layers. The microstructural characteristics observed in these samples are directly related to the parameters of the SLM process. In this study, the bulk samples achieved a microhardness of 452 HV, with the minimum surface roughness recorded at 9.9 µm. The objective of this research was to use the Response Surface Method (RSM) to optimize the parameters to result in the minimum surface roughness and maximum microhardness of the samples.

1. Introduction

Today, the use of additive manufacturing (AM) in the production of complex components has become very common. Many intricate metal parts, in terms of their geometry, are accurately and rapidly fabricated using the SLM method [1,2,3,4]. Although employing this technique requires process optimization, engineers have striven to optimize input parameters such as laser power, laser speed, hatch distance, and other input variables through various methods [5,6] to optimize concise indexes like the volumetric energy density [7]. Metal powders like Inconel are utilized to manufacture very delicate components in the medical, petrochemical, and automotive industries. After production, these powders might undergo changes, leading to defects such as a lack of fusion, cracks, porosities, and other manufacturing flaws, which can be mitigated by optimizing the input parameters [8,9,10].
Comprehensive studies on processing Inconel 625 alloy via SLM have explored its microstructure, mechanical properties, and process optimization. Characterization using SEM, EBSD, and XRD revealed columnar crystals and high hardness due to rapid cooling. Heat treatment induced distinct microstructures and altered the grain boundaries [11]. Nickel-based superalloy powders were assessed, linking their properties to the SLM parameters and the mechanical behavior in Inconel 625 parts [12]. Aerospace applications were examined, comparing SLM and laser metal deposition (LMD) methods, highlighting differences in the microstructure and material properties. The microstructural evolution post-SLM and heat treatment clarified the uncertainties in the mechanical properties [10]. Investigations into the impact of the SLM parameters revealed specific track characteristics and microstructural changes, while studies on lattice structures aimed to understand their mechanical behavior and validate numerical models [13].
Predictive methods for the temperature profiles and melt pool shapes in SLM were developed [14,15]. These studies emphasized microstructural variations, mechanical responses, and optimization strategies crucial for enhancing Inconel 625’s properties and applications in various industries [16,17,18,19]. Kundakcıoğlu et al. [20] introduced a thermal model predicting transient temperatures and molten pool shapes, which they validated experimentally. Sun et al. [21] investigated high-temperature oxidation behavior, linking lower laser energy densities to increased oxidation due to hindered protective oxide layer formation. Balbaa et al. [22] explored the SLM parameters’ impact on part properties, emphasizing density, surface quality, and residual stresses. Shrestha et al. [23] analyzed porosity and single-track geometry variations based on SLM parameters, while Mazur et al. [24] sought defect reduction strategies in SLM fabrication. Yan et al. [25] studied the build orientation’s influence on the surface structure and tribological properties. Additionally, studies by [26,27] compared the microstructural and mechanical properties under different manufacturing conditions, emphasizing the impacts of mechanical anisotropy, the printing directions, and welding speed on the material characteristics in SLM-manufactured Inconel 625. Huang et al. [28] investigated the scanning speed’s influence on oxidation resistance and mechanical properties and attributed superior performance to unique grain boundaries. The effects of strain rate on Inconel 625’s mechanical behavior, explored by Du et al. [29], included rate sensitivity and temperature-induced softening. Zhang et al. [30] examined the impacts of microstructural aspects and heat treatment on Inconel 625 alloy blades and noted changes in the crystal grains and enhanced corrosion resistance. Pleass et al. [31] delved into SLM’s effects on grain structures and mechanical properties, highlighting anisotropic microstructures’ role in enhancing failure resistance. Other studies investigated heat treatment’s impact on the deformation mechanisms, identified core–shell-structured oxides, and analyzed the tensile strength under various AM parameters, with the aim of optimizing Inconel 625’s mechanical properties. Additionally, research has focused on thermo-fluid conditions in laser surface melting, alloying of Inconel 625 at different scanning speeds, and computational models’ accuracy in predicting the melt pool geometry. The impact of annealing on the microstructure and corrosion resistance was elucidated for various factors affecting the mechanical properties and behavior of selectively laser-melted Inconel 625 [32,33,34,35,36,37]. Hu et al. [38] investigated the microstructure of Inconel 625 using DED, highlighting significant anisotropy in its mechanical properties and fatigue crack growth, attributed to the orientation of its epitaxial columnar grains. During heat treatment of Inconel 625 [39], changes were noted in its grain structure and phase dissolution, which impacted its strength and ductility differently based on the treatment methods. Li et al. [40] developed a precise 3D finite element heat transfer model for SLM with Inconel 625, integrating various heat source models, achieving a higher accuracy with a hybrid model, and enhancing the simulation’s precision. Allam et al. [41] explored phased array ultrasonic testing (PAUT) for non-destructive evaluation of SLM parts, successfully detecting their internal porosity using multiple methods. Wormald et al. [42] provided solutions for predicting cross-sectional dimensions in AM, achieving high accuracy in predicting track dimensions. Teng et al. [43] investigated SLM’s impact on Inconel 718, identifying heat treatment-induced phase changes, defect formations, and anisotropic mechanical properties, offering potential for tailored tensile properties. Schmeiser et al. [44] documented microstructural evolution in laser powder bed fusion (LPBF) of Inconel 625, studying how process parameters influence texture, defects, recrystallization, and segregation. They noted distinct texture generation influenced by laser power and scanning speed, along with solid-state texture changes without remelting, linking them to in situ recrystallization and subsequent segregation growth. Zhou et al. [45] developed a novel hybrid scanning strategy that offers theoretical guidance for restoration processes. However, limited research restricts further LPBF technology development. This study comprehensively investigates the hybrid scanning strategy’s impact on the microstructure, mechanical properties, and interfacial characteristics of Inconel 625, providing significant insights for designing additively manufactured Inconel 625 with specific microstructures and properties. Accurate prediction of temperature distribution and melting pool geometry in additive manufacturing requires careful selection of heat source models. Binxun et al. [46] compares surface, volumetric, and double-ellipsoid models, implemented in Abaqus/Standard. Results show the double-ellipsoid model best predicts melting pool geometry, while the volumetric model is better for peak temperatures. Surface model accuracy is poor, emphasizing the need for model calibration.
The crucial aspect lies in uncovering the correlation between process parameters and defects, as it has the potential to reduce both time and costs associated with the manufacturing process. The present study aims to explore the optimization of the SLM parameters for Inconel 625, focusing on interlayer microstructure post-process. This research tries to optimize parameters using RSM to achieve minimum surface roughness and maximum microhardness in the samples. Using DOE and RSM, we optimized SLM parameters like laser power, and hatch distance, which are correlated to microhardness and roughness. Examining cubic Inconel 625 samples, it revealed porosities and fusion issues due to rapid solidification, prompting a detailed analysis for process enhancement and material performance. The highest microhardness reported for the bulk samples is 452 HV with a roughness of 10.2 µm. This was achieved using a laser power of 175 W and a hatch distance of 0.1 mm.

2. Response Surface Methodology

Utilizing optimization techniques is crucial for selecting top-quality samples while saving time and costs. RSM is particularly adept at streamlining SLM by organizing both input and output parameters [47,48]. Its objective is to create an accurate mathematical model for the SLM process, minimizing errors within Equation (1) where η is considered a response and k steps are controlled factors. Ultimately, RSM aims to optimize the printing process efficiently and effectively.
η = f x 1 ,   x 2 ,   ,   x k + ε
The variable ε represents the unpredictable SLM error stemming from uncontrollable factors. Accurately establishing the η response is pivotal; a closer approximation of η to the actual value enhances the reliability of the function on various factors. Equation (2) presents another formula aimed at determining the true response factor for η.
η = β 0 + i = 1 k β i x i + i = 1 k β i i x i 2 + i . j = 1 i < j β i j x i x j
β 0 represents a constant, β i signifies a linear factor, and β i i denotes an interaction factor. The study focused on LP and HD as controlled factors, utilizing statistical analysis through Design-Expert V13. In total, nine samples were manufactured, and the assessment focused on three optimal samples, considering three different output response levels. In the DOE, the experimental design was chosen according to the varying levels of these input parameters. The study examined a set of experiments designed to correlate specific input settings with desired output responses, aiming to identify optimal sample configurations.

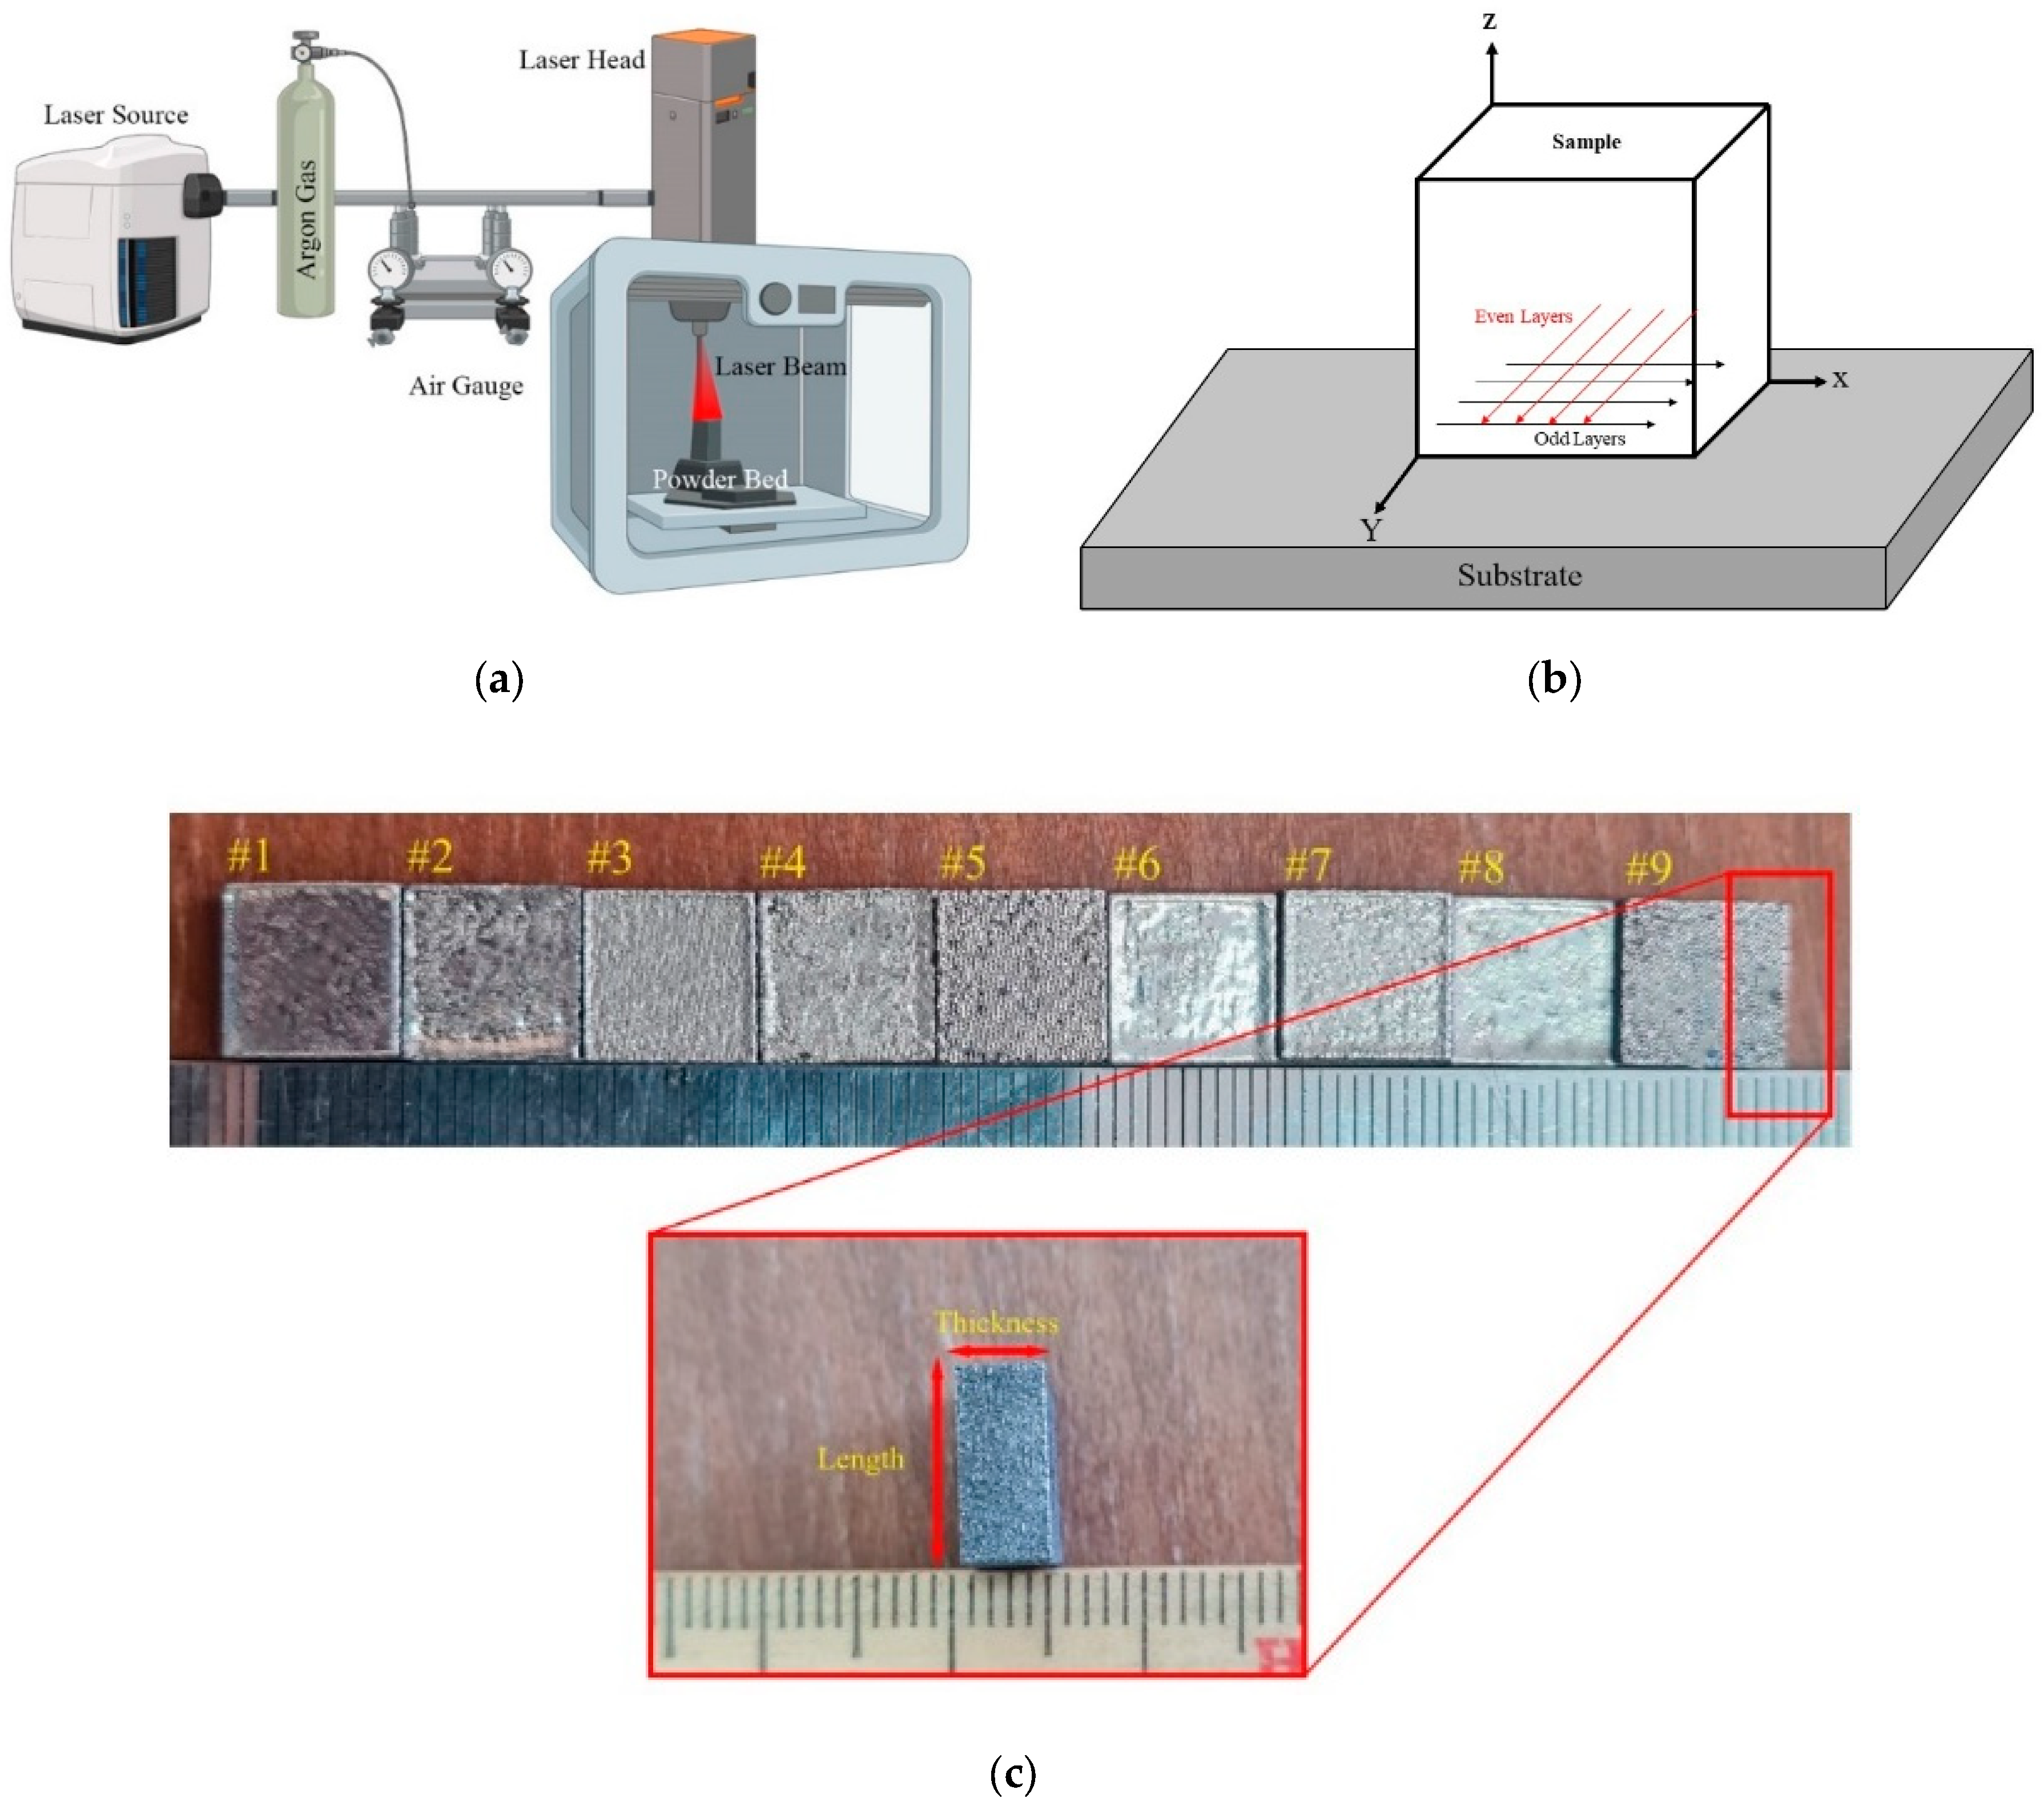
3. Experimental Work

In this experiment, cubes with dimensions of 10 × 10 × 4 mm2 were produced by SLM method due to setup Figure 1a, totaling nine samples based on DOE Table 1. A thickness of 40 µm was considered for each sample (Figure 1b,c), consisting of 100 layers fabricated using the SLM method with Inconel 625 powder without reinforcement, as specified in Table 2. SEM images were taken by Tescan Mira3 SEM (Tescan Co., Brno, Czechia) in Backscattered electrons mood. For surface roughness measurement, Alicona InfiniteFocus SL (Bruker Alicona, Raaba, Austria) was used to measure Ra on the X direction of the surface. To measure the microhardness, a test that involved loading 200 gf via Micromet No. 5114 (BUEHLER micro-durometer, Neuss, Germany) was applied for five repetitions in each area.

4. Discussion

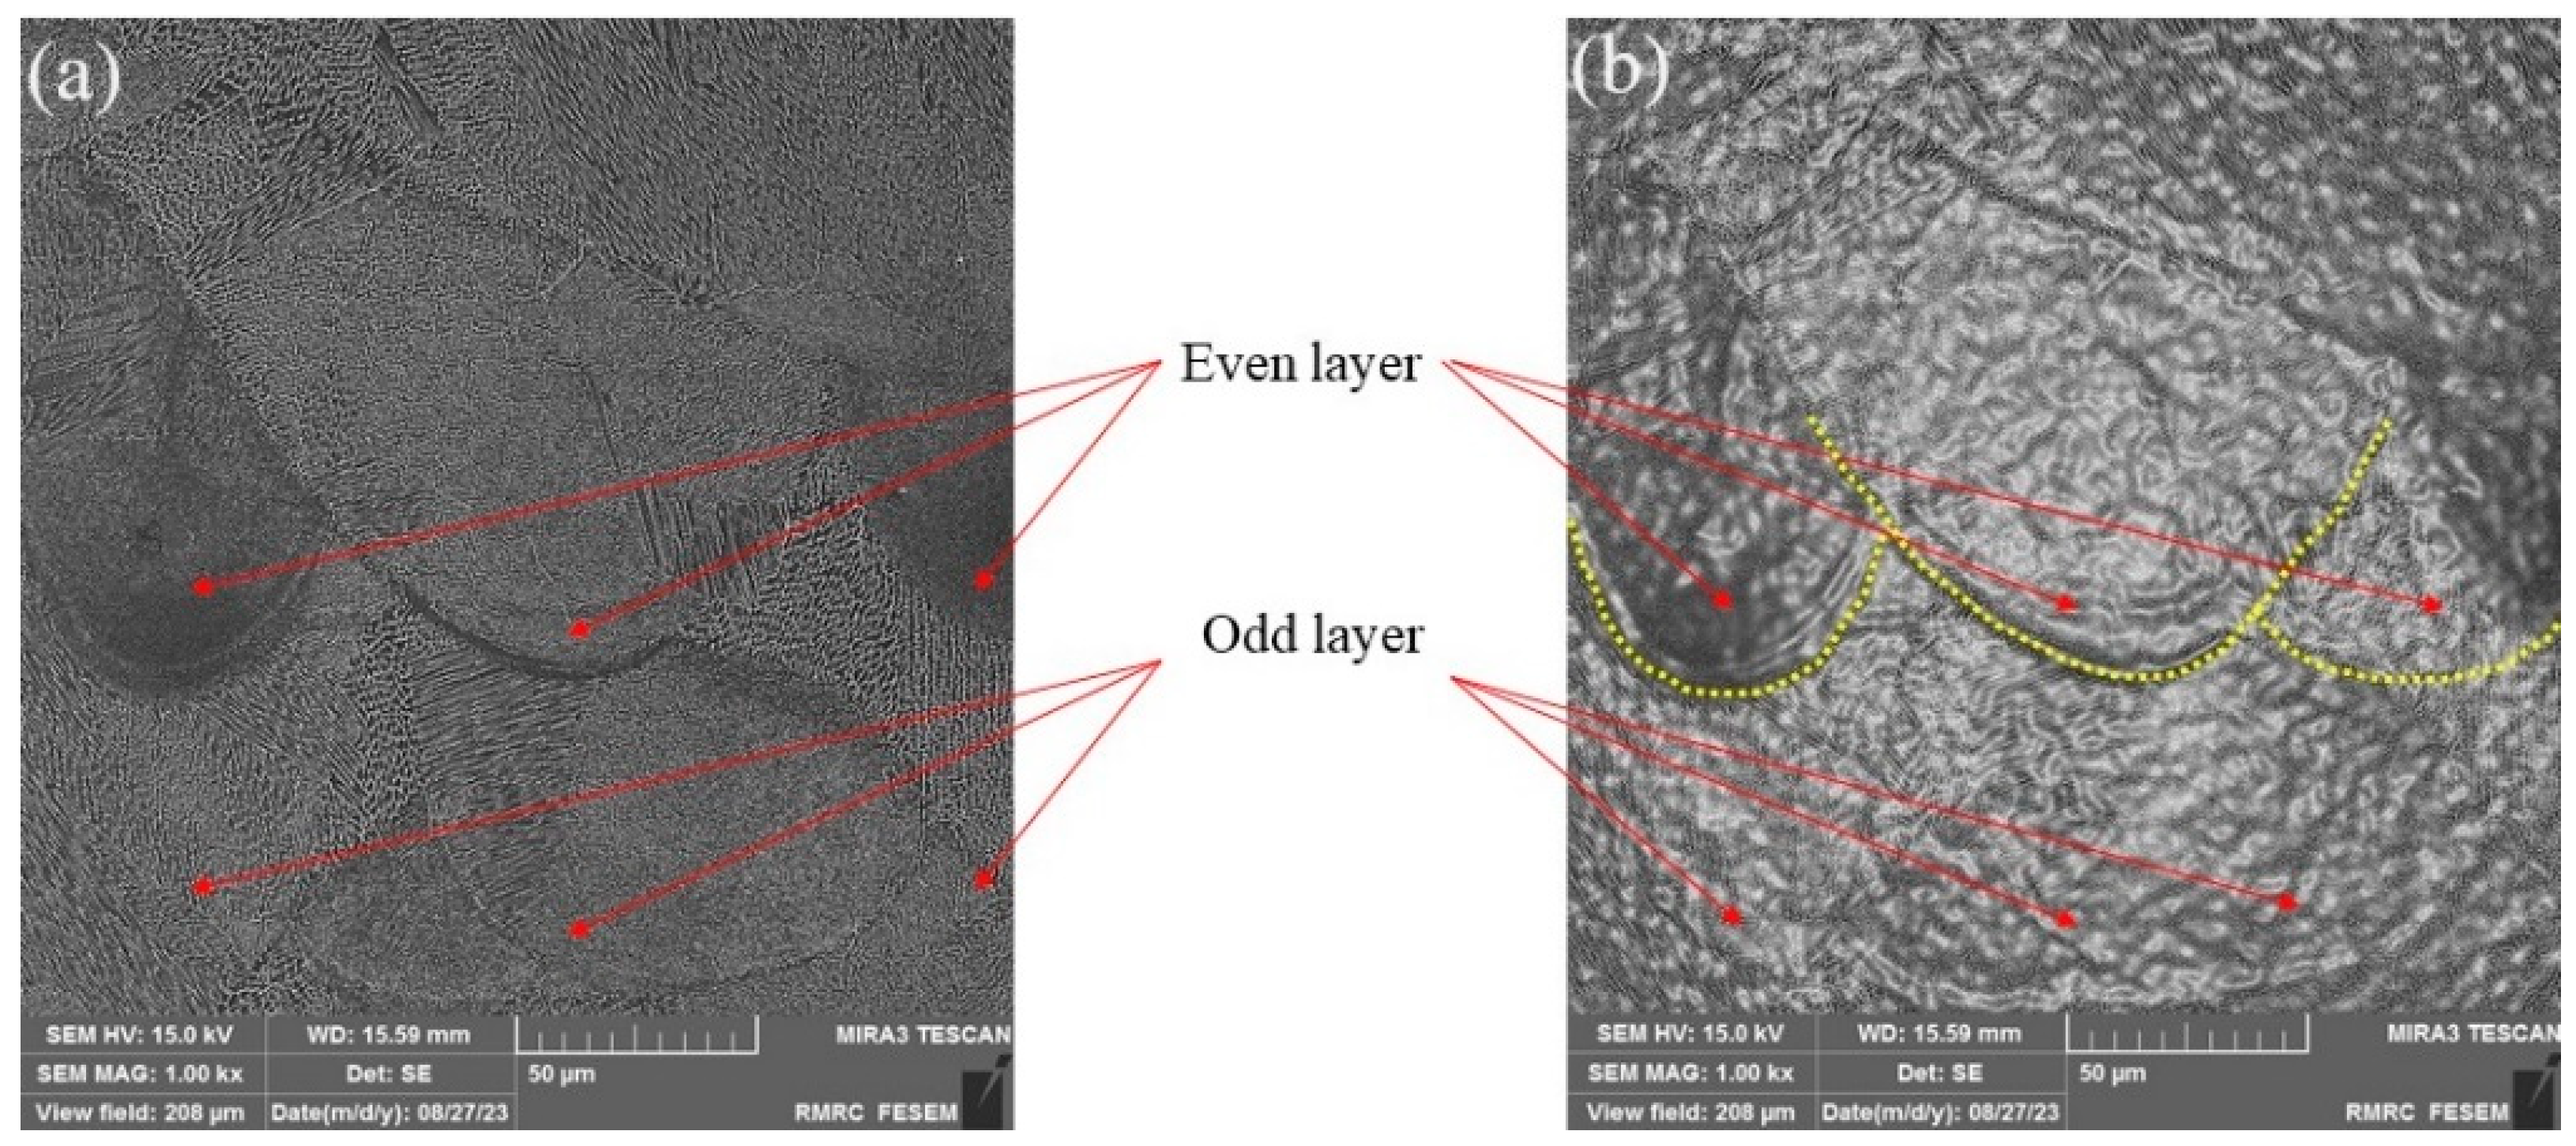
4.1. Microstructure Analysis of AM Samples

Figure 2 displays the microstructure of Inconel 625 in samples #1, #3, and #7 post-additively manufactured through SLM. In Figure 2a, the deposited layers exhibit distinct zones, which were influenced both by a high cooling rate and process direction, demonstrating the influence of manufacturing process factors in the SLM method. This variance in the columnar dendrite deposition structure impacts microhardness, which is evident in Table 1, where the higher the LS the lower the microhardness. The centralized pattern in Figure 2b indicates a characteristic solidification behavior potentially linked to laser scan strategies and energy input. Furthermore, the merging of melting pools in Figure 2c implies complex interactions between laser settings, impacting the fusion and morphology of adjacent layers. This detailed analysis underscores the sensitivity of Inconel 625’s microstructure to variations in SLM parameters, emphasizing the need for precise control and optimization to tailor material characteristics for specific applications. Figure 3a shows the macro scale of the deposited layer after the SLM process, while Figure 3b illustrates the outcome of rapid solidification, depicting a centralized pattern post-process with all columnar dendrite directions converging at a single center. Additionally, Figure 2c highlights instances where reduced HD and increased LP cause certain melting pools to merge in select zones, hinting at alterations within the heat-affected zone (HAZ). It is crucial to grasp the significance of the overlap percentage in relation to HAZ. Even minor directional adjustments in columnar dendrite structures are noticeable within the layers. The microstructural features observed in these samples bear direct relevance to the SLM process parameters. The zone within layers suggests varying cooling rates during deposition, which impacts dendritic growth and ultimately influences material properties like microhardness.

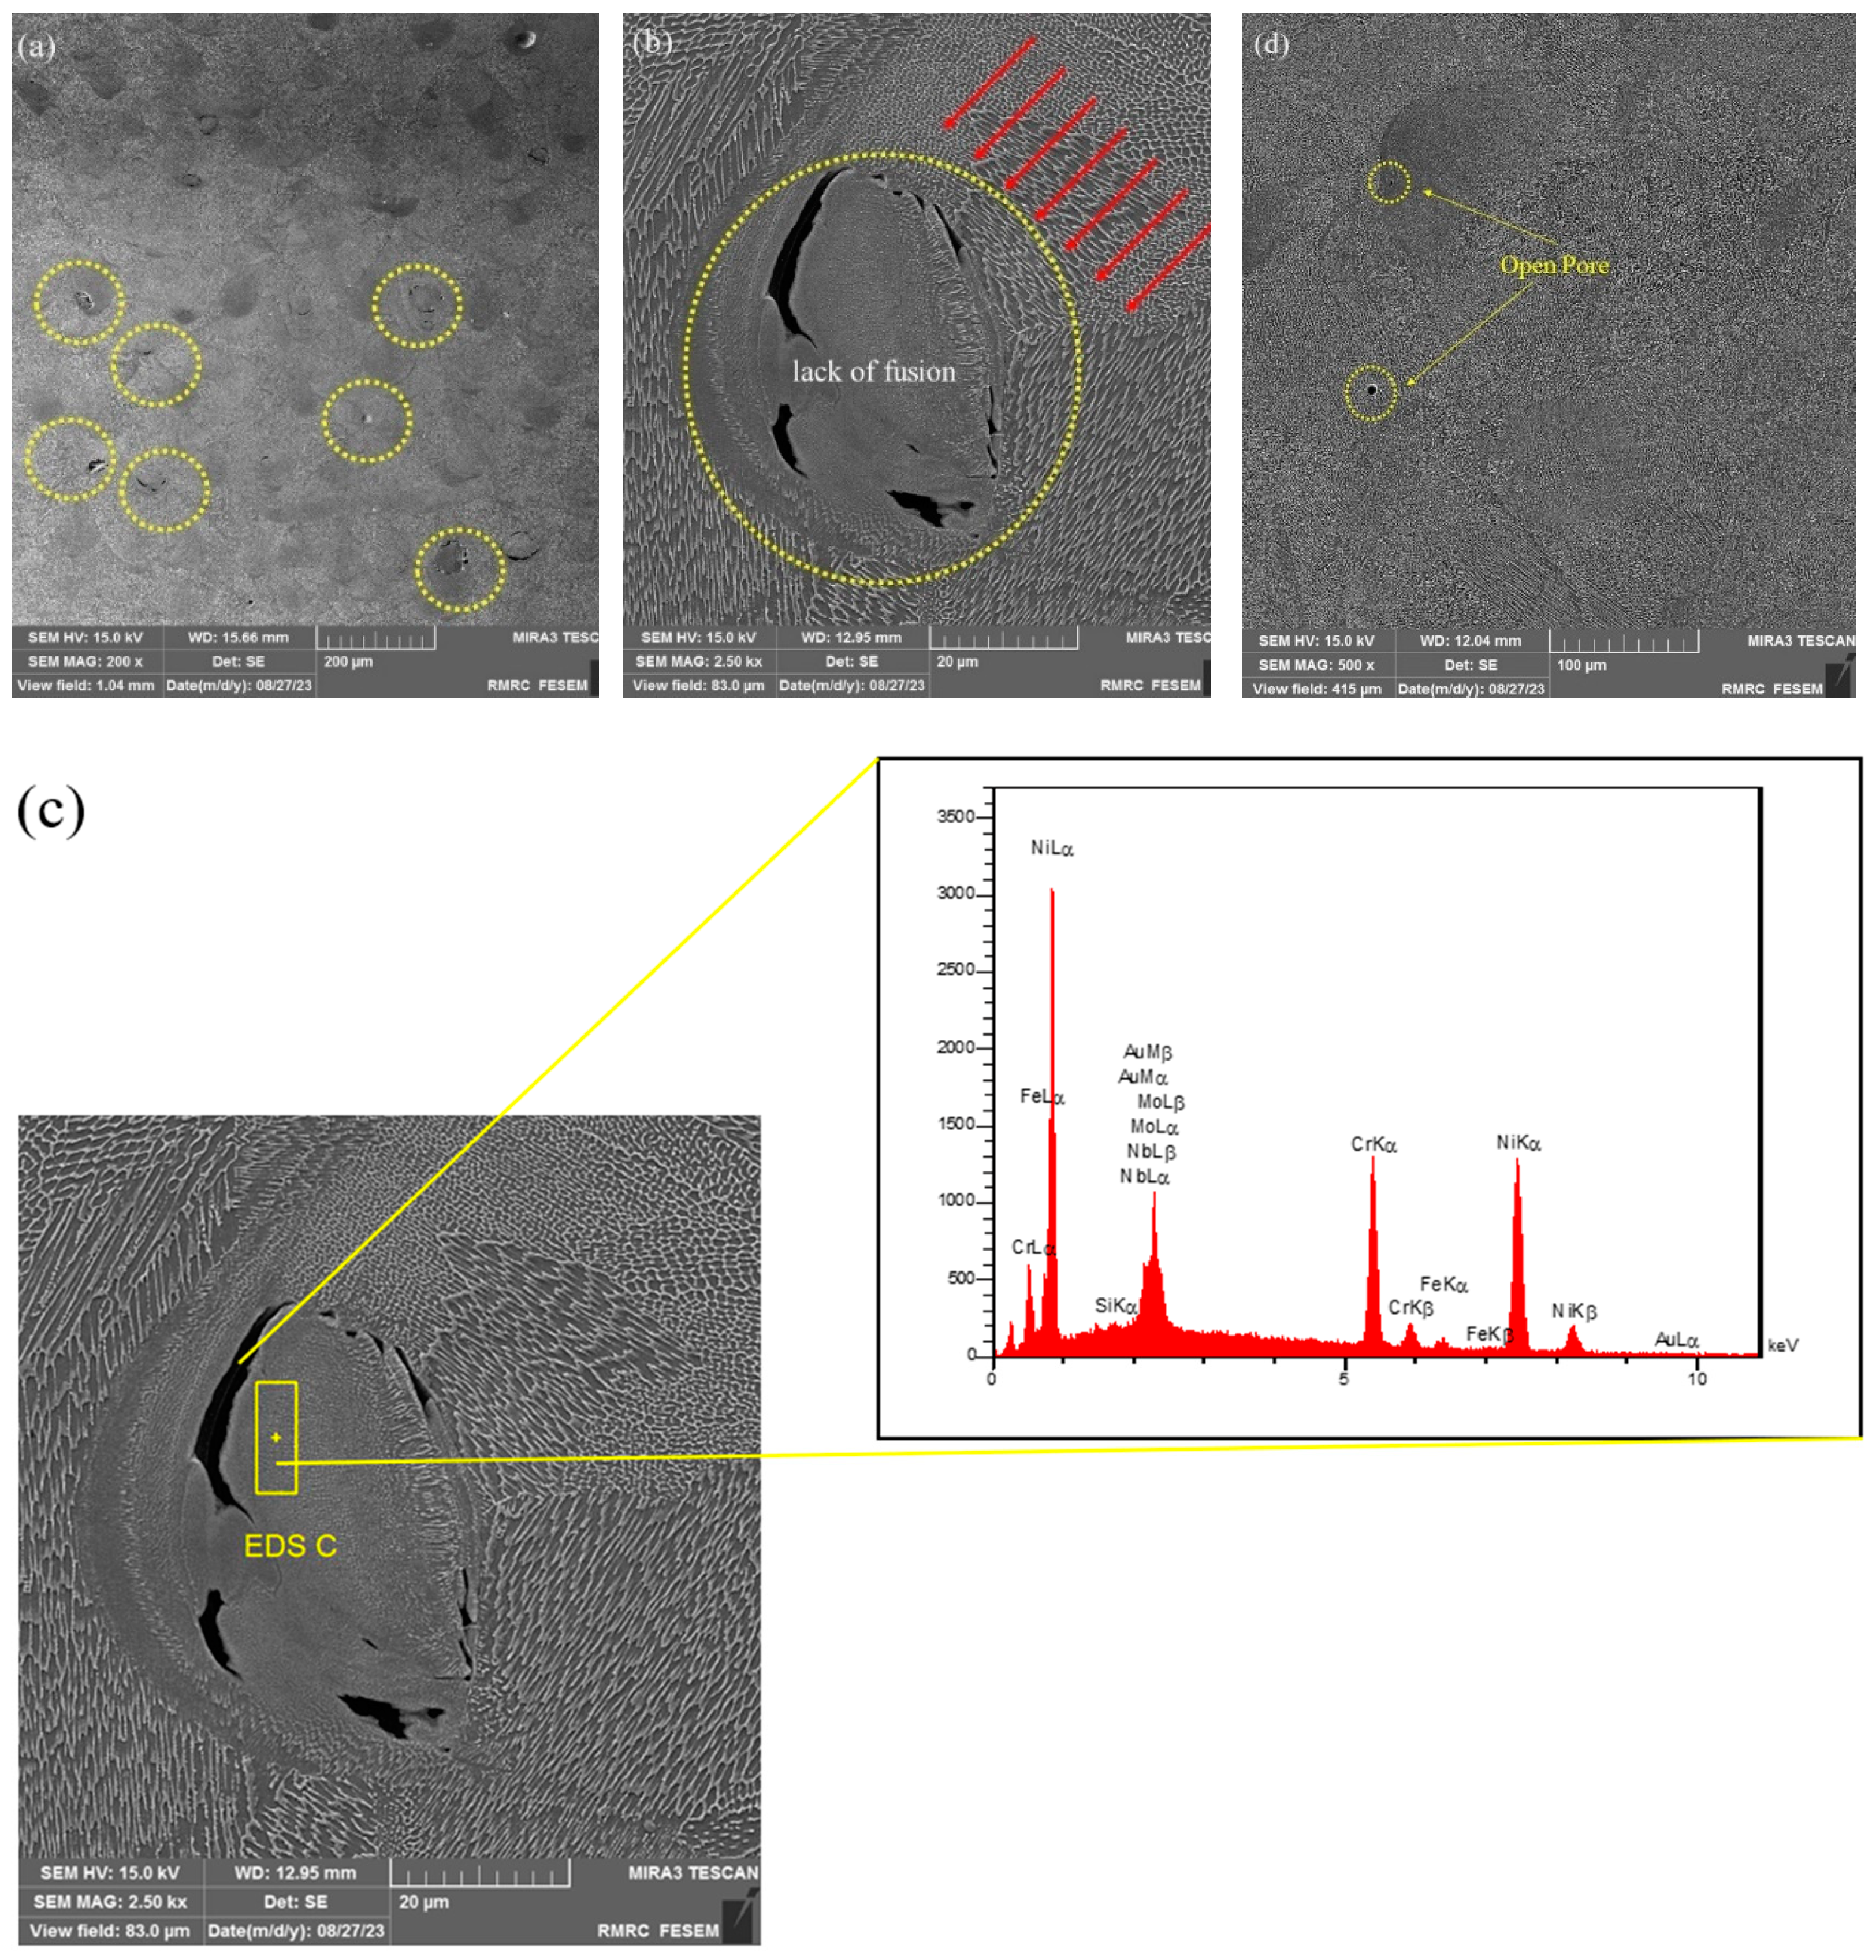
4.2. Revealing Defects

Lack of Fusion and Pores after SLM Process

Insufficient fusion at the interfaces of five adjacent layers in Inconel 625 SLM samples, which is particularly noticeable when four layers are formed consecutively, is often observed. This lack of fusion results in the formation of voids and pores (Figure 4). LP and powder properties significantly impact interlayer fusion. Variety in these parameters affects the molten pool temperature distribution and the material cooling rates, which influences the fusion quality between layers. The rapid solidification during SLM can hinder proper bonding, leading to pores or voids at the interfaces. Inconel 625 microstructure analysis corroborates this hypothesis, revealing irregularities and insufficient bonding at interfaces and further pore formation. Understanding and optimizing the interaction between process parameters and microstructural characteristics are crucial for mitigating this lack of fusion and enhancing material integrity in SLM-produced components. Inconel 625 sample exhibits open pores, particularly clustered along the curves of melting pools, with some in close proximity to each other. The presence of open pores in Inconel 625 samples manufactured through SLM can be linked to several causes. During the SLM process, the rapid heating and subsequent rapid cooling rates can lead to incomplete fusion or inadequate time for gas to escape, which leads to gases being entrapped in pockets and thus leads to the formation of open pores. The formation of open pores near the curves of melting pools could be related to the keyhole effect in laser melting. This effect involves the rapid vaporization of material under the intense heat of the laser, which can create voids or open pores along the edges of the melted pools. Inconel 625 powder properties, such as particle size distribution and morphology, can impact pore formation. Agglomerated or irregularly shaped powder particles might not fuse properly during the melting process, leading to open pores.

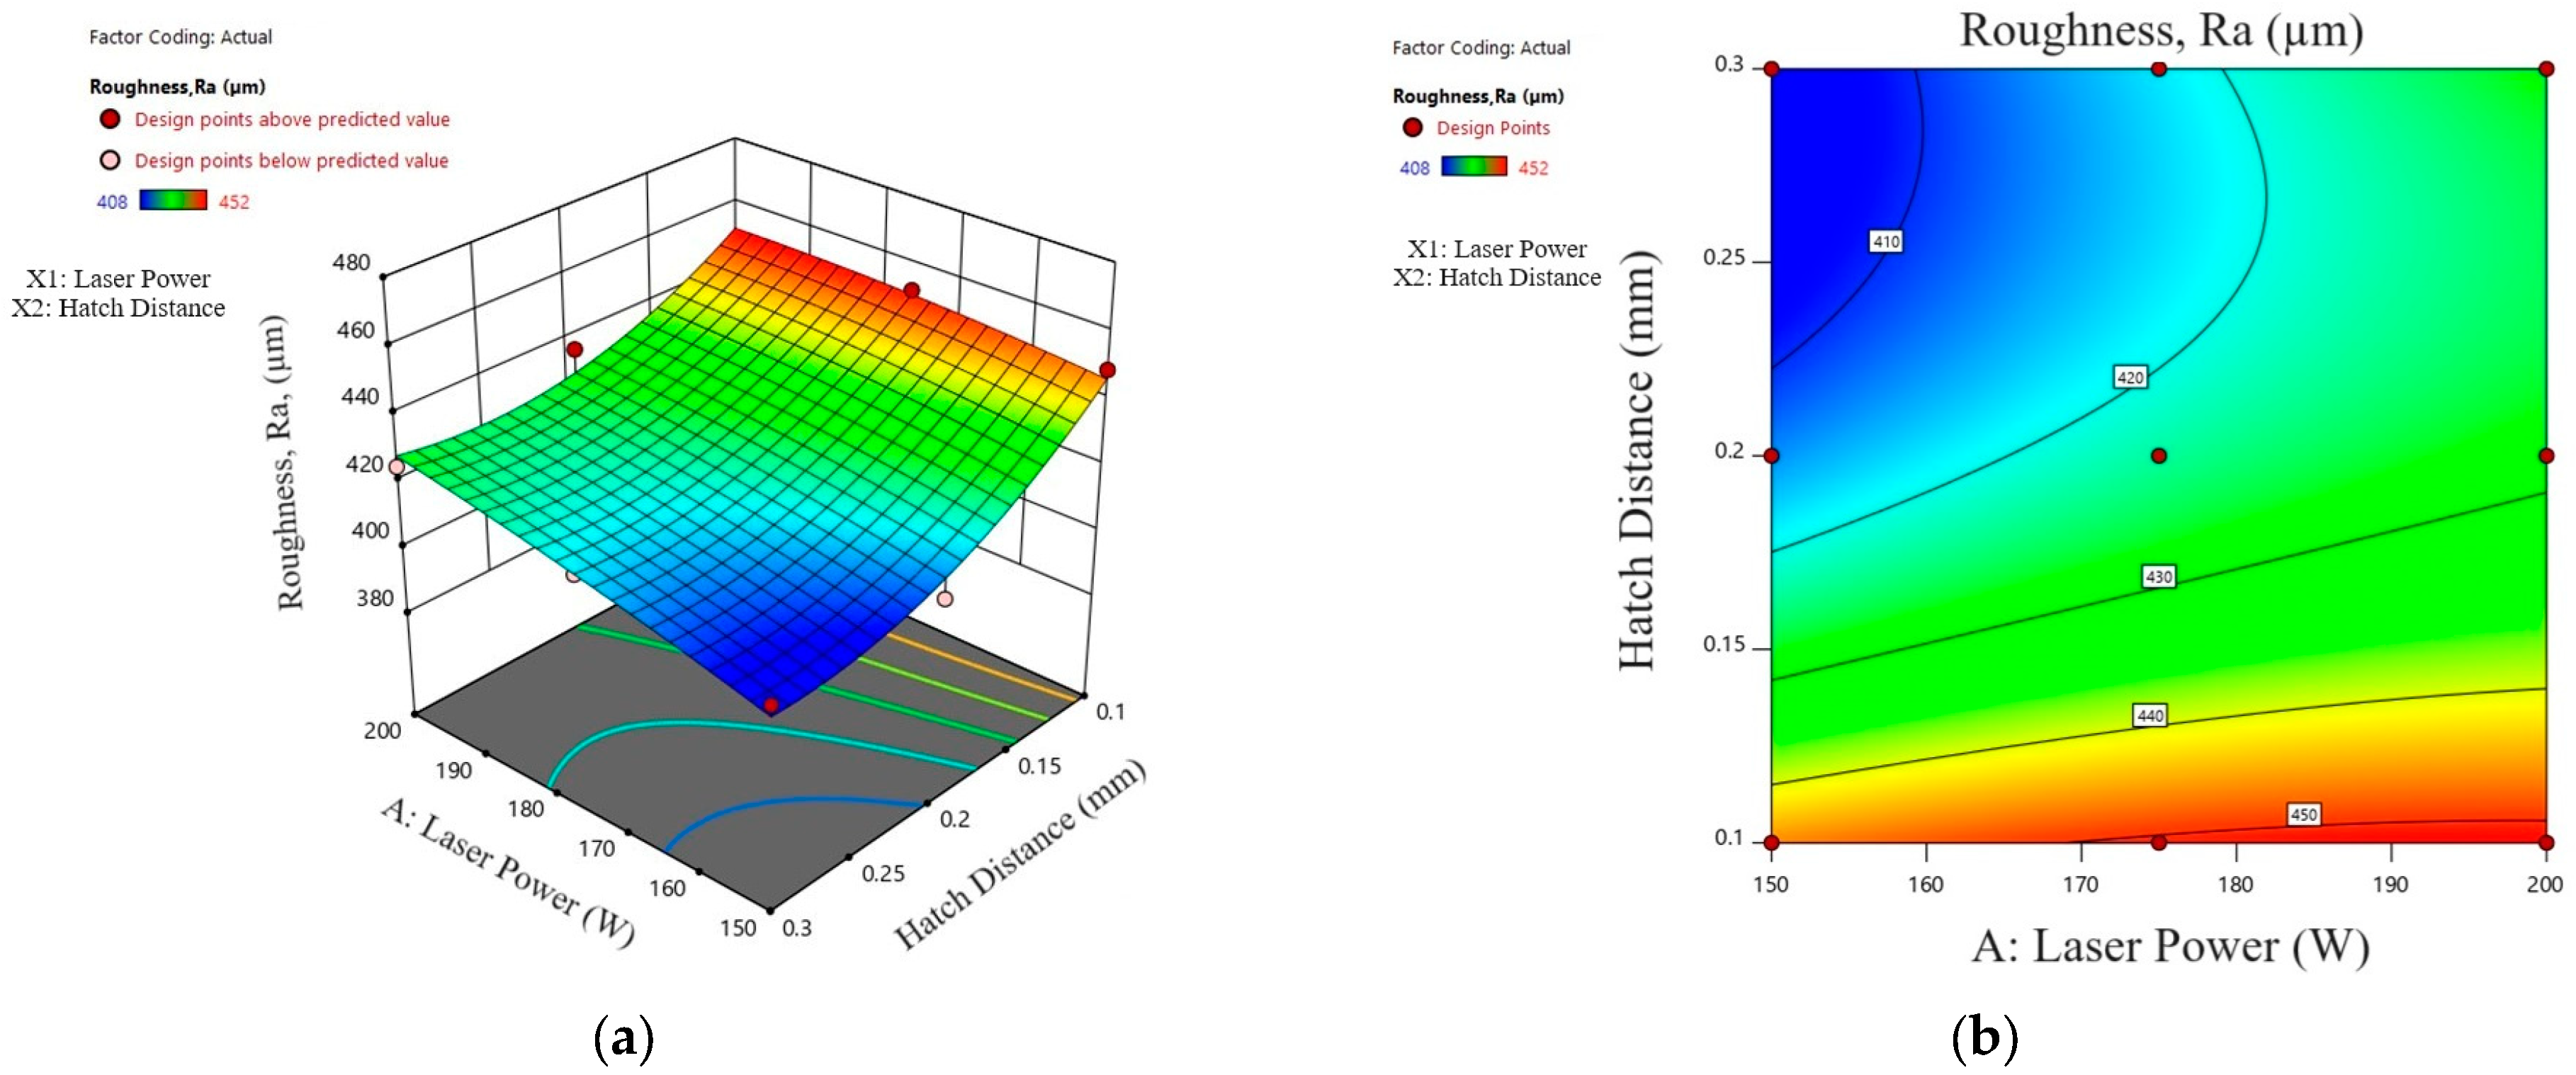
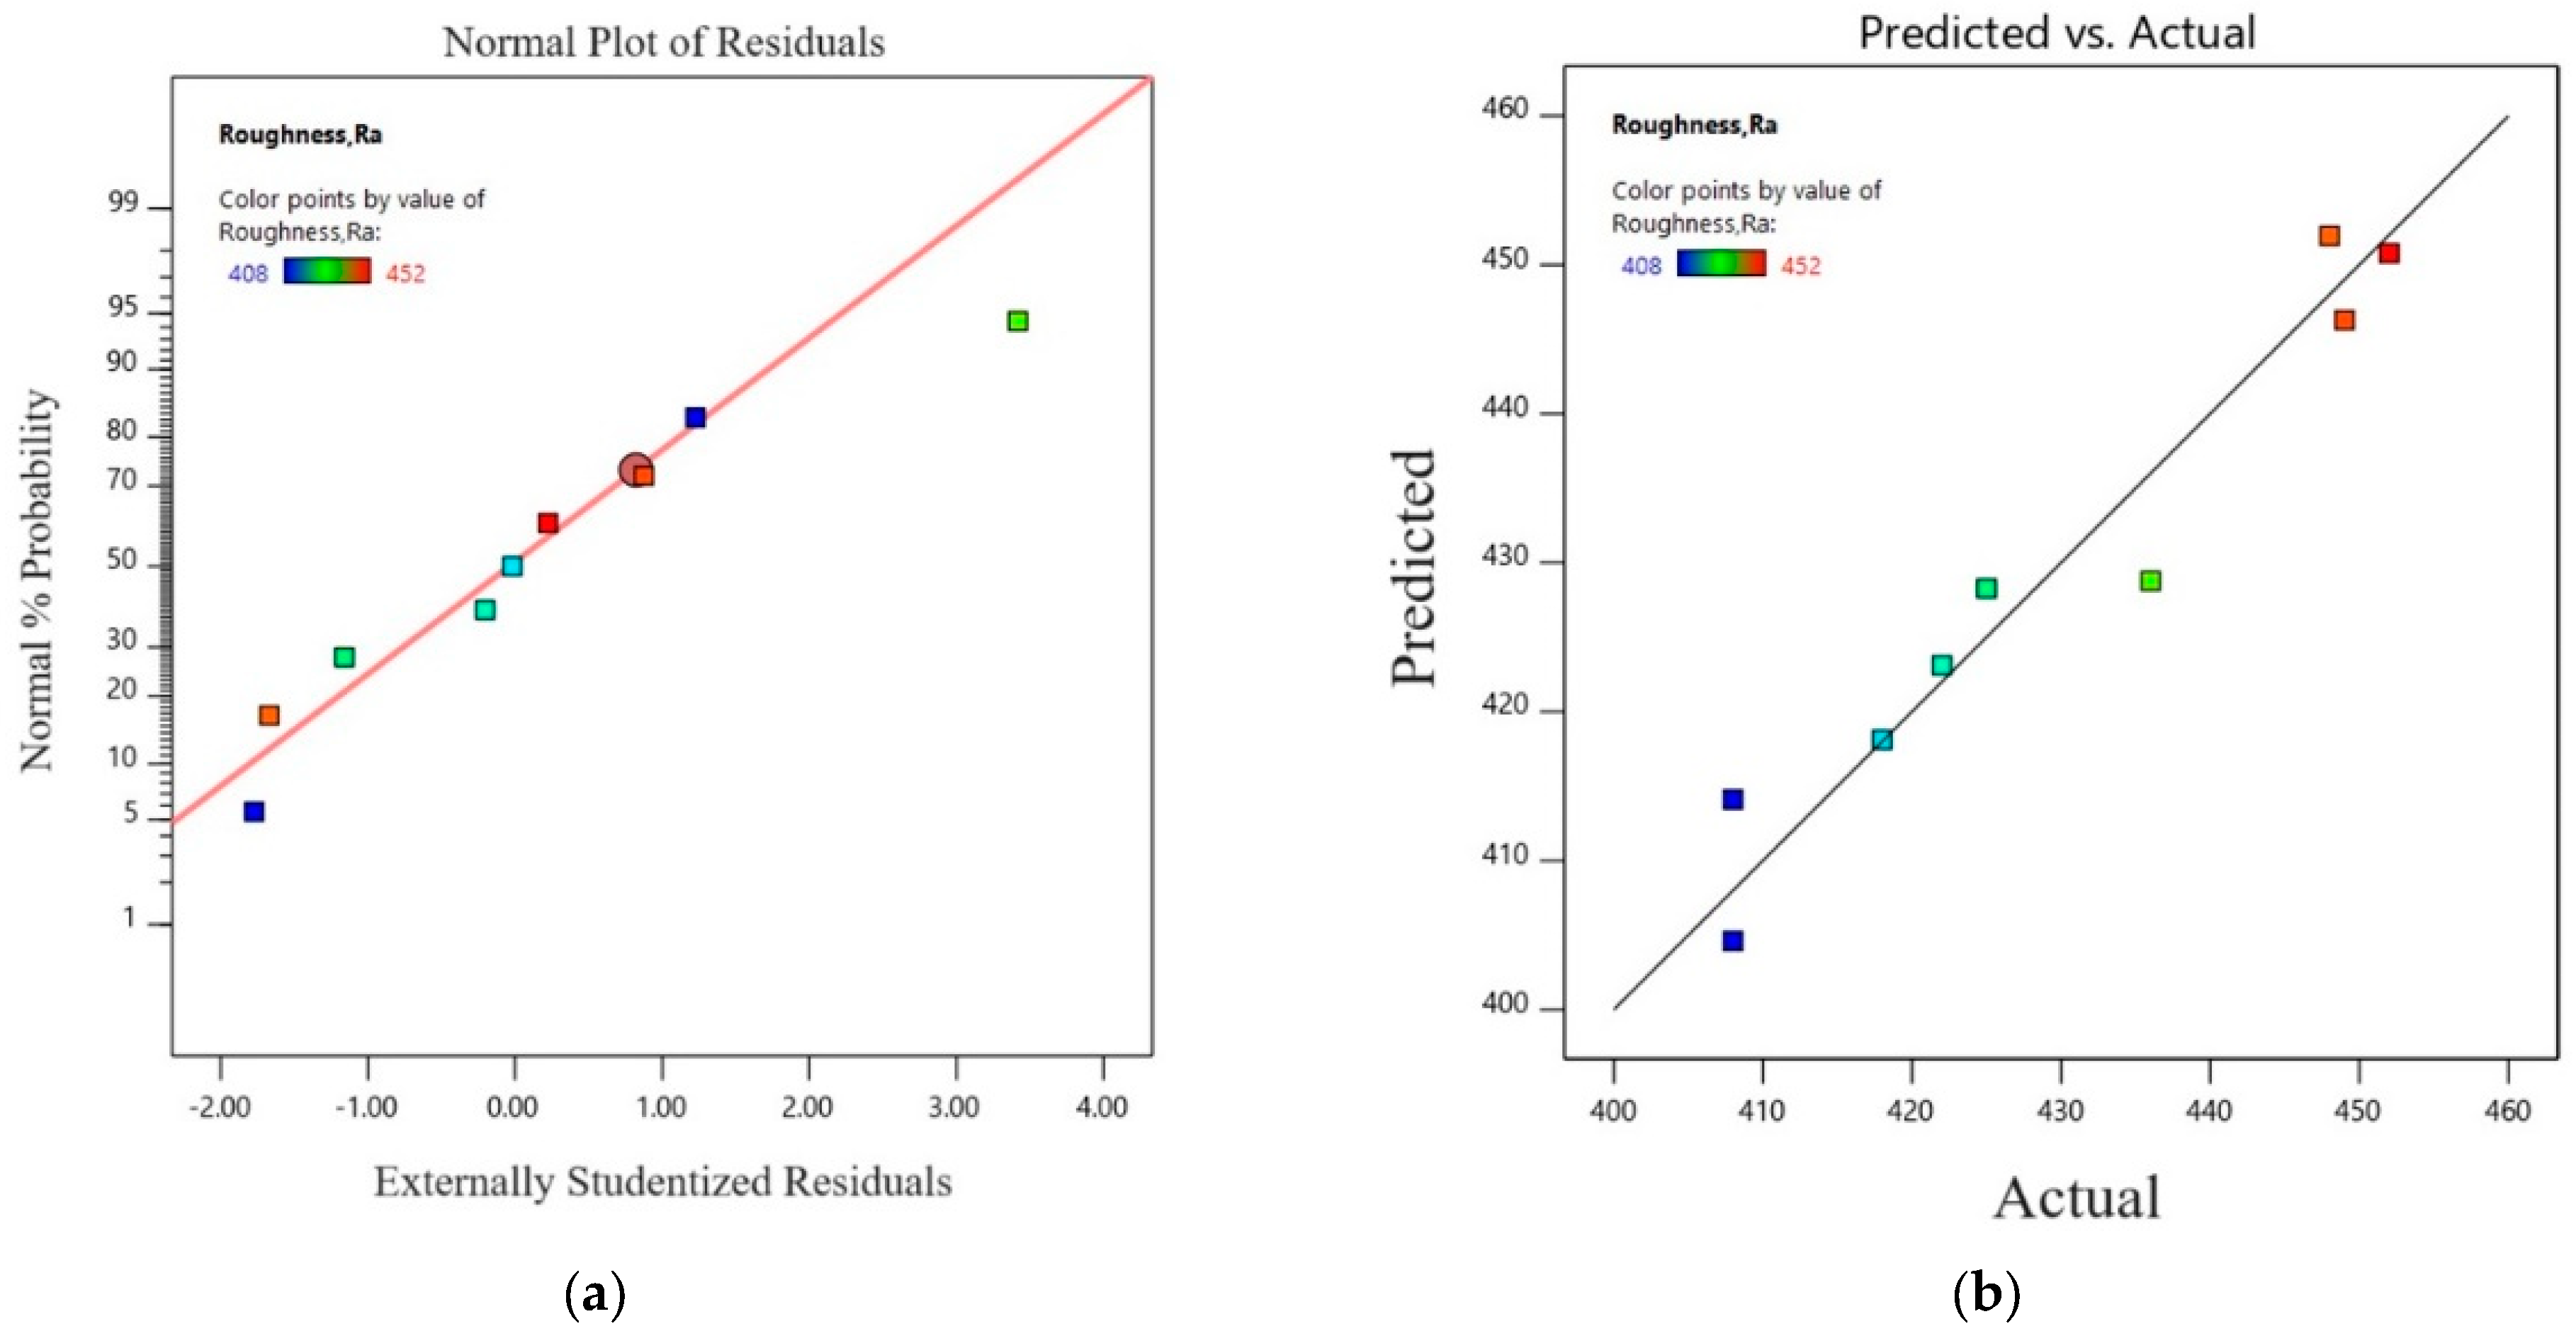
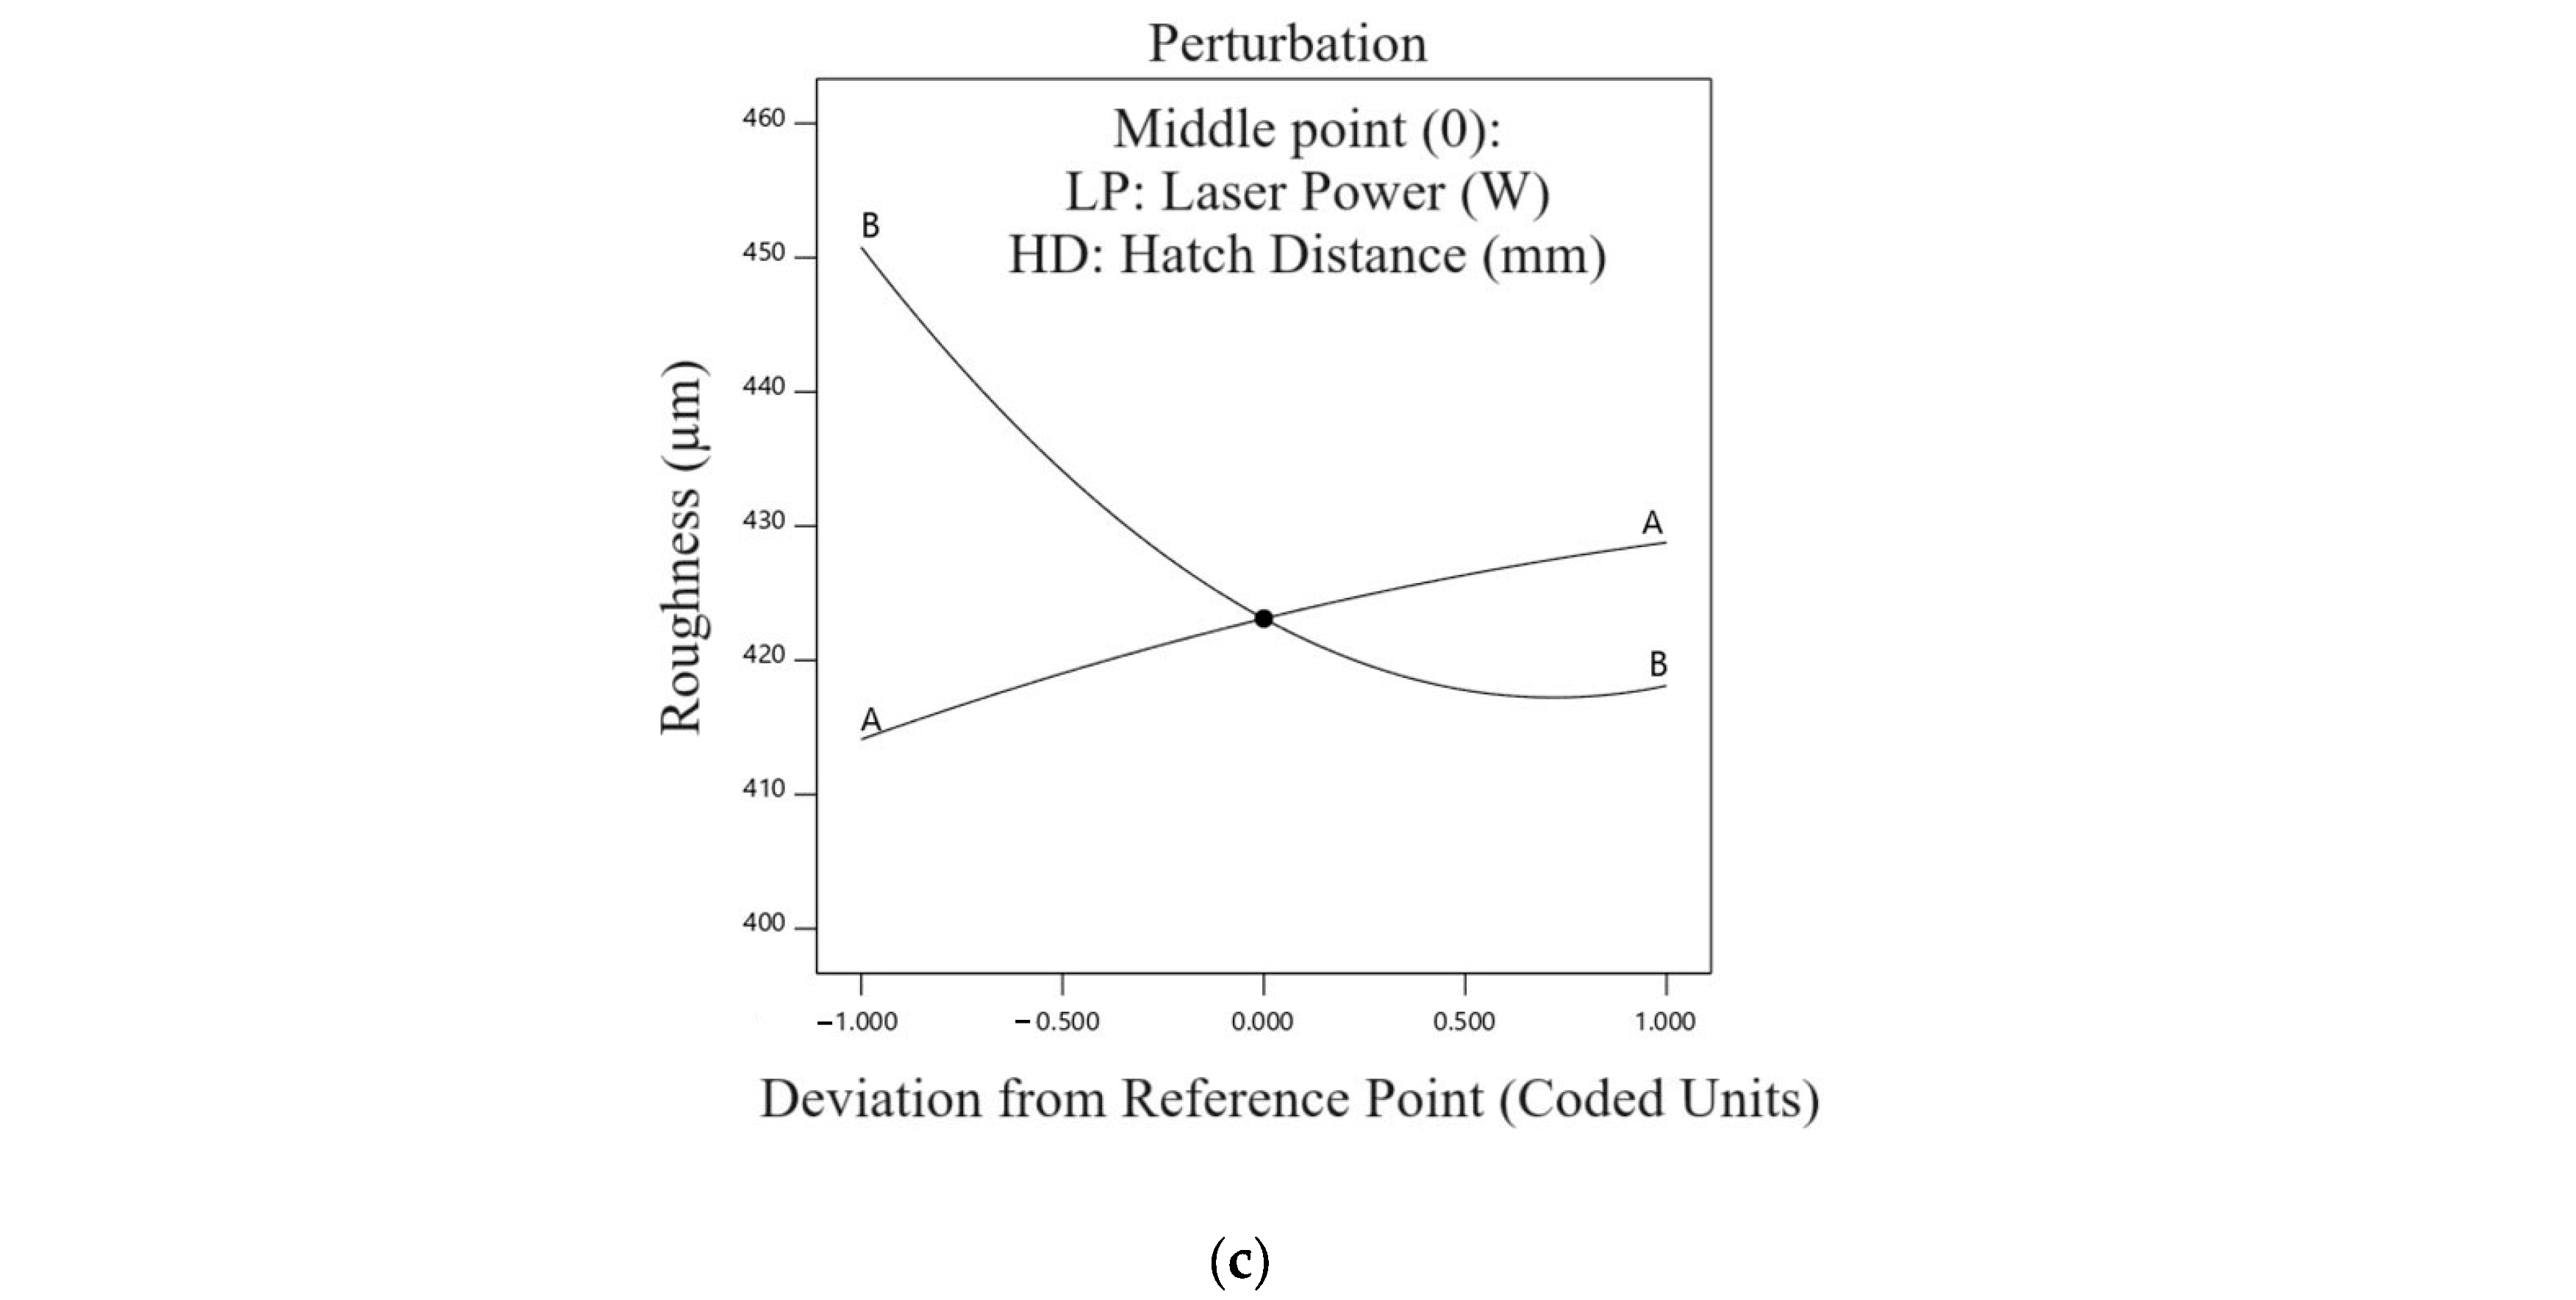
4.3. Surface Roughness, Ra (SR)

Table 3 illustrates the ANOVA outcomes for SR. It reveals the effectiveness of all main linear and quadratic parameters. Within the quadratic terms, the laser power’s quadratic term (P2) stands out significantly, alongside three impactful interactions depicted in the table. Table 3 shows the analysis of variance ANOVA model of SR. Equations (3) and (4) display the regression relationship for SR, considering the influential terms based on coded and actual values.
Roughness, Ra = +423.11 + 7.33 Laser Power − 16.33 B + 4.50 Laser Power × Hatch Distance − 1.67 Laser Power2 + 11.33 Hatch Distance2
Roughness, Ra = +431.11111 + 0.866667 Laser Power − 931.66667 Hatch Distance + 1.80000 Laser Power × Hatch Distance − 0.002667 Laser Power2 + 1133.33333 Hatch Distance2
Figure 5a shows the response surface graph, while Figure 5b displays a contour plot for SR concerning LP, and HD. Two-dimensional-representation contour plots of the surface graphs delineate the parameter effectiveness zones for each response more clearly. These graphs, based on regression, are interpolated by the available data. The interaction of hatch distance and LP on SR is evident in Figure 5a, showing SR dependency on parameter changes. For instance, decreasing LP and increasing HD escalate surface roughness. This occurs because reduced LP may hinder adequate energy delivery for complete material melting, leading to incomplete fusion between layers and, consequently, surface irregularities. Likewise, widened hatch distances limit overlap between laser paths, resulting in visible gaps and rougher surfaces (Figure 6). This combination fosters incomplete melting and inadequate fusion, culminating in heightened surface roughness in the SLM process. Exposing the samples to air and cooling them after fabrication by SLM led to the formation of surface pores due to heat transfer to the substrate and air. These pores resulted in a rougher surface.
Figure 7 shows various plots from a statistical analysis; in more detail, Figure 7a presents the normal plot of residuals. This plot illustrates that the differences between observed and predicted values in the regression analysis are tightly clustered around the line, indicating a close alignment. Additionally, Figure 7b graphically demonstrates the proximity of actual and predicted amounts to the line, which accounts for the accurate prediction by the statistical analysis of the responses. Figure 7c shows the perturbation plot of SR, highlighting the depiction of parameter interactions affecting SR and the simultaneous impact of these parameters on SR. By comparing Figure 5 and Figure 7c, it is evident that the SR significantly decreased as the HD increased. This reduction occurred because the gap was more effectively filled in the layers fabricated at higher HD, leading to more uniform metal solidification.

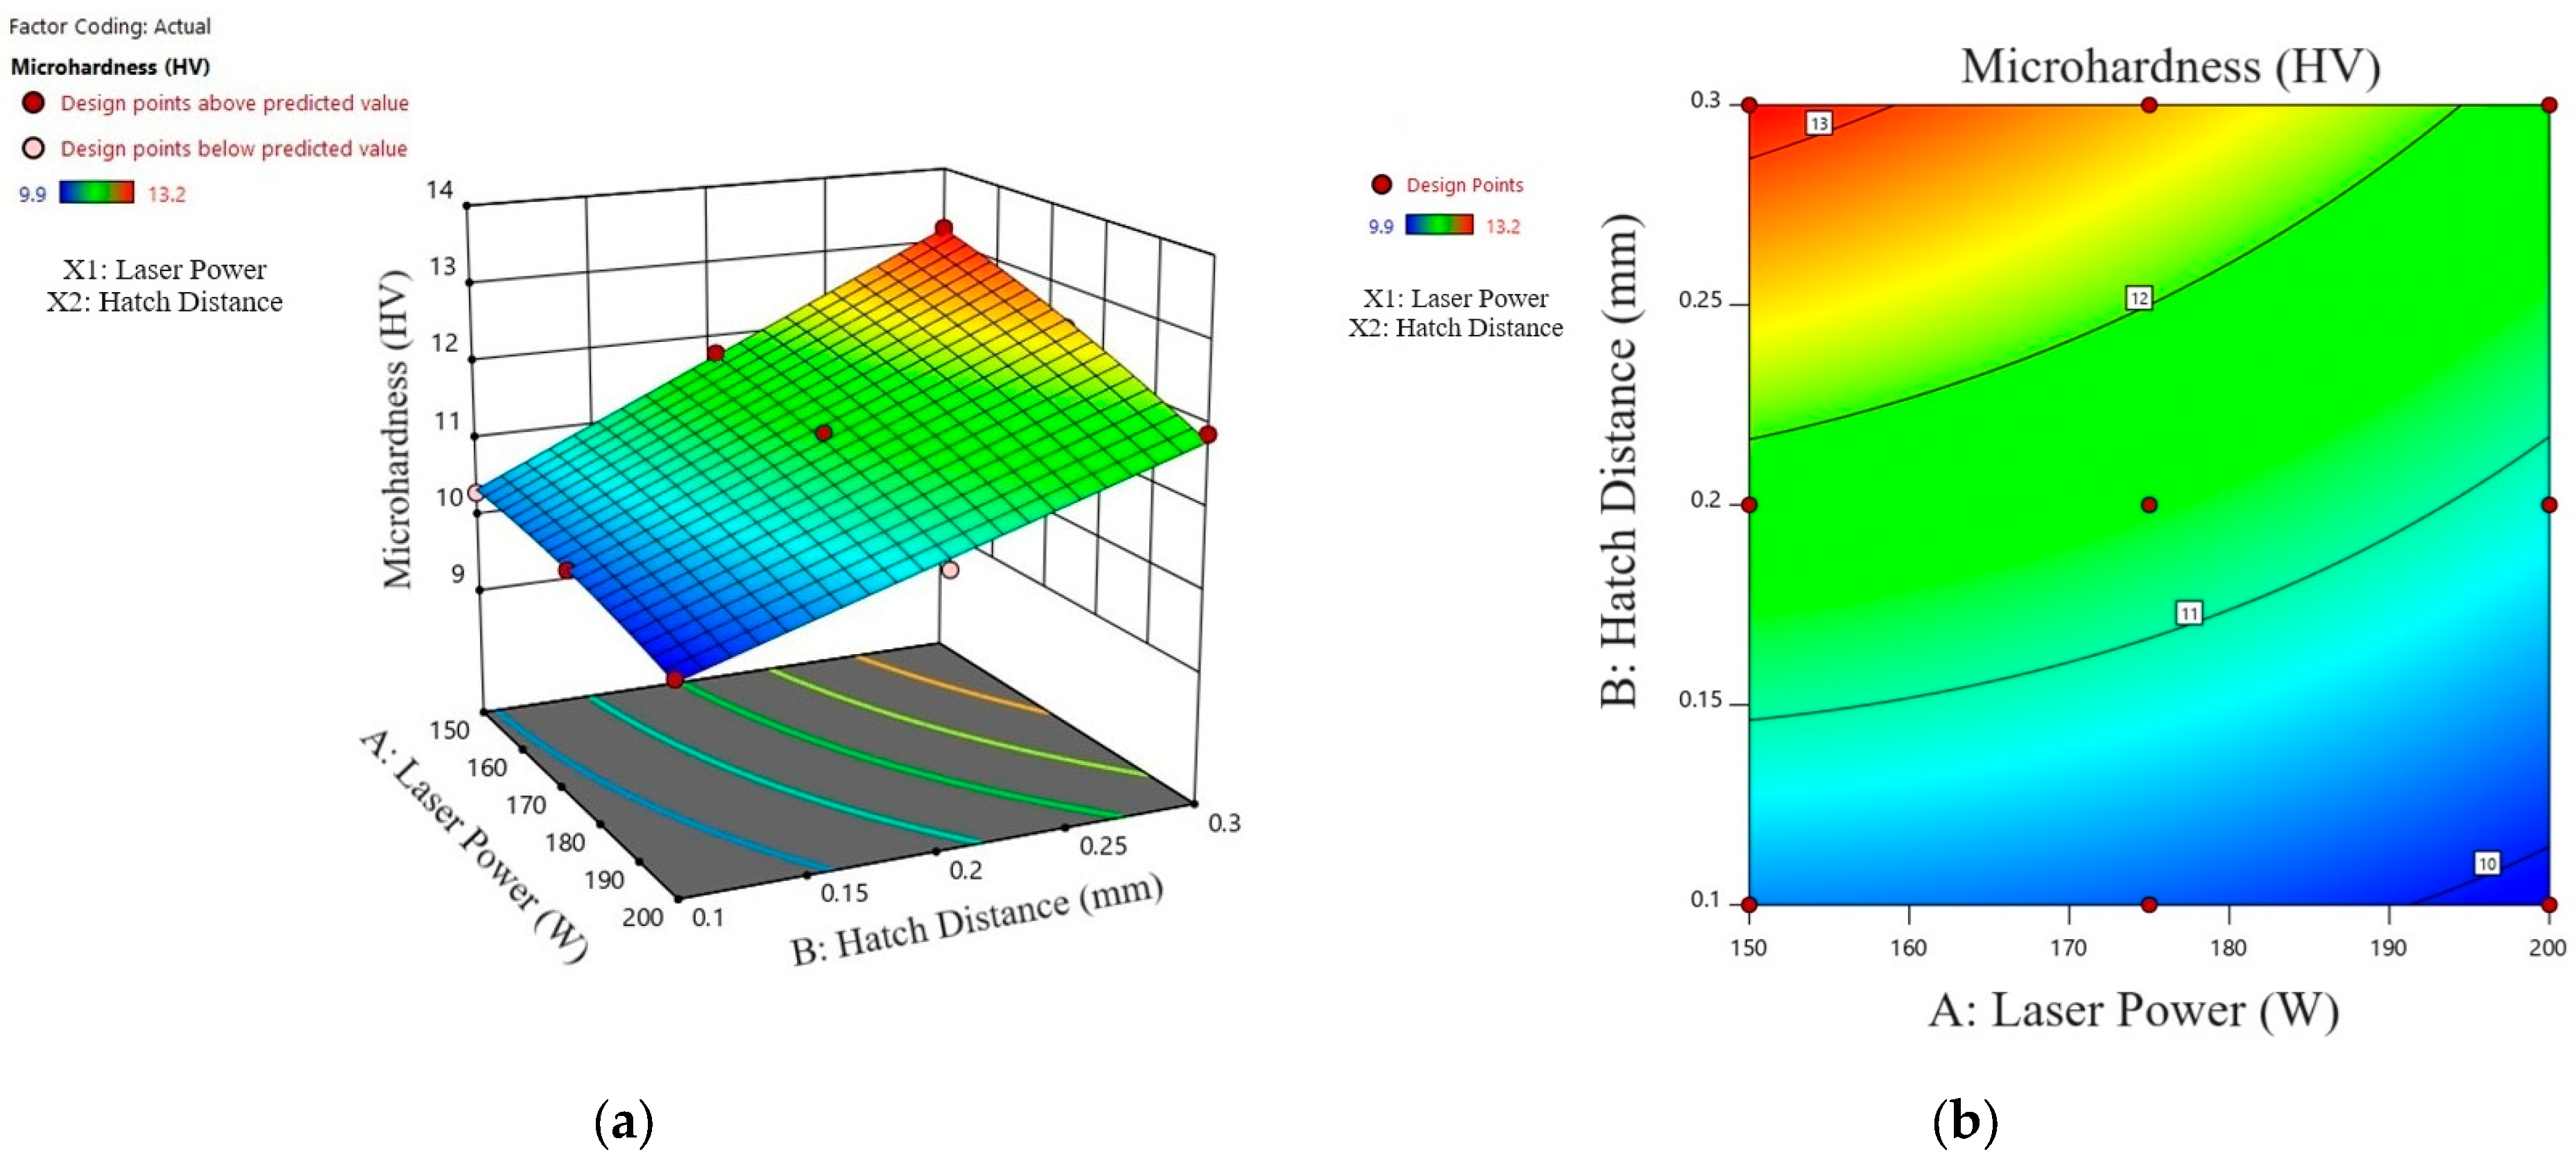
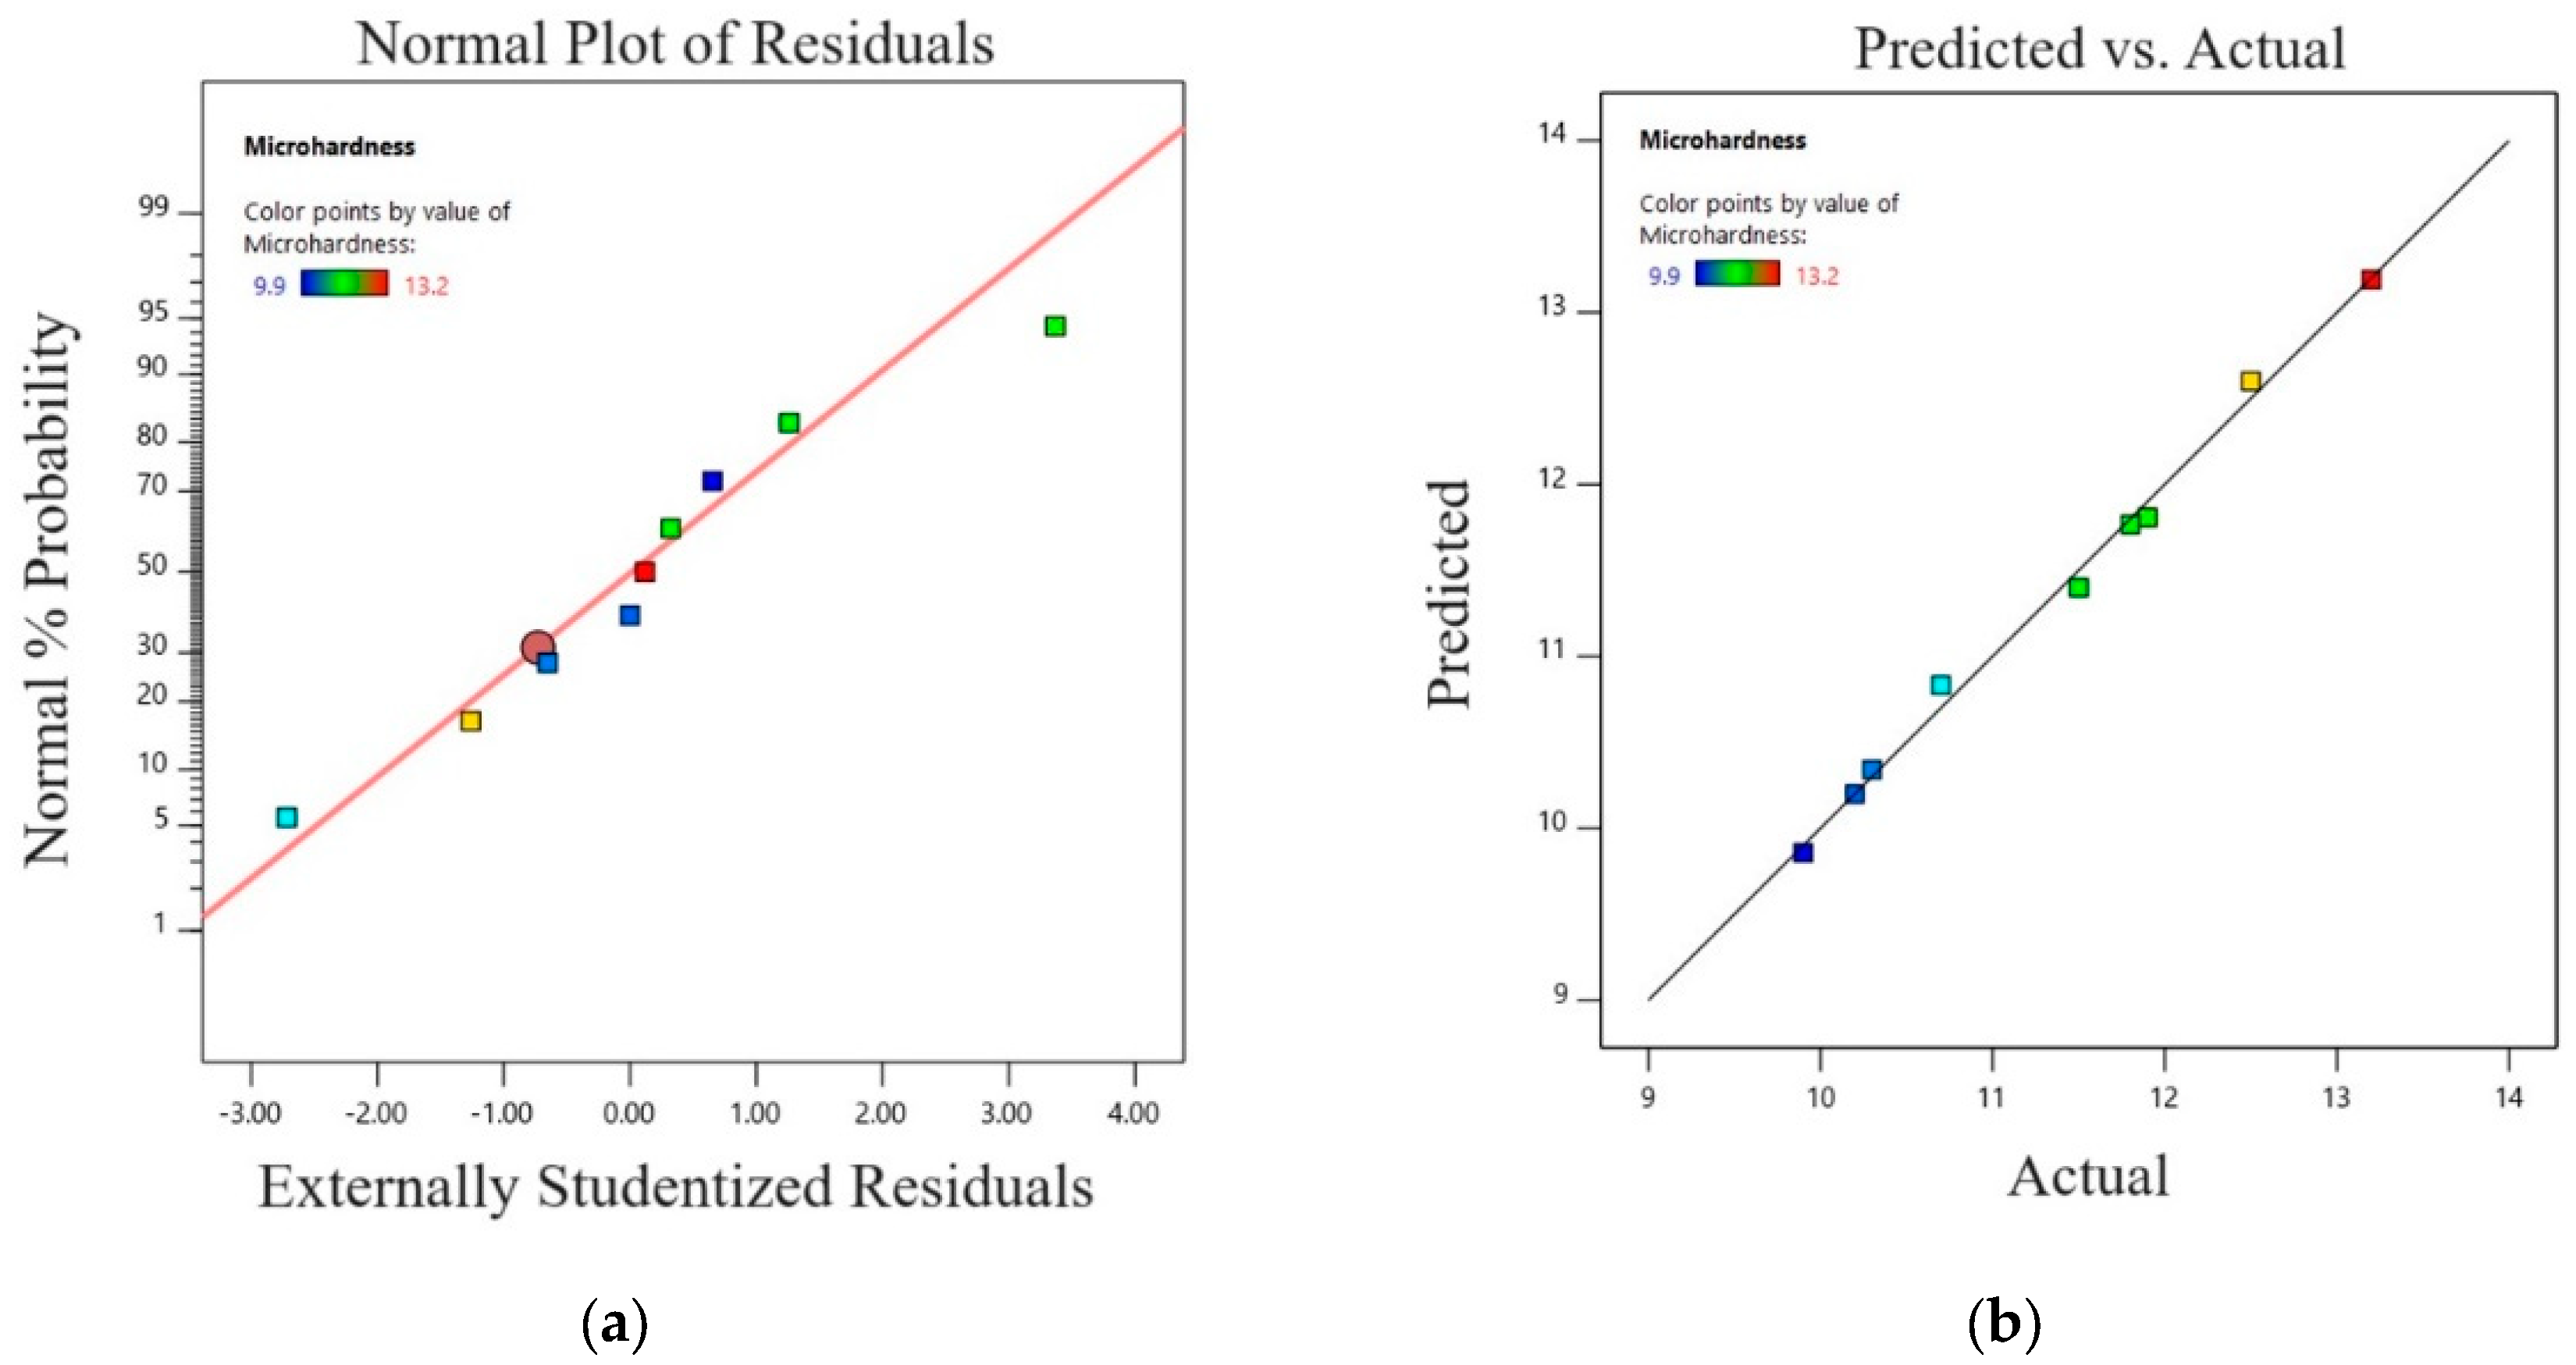
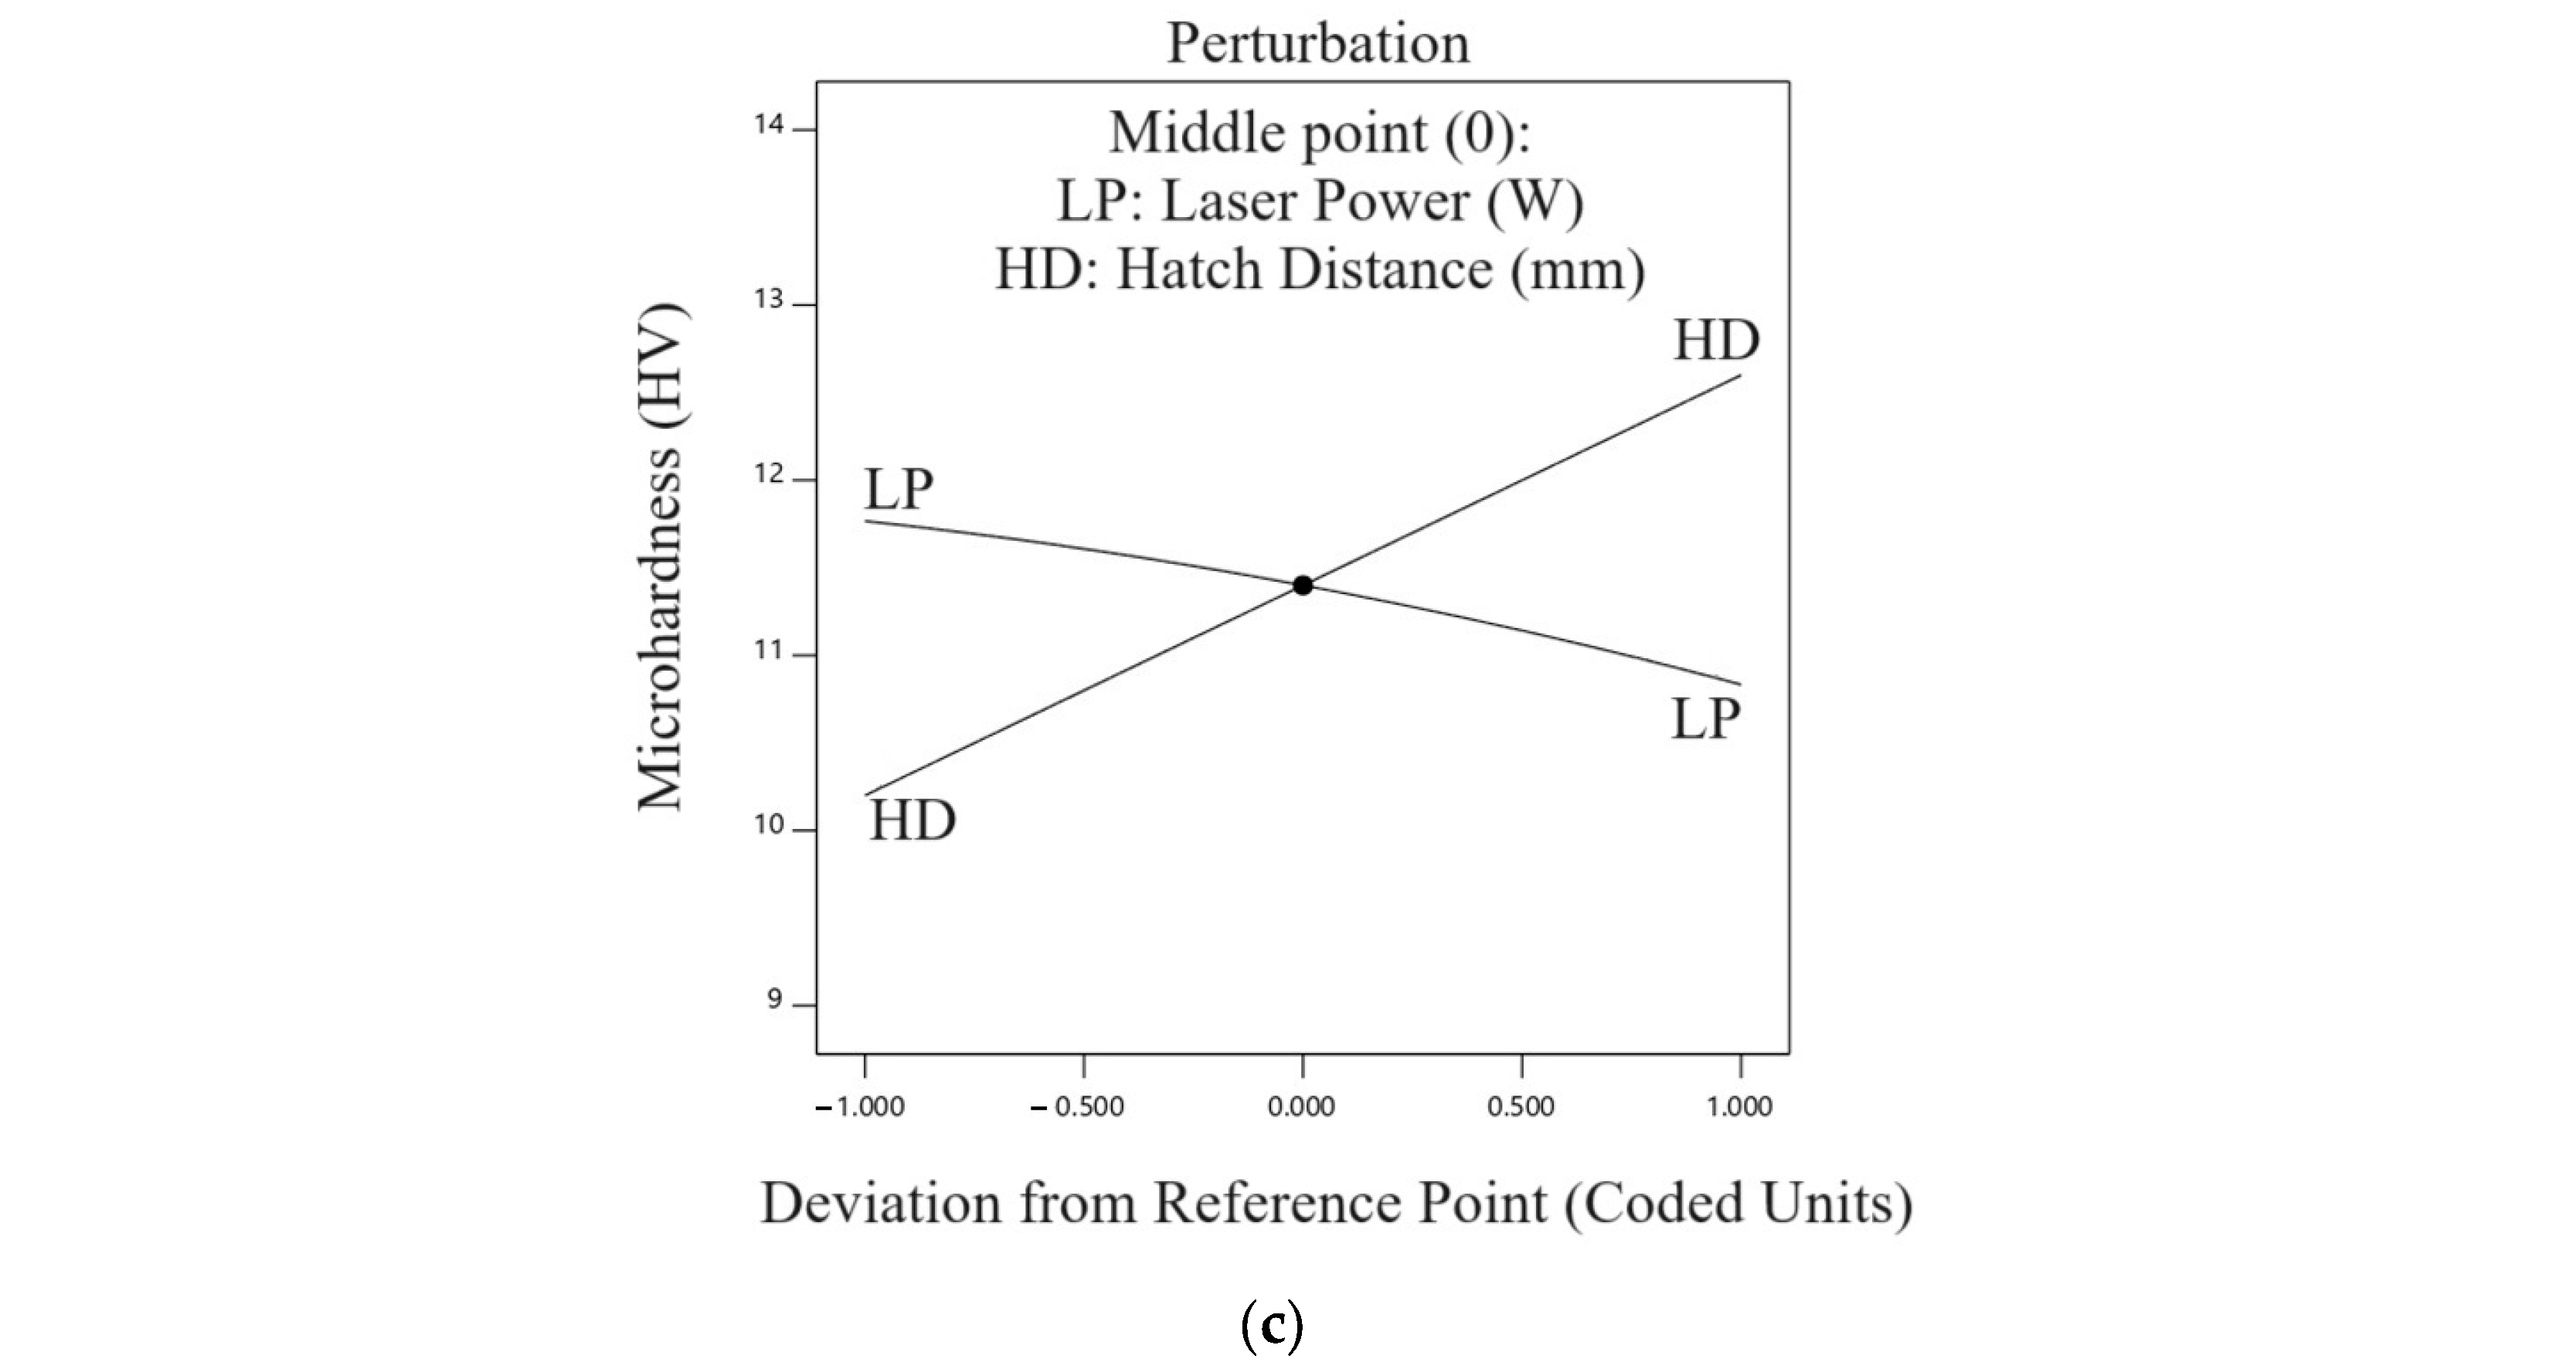
4.4. Microhardness Profiles
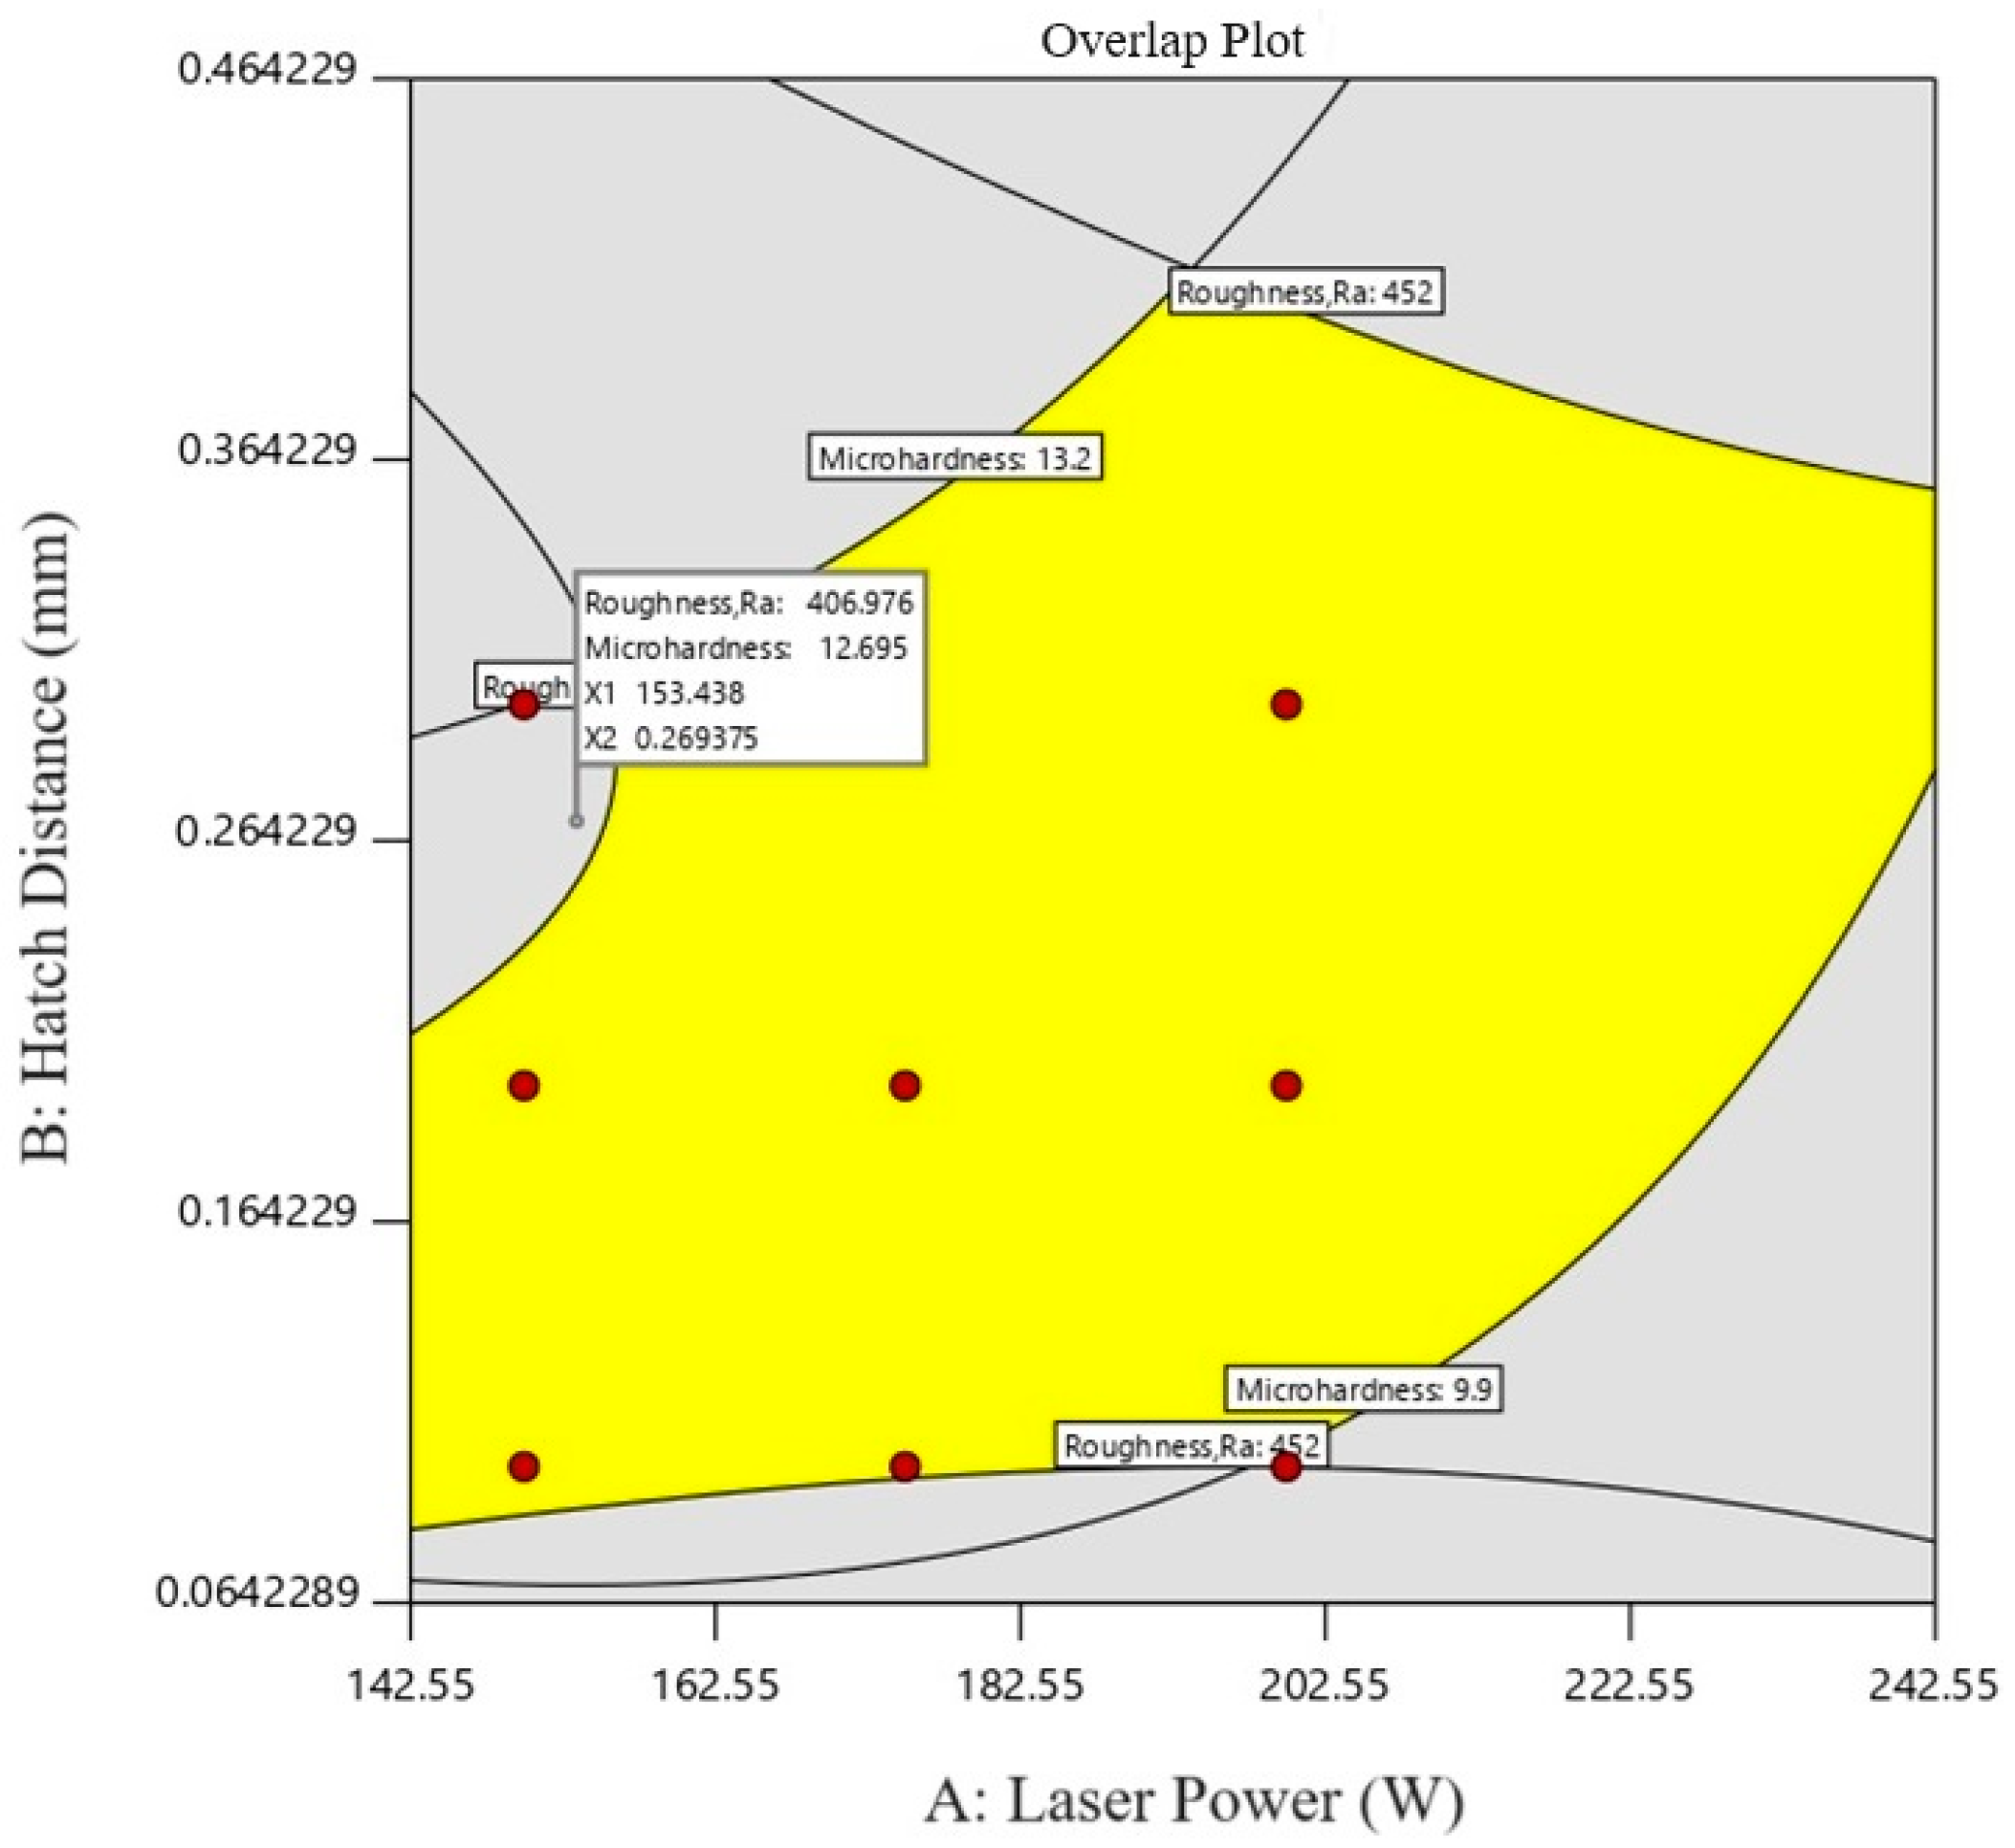
Table 4 illustrates the ANOVA outcomes for microhardness. It reveals the effectiveness of all main linear and quadratic parameters. Within the quadratic terms, the LP and HD quadratic terms (A2, B2, and C2) stand out significantly, alongside three impactful interactions depicted in the table. Analyzing ANOVA Table 4, Equations (5) and (6) display the regression relationship for the microhardness, considering the influential terms based on coded and actual values, respectively. Since the model was highly significant, with a reported p-value of 0.0012, it was presented in the form shown in Table 4 to account for the quadratic term.
Microhardness = +11.40 − 0.4667 A + 1.20 Hatch Distance − 0.2250 Laser Power × Hatch Distance − 0.1000 Laser Power2 + 0.0000 Hatch Distance2
Microhardness = +4.21667 + 0.055333 Laser Power + 27.75000 Hatch Distance − 0.090000 Laser Power × Hatch Distance − 0.000160 Laser Power2 − 1.81542 × −13 Hatch Distance2
Figure 8a shows the response surface graph, while Figure 8b displays a contour plot for microhardness concerning LP and HD parameters. These graphs, based on regression Equations (5) and (6), are interpolated by the data. Due to the coefficients of each parameter in the regression equations and static analysis, the plots related to the interaction effect of LP with HD, have assumed an oscillatory pattern. This phenomenon arises from the rapid freezing and solidification of the powder following its melting by the laser within each distinct interval. The microhardness of the samples undergoes variations contingent upon these conditions, which are highly influenced by input parameters.
Figure 9 displays the normal plot of residuals. This plot illustrates that the differences between observed and predicted values in the regression analysis are tightly clustered around the line, indicating a close alignment. Additionally, Figure 9b graphically demonstrates the proximity of actual and predicted amounts to the line, signifying the accurate prediction by the statistical analysis of the responses for microhardness analysis. Figure 9c shows the perturbation plot of microhardness, highlighting the depiction of parameter interactions affecting microhardness and the simultaneous impact of these parameters on microhardness. As shown in Figure 9c, increasing the laser power (LP) led to an increase in microhardness due to the proper melting of the powder in the melt pool, resulting in the complete formation of the metal.

5. Optimization

Based on statistical analysis of the regression model of relations between input parameters and output responses, optimization was performed using the RSM method. The statistical analysis of experimental data led to the regression equations that depict the connections between input parameters and output responses. Employing the function within the Design Expert V13 software facilitated process optimization to achieve specific conditions. Table 5 lists the constraints and criteria for both variables and responses to optimize the SLM process. Within Table 5, three solutions are presented, aiming to optimize the SLM process based on the criteria of minimizing SR and maximizing microhardness. All parameters and responses were given equal consideration, as the statistical analysis identified the significance of each input and output parameter in both the SR and microhardness sections.
After conducting the software analysis, three optimal samples were selected for potential modification to achieve two distinct responses (as shown in Table 6). This process involves a comprehensive review of the input parameters and their corresponding responses, which are illustrated in the overlay plots in Figure 10. The yellow areas in these plots represent the optimal response levels. This implies that selecting process parameters from the gray areas would result in insufficient microhardness and surface roughness. It is important to note that the software, aiming to minimize surface roughness, identified 10.1–10.4 µm as an acceptable range, while for microhardness, the maximum range selected was 432–438 HV. The software determined the range of input and output parameters based on DOE Table 1.

6. Conclusions

In conclusion, this study extensively explores the optimization of SLM parameters for Inconel 625, focusing on microstructure analysis and some defects after. Employing DOE and RSM, the investigation considered the correlation between LP and HD with microhardness and SR responses. SEM analysis revealed surface defects, guiding improvements for enhanced material integrity and performance. The subsequent bullet list shows the most significant findings from this investigation:
  • Insufficient fusion at the interfaces of five adjacent layers in Inconel 625 SLM samples, particularly when formed consecutively, often results in voids or pores within the material, impacting fusion quality.
  • Open pores in Inconel 625 SLM samples are linked to factors like rapid heating and cooling rates, keyhole effect, and powder properties, emphasizing the need to optimize process parameters for enhanced material integrity.
  • Response surface graphs and contour plots for SR parameters are derived from interpolated data using regression equations, providing clearer delineation of parameter effectiveness zones.
  • The interaction between HD and LP significantly influences SR, with decreasing LP and increasing HD leading to escalated roughness. Reduced LP impedes adequate energy delivery for complete material melting, resulting in incomplete fusion and visible gaps between laser paths, fostering incomplete melting and inadequate fusion.
  • The maximum microhardness achieved was 452 hv using an LP of 175 W and a hatch distance of 0.1 mm, while the minimum SR was 9.9 µm with an LP of 200 W and the same 0.1 mm HD.
  • As part of the optimization process, three samples were introduced, with LP levels ranging between 190 and 200 W and HD values between 0.2 and 0.3 mm.

Author Contributions

Conceptualization, M.K. and A.S.; methodology, M.K., M.B., A.S. and G.C.; software, M.K.; validation, M.K., A.S., M.B., R.S. and G.C.; investigation, M.K.; resources, A.S.; writing—original draft preparation, M.K., R.S. and M.B.; writing—review and editing, A.S., M.K., R.S., M.B and G.C.; supervision, A.S.H, and G.C.; project administration, A.S. All authors have read and agreed to the published version of the manuscript.

Funding

This research received no external funding.

Data Availability Statement

All data are included in the article.

Conflicts of Interest

The authors declare that they have no conflicts of interest.

Abbreviations

SLMSelective laser melting.
DOEDesign of experiments.
RSMResponse Surface Method.
LPLaser power.
HDHatch distance.
SRSurface roughness.
AMAdditive manufacturing.
LMDLaser metal deposition.
LPBFLaser powder bed fusion.
SEMScanning Electron Microscope.
HAZHeat-affected zone.
ANOVAAnalysis of variance.

References

  1. Ahmad, M.N.; Yahya, A. Effects of 3D printing parameters on mechanical properties of ABS samples. Designs 2023, 7, 136. [Google Scholar] [CrossRef]
  2. Blakey-Milner, B.; Gradl, P.; Snedden, G.; Brooks, M.; Pitot, J.; Lopez, E.; Leary, M.; Berto, F.; Du Plessis, A. Metal additive manufacturing in aerospace: A review. Mater. Des. 2021, 209, 110008. [Google Scholar] [CrossRef]
  3. Vafadar, A.; Guzzomi, F.; Rassau, A.; Hayward, K. Advances in metal additive manufacturing: A review of common processes, industrial applications, and current challenges. Appl. Sci. 2021, 11, 1213. [Google Scholar] [CrossRef]
  4. Li, Y.; Gu, D. Parametric analysis of thermal behavior during selective laser melting additive manufacturing of aluminum alloy powder. Mater. Des. 2014, 63, 856–867. [Google Scholar] [CrossRef]
  5. Casalino, G.; Campanelli, S.L.; Contuzzi, N.; Ludovico, A.D. Experimental investigation and statistical optimisation of the selective laser melting process of a maraging steel. Opt. Laser Technol. 2015, 65, 151–158. [Google Scholar] [CrossRef]
  6. Fang, Z.C.; Wu, Z.L.; Huang, C.G.; Wu, C.W. Review on residual stress in selective laser melting additive manufacturing of alloy parts. Opt. Laser Technol. 2020, 129, 106283. [Google Scholar] [CrossRef]
  7. Caiazzo, F.; Alfieri, V.; Casalino, G. On the Relevance of volumetric energy density in the investigation of inconel 718 laser powder bed fusion. Materials 2020, 13, 538. [Google Scholar] [CrossRef]
  8. Akram, J.; Pal, D.; Stucker, B. Establishing flow stress elongation relationships as a function of microstructural features of Ti6Al4V alloy processed using SLM. Designs 2019, 3, 21. [Google Scholar] [CrossRef]
  9. Chen, F.; Wang, Q.; Zhang, C.; Huang, Z.; Jia, M.; Shen, Q. Microstructures and mechanical behaviors of additive manufactured Inconel 625 alloys via selective laser melting and laser engineered net shaping. J. Alloys Compd. 2022, 917, 165572. [Google Scholar] [CrossRef]
  10. Marchese, G.; Garmendia Colera, X.; Calignano, F.; Lorusso, M.; Biamino, S.; Minetola, P.; Manfredi, D. Characterization and comparison of Inconel 625 processed by selective laser melting and laser metal deposition. Adv. Eng. Mater. 2017, 19, 1600635. [Google Scholar] [CrossRef]
  11. Li, S.; Wei, Q.; Shi, Y.; Zhu, Z.; Zhang, D. Microstructure characteristics of Inconel 625 superalloy manufactured by selective laser melting. J. Mater. Sci. Technol. 2015, 31, 946–952. [Google Scholar] [CrossRef]
  12. Pleass, C.; Jothi, S. Influence of powder characteristics and additive manufacturing process parameters on the microstructure and mechanical behaviour of Inconel 625 fabricated by Selective Laser Melting. Addit. Manuf. 2018, 24, 419–431. [Google Scholar] [CrossRef]
  13. Li, C.; White, R.; Fang, X.Y.; Weaver, M.; Guo, Y.B. Microstructure evolution characteristics of Inconel 625 alloy from selective laser melting to heat treatment. Mater. Sci. Eng. A 2017, 705, 20–31. [Google Scholar] [CrossRef]
  14. Li, C.; Guo, Y.B.; Zhao, J.B. Interfacial phenomena and characteristics between the deposited material and substrate in selective laser melting Inconel 625. J. Mater. Process. Technol. 2017, 243, 269–281. [Google Scholar] [CrossRef]
  15. Leary, M.; Mazur, M.; Williams, H.; Yang, E.; Alghamdi, A.; Lozanovski, B.; Zhang, X.; Shidid, D.; Farahbod-Sternahl, L.; Witt, G.; et al. Inconel 625 lattice structures manufactured by selective laser melting (SLM): Mechanical properties, deformation and failure modes. Mater. Des. 2018, 157, 179–199. [Google Scholar] [CrossRef]
  16. Criales, L.E.; Arısoy, Y.M.; Özel, T. Sensitivity analysis of material and process parameters in finite element modeling of selective laser melting of Inconel 625. Int. J. Adv. Manuf. Technol. 2016, 86, 2653–2666. [Google Scholar] [CrossRef]
  17. Wang, P.; Zhang, B.; Tan, C.C.; Raghavan, S.; Lim, Y.F.; Sun, C.N.; Wei, J.; Chi, D. Microstructural characteristics and mechanical properties of carbon nanotube reinforced Inconel 625 parts fabricated by selective laser melting. Mater. Des. 2016, 112, 290–299. [Google Scholar] [CrossRef]
  18. Hu, X.A.; Zhao, G.L.; Liu, F.C.; Liu, W.X. Microstructure mechanical behavior of Inconel 625 alloy processed by selective laser melting at high temperature up to 1000 °C. Rare Met. 2020, 39, 1181–1189. [Google Scholar] [CrossRef]
  19. Fang, X.Y.; Li, H.Q.; Wang, M.; Li, C.; Guo, Y.B. Characterization of texture and grain boundary character distributions of selective laser melted Inconel 625 alloy. Mater. Charact. 2018, 143, 182–190. [Google Scholar] [CrossRef]
  20. Kundakcıoğlu, E.; Lazoglu, I.; Poyraz, Ö.; Yasa, E.; Cizicioğlu, N. Thermal and molten pool model in selective laser melting process of Inconel 625. Int. J. Adv. Manuf. Technol. 2018, 95, 3977–3984. [Google Scholar] [CrossRef]
  21. Sun, Y.; Chen, L.; Li, L.; Ren, X. High-temperature oxidation behavior and mechanism of Inconel 625 super-alloy fabricated by selective laser melting. Opt. Laser Technol. 2020, 132, 106509. [Google Scholar] [CrossRef]
  22. Balbaa, M.A.; Elbestawi, M.A.; McIsaac, J. An experimental investigation of surface integrity in selective laser melting of Inconel 625. Int. J. Adv. Manuf. Technol. 2019, 104, 3511–3529. [Google Scholar] [CrossRef]
  23. Shrestha, S.; Chou, K. An investigation into melting modes in selective laser melting of Inconel 625 powder: Single track geometry and porosity. Int. J. Adv. Manuf. Technol. 2021, 114, 3255–3267. [Google Scholar] [CrossRef]
  24. Mazur, M.; Benoit, M.; Easton, M.; Brandt, M. Selective laser melting of Inconel 625 alloy with reduced defect formation. J. Laser Appl. 2020, 32, 022058. [Google Scholar] [CrossRef]
  25. Yan, X.; Gao, S.; Chang, C.; Huang, J.; Khanlari, K.; Dong, D.; Ma, W.; Fenineche, N.; Liao, H.; Liu, M. Effect of building directions on the surface roughness, microstructure, and tribological properties of selective laser melted Inconel 625. J. Mater. Process. Technol. 2021, 288, 116878. [Google Scholar] [CrossRef]
  26. Liu, M.; Wang, Q.; Cai, Y.; Lu, D.; Pei, Y.; Zhang, H.; Liu, Y.; Wang, Q. Dependence on manufacturing directions of tensile behavior and microstructure evolution of selective laser melting manufactured Inconel 625. J. Mater. Eng. Perform. 2023, 32, 7488–7500. [Google Scholar] [CrossRef]
  27. Hong, M.; Wang, S.; Sun, W.; Geng, Z.; Xin, J.; Ke, L. Effect of welding speed on microstructure and mechanical properties of selective laser melting Inconel 625 alloy laser welded joint. J. Mater. Res. Technol. 2022, 19, 2093–2103. [Google Scholar] [CrossRef]
  28. Huang, W.; Li, Y.; Yanjie, R.E.N.; Sun, J.; Xia, Z.; Zhou, L.; Li, C.; Chen, J.; Niu, Y.; Zhao, Y. Effect of scanning speed on the high-temperature oxidation resistance and mechanical properties of Inconel 625 alloys fabricated by selective laser melting. Vacuum 2022, 206, 111447. [Google Scholar] [CrossRef]
  29. Du, K.; Yang, L.; Xu, C.; Wang, B.; Gao, Y. High Strain Rate Yielding of Additive Manufacturing Inconel 625 by Selective Laser Melting. Materials 2021, 14, 5408. [Google Scholar] [CrossRef]
  30. Zhang, M.; Liang, X.; Zhang, X.; Liu, M.; Chu, Q.; Zhou, X. Effects of Heat Treatment on Microstructure and Properties of Inconel625 Alloy Blades Prepared by Selective Laser Melting. Int. J. Electrochem. Sci. 2022, 17, 220112. [Google Scholar] [CrossRef]
  31. Pleass, C.; Jothi, S.; Krishnan, M. Grain boundary and triple junction characteristics analytics of additive manufactured Inconel 625 superalloy using selective laser melting. Mater. Sci. Eng. A 2023, 869, 144744. [Google Scholar] [CrossRef]
  32. Lee, J.; Song, S.; Byeon, M.; Hong, H.U. Suppression of twin formation by bimodal-sized particles and brittle grain boundary fracture in selective laser melted Inconel 625. Mater. Sci. Eng. A 2022, 847, 143315. [Google Scholar] [CrossRef]
  33. Soni, H.; Gor, M.; Rajput, G.S.; Sahlot, P. A comprehensive review on effect of process parameters and heat treatment on tensile strength of additively manufactured Inconel-625. Mater. Today Proc. 2021, 47, 4866–4871. [Google Scholar] [CrossRef]
  34. Chaurasia, J.K.; Jinoop, A.N.; Parthasarathy, P.; Paul, C.P.; Bindra, K.S.; Bontha, S. Study of melt pool geometry and solidification microstructure during laser surface melting of Inconel 625 alloy. Optik 2021, 246, 167766. [Google Scholar] [CrossRef]
  35. Wang, J.; Wang, Y.; Su, Y.; Shi, J. Evaluation of in-situ alloyed Inconel 625 from elemental powders by laser directed energy deposition. Mater. Sci. Eng. A 2022, 830, 142296. [Google Scholar] [CrossRef]
  36. Hong, K.M.; Grohol, C.M.; Shin, Y.C. Comparative assessment of physics-based computational models on the NIST benchmark study of molten Pool dimensions and microstructure for selective laser melting of Inconel 625. Integr. Mater. Manuf. Innov. 2021, 10, 58–71. [Google Scholar] [CrossRef]
  37. Sitek, R.; Ciftci, J.; Moszczyńska, D.; Maj, P.; Ura-Bińczyk, E.; Warzybok, P.; Cieślik, I.; Wiśniewski, P.; Mizera, J. Effect of annealing on the microstructure and properties of IN 625 specimens manufactured by selective laser melting. Arch. Civ. Mech. Eng. 2022, 22, 207. [Google Scholar] [CrossRef]
  38. Hu, Y.; Lin, X.; Li, Y.; Ou, Y.; Gao, X.; Zhang, Q.; Li, W.; Huang, W. Microstructural evolution and anisotropic mechanical properties of Inconel 625 superalloy fabricated by directed energy deposition. J. Alloys Compd. 2021, 870, 159426. [Google Scholar] [CrossRef]
  39. Hu, Y.; Lin, X.; Li, Y.; Zhang, S.; Zhang, Q.; Chen, W.; Li, W.; Huang, W. Influence of heat treatments on the microstructure and mechanical properties of Inconel 625 fabricated by directed energy deposition. Mater. Sci. Eng. A 2021, 817, 141309. [Google Scholar] [CrossRef]
  40. Li, B.; Du, J.; Sun, Y.; Zhang, S.; Zhang, Q. On the importance of heat source model determination for numerical modeling of selective laser melting of IN625. Opt. Laser Technol. 2023, 158, 108806. [Google Scholar] [CrossRef]
  41. Allam, A.; Sugino, C.; Harding, M.; Bishop, D.P.; Erturk, A.; Ruzzene, M. Phased Array Ultrasonic Testing of Inconel 625 Produced by Selective Laser Melting. J. Nondestruct. Eval. Diagn. Progn. Eng. Syst. 2021, 4, 041006. [Google Scholar] [CrossRef]
  42. Wormald, S.; Clingenpeel, J.; Vincent, T.; Chaudhary, A. Integrated Computational Materials Engineering to Predict Dimensions for Steady-State and Transient Melt-Pool Formation in the Selective Laser Melting of Inconel 625. Integr. Mater. Manuf. Innov. 2021, 10, 348–359. [Google Scholar] [CrossRef]
  43. Teng, Q.; Li, S.; Wei, Q.; Shi, Y. Investigation on the influence of heat treatment on Inconel 718 fabricated by selective laser melting: Microstructure and high temperature tensile property. J. Manuf. Process. 2021, 61, 35–45. [Google Scholar] [CrossRef]
  44. Schmeiser, F.; Krohmer, E.; Wagner, C.; Schell, N.; Uhlmann, E.; Reimers, W. In situ microstructure analysis of Inconel 625 during laser powder bed fusion. J. Mater. Sci. 2021, 57, 9663–9677. [Google Scholar] [CrossRef]
  45. Zhou, L.; Peng, Z.; Chen, J.; Ren, Y.; Niu, Y.; Qiu, W.; Tang, J.; Li, Z.; Li, C. The evolution of microstructure and mechanical properties of Inconel 625 alloy fabricated by laser powder bed fusion via novel hybrid scanning strategy. Mater. Sci. Eng. A 2024, 911, 146925. [Google Scholar] [CrossRef]
  46. Li, B.; Sun, Y.; Du, J.; Xia, Y.; Su, G.; Zhang, Q. Comparison of Heat Source Model for Numerical Modeling of Selective Laser Melting of IN625 Superalloy. Trans. Nanjing Univ. Aeronaut. Astronaut. 2024, 41, 174. [Google Scholar]
  47. Moradi, M.; Pourmand, Z.; Hasani, A.; Moghadam, M.K.; Sakhaei, A.H.; Shafiee, M.; Lawrence, J. Direct laser metal deposition (DLMD) additive manufacturing (AM) of Inconel 718 superalloy: Elemental, microstructural and physical properties evaluation. Optik 2022, 259, 169018. [Google Scholar] [CrossRef]
  48. Angelastro, A.; Campanelli, S.L.; Casalino, G. Statistical analysis and optimization of direct metal laser deposition of 227-F Colmonoy nickel alloy. Opt. Laser Technol. 2017, 94, 138–145. [Google Scholar] [CrossRef]
Figure 1. (a) Schematic of selective laser melting for processing Inconel 625 powder (b) sample images of #1 to #9 (c) dimensions of the samples for length (10 mm) and thickness (4 mm).
Designs 08 00087 g001
Figure 2. Microstructure analysis of samples #1, #3, and #7 with different input parameters including LP = 150–200 W, and HD = 0.1–0.3 mm (a) sample #1, (b) sample #3, and (c) sample #7.
Designs 08 00087 g002
Figure 3. Macro structures of SLM sample #1 considering (LP = 200 W, and HD = 0.1 mm) the process parameters.
Designs 08 00087 g003
Figure 4. The defects on samples #5, #8, and #11 (a) porosities on sample #5, (b,c) lack of fusion of sample #8. (d) Open pore on sample #11.
Designs 08 00087 g004
Figure 5. (a) Surface roughness diagrams of response surface graph of LP and HD. (b) contour plot of HD and LP.
Designs 08 00087 g005
Figure 6. Surface appearance of the direction of surface roughness test on sample #9 by considering Ra factor for the measurement.
Designs 08 00087 g006
Figure 7. (a) Normal plot of residuals; (b) predicted and actual graph; (c) perturbation plot.
Designs 08 00087 g007aDesigns 08 00087 g007b
Figure 8. (a) Microhardness diagrams of response surface graph of LP and HD. (b) Contour plot of LP and HD.
Designs 08 00087 g008
Figure 9. (a) Normal plot of residuals; (b) predicted and actual graph; (c) perturbation plot.
Designs 08 00087 g009aDesigns 08 00087 g009b
Figure 10. Overlay contour plot of hatch distance and laser power. The yellow area shows the optimum area and the gray area shows the less effective process parameters of the SLM process for Inconel 625.
Designs 08 00087 g010
Table 1. Design of experiments’ input and output parameters.
No.Input ParametersResponses
Laser Power
(W)
Hatch Distance
(mm)
Microhardness
(hv)
Roughness
(µm)
12000.14489.9
21500.144910.3
32000.342511.9
41750.242211.5
52000.243610.7
61500.340613.2
71750.341812.5
81500.240811.8
91750.145210.2
Table 2. Chemical composition of Inconel 625 powder.
ElementsNiFeMoNbCoTaTiCrAl
%605100.910.80.7210.6
Table 3. Analysis of variance ANOVA model of surface roughness.
SourceSum of SquaresdfMean SquareF-Valuep-Value
Model2266.785453.369.900.0440significant
A-Laser Power322.671322.677.040.0767
B-Hatch Distance1600.6711600.6734.940.0097
Laser Power × Hatch Distance81.00181.001.770.2757
Laser Power25.5615.560.12130.7507
Hatch Distance2256.891256.895.610.0987
Residual137.44345.81
Cor Total2404.228
Table 4. Analysis of variance ANOVA model of microhardness.
SourceSum of SquaresdfMean SquareF-Valuep-Value
Model10.1752.03120.030.0012significant
A-Laser Power1.3111.3177.110.0031
B-Hatch Distance8.6418.64509.900.0002
AB0.202510.202511.950.0407
A20.020010.02001.180.3568
B20.000010.00000.00001.0000
Residual0.050830.0169
Cor Total10.228
Table 5. Constraints of SLM input and output parameters.
Parameter/ResponseGoalLower LimitUpper LimitImportance
ParametersLP (W)in range1502003
HD (mm)in range0.10.33
ResponseSR (µm)Minimize9.713.23
Microhardness (hv)Maximize4005003
Table 6. Predicted and real parameters for optimum samples.
ParametersResponse
No.Laser Power
(W)
Hatch Distance
(mm)
SR
(µm)
Microhardness
(hv)
12000.300Predicted10.1438
22000.300Predicted10.2435
31900.200Predicted10.4432
Disclaimer/Publisher’s Note: The statements, opinions and data contained in all publications are solely those of the individual author(s) and contributor(s) and not of MDPI and/or the editor(s). MDPI and/or the editor(s) disclaim responsibility for any injury to people or property resulting from any ideas, methods, instructions or products referred to in the content.

