Abstract
Bridges are an integral and important part of road networks, but monitoring their condition using traditional methods is expensive, dangerous, and laborious. This study examines the rapidly emerging field of drone-based transportation asset monitoring, focusing on analyzing the cost efficiency and effectiveness of drone applications in bridge condition monitoring. This research innovated a multi-dimensional framework that highlights the transformative role of drone technology in enhancing inspection accuracy, safety, and cost savings. Using statistical models and Monte Carlo simulations, the framework provides an extensive cost–benefit analysis to inform drone investment decisions. A case study demonstrates the utility of the framework in quantifying costs and benefits. Furthermore, a sensitivity analysis evaluates how variations in drone costs, driven by technological progress, can potentially influence adoption of the technology.
1. Introduction
The American Society of Civil Engineers (ASCE) reported that the United States has more than 617,000 bridges, many exceeding 50 years in age, with 42% requiring repairs and 7.5% classified as structurally deficient [1]. This situation highlights the critical need for effective condition monitoring to maintain structural integrity. Many organizations use traditional monitoring methods that are often expensive and time-intensive, increasing interest in more innovative and efficient solutions. Unmanned aerial vehicles (UAVs), or drones, are increasingly adopted across industries for their ability to efficiently cover and assess large infrastructure areas, providing comprehensive visual data often missed in manual inspections [2]. These capabilities accelerate evaluations and offer a cost-effective alternative to traditional approaches.
Drones provide valuable capabilities for bridge monitoring but also have notable limitations. Drone condition monitoring faces challenges, such as battery life constraints, adverse weather conditions (wind, rain, fog), and GPS signal interference, which affect flight stability and data accuracy. Restricted airspace regulations and data processing complexities further hinder deployment. Advancing battery technology, sensor durability, and regulatory frameworks are crucial to enhancing the reliability of inspections [3].
The American Association of State Highway and Transportation Officials (AASHTO) categorized bridge inspections into eight types: initial, routine, damage, in-depth, fracture-critical, underwater, routine wading, and special inspections. Routine inspections, the most common type, primarily rely on visual methods to identify defects. While drones enhance routine inspections with their broad coverage, they are less effective at tasks requiring direct physical interaction, such as inspection of internal structural elements. Drones are also unsuited for underwater inspections and cannot detect fractures due to their lack of tactile assessments or advanced nondestructive testing [4].
Drones are particularly effective at inspecting steel and concrete structures. However, they face challenges in navigating tight spaces, capturing specific angles, and detecting subtle color changes in steel bridges. Drones cannot assess the subsurface conditions of composite and timber bridges [5]. These limitations highlight the importance of considering both inspection types and bridge materials when implementing drone technology for monitoring purposes. Hence, the most effective application of drones lies in the routine inspection of concrete and steel bridges, which is the scope of this study’s focus.
The main contribution of this study is a framework and methodology to evaluate the costs and benefits of drone-based condition monitoring (D-BCM) relative to traditional-based condition monitoring (T-BCM) of linear transportation assets. The proposed framework aims to help organizations make informed decisions regarding the adoption of drone technology by providing insights into its economic viability, potential benefits, and associated risks.
The rest of this paper proceeds as follows. Section 2 reviews the literature on drone technology, remote sensing technologies, and quantitative modeling. Section 3 presents the data mining workflow and defines all of the variables utilized in the study. Section 4 defines the mathematical models, outlining the methodology used to quantify the costs and benefits of D-BCM. Section 5 presents the results and discusses their implications for stakeholders. Section 6 concludes the research and suggests directions for future work.
2. Literature Review
Recent research highlights the significant benefits of drone technology in bridge inspection and monitoring. Perry et al. (2020) demonstrated the efficiency and accuracy of drones in assessing structural damage, improving both visualization and quantification [6]. Hubbard and Hubbard (2020) investigated the safety advantages of drones, quantifying these benefits through worker compensation rates and survey data from a state Department of Transportation case study [7]. Azari, O’Shea, and Campbell (2022) introduced a sensor-equipped drone prototype that enhances data collection and management processes for bridge inspections [8].
Song, Yoo, and Zatar (2022) have developed iBIRD, a web-based tool for managing drone-assisted bridge inspections, featuring 3D modeling and report generation [9]. Dorafshan and Maguire (2018) demonstrated drones equipped with self-navigation and image processing, enabling the creation of accurate, autonomous 3D models for damage identification [10]. Chen et al. (2019), however, point out the limitations of image-based methods in areas lacking distinct features [11]. Addressing environmental challenges, Aliyari et al. (2021) performed a hazard analysis of drone inspection risks under harsh conditions, focusing on human performance impacts, including drone pilots [12].
Dorafshan et al. (2017) demonstrated the effectiveness of drones in detecting damage on concrete and steel bridges, with results comparable to human inspections and the added advantage of real-time feedback [13]. They argued that current drone technology primarily serves as an assistive tool, improving the speed, cost efficiency, and safety of bridge inspections while eliminating the need for traffic closures [13]. Hubbard et al. (2020) investigated the role of drones in enhancing bridge inspection safety [7]. The study surveyed bridge inspectors and developed a benefit–cost methodology based on worker compensation rates to assess the safety benefits of drones. Although both studies recognize the cost and time efficiencies of drones, they lacked detailed quantification of these benefits. The present study fills these research gaps by developing a comprehensive framework to quantify the benefits and costs of using drones in bridge condition monitoring.
3. Data
The next subsections discuss the data mining workflow, define the variables in the framework, and explain the methods of quantifying the costs and benefits, data analysis, uncertainty management, and related simulations.
3.1. Data Mining Workflow
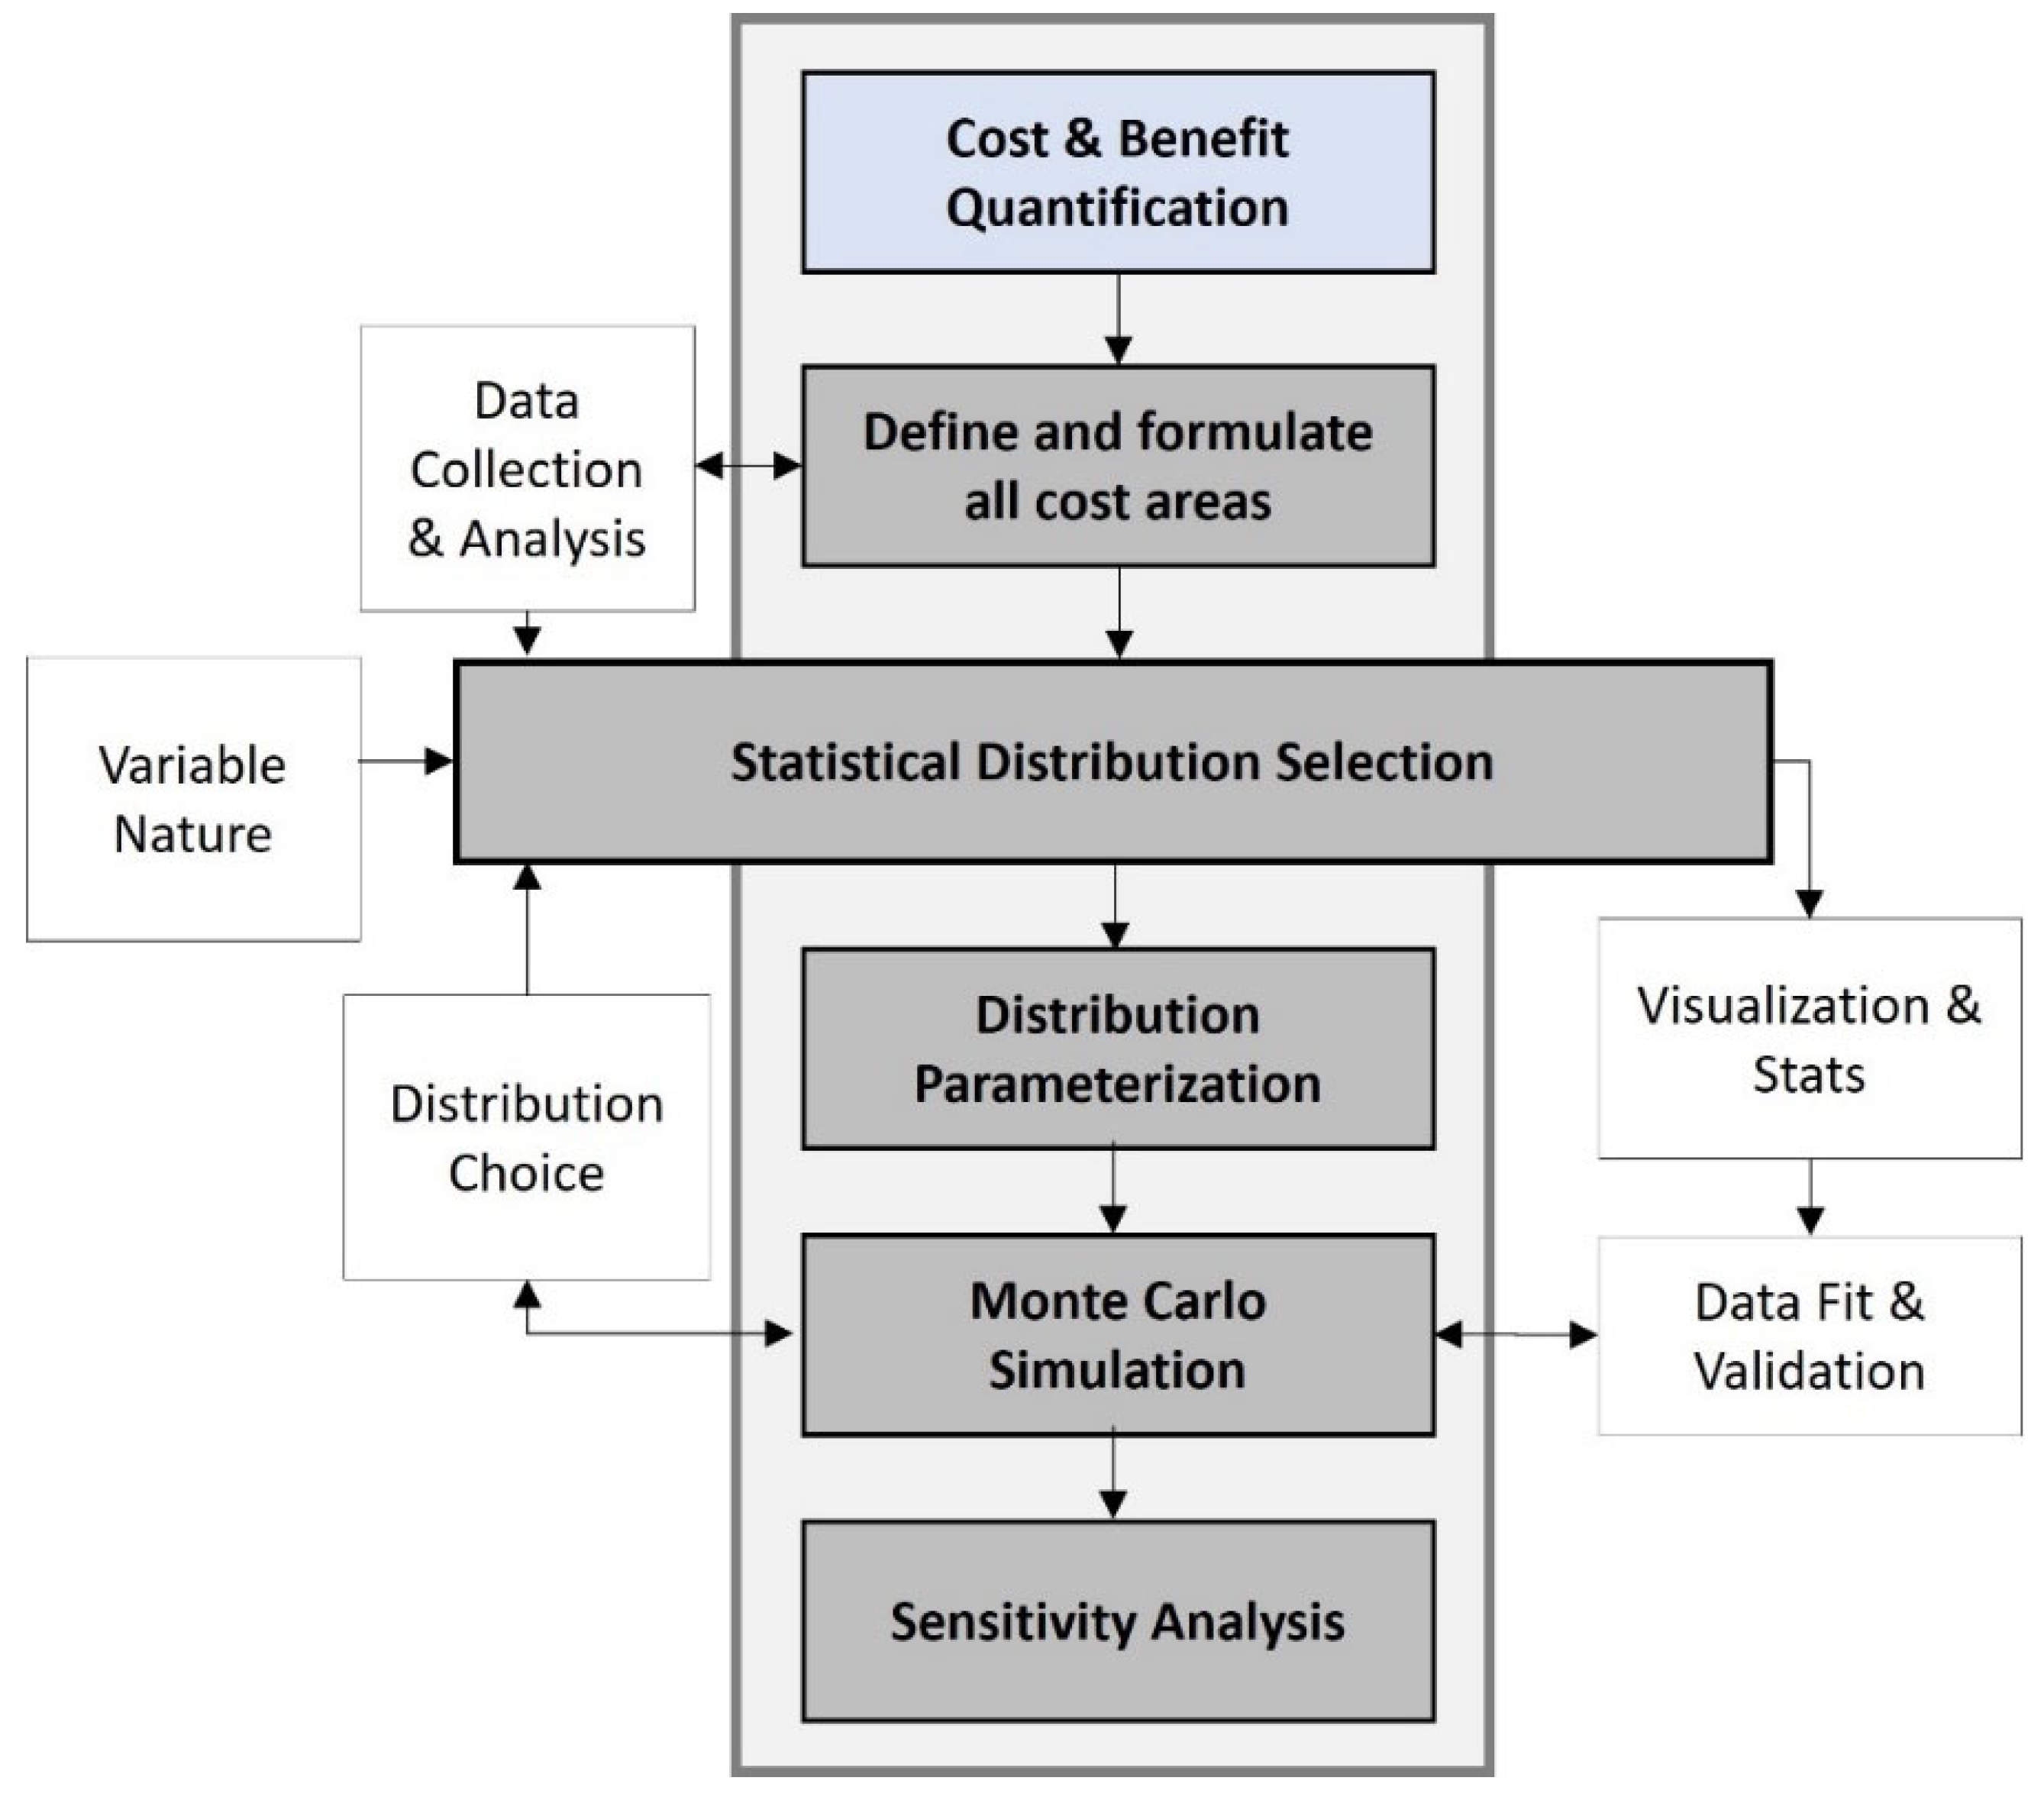
Figure 1 illustrates the data mining and analytical workflow for quantifying variables. The workflow starts by identifying the cost and benefit components of D-BCM. It then models these aspects for both drone-based and traditional methods, incorporating direct and indirect factors before formulating the overall cost–benefit structure.

Figure 1.
Workflow for quantifying the variables.
Monte Carlo simulation (MCS) serves as a probabilistic forecasting tool, selecting values from a user-defined probability distribution to assess multiple model scenarios [14]. The workflow compiles data by categorizing variables as either stochastic or deterministic. Statistical models and goodness-of-fit tests fit appropriate distributions to the data. Given database uncertainties, stochastic variables undergo MCS, and results are compared with empirical data to validate accuracy. Additionally, the case study utilizes sensitivity analysis and scenario forecasting for future drone pricing trends.
3.2. Variables
Table 1 presents all of the variables used in the cost and benefit models of this study, including their descriptions, categories, and classification as either stochastic or deterministic. It also details the time frame associated with each variable, the cost for deterministic variables, and the corresponding data sources.

Table 1.
Variables used in the model.
The framework classified the variables into deterministic and stochastic categories based on the databases and their nature to provide a clear overview of the economic factors considered.
Drone Price. For monitoring linear assets, multicopters are preferred, with quadcopters accounting for the majority and hexacopters making up the remaining 40% [3]. Among drone manufacturers, DJI currently leads the industry, holding over 70% of the global drone market, as reported by CNBC [23]. Aside from any governmental restrictions on manufacturing origin, key considerations when selecting a drone for inspections include flight time, camera quality, weather stability, obstacle detection capabilities, and industrial-grade features [24]. Inspectors commonly use optical cameras, thermal cameras, and LiDAR systems based on specific inspection requirements. The present study focuses on concrete and steel bridge inspections, where cameras are the most suitable payload. Table 2 provides a summary of suitable drones and their payload specifications.
Standardized Battery Price. D-BCM necessitates multiple battery replacements. The price of drone batteries varies based on type (LiPo or Li-ion), the number of batteries required, drone brand, and battery life. While some drones require only one battery, others may need up to six. This variability makes it challenging to directly compare prices. Thus, for a clear comparison of drone batteries, standardization becomes essential. This formula converts the raw battery cost into a standardized cost per flight hour.
where FT is the battery flight time and CC denotes the estimated number of charge cycles (approximately 300) before the LiPo battery degrades by retaining 80% of its original capacity [25,26]. The lifespan of a Skydio X2 battery is one year or 200 battery cycles [27]. BP is the price of the battery, and NBP is the required number of batteries for each drone.
Post-Processing Time. A significant benefit of D-BCM is that it not only decreases the duration of inspections but also reduces the need for extensive crew and time spent on inspection vehicles. The Minnesota Department of Transportation (MnDOT) provided inspection time data for both traditional and D-BCM [16].
Table 2.
Recommended drones and their payload for D-BCM.
Table 2.
Recommended drones and their payload for D-BCM.
| Drone | Price | Flight Time (Min) | Built-In Payload | Extra Required Payload | Data Source |
|---|---|---|---|---|---|
| DJI Mavic 3 Pro | USD 2199 to USD 3299 | 43 | Hasselblad: 4/3 CMOS, 20 MP Medium Tele: 1/1.3-inch CMOS, 48 MP Tele: 1/2-binch CMOS, 12 MP | - | [28] |
| DJI Air 3 | USD 1099 to USD 1550 | 46 | Wide-Angle: 1/1.3-inch CMOS Effective Pixels: 48 MP Medium Tele: 1/1.3-inch CMOS Effective Pixels: 48 MP | - | |
| DJI Phantom 4 Pro | USD 1599 to USD 1699 | 30 | 1” CMOS Effective Pixels: 20 MP | - | |
| DJI Matrice 600 Pro | USD 5000 to USD 6000 | 32 | - | Zenmuse (Z) X3: 1/2.3” CMOS/12 MP photos and 4K video at 30 fps: USD 500–USD 700 ZX5 and X5R: USD 1400–USD 1600/USD 3000 ZX7: USD 2700–USD 3000 Z30: USD 2500–USD 4000 | |
| DJI Matrice 300 RTK | USD 13,000 | 55 | Infrared Sensing System | ZH20 series: hybrid multi-sensor camera USD 5000 to USD 10,000 ZP1: full-frame sensor camera: USD 8000 | |
| MATRICE 210 RTK V2 | USD 10,000 to USD 15,000 | 34 | - | Z30: USD 2500–USD 4000 ZX4S: USD 600–USD 800 ZX5S: USD 1900–USD 2200 ZX7: USD 2700–USD 3000 ZXT2 | |
| Skydio 2+ | USD 5000 | 27 | Camera: Sony IMX577 CMOS sensor and Qualcomm RedDragon™ QCS605: 12 MP photos, 4K60 HDR video/45 MP | - | [27] |
| Skydio X10 | USD 15,000 | 40 | Narrow camera: 64 MP 1” wide camera: 50 MP Radiometric thermal: 640 × 512 px | - | |
| Parrot Anafi | USD 7000 | 32 | Vertical camera, ultra-sonar/2 × 6-axis IMU, 2 × 3-axis accelerometers, 2 × 3-axis gyroscopes, 4K video, thermal | - | [29] |
| Yuneec H520E | USD 2500 | 28 | - | E90 Camera: 1-inch CMOS sensor, 20 MP resolution. USD 1299–USD 1499 E50 Camera: USD 1200 CGOET Camera: USD 1900 | [30] |
| Elios 3 | USD 5000 | 12 | Visual camera and onboard LED lighting capable of 4K UHD videos. CMOS Effective Pixels: 12.3 | - | [31] |
| DJI Inspire 3 | USD 16,500 | 28 | X9-8K Air | - | [32] |
| AUTEL EVO 2 PRO RTK | USD 1500–USD 3000 | 40 | 1-inch CMOS | - | [33] |
Annual Maintenance and Unexpected Repair Cost. In alignment with other electronic devices, the values for AMP and URC are 10% and 2% of the drone price [18,19].
Software Cost. Effective D-BCM relies on specialized software for flight planning, photogrammetry, real-time monitoring, and data management. Manufacturers equip many drone models with proprietary software for flight planning and real-time monitoring, often including it in the package at no additional cost. Advanced cataloging systems, incorporating photogrammetric 3D models of bridges, enable precise identification and examination of specific bridge sections within inspection images [34]. Table 3 consolidates data from various DOT reports, showcasing commonly used software solutions and their associated costs in this field.
Table 3.
Software cost used by DOTs for D-BCM.
Insurance Cost. According to a DroneDeploy survey, most drone service providers choose liability insurance coverage of USD 1 million [42]. The insurance costs database lists 12 drone insurance companies for USD 1 M coverage.
Inspection Time Saving Percentage. Table 4 details the inspection durations for each method and lists the corresponding bridge sizes in feet [16].
Table 4.
Comparison of inspection hours for D-BCM and T-BCM.
Under-Bridge Vehicle Operation. Maintenance inspections for various bridge types require access to the upper or lower bridge areas, often utilizing under-bridge inspection vehicles. These specialized vehicles, equipped with articulated booms (sometimes extendable to three or four booms for enhanced reach), are available in self-propelled, truck-mounted, and trailer-mounted configurations [43]. Organizations typically rent these vehicles daily due to their high costs, often including operator services. This case study evaluates the costs associated with T-BCM by considering distinct vehicle types, their rental costs (including operators), and usage probabilities using data from MnDOT. Table 5 details vehicle categories, costs, and probabilities.
Table 5.
Inspection vehicles for T-BCM, their associated costs, and usage probabilities.
Reduced Lane Closure. T-BCM often requires lane or road closures, increasing costs and disruptions. Temporary traffic control measures must comply with the Manual on Uniform Traffic Control Devices (MUTCD) and local standards. Using equipment like UBIVs requires lane closures, incurring traffic control costs ranging from USD 500 to USD 2500 daily. Drone inspections reduce reliance on such equipment, minimizing lane closures and associated direct and user costs. Table 6 presents the direct costs associated with various road closure types, based on data sourced from MnDOT [16].
Table 6.
Direct costs per day for various road closure types.
4. Methodology and Modeling
Several cost components collectively shape the economic landscape of D-BCM. As technology progresses, components, such as drone hardware, software algorithms, and operational expenses, experience fluctuations. This study categorizes costs into eight groups: drone components, ground infrastructure, personnel, maintenance, IT infrastructure, data processing, insurance, and deployment. The cost model integrates these elements to quantify total costs (Ctotal), covering acquisition, maintenance, infrastructure setup, personnel expenses, software, data processing, insurance, and regulatory fees. This structured approach ensures transparent and systematic evaluation of the financial feasibility of D-BCM.
The following cohesive financial model consolidates these varied costs:
The total benefits (Btotal) are the sum of contributions from various direct and indirect benefits, as follows:
Crew time savings (B1) result from the reduced workforce required for drone-based inspections compared with traditional methods. High-definition drone cameras minimize the need for roles, such as BILT and ABI, where costs depend on the number of inspectors and their durations. Operational vehicle cost savings (B2) stem from decreased reliance on UBIVs. These savings include costs for fuel, wages, operational hours, maintenance, and infrastructure expenses for vehicle facilities. Additionally, drones equipped with advanced sensors and cameras replace specialized inspection tools like gauges or ultrasonic testing devices, leading to tool cost savings (B3).
Drone-based inspections offer significant indirect benefits, including cost savings from enhanced safety (B4). For example, drones reduce reliance on costly safety equipment like harnesses and scaffolding. Drones also lower the risk of injuries or fatalities, which are more common in traditional methods due to hazardous conditions, fatigue, and extended work hours. This reduced risk translates into lower insurance premiums and fewer injury-related costs. PF and PI are, respectively, the likelihood of fatality and injury during inspection. According to the United States Department of Transportation (USDOT), the value of a statistical life primarily finds application in health economics, transport economics, and environmental economics [44].
Drones minimize the need for lane or track closures during inspections (B5), reducing labor, equipment, and permit costs associated with disruptions. This accounts for direct lane closure costs, travel time costs, vehicle operation costs, and accident risks. By avoiding closures and delays, drones enhance operational efficiency and reduce public inconvenience.
where DV is the average delay. Wisconsin Department of Transportation (WisDOT) data indicate that vehicles on major highways endure an average delay of 10 min (or 0.1667 h) due to lane closures. In contrast, those on minor roads experience a five-minute delay (or 0.0833 h) [45]. The value of travel time savings (VTTS) refers to the benefits provided by reductions in the amount of time spent riding in a vehicle [46]. The values are based on USDOT hourly VTTS values of USD 17.00/person-hour for personal journeys and USD 31.90/person-hour for business trips. Accounting for the customary distribution of 88.2% personal and 11.8% business travel, the result is a blended rate of USD 18.76/person-hour [22]. Considering the average vehicle occupancy rates (AVOR) of 1.48 persons per vehicle during weekday peak times and 1.58 persons per vehicle in off-peak times [22], the TTC values become USD 5.10/vehicle and USD 2.75/vehicle, respectively.
Furthermore, data from the FWHA specify an average traffic volume of 1500 vehicles per hour on major highways during peak hours and 500 vehicles per hour on minor roads in off-peak times [21]. This results in an aggregate TTCTotal of USD 6915 per hour for major highways at peak times and USD 1235 per hour for minor roads during off-peak hours.
5. Results and Discussion
5.1. Variables and Scenarios
This case study implements MCS using well-defined stochastic models to account for uncertainties in cost and benefit estimation for D-BCM. Because actual probability distributions for these variables may be incomplete due to limited observational data, statistical distribution fitting techniques model their variability. The selection of probability distributions is based on empirical data, industry reports, and expert judgment.
This study tests several statistical models to determine the best-fit distributions for each variable. Right-skewed distributions (such as log-normal, gamma, or Weibull) model cost-related variables based on their potential for extreme values and increasing costs over time. Normal and uniform distributions model benefit-related variables under the assumption of symmetrical variability. Goodness-of-fit tests (such as the Kolmogorov–Smirnov test, the Anderson–Darling test, and the Akaike Information Criterion) validate the distributions, ensuring that the simulated data closely match observed real-world distributions.
After defining the probability distributions, the Monte Carlo model randomly sampled from these distributions over 10,000 iterations, generating a large set of potential outcomes. This process quantified uncertainty and risk in D-BCM implementation, offering a probabilistic assessment instead of a single deterministic estimate. The model assumes independence among most cost and benefit factors, except where empirical data suggest correlation.
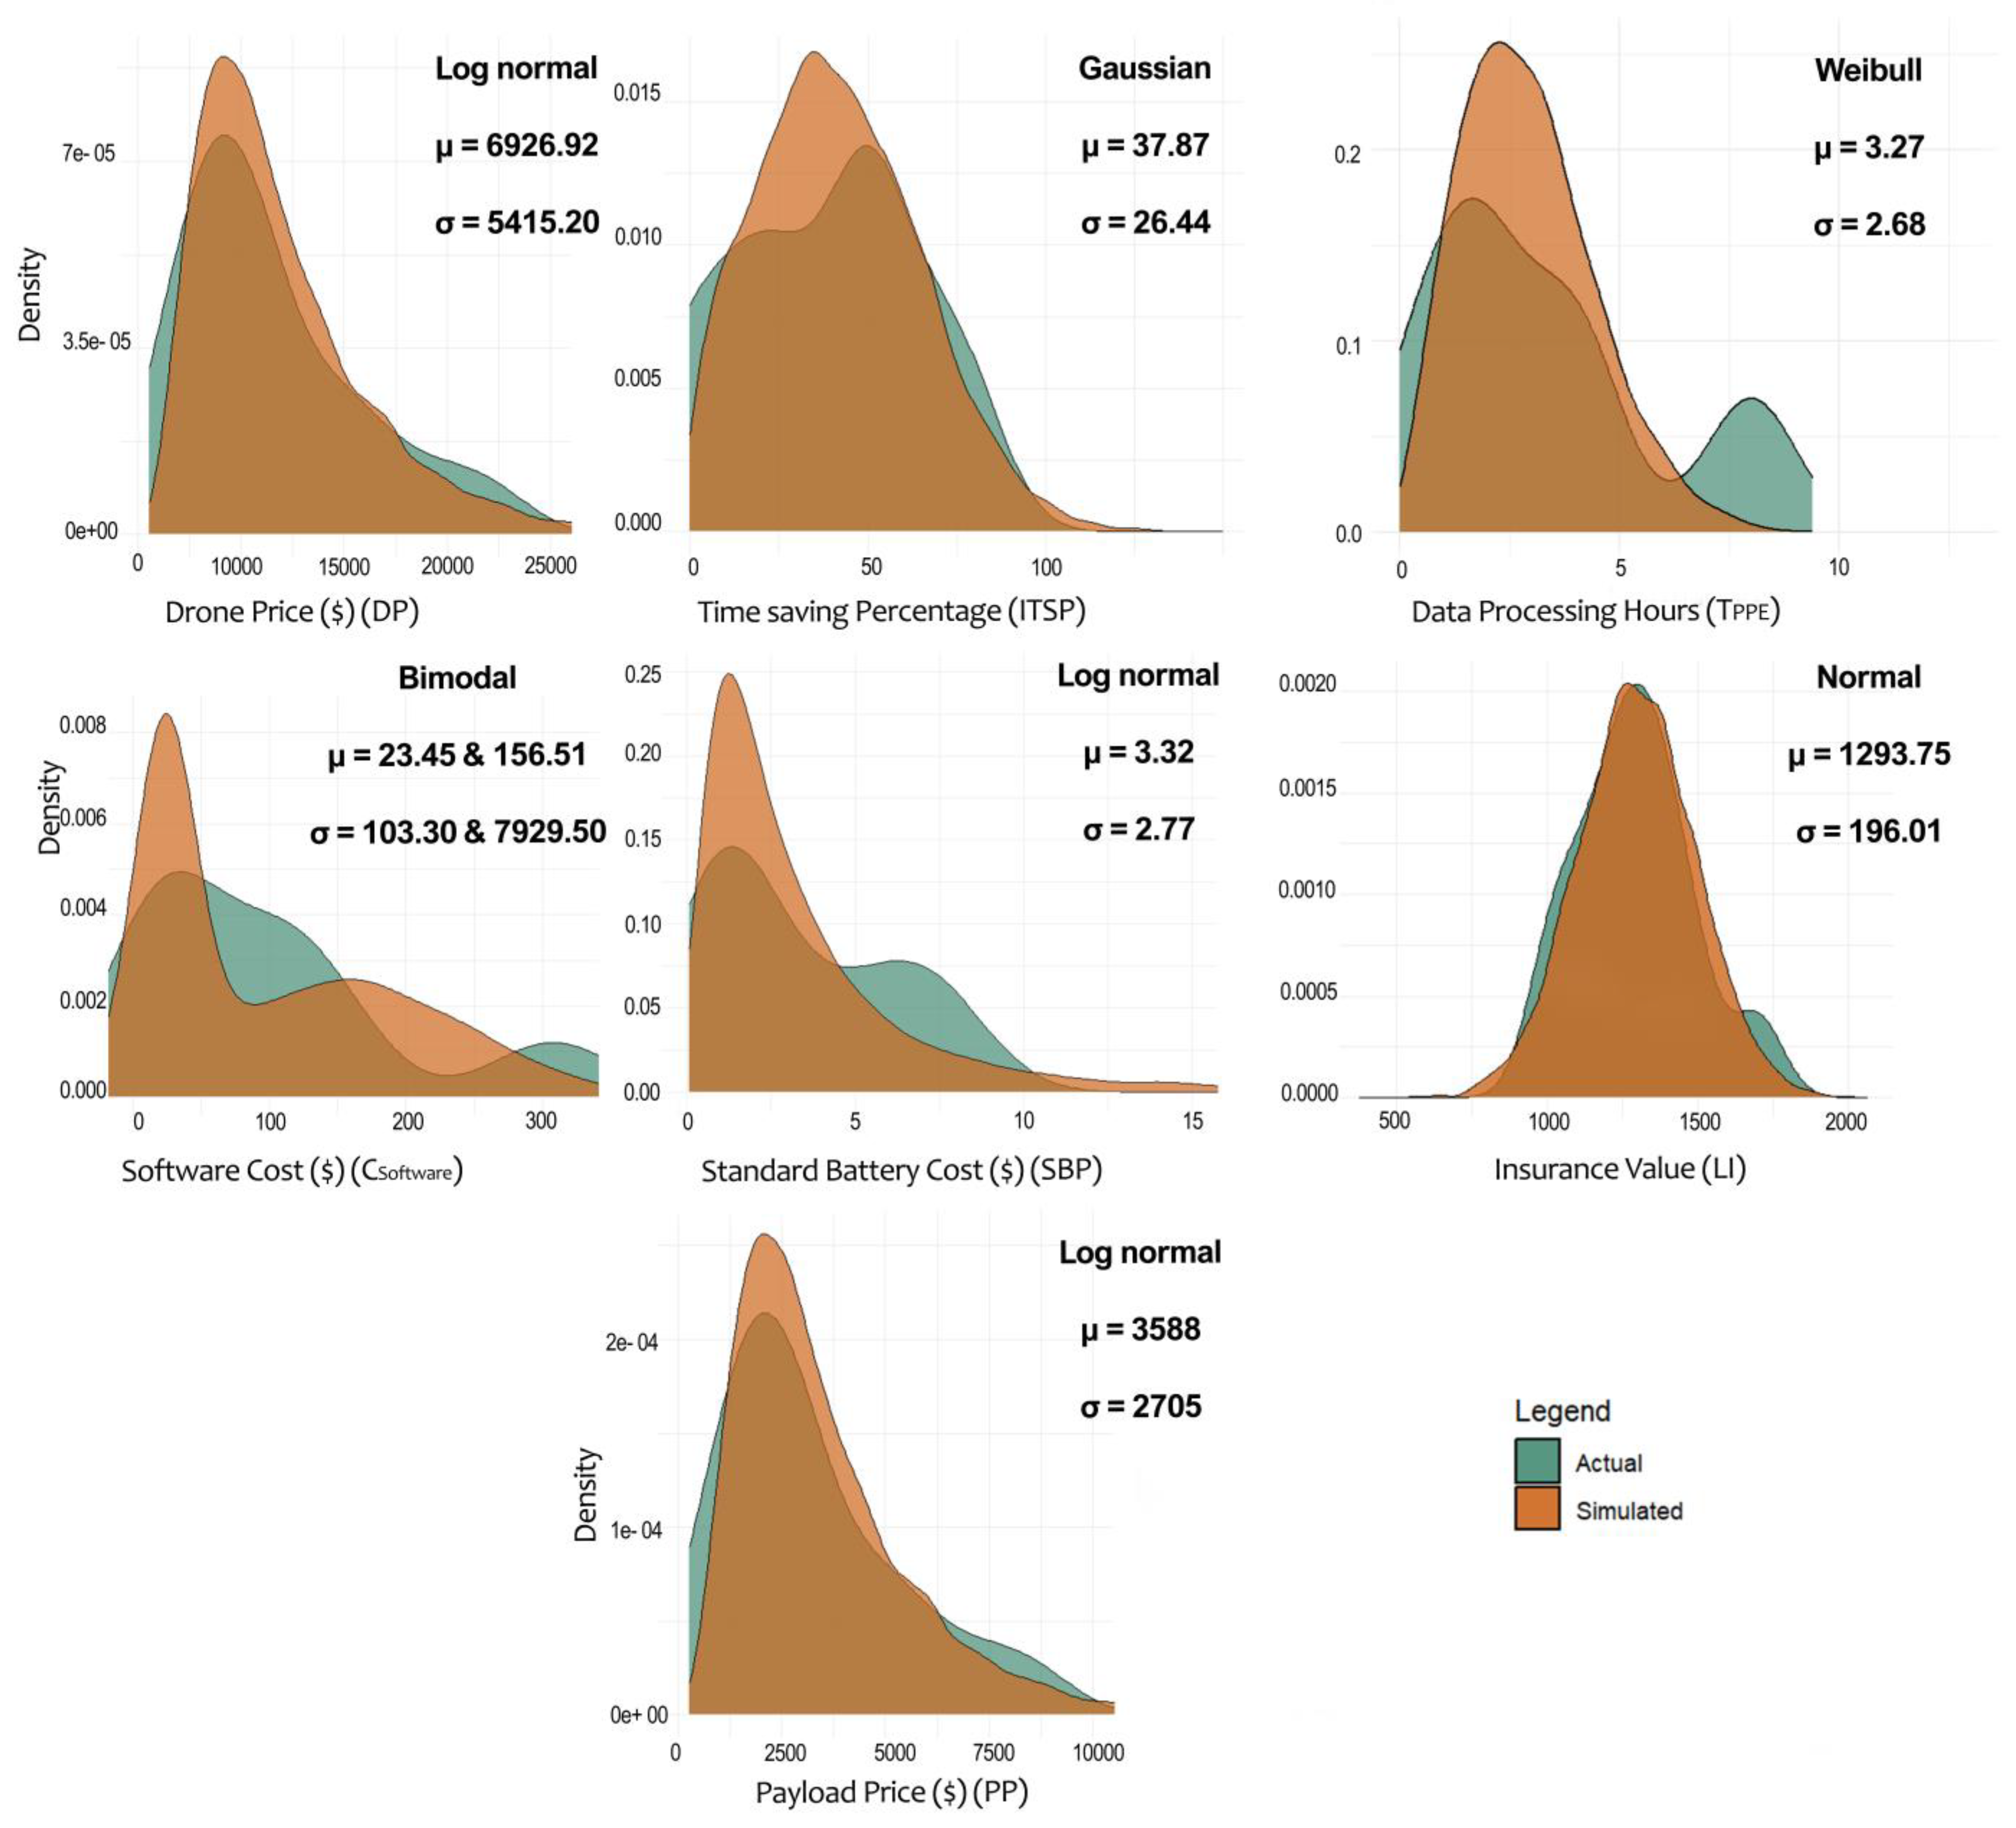
To strengthen the MCS, empirical distributions derived from actual data are compared to simulated distributions, ensuring accurate representation of stochastic variability. This enhances the reliability of the cost–benefit analysis for decision making. Figure 2 presents the results of the 10,000 MCS trials, displaying the mean, standard deviation (SD), and probability distribution type for each variable.

Figure 2.
Comparing actual and simulated distributions of stochastic variables and their distribution type, mean, and SD.
As mentioned earlier, AMC and URC, expressed as percentages of the drone price, are represented using mean and standard deviation within a log-normal distribution to capture their skewed nature. However, due to limited data, full probability distributions could not be derived from VO and LCC. Instead, these variables are treated as discrete probabilities rather than continuous distributions, ensuring that the model incorporates uncertainty without overfitting to insufficient or unreliable data. Table 7 presents these three variables along with their statistical details.
Table 7.
The stochastic variables of D-BCM and their distribution statistics.
The sensitivity analysis of drone price uses trends in smartphone pricing as a benchmark for predicting drone price evolution. It assumes drones might adopt a similar price trajectory as smartphones, based on technological progress and market penetration. Figure 3 presents historical smartphone pricing trends from the application to smartphones report [47].
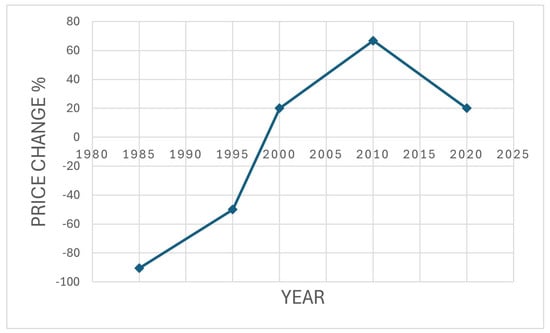
Figure 3.
Changes in smartphone price over time.
In the short term (2023–2028), the present study predicts that drones will advance in AI, autonomy, and navigation as FAA regulatory updates enable more beyond visual line of sight operations. Energy storage may improve slightly, and consumer drones will likely become more user-friendly, differentiating them from commercial models. Following smartphone pricing trends, drone prices may increase by a mean of 40% with a 20% variance.
In the midterm (2028–2033), further AI developments and automated fleet management are anticipated, boosting drone adoption for inspections and logistics. This study expects the consumer drone market to stabilize with standardized technology and pricing, leading to a +70% mean price change and a +10% variance. In the long term (2033+), universal regulations and advanced AI autonomy will enable complex operations and broader applications, with the market maturing into diverse offerings. Analysts forecast a mean price change of −20% and a variance of −5%. Figure 4 illustrates these trends, showing higher prices in the short term and midterm and balancing in the long term with stable, diverse options for varied needs.
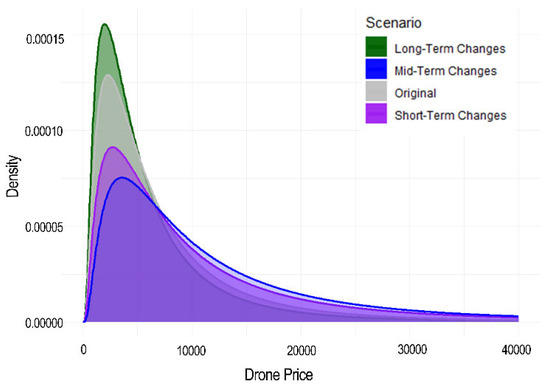
Figure 4.
Histograms of sensitivity analysis of DP.
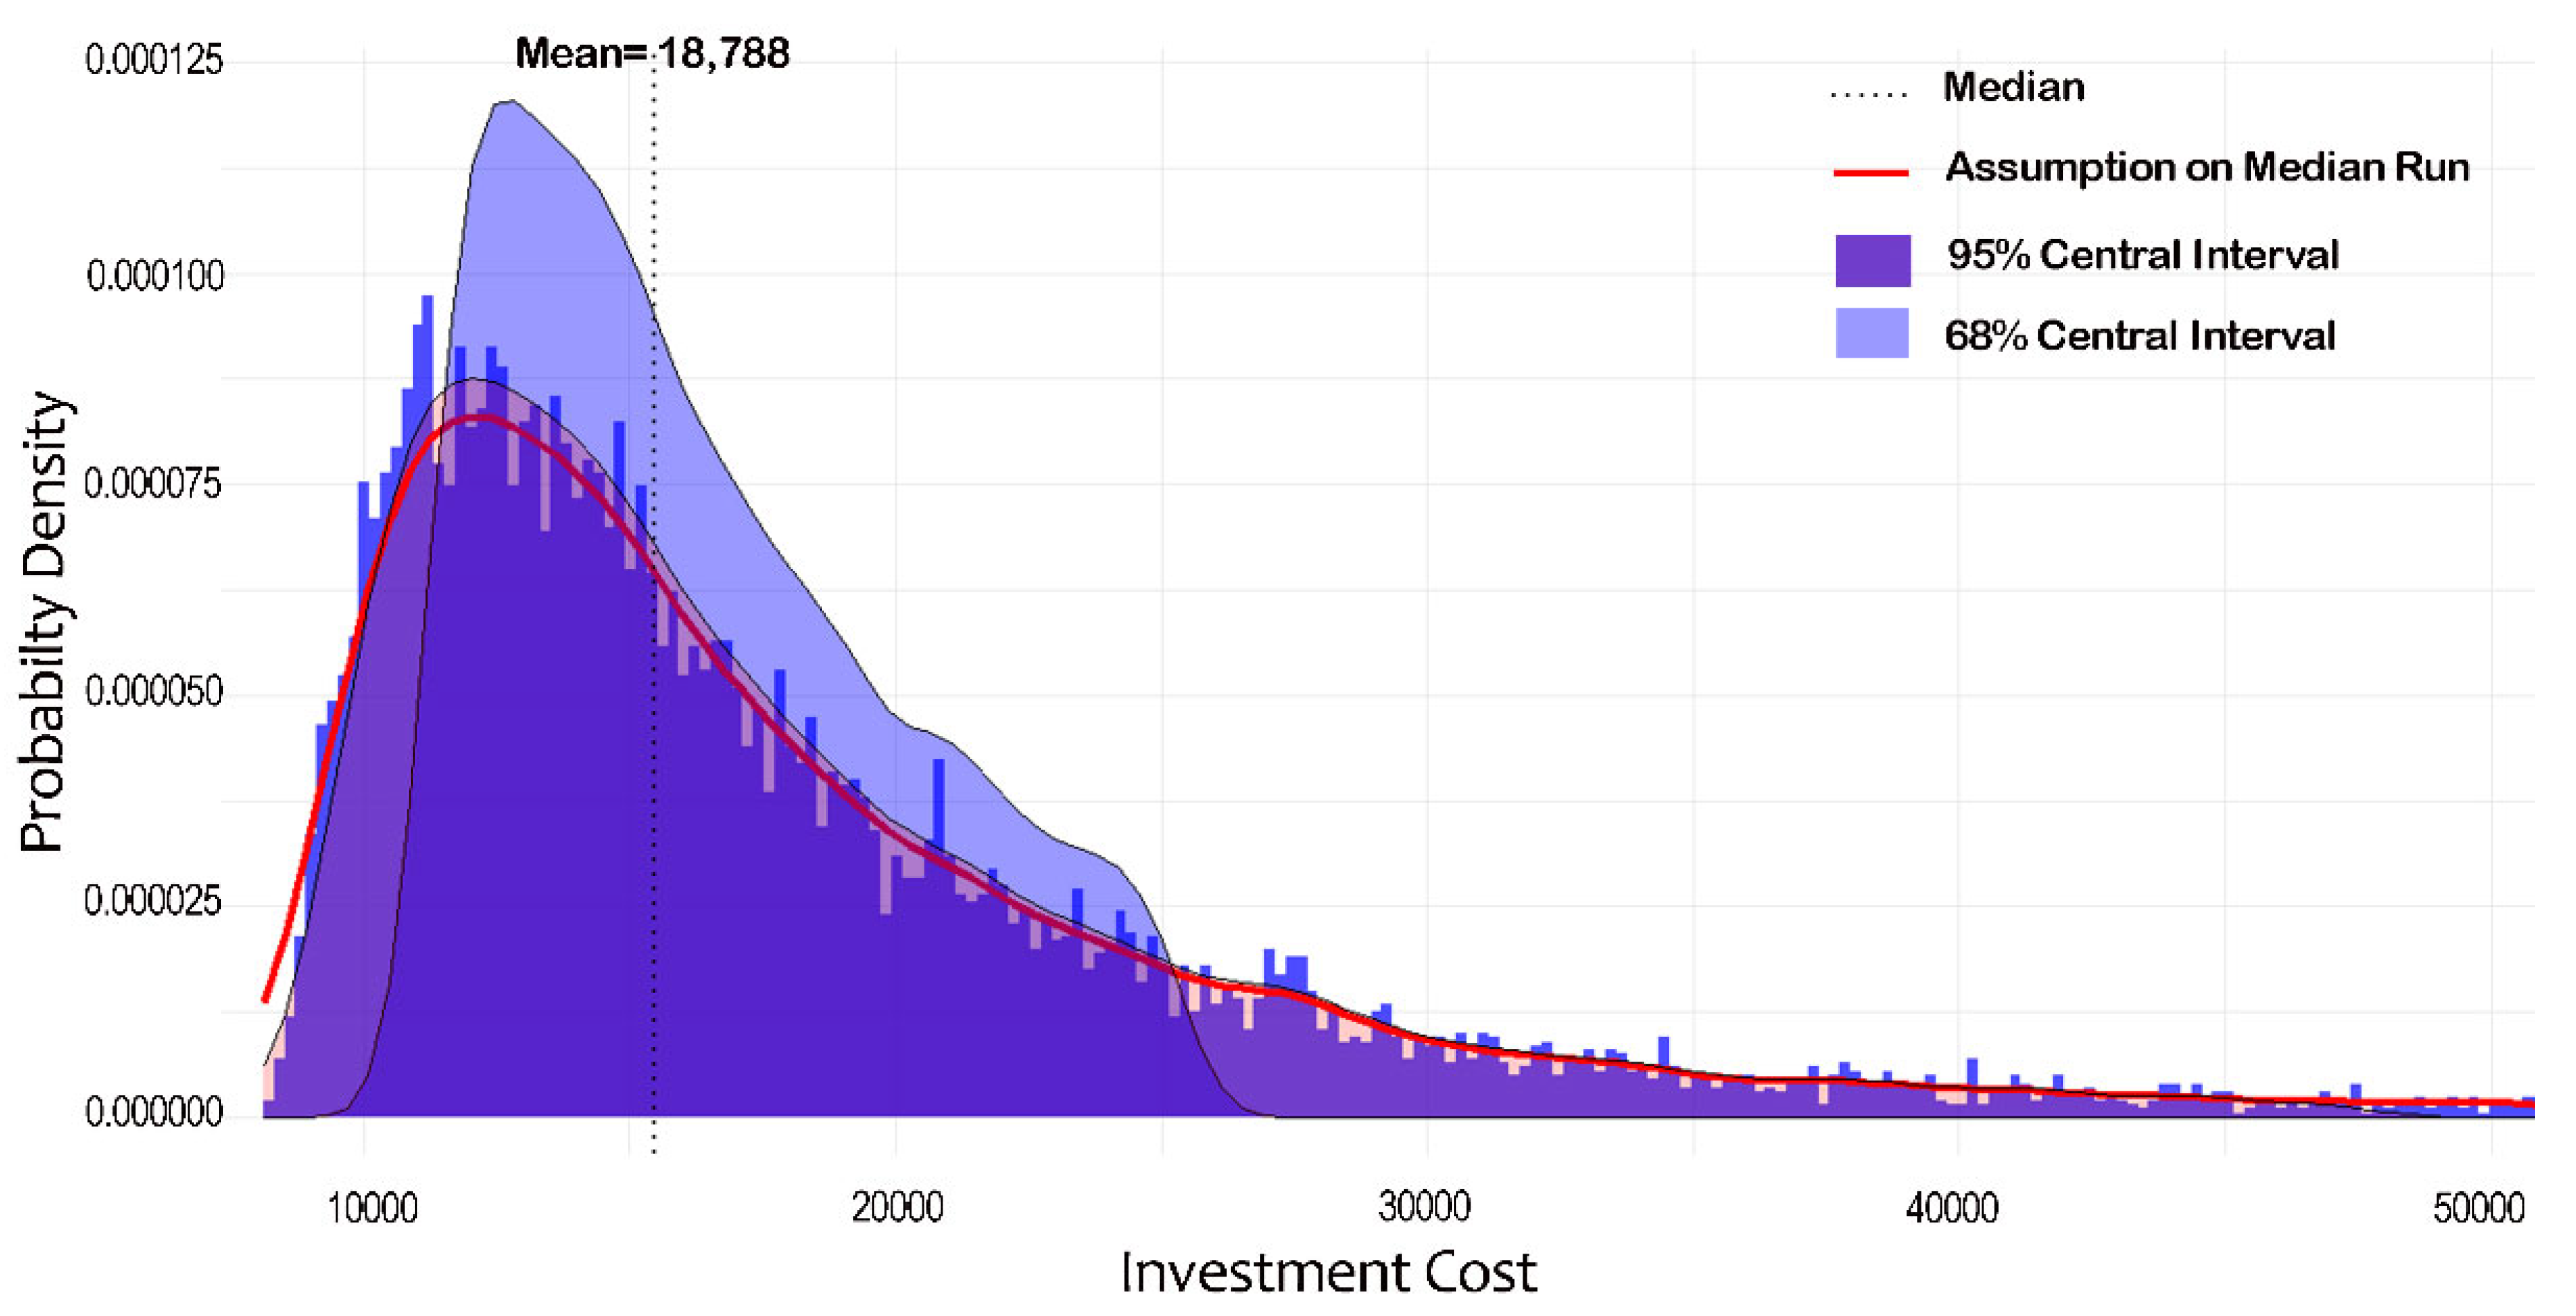
5.2. Stochastic Investment Costs
This case study models the investment cost () using the following equation:
Here, represents the distribution of I, derived from 10,000 MCS. Figure 5 illustrates the empirical distribution of I, revealing a mean cost of USD 18,788.63, a median cost of USD 15,483.40, and a mode of approximately USD 8124.33. The standard deviation of USD 11,214.13 indicates significant cost variation, with half of the values between the 25th percentile (USD 12,272.6) and the 75th percentile (USD 21,362.03). The histogram displays 68% and 95% confidence intervals, highlighting likely cost boundaries. The right-skewed distribution suggests costs are more concentrated near the mode but with occasional spikes in the longer tail. Most costs fall below USD 30,000, aligning with the median and providing stakeholders with reliable cost expectations.

Figure 5.
Distribution of investment cost.
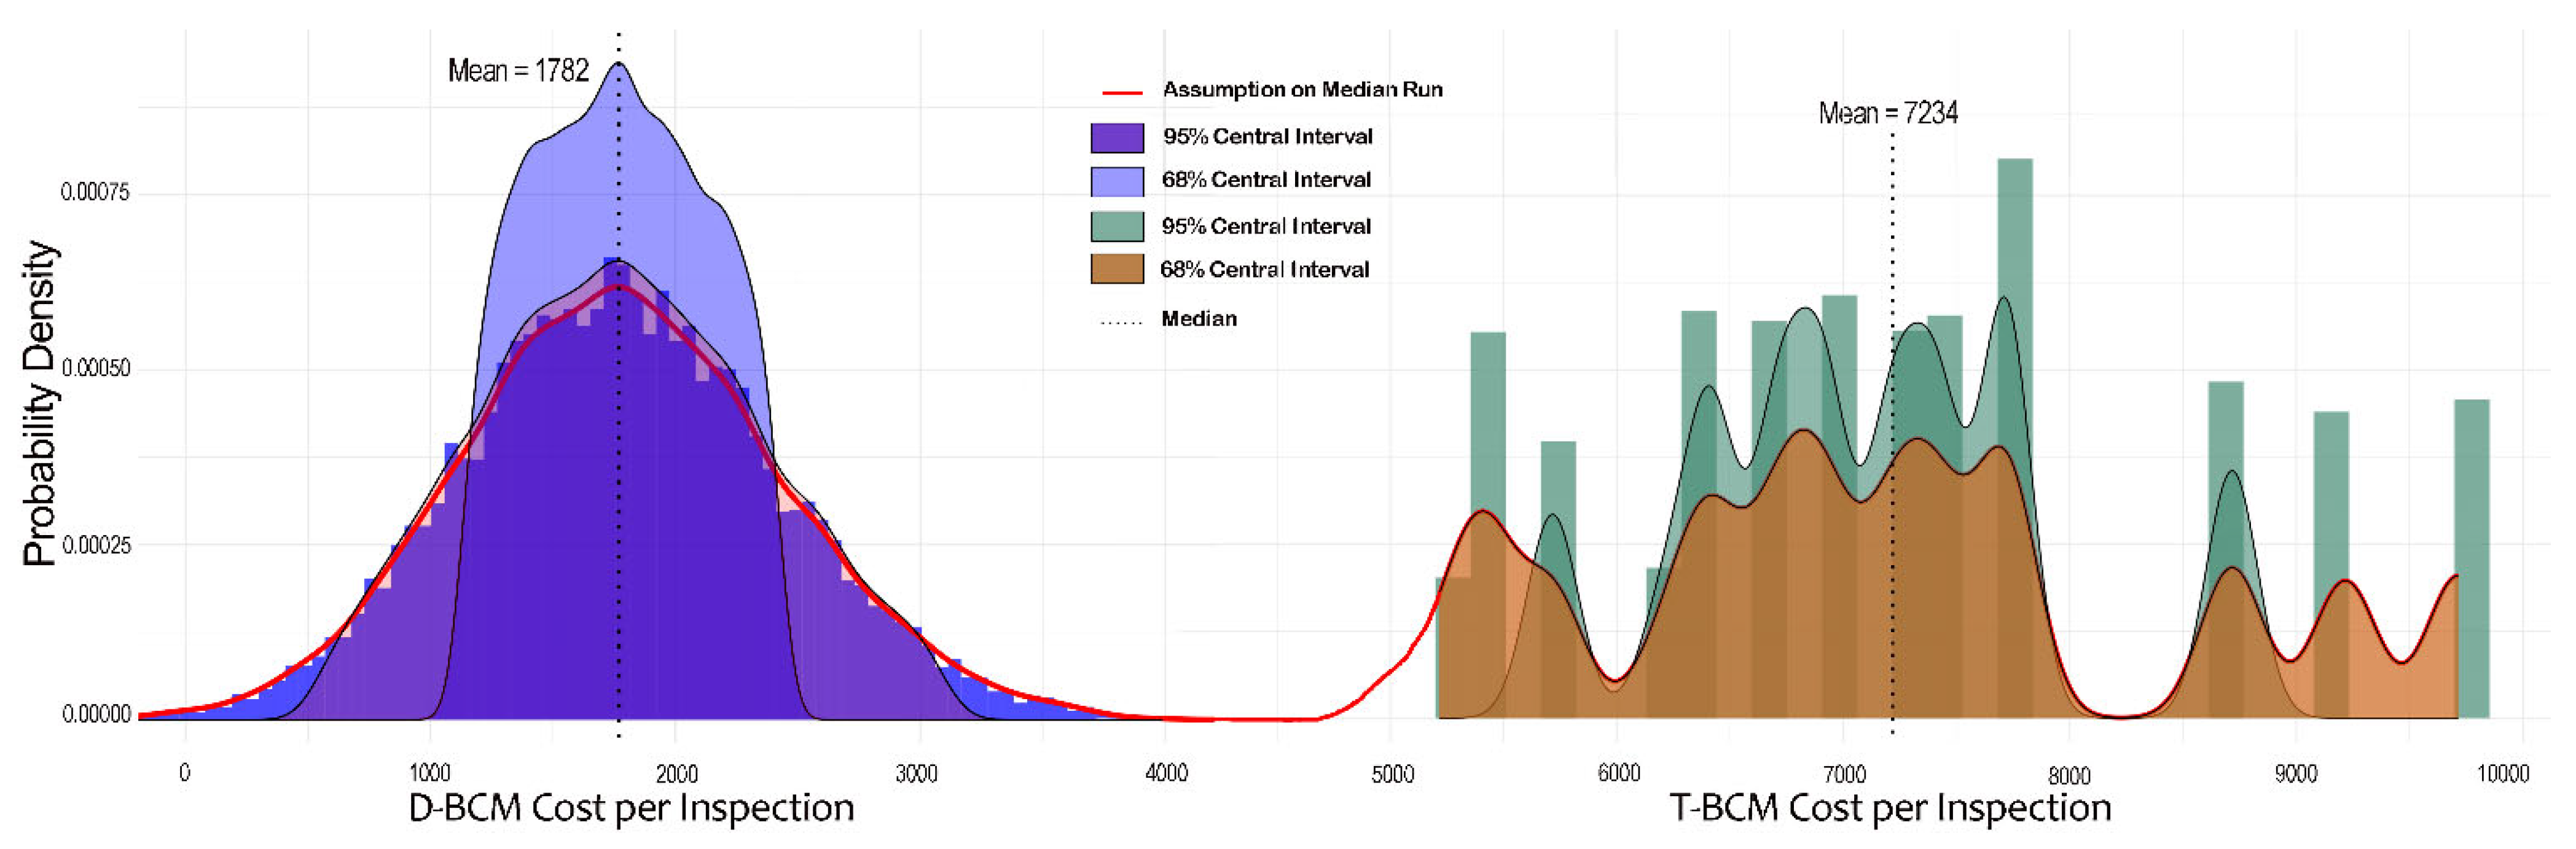
5.3. Stochastic Cost and Benefits per Inspection
The present research used stochastic variables to model the costs per inspection for both D-BCM and T-BCM. For D-BCM, inspection costs (DCS) depend on inspection time, data processing, and battery price, with deterministic inputs, such as wages for BILT, ABI, and PPE, calculated as
For T-BCM, inspection costs (DB) account for stochastic UBIV costs and deterministic variables, calculated as
The analysis used MCS to compare cost distributions for both methods. Figure 6 shows the results, with D-BCM demonstrating a median cost of USD 1770, significantly lower than T-BCM’s USD 7216. Quartile values reinforce this trend; D-BCM costs remain below T-BCM across all percentiles, peaking at USD 4870 compared with USD 9716.
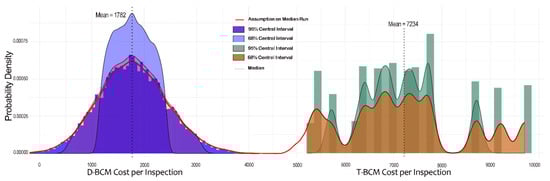
Figure 6.
Distribution of D-BCM and T-BCM cost per inspection.
The standard deviation for D-BCM is USD 653.85, indicating more consistent costs than T-BCM with USD 1258.37. Kurtosis values highlight differences in distribution shapes, with D-BCM showing a leptokurtic distribution (3.01), while T-BCM displays a platykurtic one (2.39). The 95% confidence interval further emphasizes the advantage of D-BCM, with costs likely between USD 532.81 and USD 3117.12 compared with between USD 5216.5 and USD 9716.5 for T-BCM.
The findings illustrate the financial superiority of D-BCM, offering lower and more predictable costs. Hence, adopting D-BCM can provide substantial savings, particularly for large-scale or recurring inspections.
5.4. Net Saving
The net savings distribution (DNS) reflects the cost difference between T-BCM and D-BCM, calculated as
MCS reveal an average net savings of USD 5043 per inspection, with a median of USD 4935. Most outcomes fall between the first quartile (USD 3997) and the third quartile (USD 5983), with a maximum saving of USD 9271. Variability, indicated by a standard deviation of USD 1435.83, remains moderate. The dataset exhibits a skewness of 0.243 and a kurtosis of 2.5, indicating a slightly right-skewed distribution with fewer outliers. The 95% confidence interval, ranging from USD 2512.42 to USD 7912.54, highlights consistent financial advantages of drone-based methods.
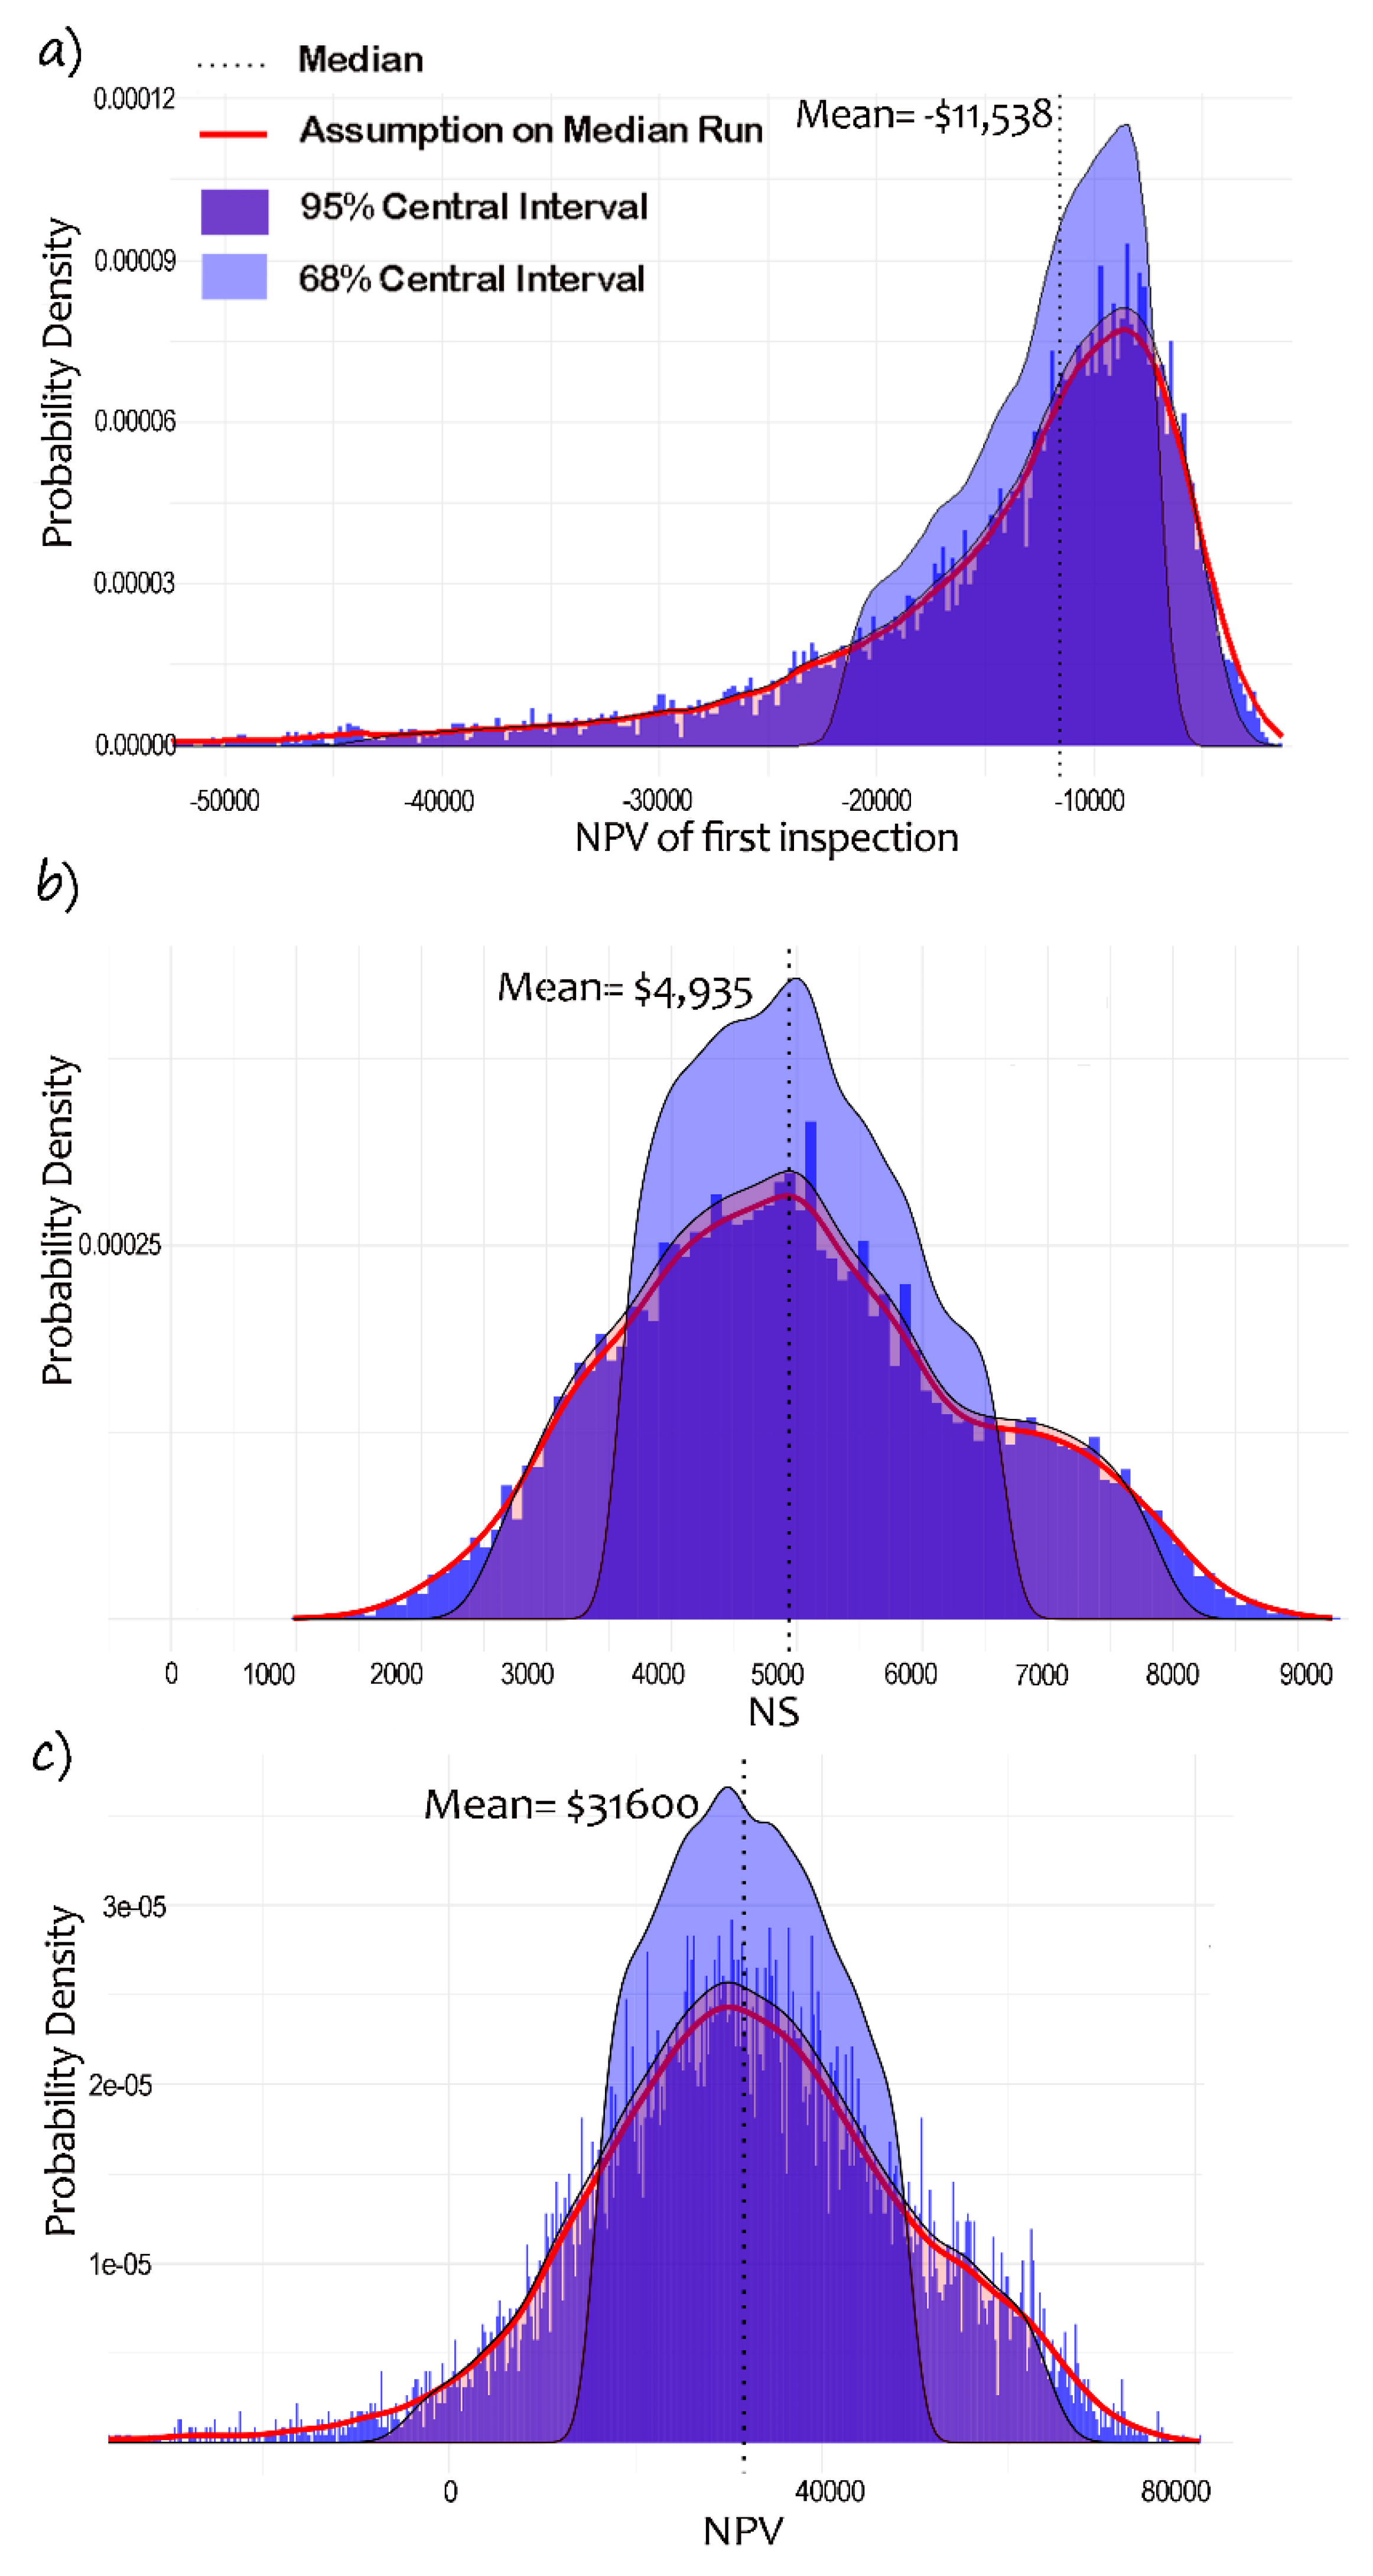
5.5. Net Present Value
The net present value (NPV) distribution (DNPV of First Inspection) for the first inspection combines investment, cost, and benefit distributions:
The first inspection yields a median NPV of −USD 11,538, with a significant standard deviation of USD 13,157.72 and a left-skewed distribution (skewness: −4.03). The 95% confidence interval (−USD 43,833 to −USD 4275) confirms predominantly negative NPVs initially. Annual NPV analysis for 10 inspections shows a shift to positive returns, calculated as
The average annual NPV increases to USD 31,600, with reduced variability (SD: USD 12,849.6) and a symmetric distribution (skewness near zero). The confidence interval (USD 45,481 to USD 64,569) emphasizes the long-term financial benefits of D-BCM, highlighting their cost-effectiveness as cumulative inspections offset initial expenses. Figure 7 compares the distribution of NS, NPV of the first inspection, and NPV of the 10th inspection.

Figure 7.
Distribution of (a) NPV of the first inspection, (b) net saving, (c), and NPV of the 10th inspection.
5.6. Benefit–Cost Ratio
Figure 8 compares the benefit–cost ratio (BCR) distribution (DBCR of first Inspection) for the initial and 10th inspections, calculated as
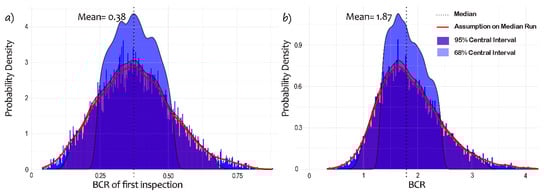
Figure 8.
The BCR distribution of (a) the first and (b) the 10th inspections.
In the first inspection, the distribution is unimodal with a slight rightward skew, as the mean (0.38) exceeds the median (0.37), with a skewness of 0.31. Most values cluster near the mean within the 68% interval, while the 95% interval captures broader variability. The model aligns well with observed data, as shown by the red curve matching the median.
The distribution for the 10th inspection shows a similar unimodal shape but with increased skewness (0.89), as the mean (1.87) surpasses the median (1.79). Greater variability is evident, with a standard deviation of 0.60 compared with 0.13 for the first inspection. The 95% interval expands from [0.13, 0.68] to [0.91, 3.28], indicating growing uncertainty over time.
The skewness and variability of the BCR increase from the first to the 10th inspection, reflecting greater potential for high or varied BCR values. This trend suggests that repeated inspections yield a broader range of benefit–cost outcomes, driven by changes in costs, benefits, or both.
5.7. Cost–Benefit Measures
The NPV calculates the difference between current benefits (Bi) and costs (Ci) over a specific timeframe, indicating cost effectiveness. A positive NPV signifies profitability, while a negative value suggests otherwise. Among multiple alternatives with positive NPVs, the option with the highest value yields the greatest return. The NPV formula is
Here, r is the discount rate, i is the year, and Y is the total payback period. Bi includes benefits, such as reduced lane closures, improved safety, and cost savings from T-BCM. Costs (Ci) are derived as
where I is the investment cost (), is the inspection cost ), and CV is the monthly deployment cost ().
The BCR measures the ratio of benefits to costs. A BCR above 1 indicates cost effectiveness, with higher values denoting greater returns. For multiple alternatives, the option with the highest BCR is preferred. The BCR formula is
The USDOT (2023) recommends using a real discount rate of 7% per year to discount monetized benefits and costs to their present value, excluding inflation effects [22]. This case study adopts a 10-year duration, reflecting the anticipated operational lifespan of current drone technologies [48].
5.8. Case Scenario
This scenario assumes an eight-hour traditional inspection time. The simulation identified a 75% reduction in inspection time (ITSP), reducing drone-based inspection time to two hours. Table 8 shows that the initial costs for D-BCM are USD 14,605.99 compared with USD 1528.78 for T-BCM. The NPV for the first inspection is negative (−USD 9011.45), and the BCR is 0.44, indicating non-cost-effectiveness at the outset. However, the cumulative NPV turns positive after the second inspection, as shown in Table 9.
Table 8.
NPV and BCR of the first D-BCM (snapshot: September 2023).
Table 9.
The payback inspection and return rate.
The analysis evaluates 10 inspections annually over a 10-year period with 3% and 7% discount rates. The five-year lifespan of drones requires two investments. At both rates, the first-year NPV is USD 39,797, with BCRs of 2.27 for investment years and 4.23 for subsequent years (Table 10 and Table 11).
Table 10.
NPV and BCR analysis for a 10-year time horizon at a 7% discount rate.
Table 11.
NPV and BCR analysis for a 10-year time horizon at a 3% discount rate.
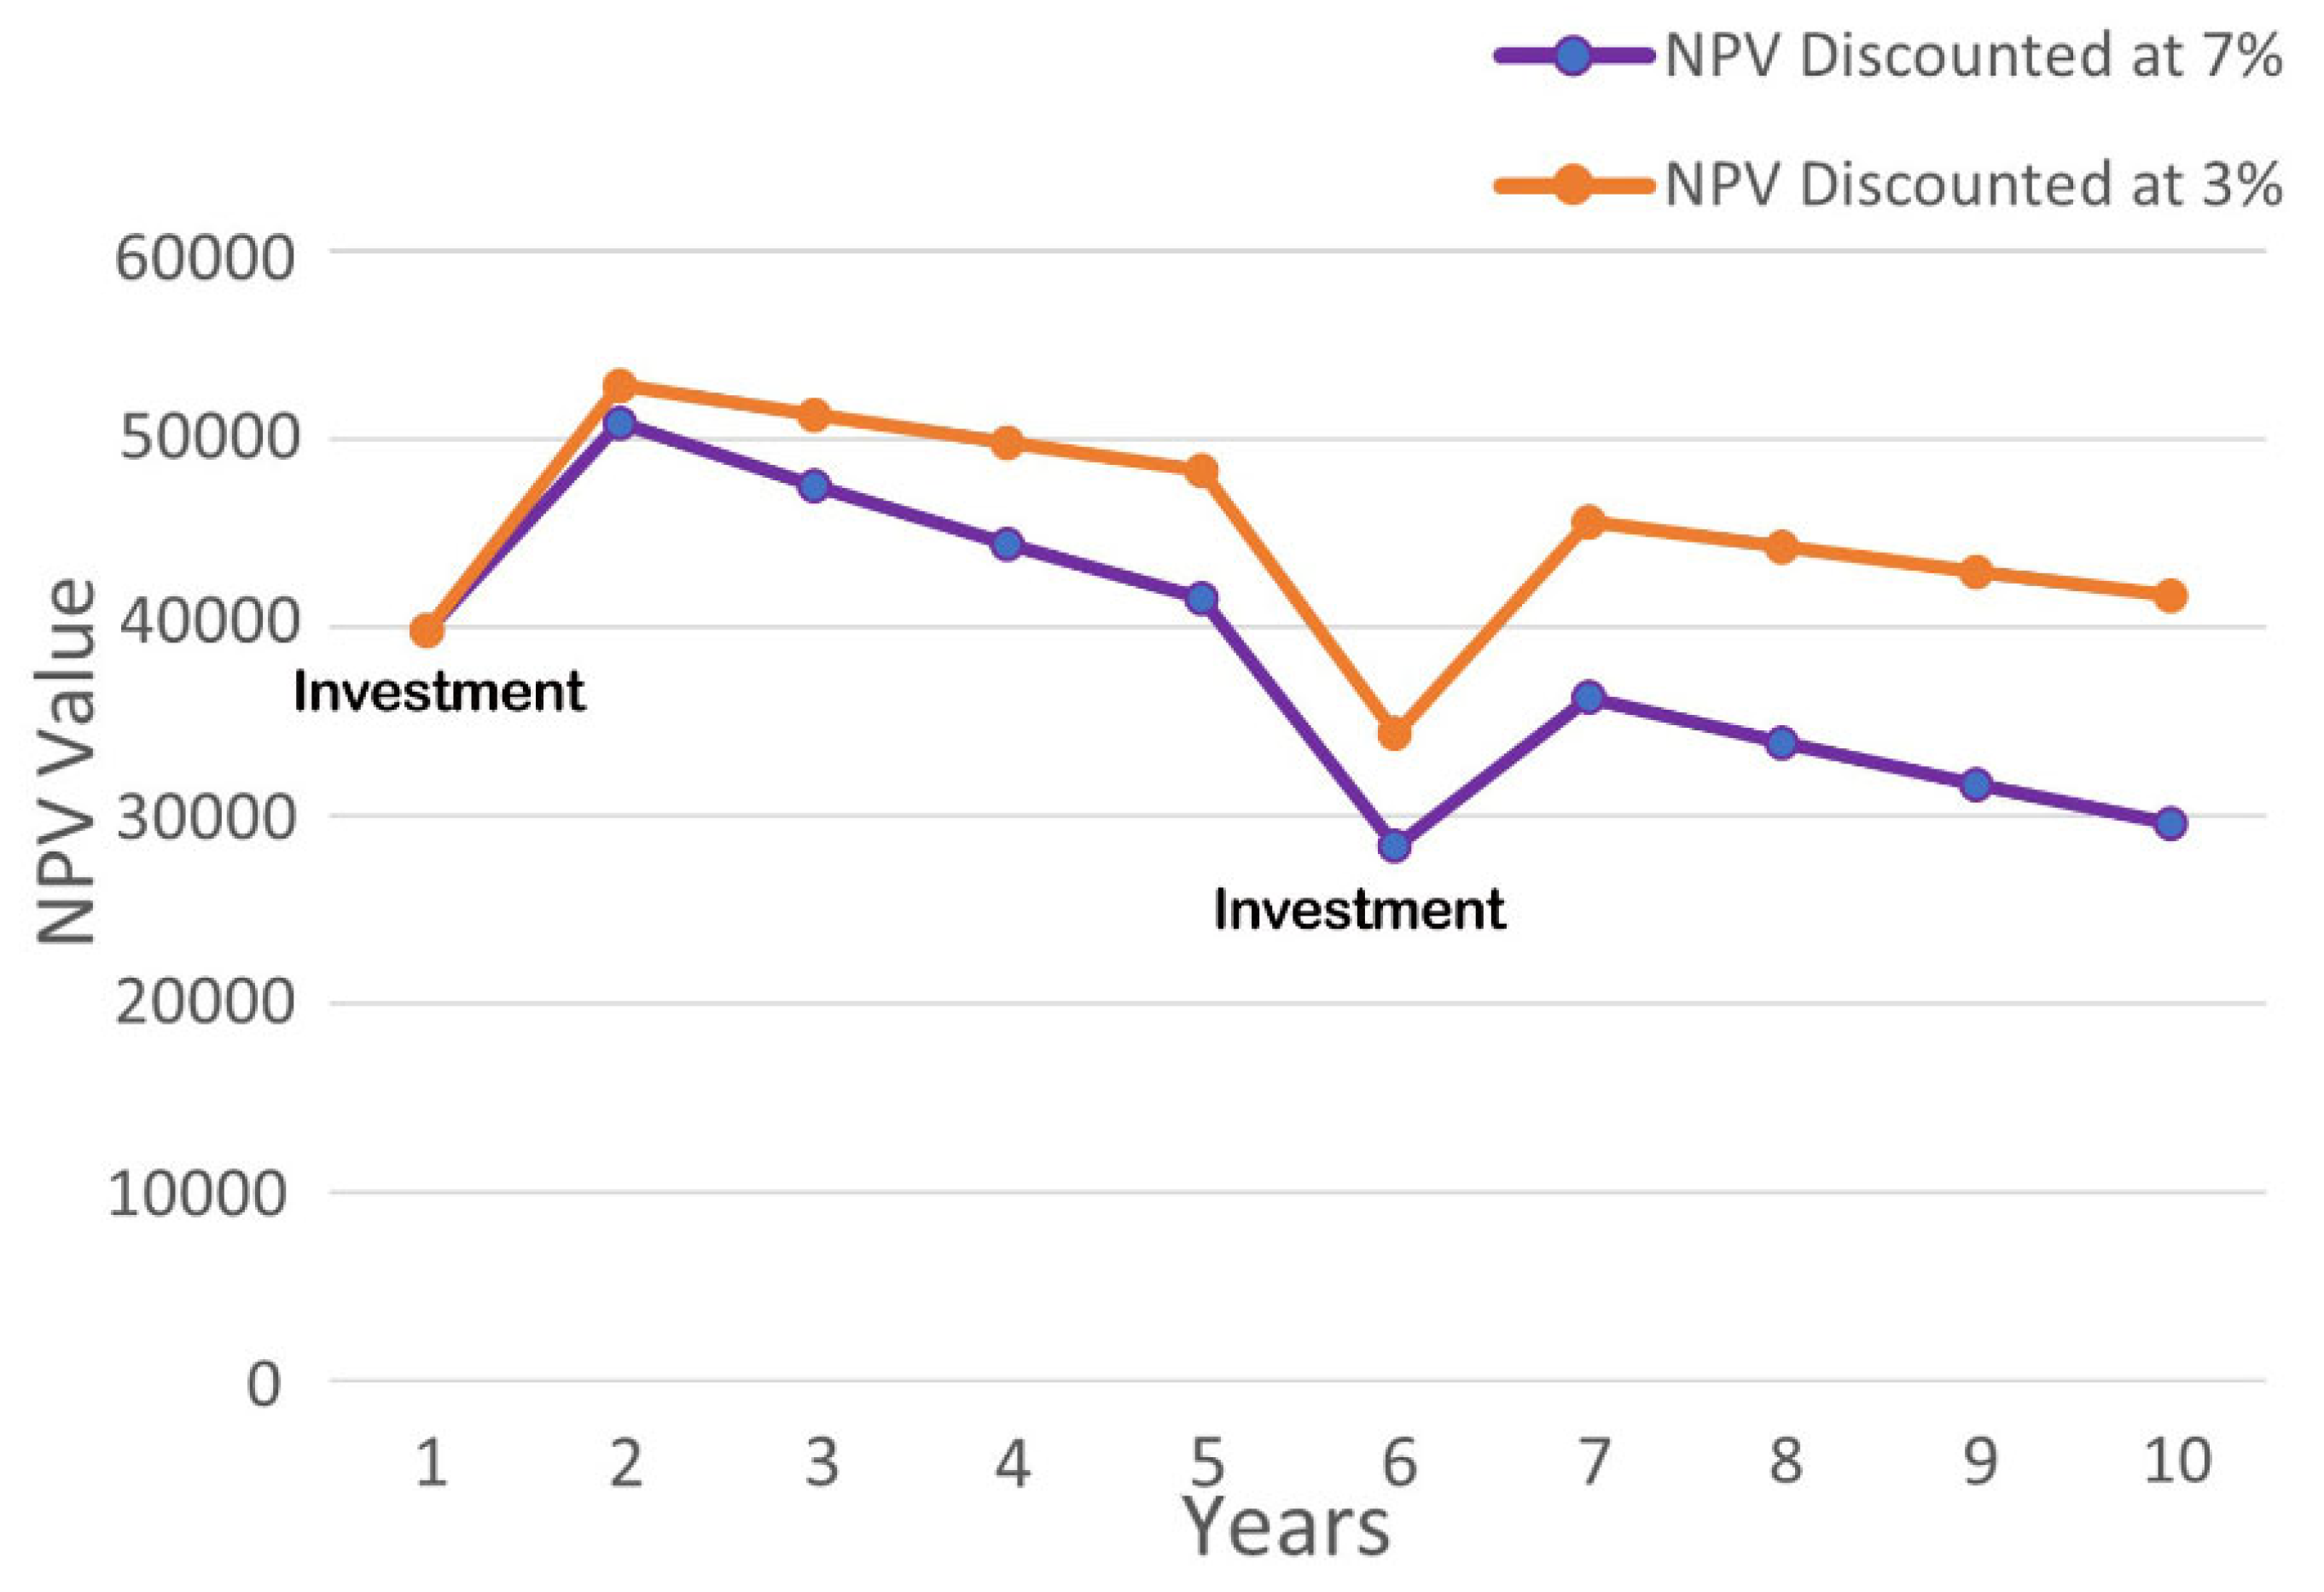
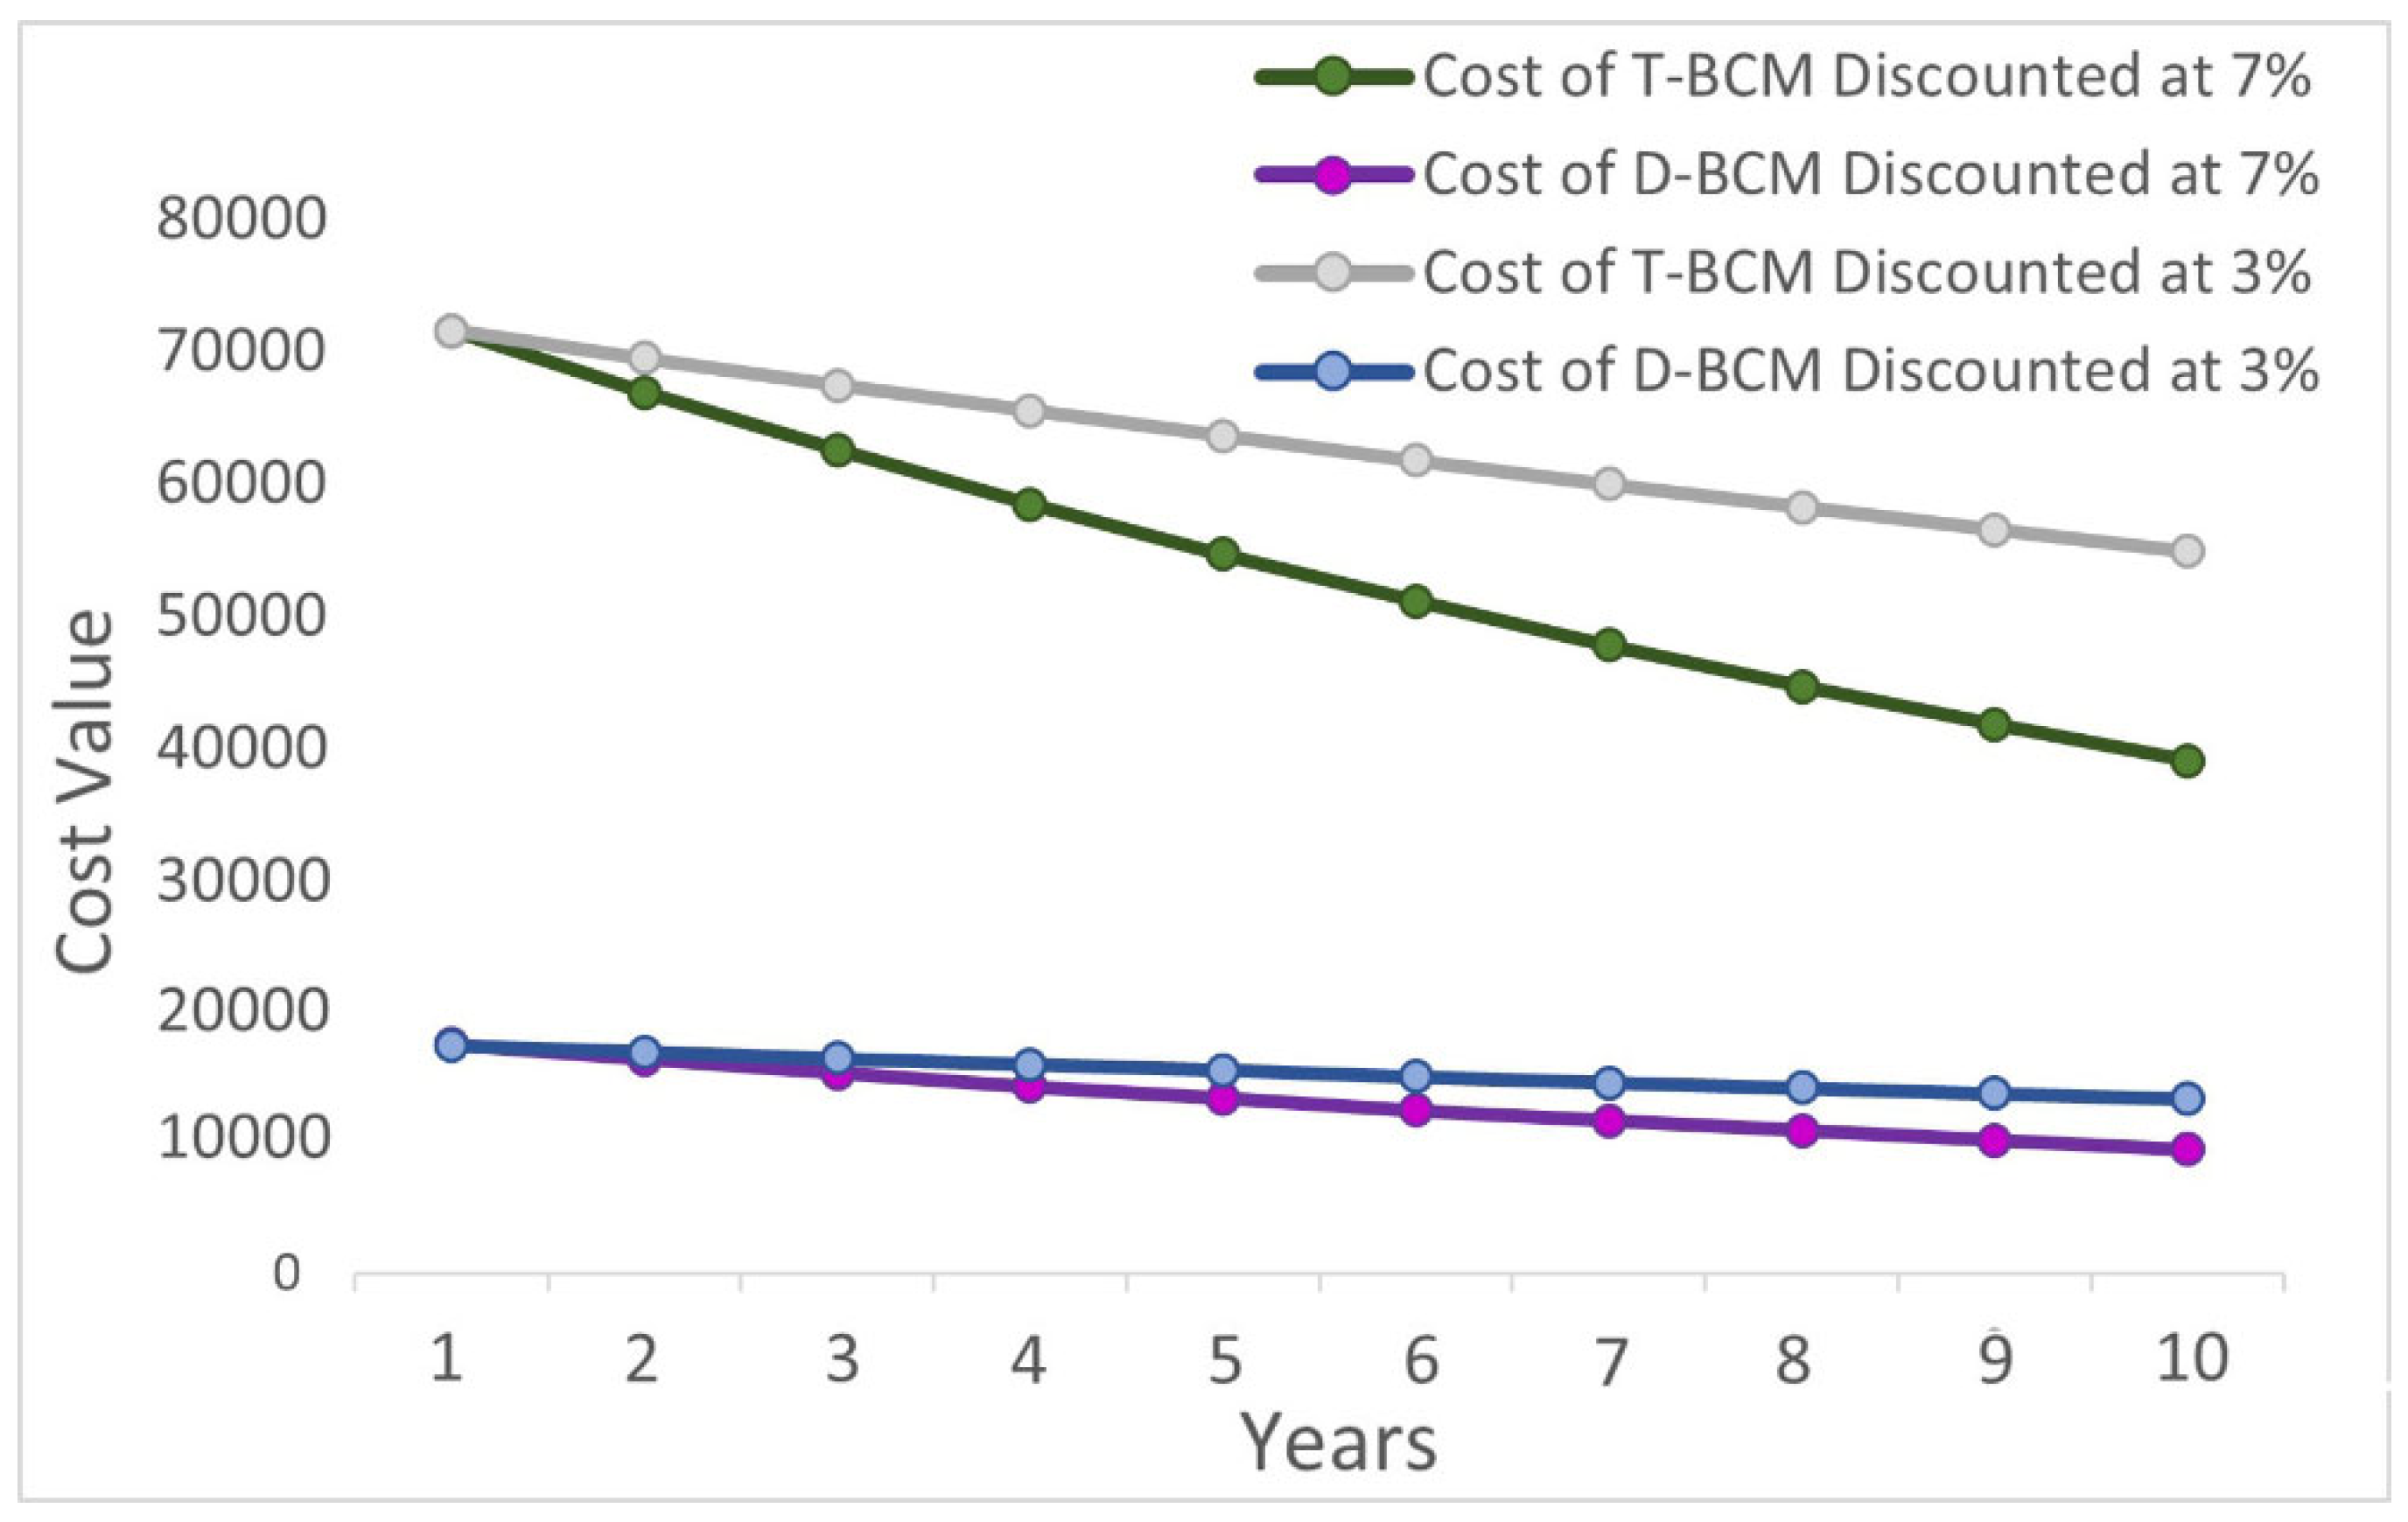
Figure 9 and Figure 10 highlight the cost advantage of D-BCM, which consistently outperforms traditional methods. The savings grow significantly under a 7% discount rate, demonstrating greater cost efficiency for D-BCM over time.
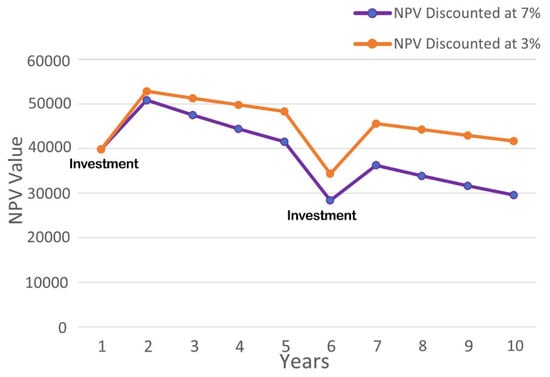
Figure 9.
Ten-year NPV projection comparing 3% and 7% discount rates.
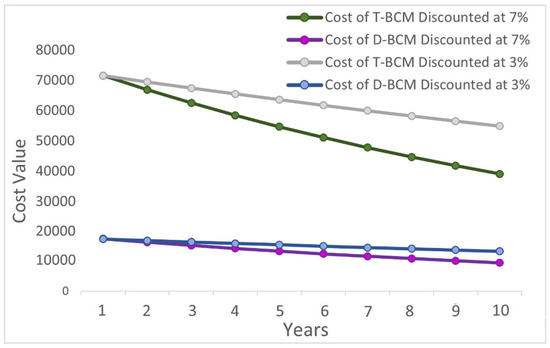
Figure 10.
Comparative 10-year cost analysis of T-BCM and D-BCM at 3% and 7%.
Based on the 15-year changes in drone prices discussed earlier, this scenario adjusts drone prices in the investment component every five years. Additionally, the model re-simulates all stochastic variables every five years using MCS to generate new random values. However, benefits, costs, and inspection durations—eight hours for T-BCM and two hours for D-BCM—remain constant. Table 12 presents the sensitivity analysis of NPV and BCR values, highlighting the financial feasibility of drone investments. A negative NPV and a BCR below one indicate that the initial investment may not yield immediate returns.
Table 12.
Statistics of sensitivity analysis (USD).
Table 13 highlights the downward trend of NPV over time. This suggests limited gains initially but improved outcomes with sustained drone use. The sixth year shows a significant dip, with the midterm drone purchase yielding a more negative NPV, reducing profitability. However, in the long term, the NPV improves and the BCR approaches 0.4, driven by lower drone prices.
Table 13.
NPV analysis of DP scenario at a 7% and 3% discount rate (USD).
The 15-year sensitivity analysis of drone prices provides insight into the economic impact of adopting drone technology. Although initial investments may not yield immediate profits, consistent benefits and long-term cost reductions can make the initiative economically viable. Hence, balancing upfront costs with long-term gains and strategic opportunities is essential.
6. Conclusions
This study develops a quantitative framework to evaluate the cost efficiency and effectiveness of drone-based condition monitoring (D-BCM) compared to traditional bridge inspection methods (T-BCM). By integrating Monte Carlo simulation (MCS) and probabilistic modeling, the analysis captures the stochastic nature of cost and benefit variables, providing a data-driven foundation for decision making in drone adoption in infrastructure monitoring.
The findings show that while initial investments in drones, software, and training may be substantial, long-term savings in operational costs, inspection time, and safety-related expenses outweigh these costs. D-BCM significantly reduces lane closures, workforce requirements, and reliance on under-bridge inspection vehicles (UBIVs), making it a cost-effective alternative for transportation agencies. Monte Carlo results confirm the financial sustainability of drone investments, indicating that technological advancements and market trends will likely lower acquisition and operational costs over time, further enhancing economic feasibility.
Despite these advantages, drones cannot fully replace traditional inspection methods due to their inability to perform tactile, subsurface, or underwater assessments. Additionally, airspace regulations, operator training, and data processing challenges must be addressed for seamless integration into routine infrastructure monitoring.
Future research should explore AI-driven automation, advanced sensor technologies, and regulatory frameworks to enhance drone efficiency and expand applications in bridge, highway, and railway asset management. Further validation through real-world pilot studies and comparative analyses across multiple infrastructure types would strengthen the generalizability of the findings.
By providing a rigorous cost–benefit analysis, this study supports informed decision making for policymakers, transportation agencies, and industry stakeholders, enabling strategic investments in drone technologies to improve the efficiency, safety, and sustainability of infrastructure inspections.
Author Contributions
Conceptualization, T.A. and R.B.; methodology, T.A. and R.B.; software, T.A.; validation, T.A. and R.B.; formal analysis, T.A.; investigation, T.A. and R.B.; resources, R.B.; data curation, T.A.; writing—original draft preparation, T.A.; writing—review and editing, T.A. and R.B.; visualization, T.A. and R.B.; supervision, R.B.; project administration, R.B.; funding acquisition, R.B. All authors have read and agreed to the published version of the manuscript.
Funding
This research received funding from the United States Department of Transportation, Center for Transformative Infrastructure Preservation and Sustainability (CTIPS), Funding Number 69A3552348308.
Data Availability Statement
This article includes the data presented in the study.
Conflicts of Interest
The authors declare no conflicts of interest.
References
- ASCE. Report Card for America’s Infrastructure; ASCE: Reston, VA, USA, 2021. [Google Scholar]
- Askarzadeh, T.; Bridgelall, R.; Tolliver, D. Drones for Road Condition Monitoring: Applications and Benefits. J. Transp. Eng. Part B Pavements 2025, 151, 04024055. [Google Scholar] [CrossRef]
- Askarzadeh, T.; Bridgelall, R.; Tolliver, D.D. Systematic Literature Review of Drone Utility in Railway Condition Monitoring. J. Transp. Eng. Part A Syst. 2023, 149, 04023041. [Google Scholar] [CrossRef]
- AASHTO. The Manual for Bridge Evaluation, 2nd ed.; American Association of State Highway and Transportation Officials: Washington, DC, USA, 2011. [Google Scholar]
- Seo, J.; Duque, L.; Wacker, J. Drone-enabled bridge inspection methodology and application. Civ. Eng. 2018, 94, 112–126. [Google Scholar] [CrossRef]
- Perry, B.J.; Guo, Y.; Atadero, R.; van de Lindt, J.W. Streamlined bridge inspection system utilizing unmanned aerial vehicles (UAVs) and machine learning. Meas. J. Int. Meas. Confed. 2020, 164, 108048. [Google Scholar] [CrossRef]
- Hubbard, B.; Hubbard, S. Unmanned Aircraft Systems (UAS) for Bridge Inspection Safety. Drones 2020, 4, 40. [Google Scholar] [CrossRef]
- Azari, H.; O’shea, D.; Campbell, J. Application of Unmanned Aerial Systems for Bridge Inspection. Transp. Res. Rec. 2022, 2676, 401–407. [Google Scholar] [CrossRef]
- Song, H.; Yoo, W.-S.; Zatar, W. Interactive Bridge Inspection Research using Drone. In Proceedings of the 2022 IEEE 46th Annual Computers, Software, and Applications Conference (COMPSAC), Los Alamitos, CA, USA, 27 June–1 July 2022. [Google Scholar]
- Dorafshan, S.; Maguire, M. Bridge inspection, human performance, unmanned aerial systems and automation. J. Civ. Struct. Health Monit. 2018, 8, 443–476. [Google Scholar] [CrossRef]
- Chen, S.; Laefer, D.F.; Mangina, E.; Zolanvari, S.M.I.; Byrne, J. UAV Bridge Inspection through Evaluated 3D Reconstructions. J. Bridge Eng. 2019, 24, 05019001. [Google Scholar] [CrossRef]
- Aliyari, M.; Ashrafi, B.; Ayele, Y.Z. Drone-based Bridge Inspection in Harsh Operating Environment: Risks and Safeguards. Int. J. Transp. Dev. Integr. 2021, 5, 118–135. [Google Scholar] [CrossRef]
- Dorafshan, S.; Maguire, M.; Hoffer, N.V.; Coopmans, C. Challenges in bridge inspection using small unmanned aerial systems: Results and lessons learned. In Proceedings of the 2017 International Conference on Unmanned Aircraft Systems (ICUAS), Miami, FL, USA, 13–16 June 2017. [Google Scholar]
- Mun, J. Modeling Risk, Applying Monte Carlo Risk Simulation, Strategic Real Options, Stochastic Forecasting, and Portfolio Optimization, 2nd ed.; John Wiley & Sons: Hoboken, NJ, USA, 2010. [Google Scholar]
- Banh, M.L.; Foina, A.; Li, D.; Lin, Y.; Redondo, X.A.N.; Shong, C.; Zhang, W.-B. Evaluation of Feasibility of UAV Technologies for Remote Surveying BART Rail Systems; Bay Area Rapid Transit (BART): Oakland, CA, USA, 2017. Available online: https://escholarship.org/uc/item/3qr9v29d (accessed on 11 March 2025).
- Wells, J.; Lovelace, B. Improving the Quality of Bridge Inspections Using Unmanned Aircraft Systems (UAS); Minnesota Department of Transportation: Saint Paul, MN, USA, 2018; Available online: https://trid.trb.org/View/1539868 (accessed on 11 March 2025).
- FAA. 2023. Available online: https://www.faa.gov/faq/how-much-does-it-cost-get-remote-pilot-certificate (accessed on 27 September 2023).
- Lofsten, H. Measuring maintenance performance in search for a maintenance productivity index. Int. J. Prod. Econ. 2000, 63, 47–58. [Google Scholar] [CrossRef]
- Dunn, R. Advanced maintenance technologies. Plant Eng. 1987, 40, 80–82. [Google Scholar]
- MnDOT. Bridge Inspectors Reference Manual; MnDOT: Saint Paul, MN, USA, 2012; Available online: https://www.dot.state.mn.us/bridge/pdf/insp/birm/birmchapt0-cover.pdf (accessed on 11 March 2025).
- FHWA. Traffic Data Computation Method Pocket Guide; Publication No. FHWA-PL-18-027; FHWA: Washington, DC, USA, 2018. Available online: https://www.fhwa.dot.gov/policyinformation/pubs/pl18027_traffic_data_pocket_guide.pdf (accessed on 11 March 2025).
- USDOT. Benefit Cost Analysis Guidance for Discretionary Grant Programs; U.S. Department of Transportation: Washington, DC, USA, 2023. Available online: https://www.transportation.gov/mission/office-secretary/office-policy/transportation-policy/benefit-cost-analysis-guidance (accessed on 11 March 2025).
- Anwar, N. World’s Largest Drone Maker Is Unfazed—Even If It’s Blacklisted by the U.S. 7 February 2023. Available online: https://www.cnbc.com/2023/02/08/worlds-largest-drone-maker-dji-is-unfazed-by-challenges-like-us-blacklist.html (accessed on 1 June 2023).
- Askarzadeh, T.; Bridgelall, R.; Tolliver, D. Monitoring Nodal Transportation Assets with Uncrewed Aerial Vehicles: A Comprehensive Review. Drones 2024, 8, 233. [Google Scholar] [CrossRef]
- Bradbury, T. The Drone Girl. 2023. Available online: https://www.thedronegirl.com/2020/05/24/lipo-batteries-last/ (accessed on 6 June 2024).
- Castro, J.; Flores, C.; Gonzalez, D.; Quintero, V.; Perez, A. From the Air to the Ground: An Experimental Approach to Assess LiPo Batteries for a Second Life. In Proceedings of the 2022 Prognostics and Health Management Conference (PHM-2022 London), London, UK, 27–29 May 2022. [Google Scholar]
- Skydio. 20 July 2023. Available online: https://support.skydio.com/hc/en-us/articles/1260804644430-How-to-charge-and-maintain-your-Skydio-X2-batteries (accessed on 27 September 2023).
- DJI. Consumer Drones Comparison. 1 August 2023. Available online: https://www.dji.com/products/comparison-consumer-drones (accessed on 12 December 2023).
- Parrot. ANAFI Ai Photogrammetry. 2023. Available online: https://www.parrot.com/us/drones/anafi-ai/technical-documentation/photogrammetry (accessed on 2 August 2023).
- Yuneec. Yuneec a Company of ATL Drones. 2023. Available online: https://yuneec.online/e30z/ (accessed on 4 August 2023).
- RMUS Unmanned Solutions. Flyability Elios 3. 2023. Available online: https://www.flyability.com/elios-3-rad-payload (accessed on 15 July 2023).
- DJI Inspire. DJI Inspire 3. 2023. Available online: https://www.dji.com/inspire-3 (accessed on 27 August 2023).
- Autelrobotics. Go Beyond the Boundaries of Aerial Photography. 2023. Available online: https://shop.autelrobotics.com/collections/autel-evo-ii-series (accessed on 29 August 2023).
- Helmi, W.; Bridgelall, R.; Askarzadeh, T. Remote Sensing and Machine Learning for Safer Railways: A Review. Appl. Sci. 2024, 14, 3573. [Google Scholar] [CrossRef]
- Gillins, D.T.; Parrish, C.; Gillins, M.N.; Simpson, C. Eyes in the Sky: Bridge Inspections with Unmanned Aerial Vehicles; Oregon DOT: Washington, DC, USA, 2018.
- Michael Baker International. UAS Bridge Inspection Pilot; Wisconsin Department of Transportation: Madison, WI, USA, 2017. Available online: https://trust.dot.state.wi.us/ftp/dtsd/structures/pub/gurtner/UAS%20Pilot%20Bridge%20Inspection%20Report_final.pdf (accessed on 11 March 2025).
- O’Neil-Dunne, J. Unmanned Aircraft Systems for Transportation Decision Support; U.S. Department of Transportation: Washington, DA, USA, 2016. Available online: https://rosap.ntl.bts.gov/view/dot/32744 (accessed on 11 March 2025).
- Zajkowski, T.; Snyder, K.; Arnold, E.; Divakaran, D. Unmanned Aircraft Systems: A New Tool for DOT Inspections; NCDOT: Charlotte, NC, USA, 2016.
- Dorafshan, S.; Maguire, H.N.V.; Coopmans, C. Fatigue Crack Detection Using Unmanned Aerial Systems in Under-Bridge Inspection; Idaho Transportation Department: Boise, ID, USA, 2017. Available online: https://apps.itd.idaho.gov/apps/research/Completed/RP256.pdf (accessed on 11 March 2025).
- Bridge, J.A.; Ifju, P.G.; Whitley, T.; Tomiczek, A.P. Use of Small Unmanned Aerial Vehicles for Structural Inspection; Florida Department of Transportation: Tallahassee, FL, USA, 2018. Available online: https://rosap.ntl.bts.gov/view/dot/36598 (accessed on 11 March 2025).
- Burgett, J.M.; Bausman, D.C.; Comert, G. Unmanned Aircraft Systems (UAS) Impact on Operational Efficiency and Connectivity; U.S. DOT: Washington, DC, USA, 2019. Available online: https://rosap.ntl.bts.gov/view/dot/53574 (accessed on 11 March 2025).
- DroneDeploy. Drone Insurance and Liability Coverage: Do You Need It? 17 January 2018. Available online: https://www.dronedeploy.com/blog/drone-insurance-and-liability-coverage-do-you-need (accessed on 2 October 2023).
- FHWA BIRM. Bridge Inspector’s Reference Manual (BIRM); FHWA: Washington, DC, USA, 2023.
- USDOT. Departmental Guidance Treatment of the Value of Preventing Fatalities and Injuries in Preparing Economic Analyses; USDOT: College Station, TX, USA, 2021. Available online: https://tti.tamu.edu/news/tti-publishes-2021-urban-mobility-report/ (accessed on 11 March 2025).
- WisDOT. General Lane Closure Impact Analysis; WisDOT, Wisconsin Department of Transportation: Madison, WI, USA, 2020. Available online: https://transportal.cee.wisc.edu/closures/devel/#:~:text=Welcome,to%20time%20or%20budget%20constraints (accessed on 11 March 2025).
- Glover, B.J. 2021 Urban Mobility Report; Texas A&M Transportation Institute, United States Department of Transportation: Washington DC, USA, 2021. Available online: https://www.transportation.gov/sites/dot.gov/files/2021-03/DOT%20VSL%20Guidance%20-%202021%20Update.pdf (accessed on 11 March 2025).
- Cordella, M.; Alfieri, F.; Sanfelix, J. Guidance for the Assessment of Material Efficiency: Application to Smartphones; Publications Office of the European Union: Luxembourg, 2020. [Google Scholar]
- Cohn, P.; Green, A.; Langstaff, M.; Roller, M. Commercial Drones Are Here: The Future of Unmanned Aerial Systems. 2017. Available online: https://www.mckinsey.com/industries/travel-logistics-and-infrastructure/our-insights/commercial-drones-are-here-the-future-of-unmanned-aerial-systems#/ (accessed on 1 June 2023).


Disclaimer/Publisher’s Note: The statements, opinions and data contained in all publications are solely those of the individual author(s) and contributor(s) and not of MDPI and/or the editor(s). MDPI and/or the editor(s) disclaim responsibility for any injury to people or property resulting from any ideas, methods, instructions or products referred to in the content. |
© 2025 by the authors. Licensee MDPI, Basel, Switzerland. This article is an open access article distributed under the terms and conditions of the Creative Commons Attribution (CC BY) license (https://creativecommons.org/licenses/by/4.0/).