Review

The Use of Earth Observation Data for Railway Infrastructure Monitoring—A Review

1
Faculty of Mechanical Engineering, University of Nis, 18000 Nis, Serbia
2
OHB Digital Services GmbH, 28359 Bremen, Germany
3
Central Campus Győr, Széchenyi István University, 9026 Gyor, Hungary
*
Authors to whom correspondence should be addressed.
Infrastructures 2025, 10(3), 66; https://doi.org/10.3390/infrastructures10030066
Submission received: 24 January 2025 / Revised: 3 March 2025 / Accepted: 18 March 2025 / Published: 19 March 2025

Abstract

:
Satellite data have the potential to significantly enhance railway operations and drive the digitization of the rail sector. In the context of railways, satellite data primarily refers to the use of Global Navigation Satellite System (GNSS) data for applications such as navigation, positioning, and signalling. However, remote sensing data from Earth Observation (EO) satellites remain comparatively underutilized in railway applications. While the use of GNSS data in railways is well documented in the literature, research on EO-based remote sensing methods remains relatively limited. This paper aims to bridge this gap as it presents a comprehensive review of the use of satellite data in railway applications, with a particular focus on the underexplored potential of EO data. It provides the first in-depth analysis of EO techniques, primarily examining the use of synthetic aperture radar (SAR) and optical satellite data for key applications for infrastructure managers and railway operators, such as assessing track stability, detecting deformations, and monitoring surrounding environmental conditions. The goal of this review is to explore the diverse range of EO-based applications in railways and to identify emerging trends, including the integration of thermal EO data and the novel use of SAR for dynamic and predictive analyses. By synthesizing existing research and addressing knowledge gaps, the presented review underscores the potential of EO data to transform railway infrastructure management. Enhanced spatial resolution, frequent revisit cycles, and advanced AI-driven analytics are highlighted as key enablers for safer, more reliable, and cost-effective solutions. This review provides a framework for leveraging EO data to drive innovation and improve railway monitoring practices.

1. Introduction

Railways are a crucial type of transport worldwide, allowing for the reliable and effective movement of people and cargo over vast distances. They play a vital role in bolstering economies, urban development, and international commerce. However, the rising demands on railway infrastructure, driven by population growth, urbanization, reliability, availability, and environmental considerations, necessitate continuous technological advancements and improvements in physical infrastructure. Research in this field focuses on enhancing railway operational and infrastructural efficiency through improved track durability, stability under dynamic conditions, energy efficiency, and mechanical performance, ultimately increasing the safety, reliability, and sustainability of global rail transport systems [1,2,3]. In parallel, there are increased efforts for improvements of reliability and efficiency of railway infrastructure monitoring to identify critical areas and to monitor the effects of maintenance measures. Traditional methods, such as manual inspections and track recording vehicles, are now complemented by innovative technologies like sensor networks, machine learning, and remote sensing [4,5].
This paper explores Earth Observation (EO) satellite data as a relatively untapped resource for monitoring railway infrastructure that offers novel solutions to enhance safety, reliability, and efficiency in this sector, providing valuable insights into environmental factors affecting railway infrastructure.
The use of satellite data in railways primarily involves data from Global Navigation Satellite System (GNSS) and EO data. GNSS, which is extensively documented, has significantly improved navigation and signalling, enabling precise train tracking and reduced reliance on trackside infrastructure, leading to cost savings and improved safety [6,7,8,9], and is already considered as key for the rail sector digitalization [10]. In contrast, the application of EO data in this domain has been limited but is gradually gaining recognition for its potential to revolutionize railway monitoring [11].
EO satellites use sensors like optical cameras, radar (SAR), and infrared to collect images and measurements of land, oceans, and atmosphere and to provide advanced tools with a high potential for analyzing railway operations, identifying issues early, and optimizing maintenance strategies. By integrating EO data with AI, rail network management can be safer and more efficient [12]. Despite its growing usage, significant knowledge gaps remain, particularly in terms of using EO data for comprehensive railway infrastructure monitoring. Related review papers, such as those by Song et al. [13] and Gagliardi et al. [14], primarily focus on general infrastructure applications, with railways as a minor consideration. Railway-specific studies, such as [15], often limit their scope to synthetic aperture radar (SAR) data. Consequently, to the best of our knowledge, this review provides the first systematic overview of EO data applications specific to railway infrastructure, examining their use cases and the broader range of satellite technologies employed.
Current EO applications for railway monitoring reveal several deficiencies. The predominant reliance on SAR data, while effective for deformation monitoring, overlooks the potential of optical, thermal, and multispectral EO data for a holistic analysis of railway systems [14,15,16]. Furthermore, limited data resolution and revisit times pose challenges for real-time monitoring, especially in dynamic environments where rapid response is critical [17]. Additionally, the integration of EO data with in situ measurements and AI algorithms remains underdeveloped, restricting the ability to leverage full-scale predictive analytics [18].
Addressing these gaps will have profound implications for railway infrastructure management. Enhanced data integration and resolution will enable more precise monitoring of track conditions, mitigating risks such as deformation and subsidence. Incorporating multispectral and thermal data can improve vegetation management and flood risk assessments, resulting in better safety outcomes and fewer service disruptions [19,20]. The adoption of near-real-time EO monitoring will facilitate proactive maintenance strategies, reducing downtime and maintenance costs [21]. Moreover, advanced AI-driven analytics can transform the management of railway assets, enabling predictive maintenance and improving resource allocation [22].
In summary, while EO data applications in railway infrastructure monitoring are still nascent, addressing these knowledge gaps can unlock transformative improvements in safety, efficiency, and sustainability. This paper aims to provide a comprehensive review of EO data use cases with a focus on the diverse range of established and emerging EO-based applications highlighting opportunities for innovation and practical implementation in the railway sector.

2. Railway Infrastructure Monitoring Use Cases and Satellite Data Potential

The use cases for infrastructure managers (IM) and railway undertakings (RU) reported in the literature as the use cases of EO data applications are described in the following sections of this Section 2, along with the suitable EO data. The goal is to provide a short description of EO technologies as an introduction to detailed examples of the application of EO-based technologies for the considered use cases given in Section 3.

2.1. Monitoring of Rail Track Deformations (TD)

Railway infrastructure is composed of a complex collection of substructures, such as rail tracks, sleepers, embankments, tunnels, and bridges. All these substructures depreciate over time and cumulatively affect the structural health of the railway line. Traffic frequency increases, in combination with aging and higher axle loads and speeds, affect the geometry of the rail track. It is important to detect, identify, and analyze rail track deformations at an early stage to ensure the safety of passengers on board. The structural health of the railway can be monitored by conventional methods, which entail the use of survey trains or in situ measurement devices [23,24], such as displacement sensors and tilt meters [25]. In general, these methods are expensive, labor-intensive, and time-consuming. Therefore, they are usually applied at locations where the structural health is expected to be compromised. Monitoring of wide areas, including railway lines that are in near-continuous use, would contribute to large-scale railway structural health monitoring. This can be achieved using satellite data, primarily using data obtained from synthetic aperture radar (SAR) and interferometric SAR (InSAR) systems that allow measurement of displacements on ground structures down to the millimeter level with high spatial resolution (e.g., [22,26,27]).
SAR is a form of radar used to create detailed, high-resolution images of the Earth’s surface. It works by transmitting microwave signals toward the ground and analyzing the reflected signals to generate images. SAR operates in all weather conditions (it penetrates clouds, rain, and even snow), provides day and night imaging (it uses its own microwave illumination, making it independent of sunlight), captures fine detail (by simulating a large antenna aperture using the motion of the satellite), achieves high spatial resolution, measures surface deformation as SAR can detect millimeter-scale changes in surface structure, such as land subsidence or uplift, through techniques like interferometric SAR (InSAR). InSAR involves combining two or more SAR images of the same area taken at different times. By analyzing the phase differences between these images, it can detect surface deformations with high precision.
Some notable satellites equipped with SAR sensors are Sentinel-1A, 1B, and recently launched 1C (ESA), Radarsat-2 and Radarsat Constellation Mission (RCM) (Canada), TerraSAR-X and TanDEM-X (Germany), ALOS-2 (Daichi-2) (Japan), RISAT-1A/1B and 2 (India), COSMO-SkyMed (Italy), SAOCOM 1A and 1B (Argentina), as well as commercial SAR satellites: ICEYE Constellation (Finland), Capella Space (USA). There have also been several important historical SAR missions that have paved the way for current technologies: ERS-1 and ERS-2 (ESA), ENVISAT (ASAR) (ESA), and SEASAT (NASA).

2.2. Monitoring of Ground Deformation (GD)

Seismic activity, sediment compaction, other geodynamical processes, moisture accumulation, excessive exploitation of groundwater, hydrocarbon extraction, and the presence of quarries and industrial areas usually cause vertical and horizontal ground movements. They affect railway infrastructure components, in particular the ballast substructure, whose condition is extremely important for the durability of the railway tracks. Ground movements cause loss of elevation slope change and affect the smoothness of the railway track. Conventional methods for monitoring, such as on-site geotechnical measurements, leveling, usage of settlement meter and inclinometer, and GPS, are effective and give insight into the composition of layers and condition of the railway substructure [23,28,29]. However, they are labor-intensive, imply substantial costs, and are carried out in a targeted manner on sites indicated by preceding survey train measurements. Ground deformation rates sufficiently precise for railway infrastructure monitoring can be obtained using SAR technology, as in the case of rail track deformation measurements, explained just above (Section 2.1). Using SAR technology, the railway ground area of interest can be monitored on a regular basis without the need for any ground instrumentation (e.g., [20,21]).

2.3. Monitoring of Railway Transition Zones (TZ)

Transition zones in railway networks are locations with significant changes in the track-supporting structure, such as those located near tunnels and bridges. The track geometry continuously degrades faster in transition zones compared to open tracks due to differential settlement, differences in stiffness, and geotechnical issues [30], leading to track damage, amplification of the interaction forces between wheel and rail, and possible derailment and affecting the comfort of the passengers [18]. Transition zones are usually monitored by measuring coaches or by performing measurements using optical instruments. These measurements are carried out occasionally and locally, mainly due to high costs. Satellite technologies could provide an alternative, a non-invasive, high-resolution method for continuous monitoring of transition zones. The challenges of transition zones can also be grouped as belonging to TD and GD use cases so that the same satellite data and data processing techniques are applied, as explained above.

2.4. Monitoring of Railway Bridges (B)

The structural capacity of bridges built decades after the Second World War is considered deficient. They were designed for a smaller traffic volume and according to criteria that are less strict compared to today’s criteria. They are also facing challenges, such as reduced maintenance and investment and changes in climate, reflected in increased temperatures, flooding, and strong winds [19]. Therefore, inadequate monitoring of the condition of these bridges can lead to damage and collapse. Bridges are, in general, inspected on a regular basis with a frequency that is often not sufficient to detect defects. On-site sensors can be used for monitoring bridges but not on a large scale, due to lack of funds, and installing sensors on some bridges, like long-span bridges, can be challenging [31]. Satellite SAR systems, providing real-time, absolute displacements of structures, can be used for early warning of potential problems. High-resolution optical data could provide detailed visual monitoring of surface conditions and bridge surroundings (e.g., [32]).

2.5. Monitoring of Vegetation Around the Rail Track (VG)

Identification of the threat to railway sections from surrounding vegetation increases operational safety. One of the main threats is falling trees. To assess that kind of threat, it is important to consider the species composition, as well as the state of health of tree vegetation. Knowing the species composition allows managers to predict what tools will be needed for the maintenance of vegetation. Forest processes related to climate change can be detected by long-term monitoring of specific areas. Apart from the state of vegetation, long-term monitoring also helps identify devastation. The benefits of vegetation monitoring are the increased traffic flow and the reduction of damage to the infrastructure, especially in harsh weather conditions. Unlike conventional methods, such as using trains equipped with LiDAR [33], satellite optical images provide information beyond the row of trees next to the rail track, and they can be used to assess the health of tree vegetation. (e.g., [34,35]).
Optical sensors on satellites provide detailed images of Earth’s surface, capturing fine-grained views of natural systems and human activities. These sensors work by detecting visible light and other parts of the electromagnetic spectrum, allowing us to observe and monitor various phenomena. Commercial providers such as WorldView-3 and WorldView-4 (Maxar Technologies: Westminster, Colorado, USA), Pleiades Neo (Airbus Defence and Space: Taufkirchen, Germany), and QuickBird (Maxar Technologies) have achieved high resolutions, with some reaching up to 30 cm. There are also several non-commercial optical satellites, which are used for various scientific, environmental, and governmental purposes, such as Landsat series (NASA/USGS), Sentinel-2A and 2B (ESA), and MODIS (NASA). For example, the Sentinel-2 mission, with bands covering near-infrared and red wavelengths, is proving valuable for monitoring vegetation, particularly along railways and roads. In particular, its wide range of vegetation indices, such as the widely used NDVI (Normalized Difference Vegetation Index), enables comprehensive vegetation analysis. The spatial resolution of 10 m, 20 m, and 60 m, depending on the spectrum, allows detailed observations of the monitored areas. With a revisit time of approximately 5 days, the Sentinel-2 mission ensures frequent and timely data acquisition. However, the efficiency of optical data acquisition is susceptible to the challenge of cloud cover.

2.6. Monitoring of Water Level Around the Rail Track (WL)

Railway infrastructure is under high risk of damage from flooding, considering recent climate changes, such as increasing temperatures, changes in precipitation intensity and amount, and increases in heavy storms [16]. This has resulted in more water-induced damage to railway infrastructure in recent years. The water level near the rail track affects the safety of passengers and cargo on board. It is currently determined by visual inspection carried out by trained personnel. These inspections are subjective, limited in space and time, affected by traffic frequency [36,37], and do not include water areas out of the inspectors’ sight but close enough to cause damage. Dynamic water surface areas near the rail track can be mapped using satellite optical images. However, to determine the changes in vertical water level, it is necessary to use other, complementary techniques.
Recent advances in satellite-based Earth surface water monitoring offer possibilities for water monitoring near railway tracks [17]. Satellites like Sentinel-3 and ICESat-2 use radar and laser altimetry to measure water levels in rivers, lakes, and reservoirs. These data can be used to monitor changes in water levels near rail tracks, helping to predict and prevent flooding. SAR satellites, such as those in the Sentinel-1 and Radarsat Constellation, can provide high-resolution images that detect changes in surface water extent. This is useful for identifying areas where water levels are rising and could potentially impact rail infrastructure. Optical satellites like Landsat and Sentinel-2 provide multispectral imagery that can be used to monitor water bodies. Changes in water extent can indicate rising water levels or potential flooding risks.

3. EO-Based Railway Infrastructure Monitoring: Literature Review

3.1. Comparative Analysis of EO Data Use in Railway Infrastructure Monitoring

The analyzed papers are summarized in Table 1, based on their use case, satellite constellation used, and data used from the constellation. Furthermore, the analysis is performed with respect to whether the papers report only the possibilities for the evaluation, they report on the performed evaluation by testing, or the EO-based solution is compared to conventional approaches as validation of the proposed solution. In the latter case, the venue of the evaluation and/or testing and validation is analyzed. Following the summary given in Table 1, examples of EO-based applications are described in more detail in the same order of use cases as given in Section 2.
One of the first reported usages of EO-based railway infrastructure monitoring for track deformation (TD) was reported by Javed et al. [47], who proposed an algorithm for detecting railway tracks using low-quality satellite imagery from Google Maps. It addresses the challenge of poor image quality by incorporating preprocessing, edge detection, and morphological analysis. The algorithm can identify damaged tracks, crossings, and obstacles, helping to prevent accidents. Dindar et al. [60] presented a review study on the feasibility of using satellite imaging for risk management in railway turnout component failures. It examines how satellite imagery can help monitor turnout sub-systems and improve risk mitigation. The study highlights that advancements in satellite sensor quality could eventually enable the detection of more subtle deformations, such as track irregularities and buckling, enhancing railway inspection strategies and risk management. Chang et al. [22] used InSAR techniques to monitor the stability of the part of the Betuweroute (double-track freight railway) close to Rotterdam. They developed algorithms to fine-tune InSAR technology to railway infrastructure, enabling near-real-time monitoring of changes in rail track geometry, with a focus on dynamic behavior and the transition zones between free embankments and fixed substructures. The developed algorithm was evaluated and validated on a segment of the Betuweroute in the Netherlands, using 248 TerraSAR-X satellite images acquired bi-weekly in a time interval from 2009 until 2013. The achieved results showed that track segments on the monitored route were subject to significant vertical displacements of up to 5 cm, most likely due to settlement or compaction.
Further research by the same authors resulted in the first nationwide, satellite-based railway monitoring system with temporal updates and detection of risk areas [26]. Chang et al., for this purpose, developed a probabilistic method for InSAR time series postprocessing to efficiently analyze the data, with the goal of estimating the most probable displacement parameters for each point in order to detect railway instability. The method estimates settlements at the millimeter level and generates deformation maps. Using 213 Radarsat-2 SAR images, the approach was demonstrated over the entire railway network of the Netherlands. A method for 3D geolocation quality improvement of Sentinel-1 SAR data aided by laser scanning data, specifically Light Detection and Ranging (LiDAR) data, was tested and validated on the Betuweroute freight train track in the Netherlands [27]. It enabled the classification of railway substructures into rail tracks, embankment areas, and surrounding areas, as well as the recognition of unstable rail segments by using differential settlement of rails. The line of sight (LOS) deformation velocity map for the part of the test site is shown in Figure 1 [27]. DInSAR technique for the identification of deformation of railways, which may compromise both serviceability and safety, was already used by Galve et al. [41] for measuring the subsidence on railway tracks in the central sector of Ebro Valley, Spain, in particular on the Castejón–Zaragoza conventional railway line. This area is affected by evaporite karst, where soluble rocks like gypsum, anhydrite, or salt dissolve, forming sinkholes or subsurface voids. These features can destabilize railway corridors due to their subsidence and deformation potential. The TD was detected thanks to medium-resolution surface velocity maps generated through the analysis of the archived data of the ENVISAT and ALOS SAR missions.
To analyze TD and GD, Hu et al. [40] combined multi-temporal interferometric SAR (MT-InSAR) and LiDAR data for deformation monitoring along the railway and buffer zone near Zaltbommel in the Netherlands. LiDAR data were used to aid the attribution of radar scatters to physical objects and for the classification of railway substructures, making it easier to interpret deformation signals, especially in transition zones. Figure 2a shows the Actueel Hoogtebestand Nederland 3 (AHN3) LiDAR point cloud along the railway with classification, while Figure 2e shows the location of the railway. Figure 2b–d show estimated parameters on both continuously coherent scatterers (CCS) and temporary coherent scatterers (TCS). Another type of InSAR technology, persistent scatterer interferometric SAR (PS-InSAR), was used by Kim et al. [43] to measure and analyze rail TD and examine deformation trends in a part of the South Korean railway network. Reflection intensity was increased by installing corner reflectors in topologically different areas of the railway. The primary focus was on testing and verification where the on-site measurements were carried out, and SAR images were captured for the same period.
To assess GD, Atanassova et al. [20] combined SAR data and data from local GNSS reference stations for monitoring railway lines passing through Provadia town in Bulgaria close to the salt deposit, an area known for ground sinking caused by intensive mining activity. GNSS data were used to validate the SAR-based pilot system. The DInSAR (differential synthetic aperture radar) approach was used to process the SAR data to measure ground motion. Based on monitoring approximately 50 km of railway tracks in Northern Switzerland, Bernhard et al. [21] proved that there exists a correlation between persistent scatterer interferometry (PSI) GD variability and chord-based measurements of longitudinal height performed by a survey train. Chord-based measurements, as suggestive indicators for detecting rail track deformations interpreted by experts, are limited to specific rail track sections in which PSI-based measurements have no limitations. Railway track classification was performed by setting thresholds on the PSI statistical features. The PSI-based approach was tested using high-resolution TerraSAR-X observations. Land subsidence along the Beijing–Tianjin high-speed railway in China was investigated using ground deformation results derived from two SAR platforms, ENVI-SAT/ASAR and TerraSAR-X [38]. The data were fused using the minimum gradient difference of a fitting curve. The maximum entropy model was used to correlate measured ground subsidence with three hydrogeological factors, which were identified as the likely causes of subsidence. Huge-scale railway infrastructure damage caused by an earthquake near Ojiya city, Nagaoka city, Kawaguchi town, Horinouchi town, and Yamakoshi village in Japan was detected based on commercial high-resolution SPOT optical satellite images using Normalized Difference Vegetation Index (NDVI) and statistical texture analysis [42]. The primary assumption was that changes in the vegetation cover could be used to extract damage caused by earthquakes. Statistical texture analysis was used for areas with no vegetation. Detection of damage enabled the identification of the emergency transportation route. Pigorini et al. [44] analyzed the possible application of the PS-InSAR technique for measurements during underground work on the Cassia–Monte Mario tunnel in Rome and the High-Speed/High-Capacity Bologna Node tunnel and the Scianina–Tracoccia tunnel in Italy. The technique was also applied in the conceptual design of the new Venice–Trieste railway line. The PS-InSAR was developed and patented by the technical university Politecnico di Milano. It enables the measurement of the position of the ground target, the annual average displacement rate, and the displacement time series. The analyzed satellite data used were data gathered by the ESA ERS-1 and ERS-2 sensors and by the CSA RADARSAT-1 satellite. Ground subsidence in the proximity of several railways in the Lombardia region, near Milano city and between Lecco and Como cities in Northern Italy, was detected using two datasets of X-band Cosmo-SkyMed InSAR data [45]. Subsidence was induced by industrial development or hydrogeological factors.
Interesting approach for detecting changes in railway curves caused by seismic events was proposed by Tong et al. [52], using high-resolution IKONOS stereo satellite images. An empirical experiment conducted in change detection in railway curves resulting from Wenchuan earthquake in 2008 in Dujiangyan City (China) demonstrated the effectiveness of this approach. The study compared five change detection models, with the affine model achieving the highest accuracy of 0.318 m. The experimental results show that the proposed approach can detect geometric changes in railway curves caused by earthquakes with decimeter-level precision. Wassie et al. [57] applied differential SAR interferometry (DInSAR) using Sentinel-1 imagery for the monitoring of land subsidence along railway segment of Barcelona (Spain). The study focused on the analysis of the role of quality indicators in the assessment of DInSAR products. The experimental results obtained pointed that the quality indicators can be used for identifying reliable measurements. Using Sentinel-1 imagery and the New Small Baseline Subset (NSBAS) algorithm, Shami et al. [58] assessed ground subsidence in the Kashan plain and its impact on the railway in up–down and east–west directions. It was observed that more than 60% of the railway is affected by subsidence, while the rate of vertical railway deformation was found to be between 0 and −23 mm/year. In addition, the authors proposed a method for railway stability analysis based on longitudinal profiles parallel to the rails.
Permafrost-related deformations pose significant challenges to the stability and safety of railway infrastructure in cold regions, requiring advanced GD monitoring techniques. Deformations of the permafrost subgrades (sliced and crushed rock embankments and railway bridge) at the Beiluhe test site of the Qinghai–Tibet railway in China were measured using the differential interferometric SAR (D-InSAR) technique [46]. A settlement was identified as the main subgrade deformation. Railway bridges experienced the most minor deformation among the subgrades. The same track was also considered by Chang and Hanssen [49], who investigated the use of satellite SAR imagery to detect permafrost-related instabilities, as did Tan et al. [46]. By analyzing Envisat SAR images in the period of two years, ground deformations that resembled permafrost dynamics were observed. Although there was insufficient ground truth data to unambiguously link the signals to permafrost, the findings highlight the value of continuous satellite monitoring for ensuring the operational safety of the railway. Due to permafrost-related instabilities, the same track was also interesting to Zhu et al. [51], who applied small baseline subset interferometric synthetic aperture radar (SBAS-InSAR) technology to monitor, analyze, and predict surface deformation along the Qinghai–Tibet railway. A total of 1166 Sentinel-1A images from January 2017 to April 2023 were collected to obtain⋅1956 km of surface deformation along the railway. GNSS reference data confirmed the reliability and accuracy of the applied method. It was observed that deformation was mainly concentrated in the area close to the railway, with a maximum deformation rate of 26 mm annually. Furthermore, the Tent Mapping Sparrow Search Algorithm Long Short-Term Memory (Tent-SSA-LSTM) model was developed to predict future deformation for early detection and warning.
To assess GD, Bianchini-Ciampoli et al. [53] discussed an integrated approach, i.e., fusion of synthetic aperture radar interferometry (InSAR) and ground-penetrating radar (GPR) technologies, for railway infrastructure monitoring. The proposed approach was tested on a 10-km-long railway nearby San Severo (Italy) using SAR images from both the Sentinel 1A and COSMO-SkyMed missions. The fusion of InSAR and GPR data proved to be an effective tool, enhancing both the reliability and productivity of railway infrastructure monitoring. A similar approach presented by Tosti et al. [56] explored the viability of integrating GPR for railway infrastructure monitoring. An experimental study carried out in Puglia (Italy) used SAR images from both the Sentinel 1A and COSMO-SkyMed. The experimental results validated the effectiveness of the combined data-fusion approach for assessing the health of transport infrastructure at a network scale.
To complement on-site measurements of TZ, Wang et al. [18] proposed a system that uses InSAR technology for monitoring the transition zone containing the tracks on the steel bridge (embedded rail) and embankment (ballast track) located in Moerdijk in the Netherlands. The results of applying developed technology in analyzing TerraSAR-X satellite images were validated against two on-site optical measurement systems. Differential settlement induced by track components, such as expansion joints, outside of the bridge was also detected based on InSAR data. Lyu et al. [50] proposed a method for evaluating stress distribution in high-altitude Tibetan Plateau railway tunnels using subset synthetic aperture radar interferometry (SBAS-InSAR). It analyzes deformation data from Sentinel-1 images, obtained over the course of a year, of the Dongelu Tunnel on the China–Tibet Railway and compares these with high-frequency and high-precision automated vertical displacement measurements. A model to assess the vertical stress state under loading near the tunnel’s entrance was developed, revealing slow and minimal surface deformation above the tunnel (1–3 mm/year). The proposed tunnel monitoring and stability assessment method forecasts the tunnel’s stress condition, aiding in assessing its stability and providing guidance for engineering construction and geological prediction. Zhou et al. [55] jointly applied time-series InSAR (TSInSAR) and BeiDou Navigation Satellite System (BDS) technologies to identify and monitor side slope deformations in TZ along high-speed railways based on Sentinel-1A data. It was observed that TSInSAR can effectively identify unstable side slopes, while TSInSAR, BDS, and UAV monitoring results showed good agreement. Rainfall was found to significantly influence side-slope deformation.
The concept of displacement thermal sensitivity (elastic displacement response to a unit change in temperature) can be used to monitor bridge structural behavior. It was introduced by Cusson et al. [19] and tested on bridges that link the cities of Montreal and Longueuil and the cities of Montreal and Saint-Lambert in Canada. Both bridges had decks and superstructures of similar thermal expansion coefficients. Displacement thermal sensitivity was monitored using InSAR technology applied to satellite data obtained over two selected bridges and a comparison of displacement measurements from different satellite platforms (RadarSat-2 vs. Sentinel-1) and different sources (e.g., GPS elevation measurements). The authors also developed a visualization and early warning tool that uses defined threshold levels for issuing alerts. Gagliardi et al. [53] investigated the possibility of persistent scatterer interferometry (PSI) technology as an innovative monitoring technology for monitoring the structural integrity of a railway bridge. The study used X-Band COSMO-SkyMed images provided by the Italian Space Agency to detect structural displacements in the Rochester Railway Bridge (UK). The results identified the presence of multiple persistent scatterers (PSs) over the bridge, which proved useful to achieve a more comprehensive monitoring methodology. Zhou et al. [32] applied SBAS-InSAR technology and Sentinel-1A data for monitoring deformation of a large-span railway bridge (Ganjiang Super Bridge, China). The deformation results were combined with bridge structure, temperature, and riverbed sediment scouring data. The dataset included Sentinel-1A images from September 2018 to September 2020 with a month’s image-sampling interval. Results from SBAS-InSAR and PS-InSAR methods were compared to verify the experimental results. Poreh et al. [59] used high-resolution Cosmo-SkyMed satellite imagery and the DInSAR technique for monitoring the stability of a railway bridge over the Volturno river at Triflisco (Campania) in Italy. The results obtained showed fairly stable conditions on the studied railway and railway bridge. It was observed that most of the line of sight (LOS) changes were because of seasonal temperature variations.
To get a detailed inventory of the railway area in the southeast of Berlin for urban ecological monitoring and VG assessment, geometrically corrected panchromatic and multispectral QuickBird satellite data were used [39]. This was accomplished by extracting rail tracks, separating different states of vegetation succession, or differentiating between surface types with varying degrees of impermeability based on spectral information. Optical satellite image data were also used by Kučera and Dobesova [34] to determine and evaluate the degree of threat to railway infrastructure from falling trees in the Liberec Region of the Czech Republic. The degree of threat was identified according to three parameters: the height of tree stands, species composition, and vegetation health. Data for the first parameter were provided by the Forest Management Institute of the Czech Republic, while the species composition was assessed using LANDSAT-7 satellite images. Vegetation health was assessed based on the NDMI index extracted from Sentinel-2 images. The result of analyzing these three parameters was a compound Vegetation Threat Index for Railways (VTIR). Satellite image data and machine learning algorithms were used for supervised, pixel-based classification of vegetation on the French railway network [35]. Pictures from the track-monitoring train were used in addition to the Pleaides satellite images to create training samples. The pretrained models were reused to classify other images from the same region and month. The result was a vegetation map with four classes: trees, shrubs, grass, and no vegetation. Zhang et al. [54] analyzed the ecological environment quality along the Beijing–Tianjin intercity high-speed railway using Landsat satellite images from 2008 to 2020. The research utilized a revised remote sensing-based ecological index to monitor and assess the vegetation transformation and quality over time. Fedeli et al. [48] reported pioneering efforts to update existing railway monitoring systems in Italy by developing an innovative system for the supervision of railway areas to identify hydrogeological and anthropogenic hazards, ensuring safety and efficiency for railway traffic. The system uses SAR and optical images for image acquisition and Artificial Neural Networks (ANNs) for processing and feature extraction in order to identify anomalies, such as vegetation encroachment and new buildings along the railway. The systems are designed to allow both periodic and on-demand analyses, offering strong scalability for sharing with other European infrastructure managers to establish a common standard. The system aims to reduce analysis time and costs, eliminating the need for third-party services in monitoring and maintenance.
Accurate monitoring of flood risks along railway corridors is essential for ensuring infrastructure resilience and operational safety, with advanced remote sensing technologies playing a crucial role in WL assessment. Arroyo-Mora et al. [16] used commercial off-the-shelf Unmanned Aerial System (UAS) DJI Matrice 300 RTK combined with satellite optical imagery in four sites at risk of flooding along the railway line between the cities of Ottawa and Brockville in Canada. UAS-based Structure from Motion (SfM) photogrammetry was used to measure changes in vertical water level at the centimeter level, while the UAS-based high spatial detail orthomosaics were used to measure the extent of the surface water. Classification of the surface water and wetlands was performed from UAS orthomosaics and satellite optical images of areas larger than those recorded by the UAS.

3.2. Limitations in the Existing EO-Based Methodologies, Datasets, and Technologies

Despite the promising capabilities of EO data for railway infrastructure monitoring, significant limitations remain in the methodologies, datasets, and technologies employed. First, the reliance on synthetic aperture radar (SAR) data, while effective for deformation monitoring, lacks the integration of optical, thermal, and multispectral data, which can provide a more comprehensive analysis. Non-commercial optical data are often of insufficient resolution, and high-resolution commercial data are prohibitively expensive for large-scale use [14,15]. Additionally, the limited revisit times of satellites, particularly for dynamic phenomena such as flash floods or rapid deformation, hinder the ability to conduct near-real-time monitoring. For example, Sentinel-1 offers high spatial resolution but is constrained by a six-day revisit cycle [20].
Another critical limitation is the integration of EO data with in situ measurements and AI-driven analytics. While promising, the lack of robust frameworks to combine these approaches limits their scalability and predictive capabilities. Current AI models trained on EO data are not fully optimized for handling multimodal data inputs, leading to suboptimal outcomes in predictive modelling [18,21]. Moreover, atmospheric interference, such as cloud cover, significantly impacts optical sensor performance, limiting their utility in adverse weather conditions [22]. Addressing these limitations through advanced fusion [53,56,61,62] methodologies and enhanced satellite technologies is imperative for the evolution of EO-based monitoring systems.
Another important aspect to address is that with new generations of sensors, the complexity of remote sensing scenes has increased significantly due to increased resolution [63]. Although numerous authors over the years coped with low resolution of images and proposed new approaches [47,64] for mitigating the low resolution induced problems new very high resolution (VHR) images generate additional challenges for remote sensing scene classification [65].
Selecting the appropriate learning approach for AI-driven analytics in EO-based railway infrastructure monitoring is challenging due to the inherent limitations of both supervised and unsupervised learning methods. In supervised methods, the core challenge lies in acquiring sufficiently large labeled datasets, which is especially problematic with some applications of EO-based railway infrastructure monitoring like damages listed in [30], caused by weather effects and infrastructure and earthwork failures like embankment and cutting failures, flooding, objects like fallen trees on the line, or rockslides. Furthermore, the process of dataset labeling is expensive, time-consuming, and reliant on specialized expertise. With insufficient data labels for AI models, there is a high chance of overfitting on a narrow provided sample, which is especially problematic in dynamic and heterogeneous railway infrastructure environments that demand wide coverage and frequent updates. To mitigate this, data augmentation techniques like synthetic generation of labeled samples [66] and active learning, where human analysts label only the most uncertain cases, can reduce the burden of manual dataset annotation [67]. For synthetic generation of labeled samples, new approaches based on Generative AI models, such as Generative Adversarial Networks (GANs), are proving instrumental in creating synthetic labeled datasets by learning the statistical properties of supplied real data and producing new labeled examples that closely mimic the original limited dataset [68]. Additionally, transfer learning, where models pretrained on similar monitoring problems or domains are fine-tuned with relatively few labeled examples which can extend the applicability of supervised models to new application or remote sensing technologies [15,65].
By contrast, unsupervised learning methods capitalize on unlabeled data but face challenges in extracting meaningful patterns from raw data. Even if abundant, unlabeled data still need domain-specific insight to interpret clustered or anomalous findings in a meaningful way. Noise, outliers, and dynamic and heterogeneous railway environments can hinder consistent pattern discovery, especially in SAR-gathered data. The inherent noise in SAR-acquired images [69,70] hinders the extraction of reliable information and requiring of advanced techniques to enhance data quality [71]. Furthermore, heterogeneous environment (such as varying terrain and vegetation) introduce additional challenges, as they can cause scattering and signal distortion, preventing the detection of patterns in railway infrastructure [72]. Mitigation approaches include semi-supervised learning and self-supervised learning [73]. Li et al. [74] proposed a semi-supervised approach to address imbalanced image data in rail defect detection, improving the model’s ability to identify defects with fewer labeled samples, an approach that can be leveraged to EO-based applications. While specific applications of self-supervised learning in railway infrastructure monitoring via EO-based remote sensing are still missing, in the broader field of remote sensing, self-supervised learning techniques to enhance feature extraction and change detection are emerging. Self-supervised learning has been used by Alosaimi et al. [65] to pretrain deep convolutional neural network (CNN) models on large unlabeled datasets, which are then fine-tuned with limited labeled data, demonstrating improved accuracy and generalization. Dong et al. [75] proposed a self-supervised representation learning method based on temporal prediction to improve change detection in remote sensing images, which could be adapted for EO-based railway infrastructure monitoring changes. Ghanbarzadeh et al. [76] demonstrated that self-supervised learning could enhance scene classification in remote sensing, potentially benefiting novel EO-based railway infrastructure monitoring approaches like the ones proposed in [70]. Augmenting the feature extraction process with expert-driven rules or priors can also direct unsupervised learning models toward better results. Ma et al. [77] proposed a method that incorporates fuzzy rules into deep learning architecture, enhancing interpretability and performance in image feature extraction and analysis. Barbado et al. [78] showed that extracting rules in unsupervised anomaly detection enhances the explainability and effectiveness of the AI model.
The analyzed approaches could help both supervised and unsupervised learning methods to overcome the data scarcity hurdle characteristic of EO-based railway infrastructure monitoring and achieve better generalization, showing promise that AI-driven analytics in EO-based railway infrastructure monitoring can become more reliable and scalable.

3.3. Comparing Methods in Terms of Accuracy, Efficiency (Cost) and Scalability

The need to monitor infrastructure on railway network scale brings to the forefront the use of satellite imagery, although traditional monitoring techniques, such as on-site installed sensors, despite the ability to continuously and reliably provide quality data with adequate accuracy [58], can be time-consuming, labor-intensive, and costly [21,43,53,58]. Likewise, given that railway tracks are in near-continuous use, finding a time frame for periodical geodetic measurements and inspections can be challenging [22]. In addition to offering the broadest data coverage (at network level), the highest daily productivity of over 100 km for monitoring of railway infrastructures, high temporal frequency, and data acquisition and processing benefits [79], the use of satellite optical and SAR data is also advantageous in situations where in situ measurements are in question due to technical or safety issues. In addition to multiple advantages, there are also disadvantages and limitations that accompany satellite imagery technology for specific applications in railway infrastructure monitoring. Challenges remain in achieving high temporal resolution for EO data, especially for rapid changes such as flash floods or seismic events. Furthermore, Landsat satellite imagery is inexpensive and useful at a large scale but lacks the higher spatial resolution preferred for localized investigations [80], although high-resolution commercial satellites proved higher spatial resolution [21]. As argued by Bianchini-Ciampoli et al. [53], each technology is usually suitable for a single specific application while having limited effectiveness for other applications.
However, regarding the use of satellite imagery, there is not much research or data related to validation and comparative analysis with the results obtained with other techniques. This can be attributed to the fact that it is difficult to obtain simultaneously different measurement data over long periods [43], especially in the case of long railway track sections [21]. As noted by Bernhard et al. [21], the availability of accurate validation data represents a significant challenge in using satellite measurements. In the context of railway infrastructure monitoring, only a few research studies made a comparative analysis of satellite imagery measurements with on-site measurements and GNSS. Kim et al. [43] performed a comparative analysis of the accuracy of results obtained from TerraSAR-X satellite imagery and on-site measurements in railway infrastructure deformation monitoring. The actual on-site level measurements and PS-InSAR results showed an almost identical trend, with a difference of up to 3 mm at each measurement point for final displacement values. Chang et al. [22], when comparing measurements from the TerraSAR-X satellite and measurements from a survey train over a 1 km segment, observed that the large railway track uplift area corresponds with a considerable normal subsidence. The mentioned authors concluded that satellite measurements of railway tracks can estimate displacement time series with millimeter precision. Bernhard et al. [21] used TerraSAR-X satellite data for detection of railway track anomalies. The validation of satellite measurements with chord-based measurements, as a reference (standard) method, showed that both methods yield qualitatively similar but not always identical detection results. In the conclusion, the approach based on satellite measurements for track anomaly detection was found cost-effective, while providing useful data for current state-of-the-art methods. Shami et al. [58] used Sentinel-1 imagery and the New Small Baseline Subset (NSBAS) algorithm for the assessment of ground subsidence along the railway in the Kashan plain in Iran. The results of InSAR displacement measurement time series and GPS showed high correlations. Statistical analysis of histograms showed a range of zero to a few millimeters for residual displacement (subtracting InSAR results from GPS).

3.4. Innovations: Proposals for Improvement in EO-Based Monitoring

To address the aforementioned limitations, several innovations can enhance EO-based monitoring techniques for railway infrastructure. First, leveraging hybrid models that integrate multispectral, thermal, and SAR data can provide a more comprehensive understanding of railway infrastructure conditions. Multispectral data can improve vegetation and water monitoring, while thermal data can detect anomalies in track temperature [16,19]. These hybrid approaches require advanced machine learning algorithms, such as ensemble models, to efficiently process and analyze multimodal datasets [19].
Second, improvements in satellite technology, such as the use of higher temporal resolution constellations like ICEYE and Capella Space, can mitigate the limitations of revisit times. Coupling these data with ground-based IoT sensors can bridge the gap between spatial coverage and temporal accuracy, enabling near-real-time monitoring and predictive maintenance strategies [17,26].
Third, incorporating advanced AI techniques, including deep learning and explainable AI, can enhance the accuracy and interpretability of EO data analyses. For instance, convolutional neural networks (CNNs) trained on high-resolution SAR and optical images can improve anomaly detection in deformation monitoring. Additionally, integrating data fusion techniques that downscale coarser resolution thermal data to finer spatial resolutions can address gaps in temperature monitoring for railway tracks [27]. Large models recently released, such as the Segment Anything Model (SAM) by Meta AI [81], are used for image segmentation to assist in the task of feature extraction without additional training. Dong et al. [75] proposed the SAMUnet model, a dual-branch semantic segmentation network with the fusion of large models, to address safety hazards from floating objects during train operations in high-speed rail networks. Using two publicly available datasets, the model’s effectiveness was validated. It effectively extracts hazards (roof buildings, dust nets, farm mulch) in high-speed railway environments, improving semantic segmentation accuracy.
Finally, fostering collaborations between satellite data providers and railway infrastructure managers can lower the cost barriers associated with high-resolution commercial data, promoting widespread adoption of EO-based monitoring solutions.

4. Discussion and Outlook

4.1. Meta-Analysis of Publications

To review research studies related to railway infrastructure monitoring using EO data, literature from multiple databases such as Web of Science, Scopus, Google Scholar, and IEEE was searched. The search was conducted using some specific keywords and their combinations, such as “railway infrastructure”, “monitoring”, “Earth Observation”, “satellite imagery”, “remote sensing”, “SAR”. Likewise, through a detailed reference screening of the reviewed studies, additional research studies were identified and included in the review. In total, thirty-four English language publications were identified relevant for the present review, out of which thirty-one were published in international journals and three at international conferences in the time period from 2005 to 2025. For the purpose of review from each research study, some relevant information was extracted, such as authors, date of publication, authors’ country, specific application of Earth Observation data, type of satellite data used, satellite used, performed evaluation/testing/validation tests, and test site.
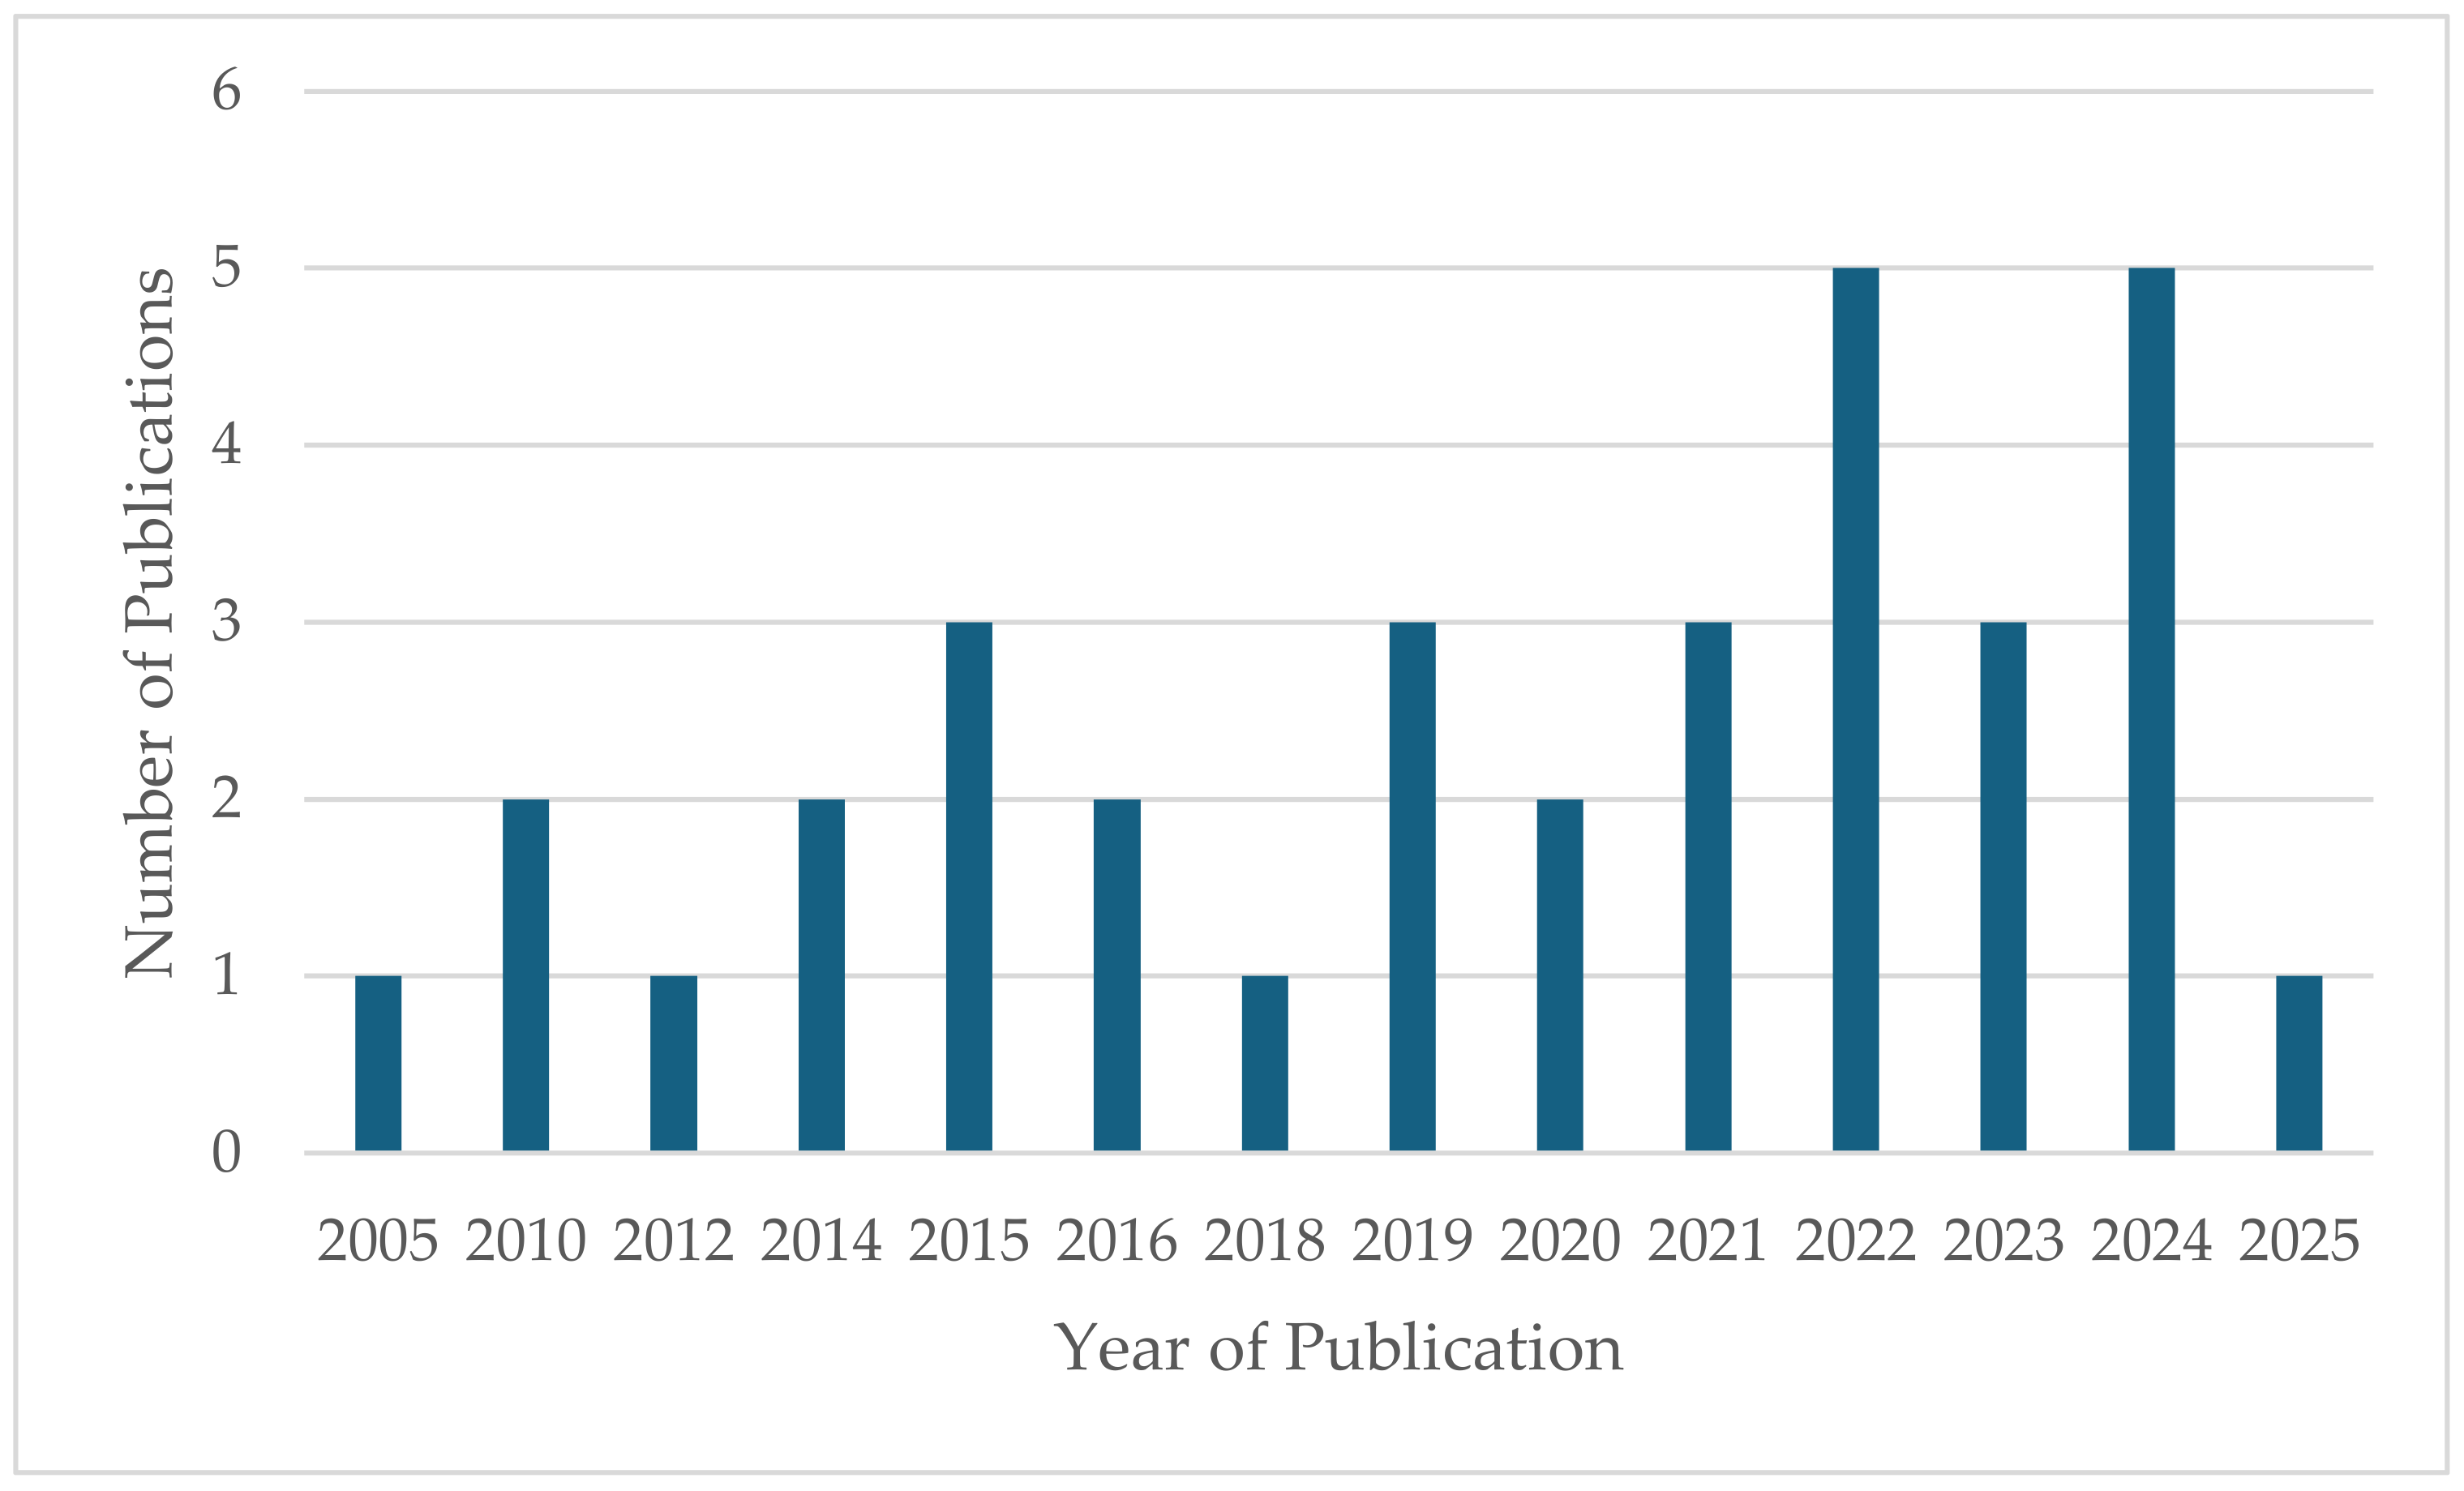
Figure 3 illustrates the chronological sequence of the reviewed publications. Most publications appeared recently, from 2019 onward. 2022 and 2024 both accounted for 14.7% of the publications.
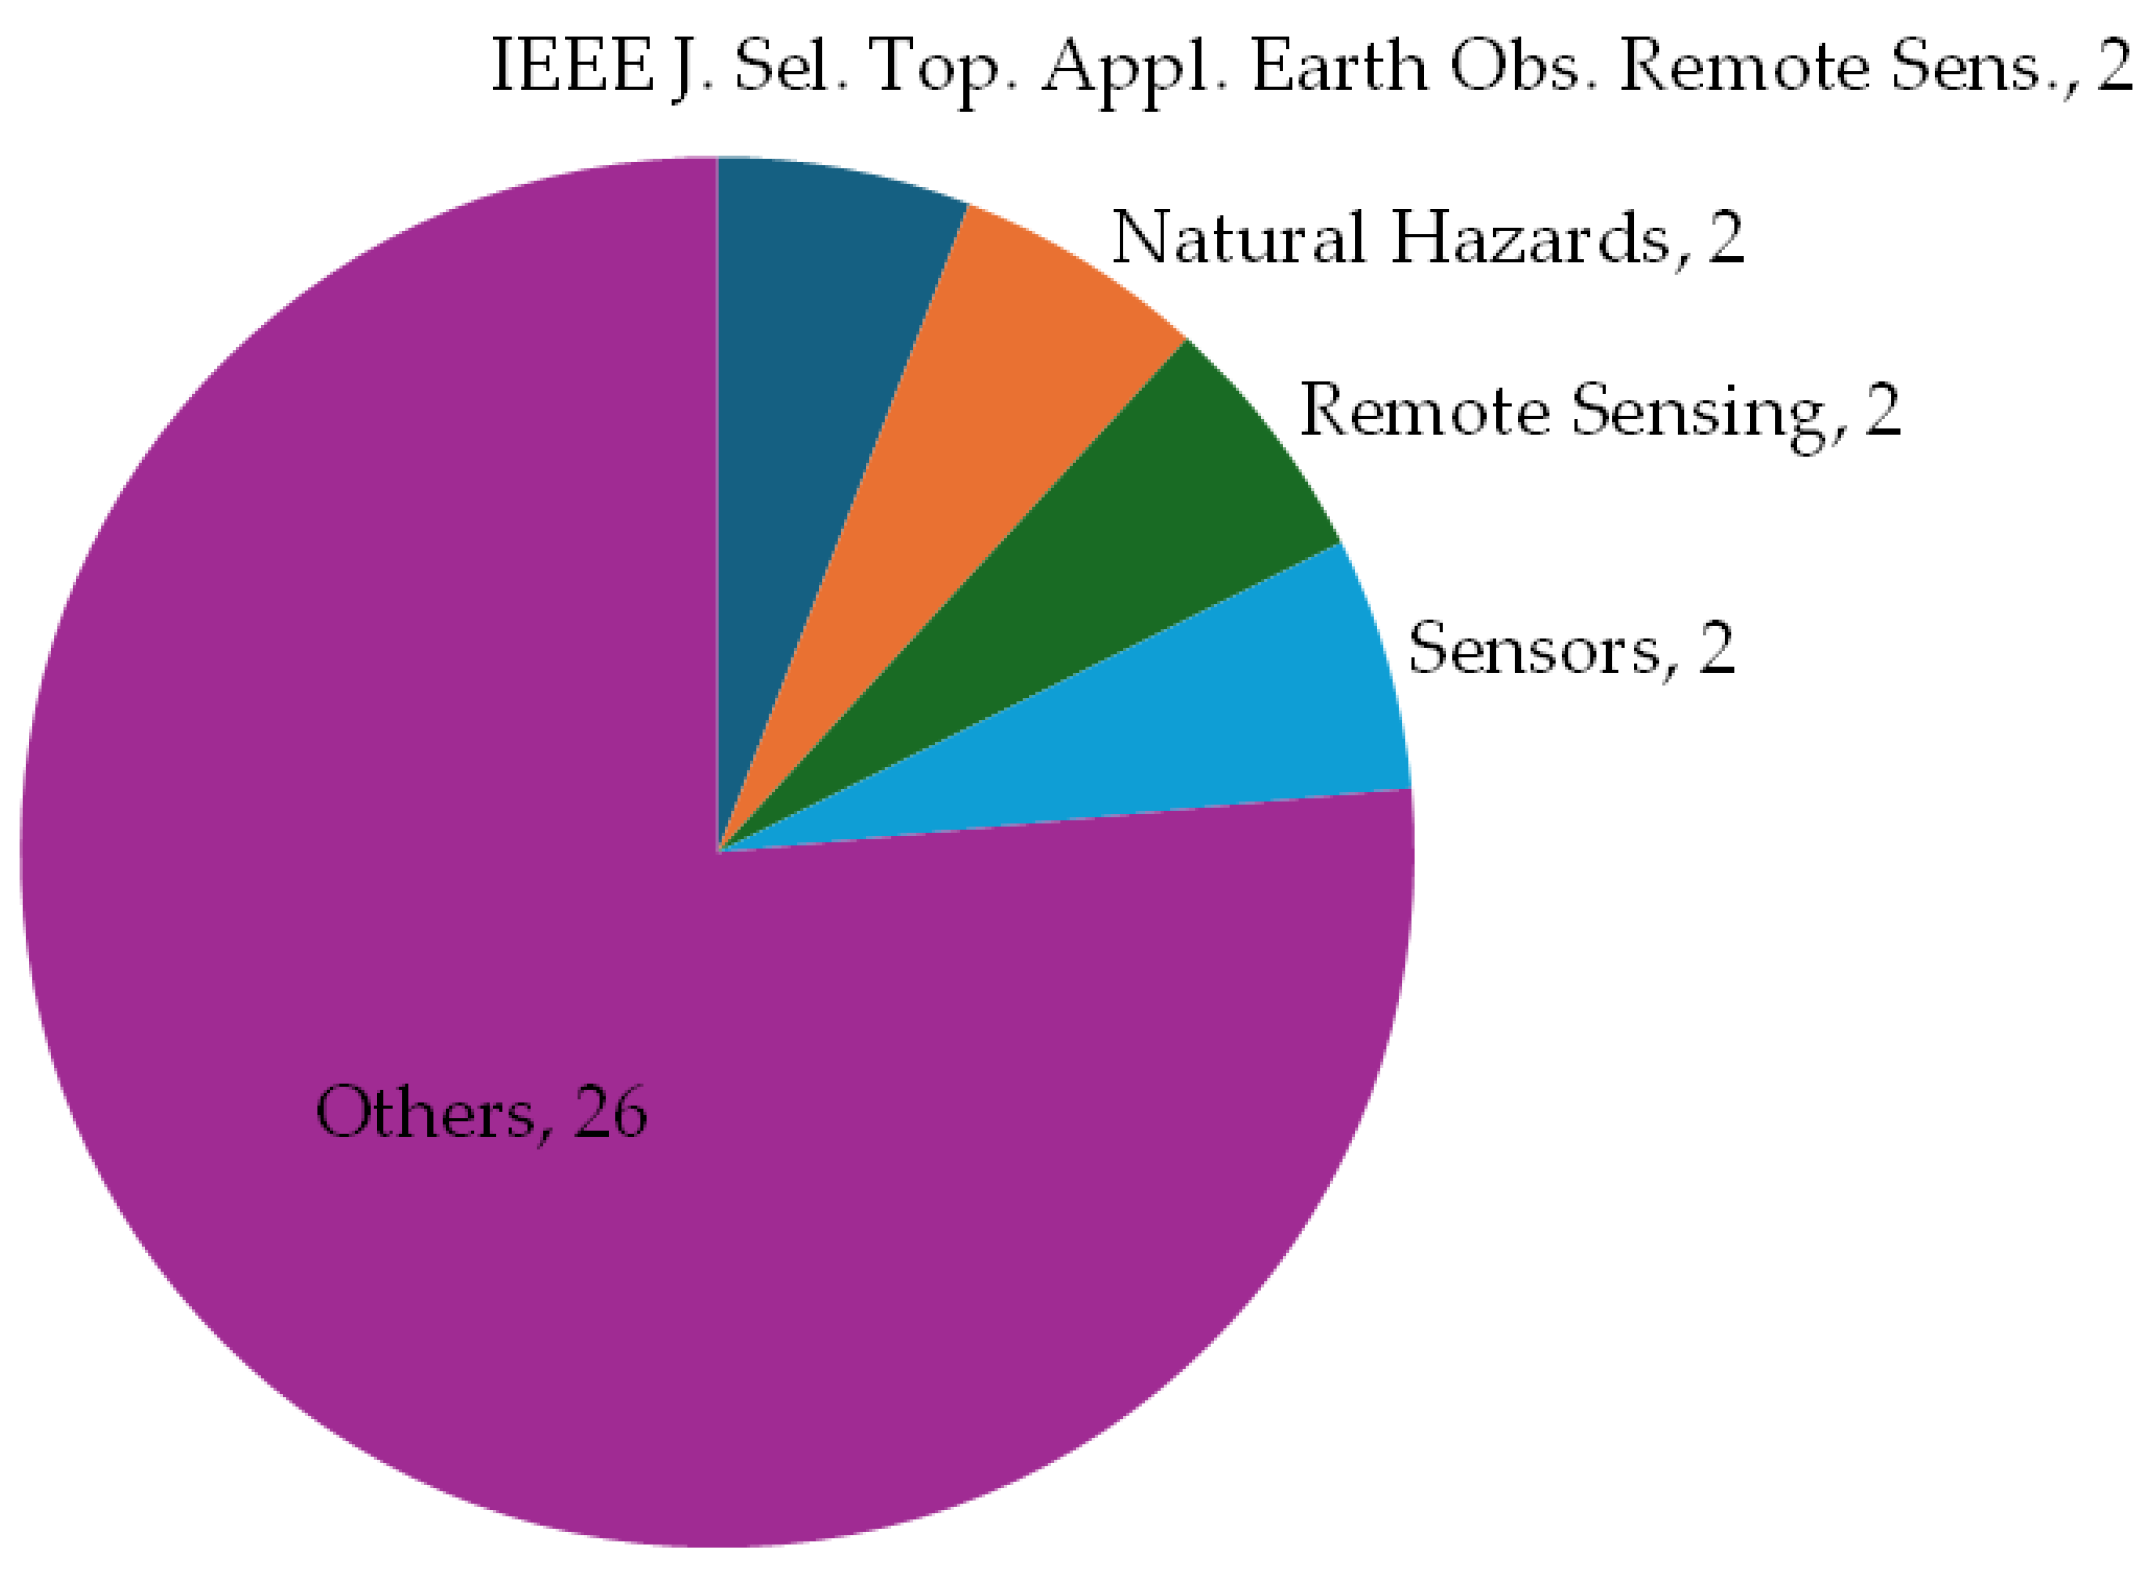
The set of 34 reviewed publications were distributed across 27 different international journals and three international conference proceedings (Figure 4). IEEE Journal of Selected Topics in Applied Earth Observations and Remote Sensing, Natural Hazards, Remote Sensing, and Sensors contained most of the reviewed publications, with two appearing in each. The remaining international journals and international conference proceedings were jointly labeled “Others”.
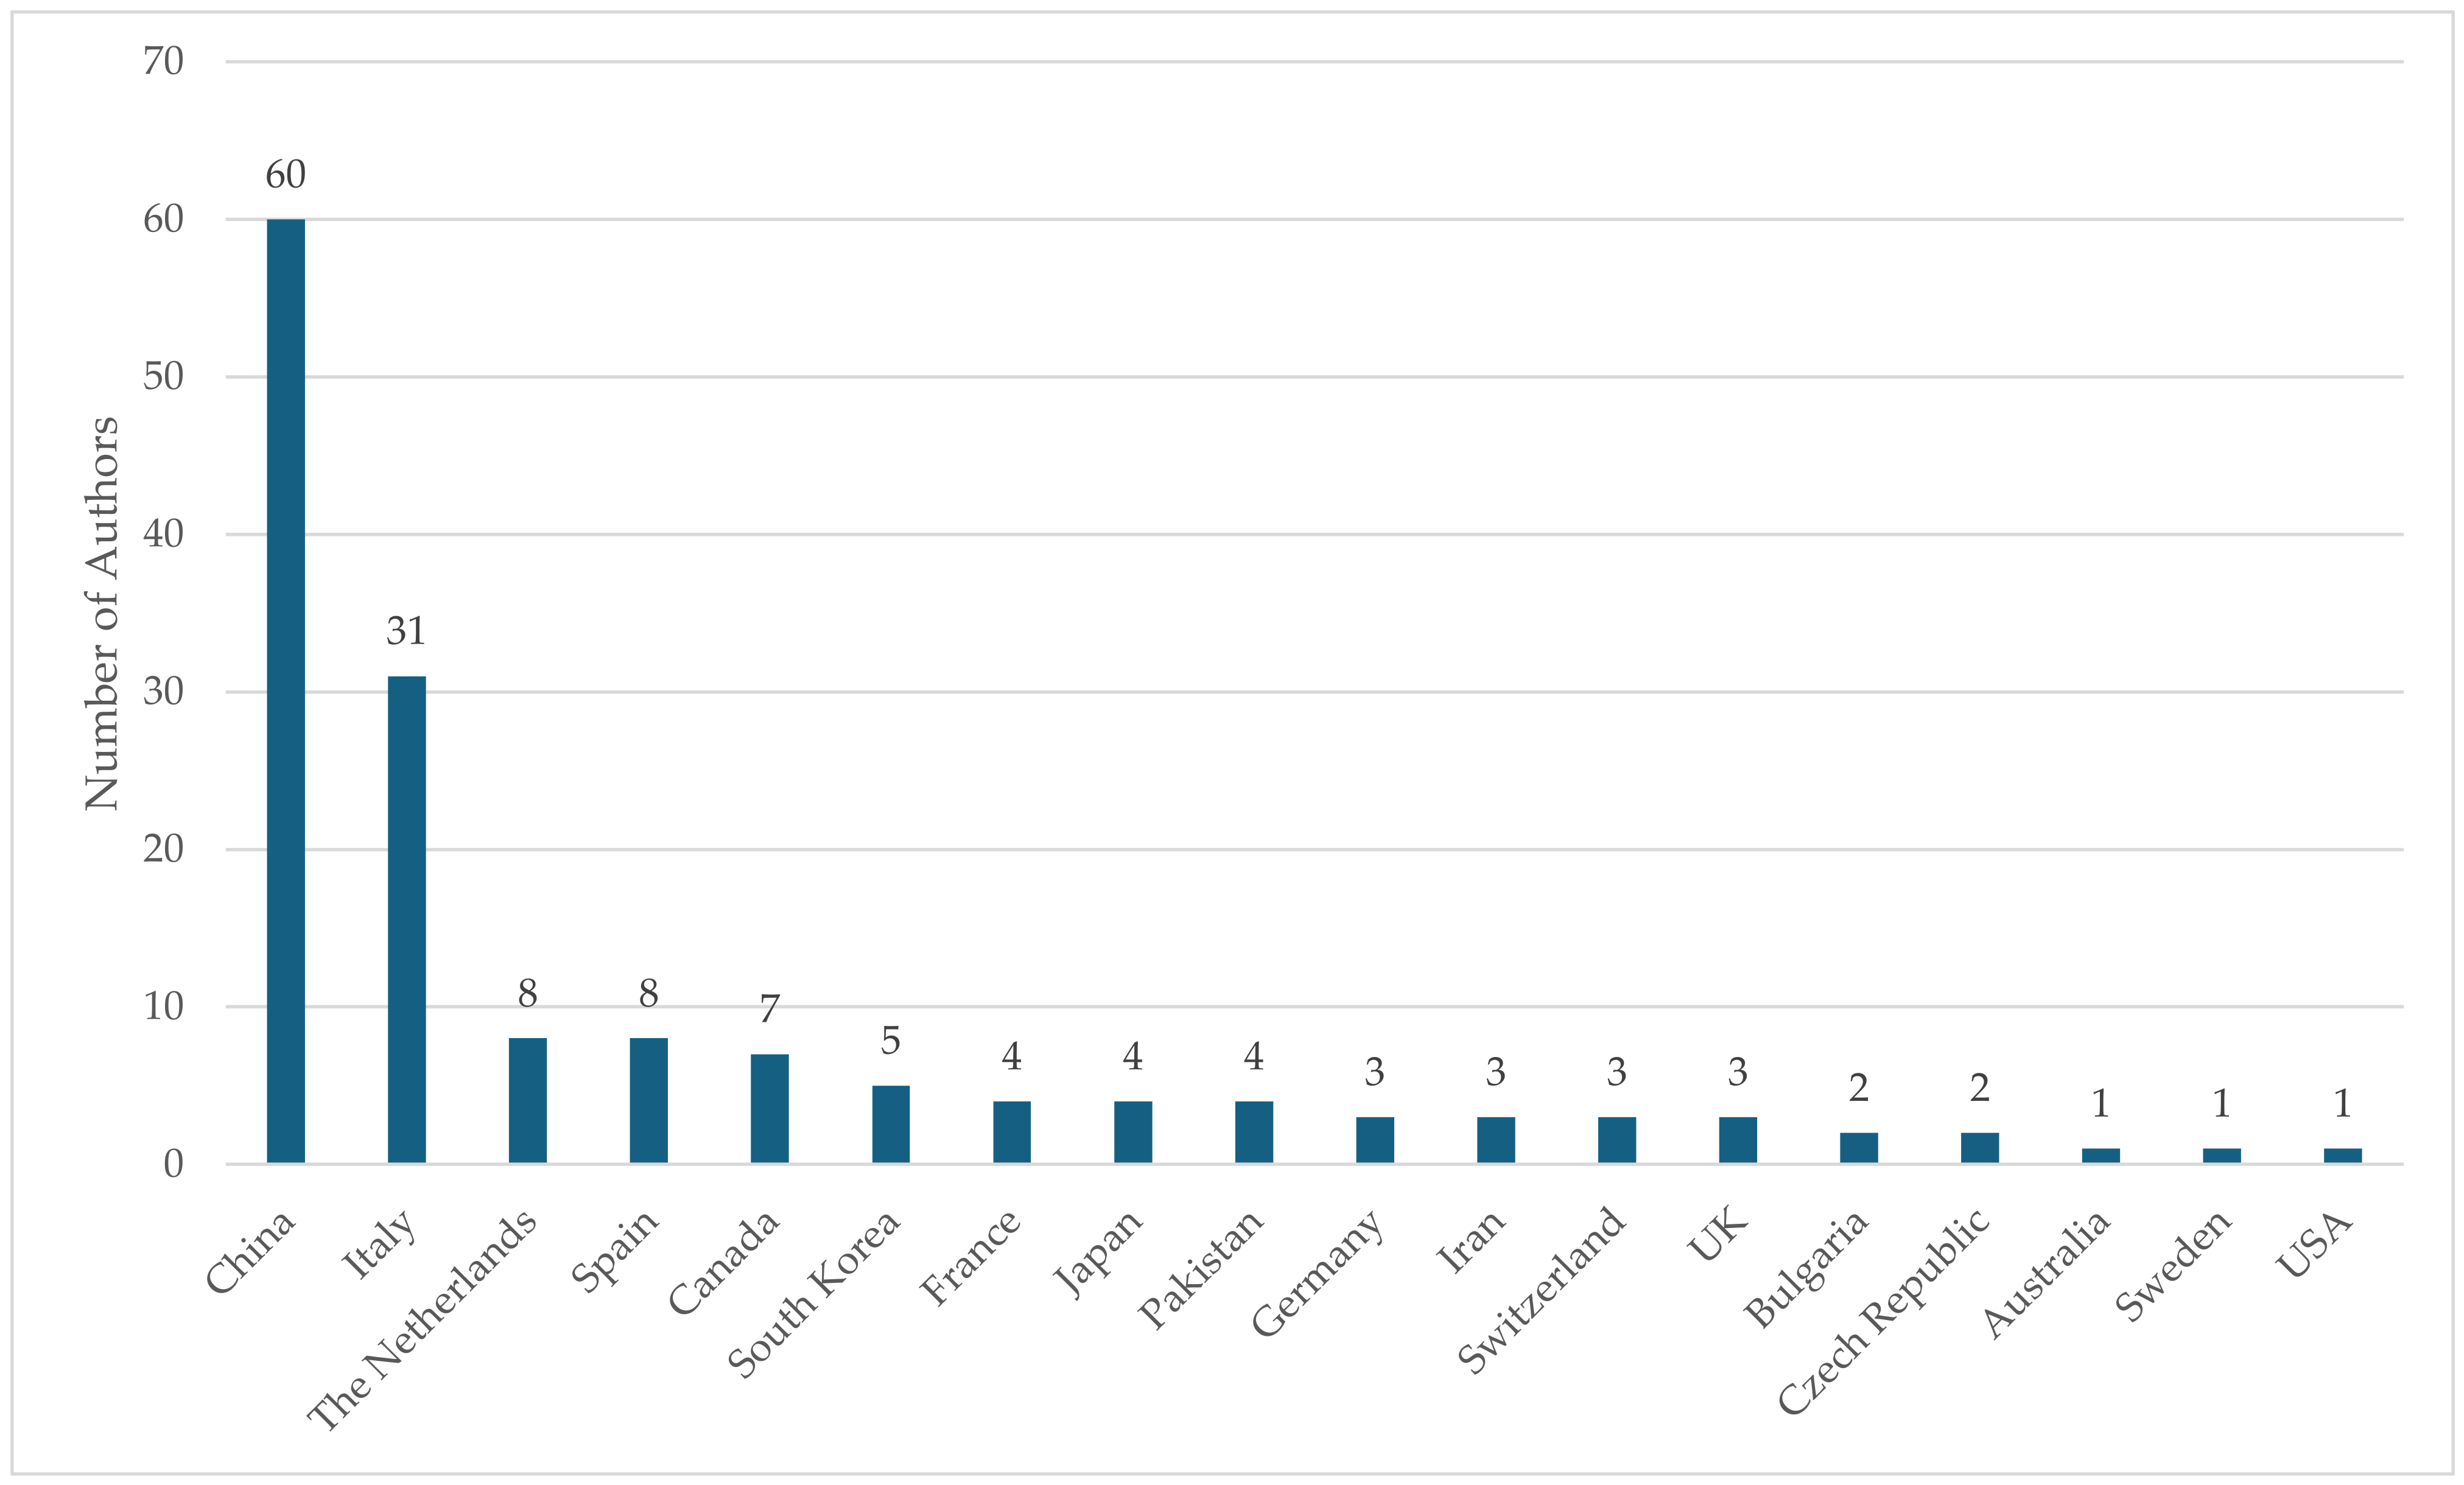
Figure 5 shows the country for the authors of the reviewed publications, based on their affiliations. China is significantly ahead of other countries with sixty authors, followed by Italy with thirty-one, The Netherlands with eight, Spain with eight, and Canada with seven. Authors from remaining 13 countries represented 24% of the total authorship. China and Italy alone accounted for 60.67% of the authorship, with China dominating at 40%.
Figure 6 shows the number of publications by year of publication split by the use cases. In some of the reviewed publications, the authors examined two or three use cases. Monitoring of ground deformation (GD) was the most-examined use case with 40% share, followed by monitoring of rail track deformations (TD) with 20%. Monitoring of railway bridges (B) and water level around the rail track (WL) were the least-examined use cases with 10% and 5% share, respectively.

4.2. Current Trends and Challenges in Satellite Data Utilization for Railway Monitoring

As already mentioned in the Introduction, and as confirmed with the above-presented overview of the literature, the published related results in using satellite data for railway infrastructure monitoring mainly consider using SAR data, and only a few publications consider using optical satellite data. A possible reason for this situation is that non-commercial optical data are not of sufficient resolution, so only commercial data can provide the needed high resolution. Such data, however, due to their price, are mainly not available for research. Another possible reason is that novel developments are created for commercial services, so there are no publications about them apart from some information on the websites of the related companies. For example, the company LiveEO [82] has developed management tools to view year-round vegetation conditions on railway assets using the Sentinel-2 optical data to calculate vegetation indices for vegetation monitoring, combined with commercial data, e.g., optical high-resolution satellite imagery from Planet Labs and Airbus. The satellite data are analyzed using advanced AI.
This situation of not-broadly available literature about the use of different satellite data types could be overcome by publishing results in some related ongoing projects funded by the EU (Horizon)/EUSPA (European Union Agency for the Space Programme).
For example, the authors are involved in the project SPATRA: Space-based Applications for Transport Monitoring and Management [62], within which, satellite-based monitoring of railway infrastructure with a particular focus on an EO-based system for rail track temperature estimation is under development. SPATRA EO-based system aims to enhance cost-effectiveness and expand monitoring capabilities by overcoming the limitations of established state-of-the-art methods for monitoring the rail tracks’ temperature by local in situ sensors or predicting the rail temperature based on meteorological data. The main goal of monitoring the rail track temperatures is to detect zones critically exposed to extreme temperatures as well as for targeted intervention to prevent and mitigate the risk of disruption. The SPATRA system is based on novel use of the satellite thermal data and advanced image processing and machine learning techniques such as random forest algorithms to downscale Land Surface Temperature (LST) data from coarser resolutions (1–5 km) to an acceptable resolution of 30 m or finer. Specifically, the approximate daily LST product from the Sentinel-3 mission with 1 km spatial resolution is combined with the hourly LST product from MSG geostationary satellites (provided by the Copernicus Global Land Monitoring Service), paying the price of 5 km spatial resolution, to form a sufficient data basis for the proposed application, as it can face the monitoring of rail tracks in large areas. Since Sentinel-3 produces its LST product daily, the heat profile index map can be updated daily, and its calculation can be based on a predefined number of consecutive past days (e.g., 10 days). However, the above-mentioned possible spatial resolution of sub-daily imagery Sentinel 3 LST -MSG is not sufficient for rail temperature monitoring purposes. To overcome this issue, data fusion of temporally high-resolution thermal imagery with spatially high-resolution data (Sentinel-2 or Landsat 8/9) is performed. For this purpose, machine learning approaches such as random forest or statistical regression downscaling procedures that have been successfully applied in previous research activities using environmental parameters from Sentinel-2 and other non-Copernicus missions (e.g., Landsat 8/9 and MODIS) are used. Hence, the goal is to develop downscaling models for Sentinel 3-MSG LST data to 1 km spatial resolution or for Sentinel-3 LST 1 km to 150 m and lower as of 30 m if found appropriate/needed.
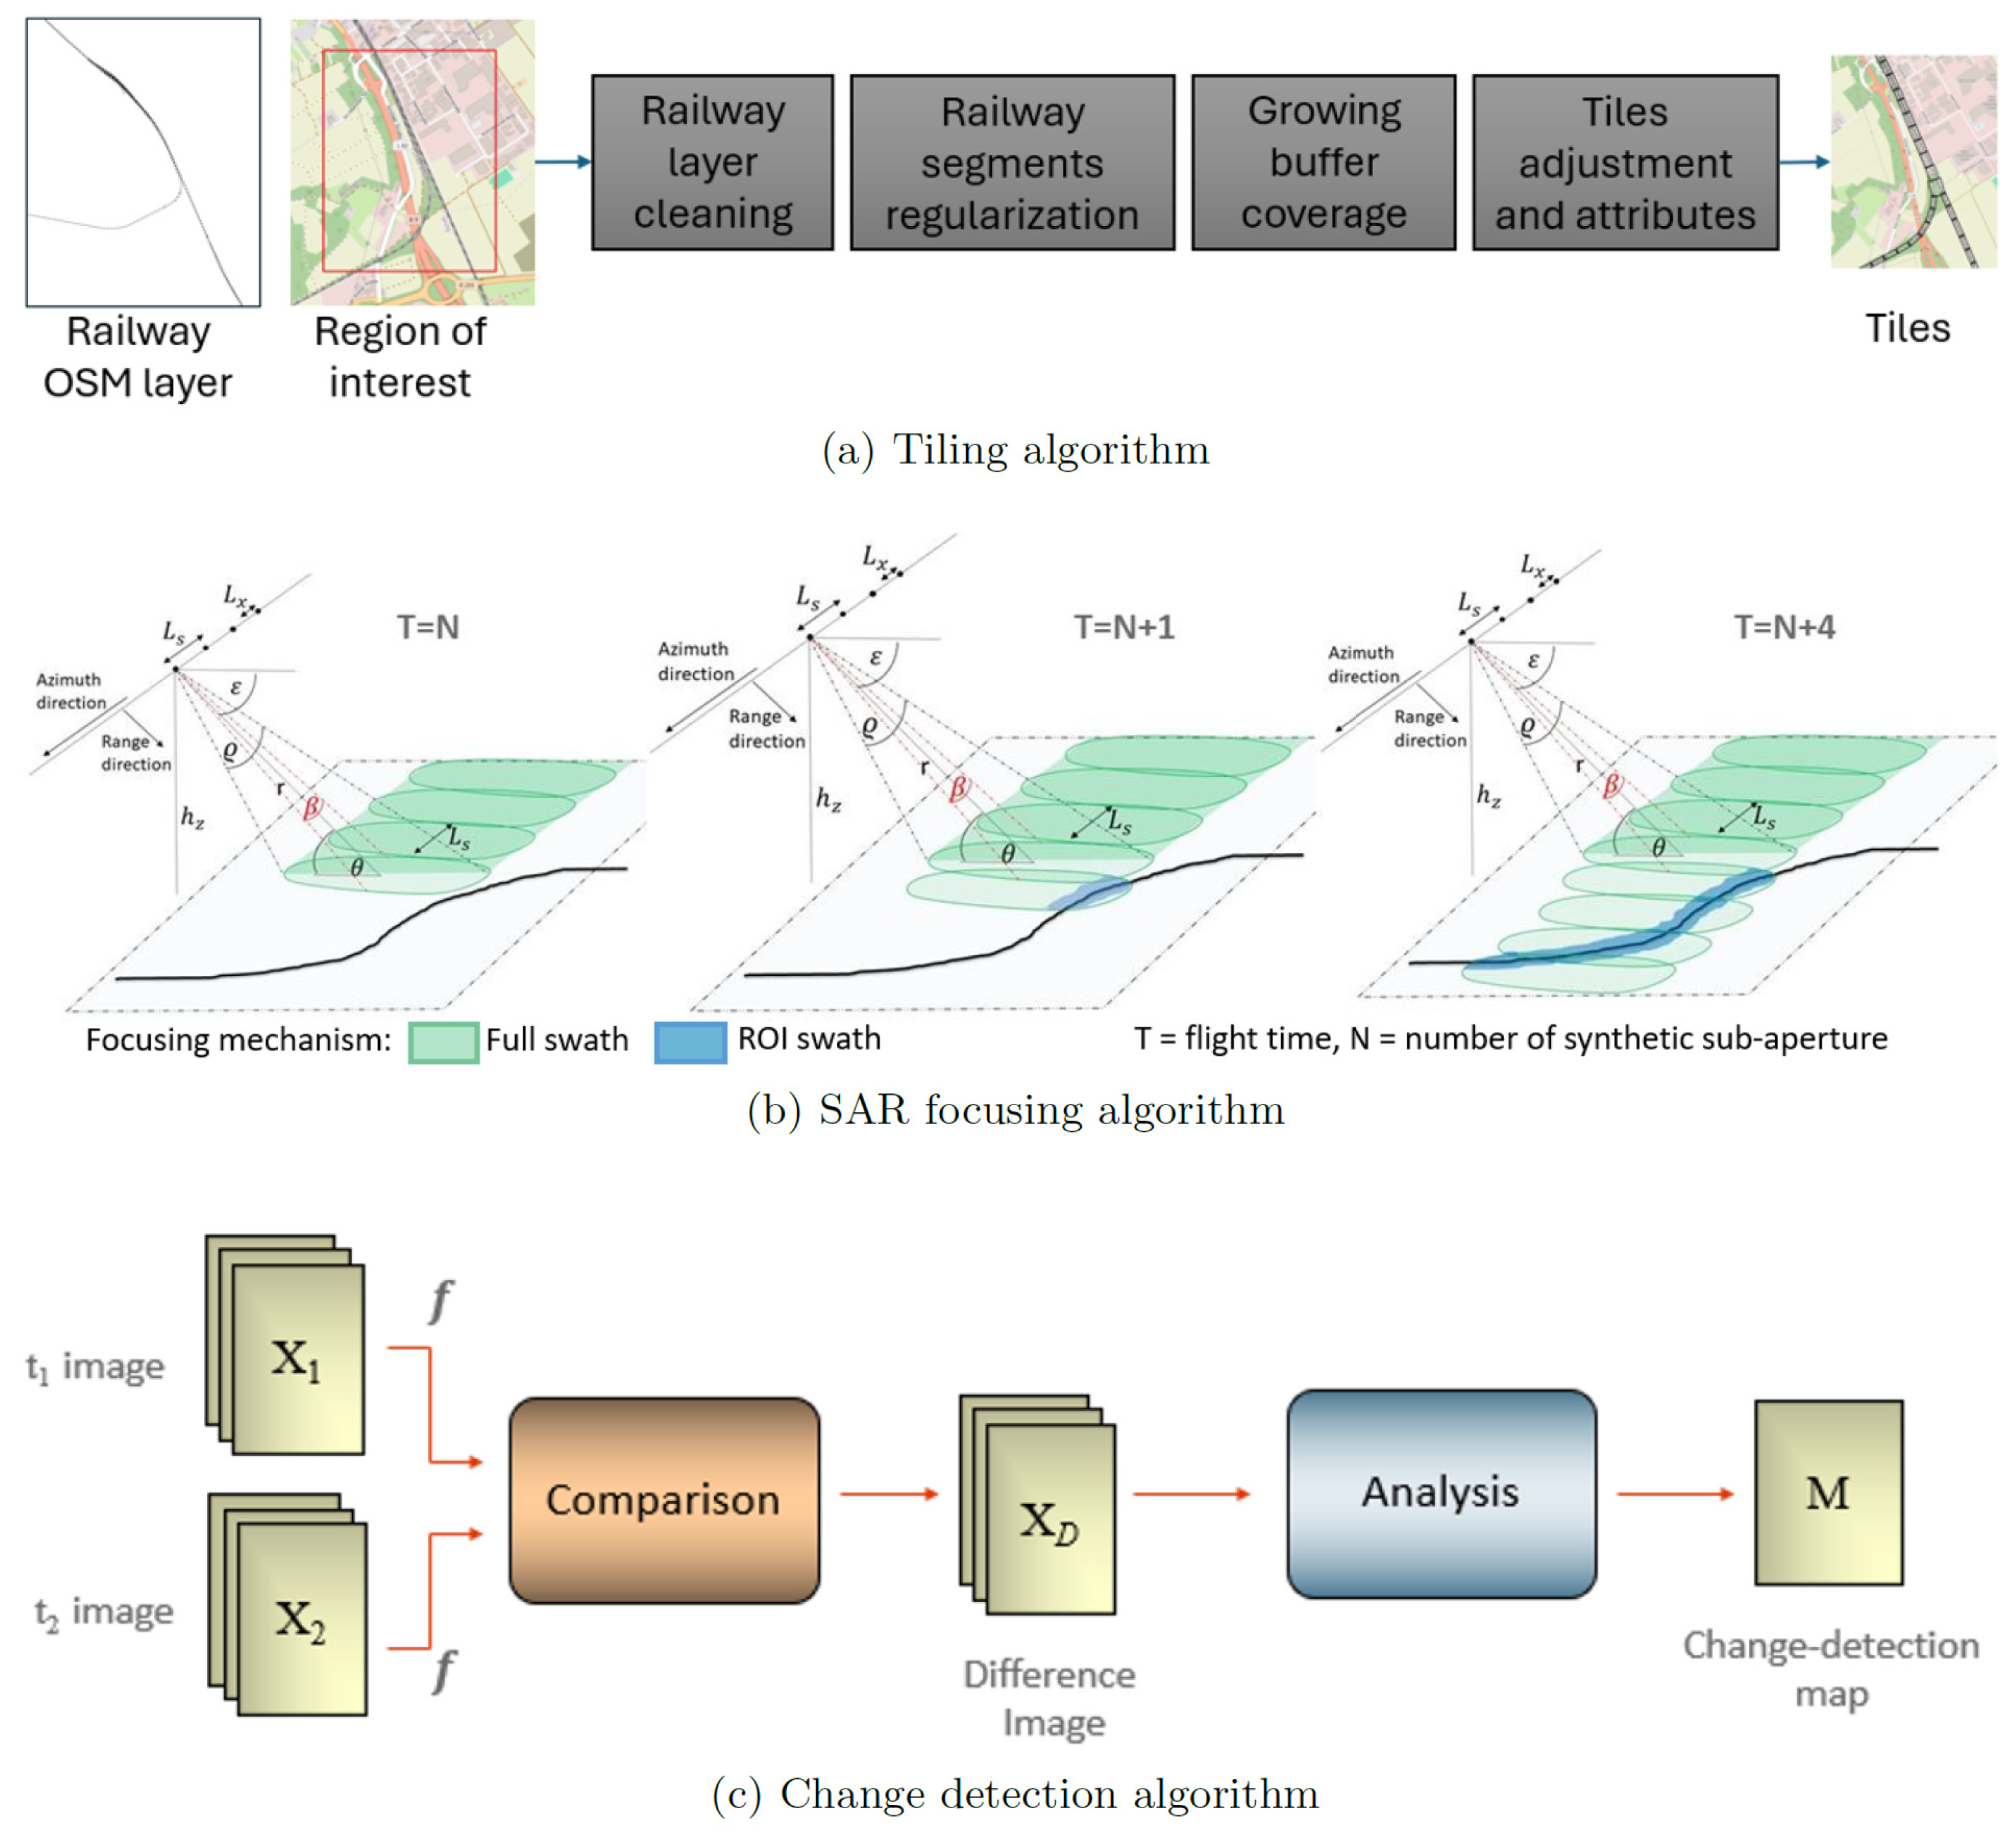
Besides the above-described SPATRA project that promotes the novel use of satellite thermal data for railway infrastructure monitoring, the authors are also involved in further ongoing projects that promote the novel use of already-established SAR data. Namely, in the framework of the Horizon-Europe project “Instantaneous Infrastructure Monitoring by Earth Observation (IIMEO)” [83], the objective is to design, implement, and demonstrate key technological factors of a future satellite-based Earth Observation (EO) system capable of providing functions necessary for instantaneous monitoring of railway infrastructures in near-real time. The system will implement a tiled acquisition of multitemporal SAR images over a railway infrastructure and perform near-real-time change–obstacle detection at every new acquisition within one hour after the satellite passes over the area by implementation of the change detection algorithm [70], as shown on Figure 7. The tiling procedure presented in the noted paper, as well development of new on-board processing hardware [83], enables near instantaneous obtaining of results, which enables new use cases for EO-based railway infrastructure monitoring.
The authors believe that the above-mentioned research and innovation projects SPATRA and IIMEO, as well as other related projects, will contribute to raising awareness of IM and RU for the benefits of using different satellite data for railway infrastructure monitoring so that satellite data will be broadly used by the key stakeholders in the future. In parallel, further development of satellite technologies, as well as AI methods for processing satellite data, will contribute to the further development of different satellite-based services that could contribute to railway transport safety and resilience.

4.3. Future Directions

Future research and technological advancements in Earth Observation (EO) for railway infrastructure monitoring are crucial to overcoming existing limitations. One promising direction involves the integration of EO data with Internet of Things (IoT) sensor networks, providing real-time monitoring and enhancing data precision. The combination of high-resolution satellite imagery with ground-based data will enable predictive analytics, allowing infrastructure managers to anticipate and mitigate risks proactively.
Another key area is the development of hybrid data processing models, incorporating multispectral, thermal, and synthetic aperture radar (SAR) data. This fusion of diverse data types can deliver a comprehensive view of railway systems, improving applications like vegetation management, water level monitoring, and thermal [84] and deformation analysis [85]. The application of advanced artificial intelligence (AI) techniques, including deep learning and explainable AI, is expected to refine anomaly detection and predictive maintenance. It is worth mentioning and considering in future research that recent studies have highlighted the use of advanced technologies like “cradle-to-cradle” life cycle assessments and “cradle-to-gate” analyses for railway infrastructure, promoting environmental sustainability alongside operational efficiency [86,87,88,89].
Additionally, efforts should focus on addressing the cost barriers of high-resolution commercial data by fostering collaborations between satellite providers and stakeholders. The use of emerging satellite constellations, like ICEYE and Capella Space, can improve temporal resolution and ensure near-real-time monitoring capabilities. Enhanced algorithms for downscaling data resolution and managing atmospheric interference will also play a critical role in achieving operational efficiency. Such methodologies could significantly benefit the monitoring of railway sub-ballast layers [90,91] and the assessment of speed distribution heterogeneity on rural road segments, which have been explored using innovative non-parametric similarity measures and other novel approaches [88,89,92].
As railway infrastructure faces increasing challenges from climate change and urbanization, integrating these innovations will position EO technology as an indispensable tool for ensuring the safety, sustainability, and reliability of railway networks.

4.4. Technological Implications

The adoption of EO-based monitoring systems introduces significant technological implications for railway infrastructure management. Advanced SAR technologies, such as persistent scatterer interferometry (PSI) and differential InSAR, offer unparalleled accuracy in detecting structural deformations. By providing millimeter-scale resolution, these tools enable infrastructure managers to identify potential issues before they escalate into critical failures.
Multispectral and thermal imaging data further enhance monitoring capabilities. For example, vegetation health assessments and flood risk analyses can be performed with higher precision, reducing operational disruptions caused by environmental factors. The integration of thermal data also enables the detection of heat-induced rail track deformations, an essential factor in maintaining safety during extreme weather conditions.
The emergence of AI-powered analytics marks a transformative shift, enabling real-time processing of large EO datasets. Convolutional neural networks (CNNs) and other machine learning techniques can detect subtle anomalies and predict failure patterns with high reliability. However, the reliance on these advanced systems necessitates significant computational resources and expertise, highlighting the need for capacity-building initiatives within railway management organizations.
Finally, the technological implications extend to the democratization of satellite data access. Collaborations between public and private entities can reduce costs and increase the availability of high-resolution data. These partnerships will enable smaller operators to adopt EO-based solutions, fostering widespread implementation and enhancing the overall resilience of global railway infrastructure.

5. Conclusions

The integration of Earth Observation (EO) technologies in railway infrastructure monitoring represents a paradigm shift, transforming how railway networks are assessed, maintained, and managed. By leveraging a broad spectrum of EO tools such as synthetic aperture radar (SAR), optical imaging, and multispectral data, this study underscores their potential to enhance precision, safety, and efficiency in railway operations.
EO technologies enable unparalleled monitoring capabilities. SAR systems provide millimeter-level accuracy in detecting structural deformations, identifying risks such as ground subsidence, track misalignments, and bridge displacements before they escalate into critical issues. Optical and multispectral imaging expand this capability, offering detailed insights into vegetation health, water levels, and thermal anomalies affecting railway stability. These advanced tools ensure a comprehensive, real-time overview of infrastructure health, reducing reliance on labor-intensive and localized conventional methods.
Despite these significant advancements, several challenges remain. Limitations in data resolution, revisit frequencies, and integration with real-time monitoring systems hinder the full realization of EO’s potential. For instance, while high-resolution optical data deliver exceptional detail, their prohibitive cost and susceptibility to weather interference limit large-scale applications. Moreover, the lack of robust frameworks to integrate EO data with in situ measurements and IoT systems restricts predictive capabilities and real-time responsiveness.
To overcome these challenges, innovations such as hybrid models combining SAR, multispectral and thermal data, AI-driven analytics, and advanced downscaling techniques are essential. Emerging satellite constellations, like ICEYE and Capella Space, promise higher temporal resolution, enabling more responsive monitoring solutions. Collaborative efforts between satellite data providers, infrastructure managers, and policymakers are crucial to reducing costs and promoting widespread adoption of EO-based systems.
This study also highlights the transformative potential of ongoing initiatives like SPATRA and IIMEO. These projects exemplify how cutting-edge applications of EO data can deliver targeted, actionable insights, enhancing the sustainability, safety, and resilience of railway systems. SPATRA’s focus on satellite-based thermal monitoring and IIMEO’s aim to develop near-real-time SAR systems are pivotal in addressing current limitations and pioneering future advancements in the field.
In light of increasing urbanization, climate change impacts, and the growing complexity of global railway networks, EO technologies are no longer optional but a necessity. Their ability to provide detailed, timely, and scalable solutions makes them indispensable for the future of railway infrastructure monitoring. As technology evolves, the integration of EO systems with AI, IoT, and other emerging technologies will redefine operational efficiency and environmental sustainability in railway management.
By bridging existing gaps and fostering innovation, EO technologies hold the potential to revolutionize the railway sector, ensuring that it remains resilient, efficient, and adaptable in a rapidly changing world.

Author Contributions

Conceptualization, M.B., D.R.-D., M.M., A.K., M.T. and M.S.; methodology, M.B., D.R.-D., M.M., A.K., M.T. and M.S.; software, M.B., D.R.-D., M.M., A.K., M.T. and M.S.; validation, M.B., D.R.-D., M.M., A.K., M.T. and M.S.; formal analysis, M.B., D.R.-D., M.M., A.K., M.T., M.S. and S.F.; investigation, M.B., D.R.-D., M.M., A.K., M.T., M.S. and S.F.; resources, M.B., D.R.-D., M.M., A.K., M.T. and M.S.; data curation, M.B., D.R.-D., M.M., A.K., M.T. and M.S.; writing—original draft preparation, M.B., D.R.-D., M.M., A.K., M.T., M.S. and S.F.; writing—review and editing, M.B., D.R.-D., M.M., A.K., M.T., M.S. and S.F.; visualization, M.B., D.R.-D., M.M., A.K., M.T., M.S. and S.F.; supervision, M.B., D.R.-D., M.M., A.K., M.T., M.S. and S.F.; project administration, M.B., D.R.-D., M.M., A.K., M.T. and M.S.; funding acquisition, M.B., D.R.-D., M.M., A.K., M.T. and M.S. All authors have read and agreed to the published version of the manuscript.

Funding

The presented research received funding from the European Union’s Horizon Europe research and innovation program under grants No. 101129658 and No. 101082410. The program has not supported the APC financing.

Data Availability Statement

Not applicable.

Acknowledgments

The authors thank the technical support and help of the research team entitled “SZE-RAIL” at the Széchenyi István University, Győr, Hungary.

Conflicts of Interest

Author Danijela Ristic-Durrant and Alina Klapper were employed by the company OHB Digital Services GmbH. The remaining authors declare that the research was conducted in the absence of any commercial or financial relationships that could be construed as a potential conflict of interest.

Abbreviations

AIArtificial Intelligence
ALOSAdvanced Land Observing Satellite
ASARAdvanced Synthetic Aperture Radar
COTSCommercial Off-The-Shelf
CNNConvolutional Neural Network
DInSARDifferential Interferometric Synthetic Aperture Radar
EOEarth Observation
ESAEuropean Space Agency
GNSSGlobal Navigation Satellite System
GPSGlobal Positioning System
IoTInternet of Things
InSARInterferometric Synthetic Aperture Radar
LiDARLight Detection and Ranging
LOSLine of Sight
LSTLand Surface Temperature
MODISModerate Resolution Imaging Spectroradiometer
MSGMeteosat Second Generation
MT-InSARMulti-Temporal Interferometric Synthetic Aperture Radar
NDMINormalized Difference Moisture Index
NDVINormalized Difference Vegetation Index
PS-InSARPersistent Scatterer Interferometric Synthetic Aperture Radar
PSIPersistent Scatterer Interferometry
RCMRadarsat Constellation Mission
SARSynthetic Aperture Radar
TZTransition Zones
UASUnmanned Aerial System
VTIRVegetation Threat Index for Railways

References

  1. Kljaić, Z.; Pavković, D.; Cipek, M.; Trstenjak, M.; Mlinarić, T.J.; Nikšić, M. An overview of current challenges and emerging technologies to facilitate increased energy efficiency, safety, and sustainability of railway transport. Future Internet 2023, 15, 347. [Google Scholar] [CrossRef]
  2. Di Summa, M.; Griseta, M.E.; Mosca, N.; Patruno, C.; Nitti, M.; Renò, V.; Stella, E. A review on deep learning techniques for railway infrastructure monitoring. IEEE Access 2023, 11, 114638–114661. [Google Scholar] [CrossRef]
  3. Ezsias, L.; Brautigam, A.; Szurke, S.K.; Szalai, S.; Fischer, S. Sustainability in railways—A review. Chem. Eng. Trans. 2023, 107, 7–12. [Google Scholar]
  4. Bianchi, G.; Fanelli, C.; Freddi, F.; Giuliani, F.; La Placa, A. Systematic review railway infrastructure monitoring: From classic techniques to predictive maintenance. Adv. Mech. Eng. 2025, 17, 16878132241285631. [Google Scholar] [CrossRef]
  5. Mosleh, A.; Ribeiro, D.; Malekjafarian, A.; Martínez-Rodrigo, M.D. Advances in Condition Monitoring of Railway Infrastructure. Sensors 2024, 24, 830. [Google Scholar] [CrossRef]
  6. De Miguel, G.; Goya, J.; Fernandez, N.; Arrizabalaga, S.; Mendizabal, J.; Adin, I. Map-Aided Software Enhancement for Autonomous GNSS Complementary Positioning System for Railway. IEEE Trans. Veh. Technol. 2019, 68, 11611–11620. [Google Scholar] [CrossRef]
  7. Marais, J.; Beugin, J.; Berbineau, M. A Survey of GNSS-Based Research and Developments for the European Railway Signaling. IEEE Trans. Intell. Transport. Syst. 2017, 18, 2602–2618. [Google Scholar] [CrossRef]
  8. Chrzan, M.; Ciszewski, T.; Nowakowski, W. Selected applications of satellite technologies in rail transport. AoT 2024, 71, 91–105. [Google Scholar] [CrossRef]
  9. Project STARS: Satellite Technology for Advanced Rail Signalling. Available online: https://www.stars-rail.eu/wp-content/uploads/2016/04/STARS-leaflet_Final_WEB.pdf (accessed on 25 November 2024).
  10. EO & GNSS Market Report. Available online: https://www.euspa.europa.eu/publications-multimedia/publications/eo-gnss-market-report (accessed on 1 March 2025).
  11. Piter, A.; Haghshenas Haghighi, M.; Motagh, M. Challenges and Opportunities of Sentinel-1 InSAR for Transport Infrastructure Monitoring. PFG 2024, 92, 609–627. [Google Scholar] [CrossRef]
  12. Jones, A.; Killough, B.; Johnston, N. Insights from Earth Observation Data Can Optimise Rail Operation. Available online: https://www.ey.com/en_au/insights/space-tech/how-insights-from-earth-observation-data-can-optimise-rail-operations (accessed on 25 November 2024).
  13. Song, Y.; Wu, P. Earth Observation for Sustainable Infrastructure: A Review. Remote Sens. 2021, 13, 1528. [Google Scholar] [CrossRef]
  14. Gagliardi, V.; Tosti, F.; Bianchini Ciampoli, L.; Battagliere, M.L.; D’Amato, L.; Alani, A.M.; Benedetto, A. Satellite Remote Sensing and Non-Destructive Testing Methods for Transport Infrastructure Monitoring: Advances, Challenges and Perspectives. Remote Sens. 2023, 15, 418. [Google Scholar] [CrossRef]
  15. Helmi, W.; Bridgelall, R.; Askarzadeh, T. Remote Sensing and Machine Learning for Safer Railways: A Review. Appl. Sci. 2024, 14, 3573. [Google Scholar] [CrossRef]
  16. Arroyo-Mora, J.; Kalacska, M.; Roghani, A.; Lucanus, O. Assessment of UAS Photogrammetry and Planet Imagery for Monitoring Water Levels around Railway Tracks. Drones 2023, 7, 553. [Google Scholar] [CrossRef]
  17. Roghani, A.; Mammeri, A.; Siddiqui, A.J.; Abdulrazagh, P.H.; Hendry, M.T.; Pulisci, R.M.; Canadian Rail Research, L. Using emerging technologies for monitoring surface water near railway tracks. In Proceedings of the Canadian & Cold Regions Rail Research Conference 2021 (CCRC 2021), Online, 9–10 November 2021; pp. 106–114. [Google Scholar]
  18. Wang, H.; Chang, L.; Markine, V. Structural Health Monitoring of Railway Transition Zones Using Satellite Radar Data. Sensors 2018, 18, 413. [Google Scholar] [CrossRef]
  19. Cusson, D.; Rossi, C.; Ozkan, I.F. Early warning system for the detection of unexpected bridge displacements from radar satellite data. J. Civ. Struct. Health Monit. 2021, 11, 189–204. [Google Scholar] [CrossRef]
  20. Atanasova-Zlatareva, M.; Nikolov, H. Establishing Surface Displacements along a Railway Route near Mirovo Salt Deposit, NE Bulgaria. In Proceedings of the 8th International Conference on Geographical Information Systems Theory, Applications and Management, Online, 26–28 April 2022; pp. 155–162. [Google Scholar]
  21. Bernhard, P.; Haener, D.; Frey, O. Detection of Railway Track Anomalies Using Interferometric Time Series of TerraSAR-X Satellite Radar Data. IEEE J. Sel. Top. Appl. Earth Obs. Remote Sens. 2024, 17, 11750–11760. [Google Scholar] [CrossRef]
  22. Chang, L.; Dollevoet, R.; Hanssen, R.F. Railway Infrastructure Monitoring using Satellite Radar Data. Int. J. Railw. Technol. 2014, 3, 79–91. [Google Scholar] [CrossRef]
  23. Artagan, S.S.; Bianchini Ciampoli, L.; D’Amico, F.; Calvi, A.; Tosti, F. Non-destructive assessment and health monitoring of railway infrastructures. Surv. Geophys. 2020, 41, 447–483. [Google Scholar] [CrossRef]
  24. Sasi, D.; Philip, S.; David, R.; Swathi, J. A review on structural health monitoring of railroad track structures using fiber optic sensors. Mater. Today Proc. 2020, 33, 3787–3793. [Google Scholar] [CrossRef]
  25. Benedetti, L.; Argentino, A.; Bernardini, L.; Radicioni, L.; Bono, F.M.; Somaschini, C.; Cazzulani, G.; Belloli, M. A three-year project on Structural Health Monitoring of railway bridges: Main results and lessons learnt. e-J. Nondestruct. Test. 2024, 29, 29796. [Google Scholar] [CrossRef]
  26. Chang, L.; Dollevoet, R.P.B.J.; Hanssen, R.F. Nationwide Railway Monitoring Using Satellite SAR Interferometry. IEEE J. Sel. Top. Appl. Earth Obs. Remote Sens. 2017, 10, 596–604. [Google Scholar] [CrossRef]
  27. Chang, L.; Sakpal, N.P.; Elberink, S.O.; Wang, H. Railway Infrastructure Classification and Instability Identification Using Sentinel-1 SAR and Laser Scanning Data. Sensors 2020, 20, 7108. [Google Scholar] [CrossRef] [PubMed]
  28. Machan, G.; Bennett, V.G. Use of inclinometers for geotechnical instrumentation on transportation projects: State of the practice. Transp. Res. Circ. 2008, E-C129, 01112776. [Google Scholar]
  29. Buzaboon, Y.; Aouad, M.; Mohamed, H. Structural Settlement Monitoring Using GPS and Conventional Terrestrial Surveying Methods. Appl. Math. 2024, 18, 909–914. [Google Scholar]
  30. Palic, S.S.; Stipanovic, I.; Gavin, K. D1.1: Report on Global Safety KPIs. Available online: https://projects.shift2rail.org/s2r_ipcc_n.aspx?p=GOSAFE_RAIL (accessed on 28 February 2025).
  31. Rizzo, P.; Enshaeian, A. Challenges in bridge health monitoring: A review. Sensors 2021, 21, 4336. [Google Scholar] [CrossRef]
  32. Zhou, L.; Li, X.; Pan, Y.; Ma, J.; Wang, C.; Shi, A.; Chen, Y. Deformation monitoring of long-span railway bridges based on SBAS-InSAR technology. Geod. Geodyn. 2024, 15, 122–132. [Google Scholar] [CrossRef]
  33. Guinard, S.A.; Riant, J.-P.; Michelin, J.-C.; Costa D’Aguiar, S. Fast Weakly Supervised Detection of Railway-Related Infrastructures in Lidar Acquisitions. ISPRS Ann. Photogramm. Remote Sens. Spat. Inf. Sci. 2021, 2, 27–34. [Google Scholar] [CrossRef]
  34. Kučera, M.; Dobesova, Z. Analysis of the Degree of Threat to Railway Infrastructure by Falling Tree Vegetation. IJGI 2021, 10, 292. [Google Scholar] [CrossRef]
  35. Onody, A.-S.; Bah, F.; Boum, M.-A.; Duval, G. Use of satellite imagery to categorize vegetation on the French railway network (SNCF Réseau). Transp. Res. Procedia 2023, 72, 1451–1458. [Google Scholar] [CrossRef]
  36. De Ruvo, P.; De Ruvo, G.; Distante, A.; Nitti, M.; Stella, E.; Marino, F. A visual inspection system for rail detection &; tracking in real time railway maintenance. Open Cybern. Syst. J. 2008, 2, 57–67. [Google Scholar]
  37. American Public Transportation Association. Rail Transit Track Inspection and Maintenance; APTA: Alexandria, VA, USA, 2017. [Google Scholar]
  38. Chen, B.; Gong, H.; Chen, Y.; Lei, K.; Zhou, C.; Si, Y.; Li, X.; Pan, Y.; Gao, M. Investigating land subsidence and its causes along Beijing high-speed railway using multi-platform InSAR and a maximum entropy model. Int. J. Appl. Earth Obs. Geoinf. 2021, 96, 102284. [Google Scholar] [CrossRef]
  39. Damm, A.; Hostert, P.; Schiefer, S. Investigating urban railway corridors with geometric high resolution satellite data. Urban Remote Sens. 2005, 5. Available online: https://www.ugpti.org/smartse/research/citations/downloads/Damm-Urban_Railway_Monitoring-2005.pdf (accessed on 23 January 2025).
  40. Hu, F.; Leijen, F.J.V.; Chang, L.; Wu, J.; Hanssen, R.F. Monitoring Deformation along Railway Systems Combining Multi-Temporal InSAR and LiDAR Data. Remote Sens. 2019, 11, 2298. [Google Scholar] [CrossRef]
  41. Galve, J.P.; Castañeda, C.; Gutiérrez, F. Railway deformation detected by DInSAR over active sinkholes in the Ebro Valley evaporite karst, Spain. Nat. Hazards Earth Syst. Sci. 2015, 15, 2439–2448. [Google Scholar] [CrossRef]
  42. Geshi, S. Disaster Damage Detection and Its Recovery Support System of Road and Railroad Using Satellite Images. Int. Arch. Photogramm. Remote Sens. Spat. Inf. Sci. 2010, XXXVIII, 314–319. [Google Scholar]
  43. Kim, B.-K.; Kim, W.; Lee, C.; Yoo, M.; Lee, I. Validating Railway Infrastructure Deformation Monitoring: A Comparative Analysis of Field Data and TerraSAR-X PS-InSAR Results. KSCE J. Civ. Civil Eng. 2024, 28, 1777–1786. [Google Scholar] [CrossRef]
  44. Pigorini, A.; Ricci, M.; Sciotti, A.; Giannico, C.; Tamburini, A. Satellite remote-sensing PSInSAR™ technique applied to design and construction of railway infrastructures. IF 2010, 65, 10. [Google Scholar]
  45. Polcari, M. Anthropogenic subsidence along railway and road infrastructures in Northern Italy highlighted by Cosmo-SkyMed satellite data. J. Appl. Remote Sens. 2019, 13, 1. [Google Scholar] [CrossRef]
  46. Tan, Q.; Chou, X.; Xiao, X. Analysis of Railway Subgrade Settlement Deformation in Permafrost Regions Based on Satellite Interferometry. Sens. Transducers 2014, 168, 260–267. [Google Scholar]
  47. Javed, A.; Qazi, K.A.; Maqsood, M.; Shah, K.A. Efficient algorithm for railway tracks detection using satellite imagery. Int. J. Image Graph. Signal Process. 2012, 4, 34. [Google Scholar] [CrossRef]
  48. Fedeli, E.; Iacobini, F.; Mungiello, I.; Cadavero, G.; D’Avino, D.; Tavano, F.; Agostino, I.; Meuti, S. Supervision of Railway Areas by Satellite Images. In Proceedings of the IRSC 2022 International Railway Safety Council, Sevilla, Spain, 16–21 October 2022. [Google Scholar]
  49. Chang, L.; Hanssen, R.F. Detection of permafrost sensitivity of the Qinghai–Tibet railway using satellite radar interferometry. Int. J. Remote Sens. 2015, 36, 691–700. [Google Scholar] [CrossRef]
  50. Lyu, B.; Liu, B.; Xie, B.; Xiao, H.; Liu, X.; Zhang, Z.; Li, Y.; Huang, X.; Shi, F. Study on InSAR deformation information extraction and stress state assessment in a railway tunnel in a plateau area. Front. Earth Sci. 2024, 12, 1367978. [Google Scholar] [CrossRef]
  51. Zhu, M.; Liu, H.; Miao, C.; Li, G.; Zhang, Y.; Zhou, Y.; Cai, J.; Yang, S.; Wang, Y.; Wang, Y. Safety assessment of the Qinghai–Tibet railway: Monitoring, analysis, and prediction. Cold Reg. Sci. Technol. 2025, 231, 104395. [Google Scholar] [CrossRef]
  52. Tong, X.; Hong, Z.; Liu, S.; Chen, P.; Jin, Y.; Xie, H.; Liu, S.; Zhang, S.; Feng, T. Detection of geometric change in railway curves caused by earthquakes, using high-resolution stereo satellite images. Nat. Hazards 2015, 79, 409–436. [Google Scholar] [CrossRef]
  53. Bianchini Ciampoli, L.; Gagliardi, V.; Clementini, C.; Latini, D.; Del Frate, F.; Benedetto, A. Transport infrastructure monitoring by InSAR and GPR data fusion. Surv. Geophys. 2020, 41, 371–394. [Google Scholar] [CrossRef]
  54. Zhang, Z.; Wu, X.; Li, Y.; Yan, K.; Zhang, F.; Yang, S.; Yang, J. Monitoring environment transformation along the BTIC railway based on remote sensing by utilizing the R_RSEI. Photogramm. Eng. Remote Sens. 2022, 88, 517–525. [Google Scholar] [CrossRef]
  55. Zhou, L.; Wei, B.; Ma, J.; Qin, J.; Luo, H.; Huang, Y.; Li, X.; Huang, C. Monitoring and analysis of side-slope deformation along Changgan high-speed railway based on time-series InSAR and BDS techniques. Nat. Hazards 2024, 120, 13469–13491. [Google Scholar] [CrossRef]
  56. Tosti, F.; Gagliardi, V.; D’Amico, F.; Alani, A.M. Transport infrastructure monitoring by data fusion of GPR and SAR imagery information. Transp. Res. Procedia 2020, 45, 771–778. [Google Scholar] [CrossRef]
  57. Wassie, Y.; Gao, Q.; Monserrat, O.; Barra, A.; Crippa, B.; Crosetto, M. Differential SAR interferometry for the monitoring of land subsidence along railway infrastructures. Int. Arch. Photogramm. Remote Sens. Spat. Inf. Sci. 2022, 43, 361–366. [Google Scholar] [CrossRef]
  58. Shami, S.; Azar, M.K.; Nilfouroushan, F.; Salimi, M.; Reshadi, M.A.M. Assessments of ground subsidence along the railway in the Kashan plain, Iran, using Sentinel-1 data and NSBAS algorithm. Int. J. Appl. Earth Obs. Geoinf. 2022, 112, 102898. [Google Scholar] [CrossRef]
  59. Poreh, D.; Iodice, A.; Riccio, D.; Ruello, G. Railways’ stability observed in Campania (Italy) by InSAR data. Eur. J. Remote Sens. 2016, 49, 417–431. [Google Scholar] [CrossRef]
  60. Dindar, S.; Kaewunruen, S.; Osman, M.H. Review on Feasibility of using satellite imaging for risk management of derailment related turnout component failures. IOP Conf. Ser. Mater. Sci. Eng. 2017, 245, 042025. [Google Scholar] [CrossRef]
  61. Ivashov, S.I.; Tataraidze, A.B.; Razevig, V.V.; Smirnova, E.S. Railway transport infrastructure monitoring by UAVs and satellites. J. Transp. Technol. 2019, 9, 342–353. [Google Scholar] [CrossRef]
  62. Project SPATRA. Available online: https://spatra-project.eu/ (accessed on 25 November 2024).
  63. Cheng, G.; Han, J.; Lu, X. Remote sensing image scene classification: Benchmark and state of the art. Proc. IEEE 2017, 105, 1865–1883. [Google Scholar] [CrossRef]
  64. Liu, H.; Qian, Y.; Zhong, X.; Chen, L.; Yang, G. Research on super-resolution reconstruction of remote sensing images: A comprehensive review. Opt. Eng. 2021, 60, 100901. [Google Scholar] [CrossRef]
  65. Alosaimi, N.; Alhichri, H.; Bazi, Y.; Ben Youssef, B.; Alajlan, N. Self-supervised learning for remote sensing scene classification under the few shot scenario. Sci. Rep. 2023, 13, 433. [Google Scholar] [CrossRef]
  66. Mumuni, A.; Mumuni, F.; Kobina Gerrar, N. A survey of synthetic data augmentation methods in computer vision. arXiv 2024, arXiv:2403.10075. [Google Scholar] [CrossRef]
  67. Vina, A. Active Learning Speeds Up Computer Vision Development. Available online: https://www.ultralytics.com/blog/active-learning-speeds-up-computer-vision-development?utm_source=chatgpt.com (accessed on 26 February 2025).
  68. Xu, A.; Vasileva, M.I.; Dave, A.; Seshadri, A. HandsOff: Labeled Dataset Generation With No Additional Human Annotations. arXiv 2022, arXiv:2212.12645. [Google Scholar] [CrossRef]
  69. Wei, S.; Ma, X.; Qu, F.; Wang, J.; Liang, T.; Chen, D. Research on SAR image denoising method based on feature extraction. Electron. Lett. 2024, 60, e13180. [Google Scholar] [CrossRef]
  70. Zanetti, M.; Palm, S.; Bovolo, F. Instantaneous infrastructure monitoring by Earth observation: SAR-based railway obstacle detection. In Proceedings of the Artificial Intelligence and Image and Signal Processing for Remote Sensing XXX, Edinburgh, UK, 16–19 September 2024; p. 38. [Google Scholar]
  71. Choi, H.; Jeong, J. Speckle Noise Reduction Technique for SAR Images Using Statistical Characteristics of Speckle Noise and Discrete Wavelet Transform. Remote Sens. 2019, 11, 1184. [Google Scholar] [CrossRef]
  72. Wang, C.; Yin, Z.; Ma, X.; Yang, Z. SAR Image Despeckling Based on Block-Matching and Noise-Referenced Deep Learning Method. Remote Sens. 2022, 14, 931. [Google Scholar] [CrossRef]
  73. Wang, Y.; Albrecht, C.M.; Braham, N.A.A.; Mou, L.; Zhu, X.X. Self-supervised learning in remote sensing: A review. IEEE Geosci. Remote Sens. Mag. 2022, 10, 213–247. [Google Scholar] [CrossRef]
  74. Li, Q.; Peng, Q.; Liu, R.; Liu, L.; Bai, L. Track grid health index for grid-based, data-driven railway track health evaluation. Adv. Mech. Eng. 2019, 11, 1687814019889768. [Google Scholar] [CrossRef]
  75. Dong, H.; Ma, W.; Wu, Y.; Zhang, J.; Jiao, L. Self-Supervised Representation Learning for Remote Sensing Image Change Detection Based on Temporal Prediction. Remote Sens. 2020, 12, 1868. [Google Scholar] [CrossRef]
  76. Ghanbarzadeh, A.; Soleimani, H. Self-supervised in-domain representation learning for remote sensing image scene classification. Heliyon 2024, 10, e37962. [Google Scholar] [CrossRef]
  77. Ma, X.; Chen, L.; Deng, Z.; Xu, P.; Yan, Q.; Choi, K.-S.; Wang, S. Deep image feature learning with fuzzy rules. arXiv 2019, arXiv:1905.10575. [Google Scholar] [CrossRef]
  78. Barbado, A.; Corcho, Ó.; Benjamins, R. Rule extraction in unsupervised anomaly detection for model explainability: Application to OneClass SVM. Expert Syst. Appl. 2022, 189, 116100. [Google Scholar] [CrossRef]
  79. Ferrante, C.; Bianchini Ciampoli, L.; Benedetto, A.; Alani, A.M.; Tosti, F. Non-destructive technologies for sustainable assessment and monitoring of railway infrastructure: A focus on GPR and InSAR methods. Environ. Earth Sci. 2021, 80, 806. [Google Scholar] [CrossRef]
  80. Hummel, S.; Hudak, A.; Uebler, E.; Falkowski, M.; Megown, K. A comparison of accuracy and cost of LiDAR versus stand exam data for landscape management on the Malheur National Forest. J. For. 2011, 109, 267–273. [Google Scholar] [CrossRef]
  81. Kirillov, A.; Mintun, E.; Ravi, N.; Mao, H.; Rolland, C.; Gustafson, L.; Xiao, T.; Whitehead, S.; Berg, A.C.; Lo, W.-Y. Segment anything. In Proceedings of the IEEE/CVF international conference on computer vision, Paris, France, 1–6 October 2023; pp. 4015–4026. [Google Scholar]
  82. LiveEO. Available online: https://www.live-eo.com/ (accessed on 25 November 2024).
  83. Project IIMEO. Available online: https://ohb-theo.de/iimeo-project/ (accessed on 2 February 2025).
  84. Fischer, S.; Harangozó, D.; Németh, D.; Kocsis, B.; Sysyn, M.; Kurhan, D.; Brautigam, A. Investigation of Heat-Affected Zones of Thermite Rail Weldings. FU Mech. Eng. 2024, 22, 689–710. [Google Scholar] [CrossRef]
  85. Ristic-Durrant, D.; Klapper, A.; Kuhn, D.; Banić, M.; Madić, M.; Simonović, M.; Trifunović, M.; Trajković, A. Novel use of EO satellite data and AI in railways: A concept for rail buckling risk estimation in the SPATRA Project. In Proceedings of the 6th International Workshop on “Artificial Intelligence for RAILwayS” co-located with EDCC 2025, Lisbon, Portugal, 8 April 2025. [Google Scholar]
  86. Fiore, N.; Bruno, S.; Del Serrone, G.; Iacobini, F.; Giorgi, G.; Rinaldi, A.; Moretti, L.; Duranti, G.M.; Peluso, P.; Vita, L.; et al. Experimental Analysis of Hot-Mix Asphalt (HMA) Mixtures with Reclaimed Asphalt Pavement (RAP) in Railway Sub-Ballast. Materials 2023, 16, 1335. [Google Scholar] [CrossRef] [PubMed]
  87. Del Serrone, G.; Riccio, G.; Moretti, L. Cradle-to-cradle life cycle assessment of railway prestressed concrete sleepers: A state-of-the-art review and strategies for reducing environmental impacts. Resour. Conserv. Recycl. 2025, 214, 108020. [Google Scholar] [CrossRef]
  88. Del Serrone, G.; Loprencipe, G.; Riccio, G.; Moretti, L. Analisi “dalla culla al cancello con opzioni” di traverse ferroviarie in calcestruzzo. IF 2024, 79, 293–307. [Google Scholar] [CrossRef]
  89. Cantisani, G.; Del Serrone, G.; Mauro, R.; Peluso, P.; Pompigna, A. From Radar Sensor to Floating Car Data: Evaluating Speed Distribution Heterogeneity on Rural Road Segments Using Non-Parametric Similarity Measures. Sci 2024, 6, 52. [Google Scholar] [CrossRef]
  90. Ézsiás, L.; Tompa, R.; Fischer, S. Investigation of the Possible Correlations between Specific Characteristics of Crushed Stone Aggregates. Spec. Mech. Eng. Oper. Res. 2024, 1, 10–26. [Google Scholar] [CrossRef]
  91. Fischer, S. Investigation of the Settlement Behavior of Ballasted Railway Tracks Due to Dynamic Loading. Spec. Mech. Eng. Oper. Res. 2025, 2, 24–46. [Google Scholar] [CrossRef]
  92. Fischer, S.; Kocsis Szürke, S. Detection Process of Energy Loss in Electric Railway Vehicles. FU Mech. Eng. 2023, 21, 081. [Google Scholar] [CrossRef]
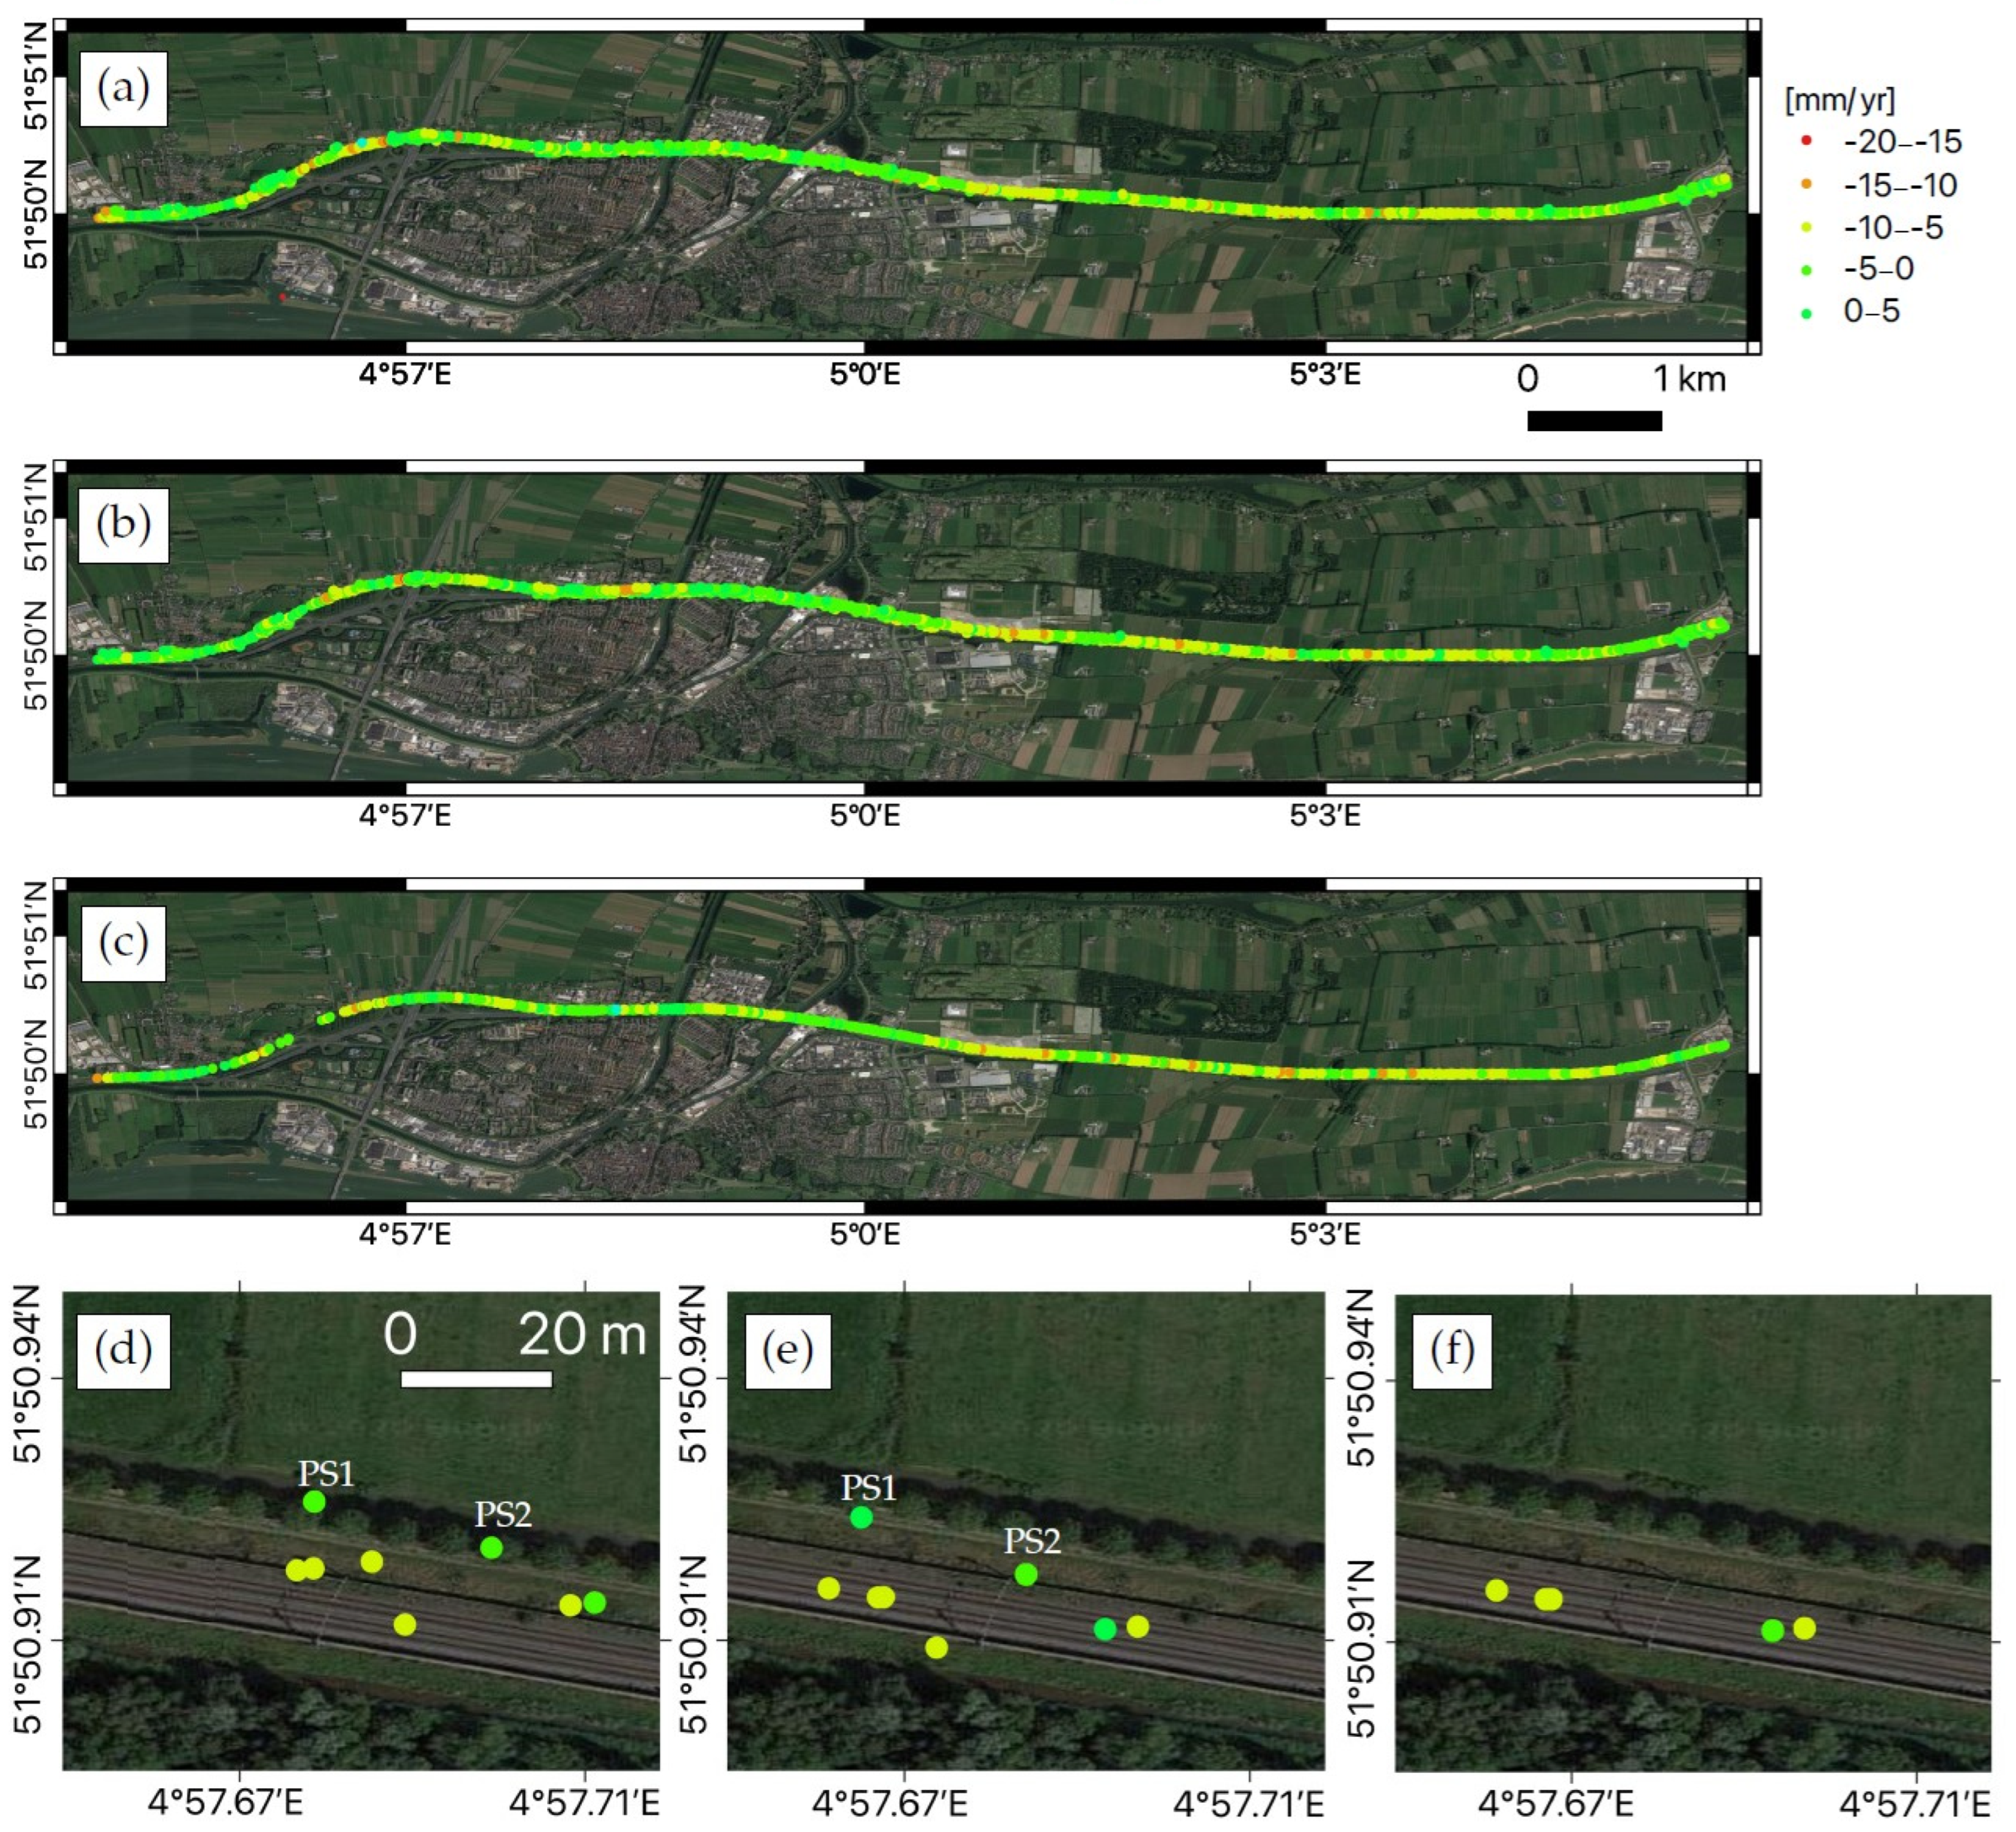
Figure 1. Line of sight (LOS) deformation velocity map: (a) before and (b) after 3-D geolocation improvement and (c) of persistent scatterers (PS) on rails. Subfigures (df) separately illustrate the zoomed-in map before and after 3-D geolocation improvement and of PS on rails over an example area (on the basis of [27]).
Infrastructures 10 00066 g001
Figure 2. (a) AHN3 point cloud along the railway and its buffer zone with classifications. Estimated parameters on both CCS and TCS: (b) velocity map; (c) height map; (d) thermal dilation map. (e) Location of the railway (green line) [40].
Infrastructures 10 00066 g002
Figure 3. The distribution of publications by year of publication.
Infrastructures 10 00066 g003
Figure 4. Distribution of publications by international journals and international conference proceedings.
Infrastructures 10 00066 g004
Figure 5. Distribution of publications based on author country.
Infrastructures 10 00066 g005
Figure 6. Distribution of publications by year of publication split by the use cases.
Infrastructures 10 00066 g006
Figure 7. IIMEO key algorithms for the SAR-based obstacle detection task: (a) tilling algorithm; (b) SAR focusing algorithm; (c) change detection algorithm [70].
Infrastructures 10 00066 g007
Table 1. Summary of papers studying the use of EO data for railway infrastructure monitoring.
PaperApplicationUsed
Satellite Data
SAR/
Optical (O)
Used
Satellites
Evaluation/Validation Tests
Evaluation (E)/Testing (T)/Validation (V)Comments
[16]WLOPlanetScope DoveERailway line between the cities of Ottawa and Brockville, ON, Canada
[20]GDSARSentinel-1E and TRailway line passing through Provadia town, Bulgaria
[21]GDSARTerraSAR-XE, T, and VApproximately 50 km of railway tracks of the Swiss Federal Railways network in Northern Switzerland
[22]TD
TZ
SARTerraSAR-XE, T, and VPart of the Betuweroute (double-track freight railway) close to Rotterdam, the Netherlands
[26]TDSARRadarsat-2EEntire railway network of the Netherlands
[27]TDSARSentinel-1E and TBetuwe freight train track, the Netherlands
[38]GDSARENVISAT/ASAR, TerraSAR-XE and TBeijing–Tianjin High-Speed Railway, China
[19]BSARRadarsat-2/Sentinel-1E, T, andVBridges that link the cities of Montreal and Longueuil and the cities of Montreal and Saint-Lambert, QC, Canada
[39]VGOQuickBirdE and TRailway area in the Southeast of Berlin, Germany
[40]TD
GD
SARRadarsat-2EZaltbommel, the Netherlands
[41]GDSARENVISAT/ALOS SAR missionsECastejón–Zaragoza conventional railway line, Spain
[42]GDOSPOTEOjiya city, Nagaoka city, Kawaguchi town, Horinouchi town, and Yamakoshi village, Japan
[43]TDSARTerraSAR-XE, T, and VSouth Korea
[34]VGOSentinel-2, LANDSAT-7ELiberec Region, Czech Republic
[35]VGOPleiadesE and TDifferent railway lines in France
[44]GDSARRADARSAT-1, ESA ERS-1, ESA ERS-2E and TThe Cassia–Monte Mario tunnel in Rome, the High-Speed/High-Capacity Bologna Node tunnel, the Scianina–Tracoccia tunnel, the preliminary design of the new Venice–Trieste railway line, Italy
[45]GDSARCosmo-SkyMedE and TSeveral railways in Lombardia region, in the proximity of Milano city and between Lecco and Como cities, Northern Italy
[46]GD
B
SARENVISAT/ASAREBeiluhe test site of the Qinghai–Tibet railway, China
[18]TZSARTerraSAR-XE and TMoerdijk, the Netherlands
[47]TDOGoogle MapsE-
[48]VG
GD
WL
SAR
O
Sentinel-1, Sentinel-2, LANDSAT-8, COSMO-SkyMed, PlanetScopeE-
[49]GDSARENVISAT SARE and TQinghai–Tibet railway, China
[50]TZSARSentinel-1E and TDongelu tunnel of the China–Tibet railway
[51]TDSARSentinel-1E and TQinghai–Tibet railway, China
[52]TD
GD
OIKONOSE and Tpre- and post-seismic railway curves in Dujiangyan City, China
[32]BSARSentinel-1AE and TGanjiang Super Bridge, China
[14]BSARCOSMO-SkyMedE and TRochester Bridge, UK
[53]GDSARSentinel-1A, COSMO-SkyMedE and TFoggia, Italy
[54]VGOLANDSAT-7, LANDSAT-8E and TBeijing–Tianjin intercity high-speed railway, China
[55]TZ
GD
SARSentinel-1AE and TChanggan high-speed railway, China
[56]GDSARSentinel-1A, COSMO-SkyMedE and TPuglia, Italy
[57]GDSARSentinel-1E and TRailway segment in Barcelona, Spain
[58]GDSARSentinel-1E, T, and VQom–Kashan railway, Iran
[59]BSARCosmo-SkyMedE and TRailway bridge over the Volturno river at Triflisco (Campania, Italy)
Disclaimer/Publisher’s Note: The statements, opinions and data contained in all publications are solely those of the individual author(s) and contributor(s) and not of MDPI and/or the editor(s). MDPI and/or the editor(s) disclaim responsibility for any injury to people or property resulting from any ideas, methods, instructions or products referred to in the content.