Abstract
In this paper, the authors examined the change in track gauges in curves for several railway lines with low and high traffic in Hungary (i.e., secondary lines and main lines). They covered the processing of raw data as well as statistical calculations. The considered curved sections were transition curves (TCs) and circular curves (CCs), as well as—in some cases—entire curves (ECs), including TCs and CCs, but not dividing them into parts. The change of track gauge parameter as a function of elapsed time was analyzed based on the distribution functions by calculating the Vaszary-type shape number. A statistical test with the Kolmogorov–Smirnov test was performed, in which the question as to whether the measurement data of the railway lines followed a normal or lognormal distribution was examined; additionally, the skewness and kurtosis parameters were calculated and analyzed. The authors also took into account the impact of the track system and the sleepers. For the selected curves, the authors observed how the average track gauge changes and categorized them according to tolerances. In presenting and summarizing the tests, the authors formulated a conclusion for each study fulfilled. Despite higher traffic loads, the value of track degradation over time is lower for mainline curves than for secondary line curves. It is because the main line has stricter tolerances due to the higher speeds allowed, and more maintenance work is carried out on these lines. The authors concluded that the type of the track system and the sleeper type also influence the change in track gauges in curves. The accurate deterioration ratios for all analyses are contained in the paper.
1. Introduction
The authors need to explain the Introduction’s unusual structure. The authors prepared a three-part Introduction. Section 1.1 provides preliminary thoughts on transportation as well as fixed-rail transportation in a more detailed manner. Section 1.2 discusses an international literature review on track gauge parameter. Finally, Section 1.3 discussed this study’s novelty, essence, and structure.
1.1. General Introduction
Transport can be divided into three broad areas: land, water, and air transport [1,2,3]. In this division, air transport should be added to space transport. People have been traveling since ancient times, covering short and long distances. In the case of transport on foot and/or on horseback (or the back of any animal), the first major development was in water transport about 9000 years ago, when the first boat is thought to have appeared, and the first major step in land transport was the invention of the wheel (about 7500 years ago). The next huge step was the industrial revolution in the 18th and 19th centuries with the steam engine and steam-powered vehicles (the names of James Watt, Richard Trevitchik, Robert Fulton, etc., are worth mentioning), followed by the invention and use of the electric motor and internal combustion engine in vehicles (as a driving mechanism) in the 1700s and 1800s. The next major milestone in air transport occurred in the early 1900s with the invention of the airplane (the Wright brothers). In parallel, land transport, dating back to antiquity, required the construction of suitable roads; in the case of shipping, harbors and docks were required [4,5,6,7,8]. Finally, the construction of railways and airports also became necessary because of modern inventions [1,2,3,9,10].
In parallel with transport, transport and logistics also became, and still are, of paramount importance [11,12,13].
This paper is about railway track gauges. As an introduction to the topic and as a prelude to the topicality of the subject, it is helpful to present the development of fixed-rail transportation because it is essential to mention the path that had to be traveled to reach the present state. Initially, in the mining industry, fixed-rail tracks were applied for the track of wagons that could be pushed or hauled onto and from the ground. The big step forward was the steam locomotive, designed and perfected by George Stephenson after “horse-drawn locomotives”. The first steam railway was operated between Stockton and Darlington, opening in 1825. After the advent of the steam locomotive, rail transport developed considerably.
The first Hungarian public railway line (with steam hauling) was constructed and announced in 1846, which was the Budapest-Vác railway line with a 33 km length [3]. Seeing the development of the railways, states also became involved in railway development. State-owned railways appeared in 1867. Nevertheless, the financial difficulties of private companies led to more and more railways being nationalized. The Royal Hungarian State Railways (“Magyar Királyi Államvasutak”, in Hungarian) took over the railways of private companies [3].
For the “official” first steam locomotive (the Rocket), George Stephenson used a track gauge of ~1422 mm (i.e., 4 feet 8 inches), and later widened it by ~13 mm. It was performed to favor the lateral forces on the wheel flanges [3].
Archaeological excavations in Pompeii and elsewhere have revealed that this may have been the track gauge of Roman road vehicles. At that time, everything was measured against something. The 1435 mm dimension allowed two people to sit comfortably on either side of a passageway [3].
Thus, the gauge value has been covering the nominal track gauge (or, in other words, the so-called standard track gauge) of 1435 mm for decades.
Measured in a cross-section, the track gauge is the smallest distance between points P1 and P2, and parallel with the top tangent of the rail heads. The considered ZP distance is below the top tangent of the rail heads (see Figure 1). The value of ZP in the harmonized European Standard (EN 13848-1 [14]) is 14 mm. (In the case of grooved rails, ZP is 9 or 10 mm).
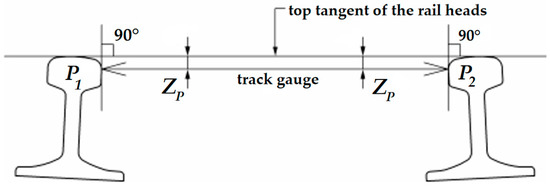
Figure 1.
The measurement principle of the railway gauge parameter (drawn based on EN 13848-1 [14]).
1.2. Literature Review
For this article, an international literature review was carried out on the subject of railway track gauges, which of course, could not be exhaustive due to space constraints; in any case, an attempt was made to summarize the most relevant and most cited literature and its main findings, which are presented in the following paragraphs. The authors collected the paper categorized them into main topics: (i) measurement possibilities of track gauge(s) (it has to be mentioned that only the non-commercial and non-standardized methods are overviewed and detailed here, in the Introduction; the standardized methods have been dealt in Section 2.3); (ii) deterioration of track gauge in different fixed-rail applications (tramways, railways, etc.); (iii) special areas and special results related to track gauges.
In the following paragraphs, the authors represent the above (i) group, i.e., measurement possibilities of track gauge.
Zheng et al. [15] have developed a portable mobile trolley method for measuring track gauge and rail wear on railway tracks. The essence and details of the method are that a so-called laser vision inspection model and a system calibration method are used. The procedure requires the use of machine vision in three dimensions. It is also essential and necessary to ensure that the measured rail track (left and right track in the case of a double-track railway line) can be placed in a correct and accurate 3D world coordinate system after the measurements have been taken. Using the improved closest point algorithm, comparing the measured data point set and the standard rail point set results in calculating the rail width and wear rate. The compiled measurement system was tested, and it was found that the maximum measurement error of the method is less than 0.1 mm. Therefore, it satisfies the track maintenance requirements.
Pay et al. [16] have designed and manufactured an IoT-DTG (Internet-of-things-enhanced digital track gauge), a device for measuring track gauge and superelevation (in other words: cant, or cross-level). It offers a higher measurement capacity than the currently available manual track gauge measurement device, with the same or higher accuracy. The device consists of an Arduino microcontroller, a light and distance sensor, an angle sensor, a 12-button dial, an LCD, a red and a green LED, and a Wi-Fi module with ThingSpeak IoT cloud platform. The new device developed has resulted in 50% labor savings, a 60% increase in work efficiency, and annual cost savings of SGD 19,200 (Singapore dollars). Future improvements include the inclusion of a SIM card with 4G/5G mobile connectivity, the use of color and sound alerts for certain measurement conditions, and the use of software to filter out outliers.
Yilmazer et al. [17] have developed a drone-based method for measuring the track gauge using optical and image analysis. The drone must fly at a predetermined height, utterly independent of the vehicles on the line. Any vibrations can be filtered out during the image analysis. The tracks can be identified in the images using Gaussian filters and unique detection algorithms. It was performed using MATLAB programming. The measurement was calibrated and could accurately determine the measured gauge values from the camera images. Measurements were also taken under different lighting conditions, and 80–87% accuracy was achieved.
Zhang et al. [18] developed a relative track gauge measurement method based on the relative transverse motion of the wheel and rail. The method uses a combination of two laser sources and two cameras to dynamically collect images of the inner side of the rail head. Variable settings are required depending on the rail profile. Then, the track gauge is calculated from the lateral displacement of the wheel and the vertical displacement of the laser point on the rail head. The experimental results show the system’s advantages in simple hardware design, small data computation, high measurement accuracy, and the ability to measure the gauge spacing value without contact.
Shi et al. [19] developed a tracking system based on the laser triangulation principle, which was mounted on a track detection trolley. They mounted two 2-D laser scanners to collect left- and right-track profile data. An iterative closest point (ICP) algorithm was used to calibrate the sensor data, and a so-called adaptive filter algorithm was used to smooth the contour. A least squares method was applied to the track gauge to fit the curve of the top of the rail head to improve positioning accuracy. The research has resulted that the proposed method improves the track gauge measurement adequately and efficiently, with an achievable accuracy of ±1 mm.
Tsubokawa and Ishikawa [20] have developed a measuring system for railway tracks that can be easily mounted on a motor car, registers loaded track conditions, and measures track gauge and twist. The device is a laser-based, non-contact measurement system that “scans” the rails in two dimensions at a given track cross-section. The maximum measuring speed is 40 km/h. The measurements were repeated several times on a motor car over a 400 m radius curve with a 30 mm superelevation. The rail fastenings were removed from four sleepers, and the variation in the track gauge parameter was measured. In addition to the previous one, a standard railway wagon was mounted to measure a 120 m site radius track section with 107 mm superelevation and 1067 mm gauge at speeds of 10–40 km/h with multiple repetitions. The measurements showed that the repeatability was 0.3 mm for the track gauge parameter and 1.0 mm for the 5 m base length twist parameter.
Tang et al. [21] developed a measurement instrument for grooved rail on tramway tracks using a 2D laser scanner solution. The method achieves a measurement accuracy of about +/−0.6 mm. The measurement principle is based on laser “triangulation”. Mathematical data filtering is first performed on the measured rail head profiles. The measuring range is between 1428 and 1470 mm. The rail head detection and gauge measurement have been tested under laboratory conditions.
In the following paragraphs, the authors represent the above (ii) and (iii) groups, i.e., the deterioration of track gauges in different fixed-rail applications (tramways, railways, etc.) and the special areas and special results related to track gauges.
Németh et al. [22] investigated how the track gauge varies with time on five low and five high-traffic Hungarian railway lines, considering only straight track sections. The analyses included calculating the through-rolled axle tons (i.e., the track loading, MGT—million gross tons). The measurement data were provided by the FMK-007 track geometry measuring car owned and operated by MÁV CRTI Ltd. (MÁV Central Rail and Track Inspection Ltd., Budapest, Hungary, where abbreviation MÁV means the Hungarian State Railways, Budapest, Hungary). Track geometry measurements of 25 cm were used in raw form. Mathematical statistical methods were applied to the data analysis including calculating mean, standard deviation, skewness, kurtosis, and Vaszary-type shape numbers of distribution functions. In addition, a spectral analysis of the ten railway lines studied was carried out. It was found that no significant correlation could be detected between the change of the track gauge, average and standard deviation values, elapsed time, and traffic loading (i.e., MGT). For the ten lines studied, it was demonstrated that the distribution functions for the gauge values were neither Gaussian nor lognormal. For lower track speeds, the distribution functions are flatter, while for higher speeds, they are steeper and have a narrower range.
Aharkov et al. [23] investigated the gauge stability of different rail track reinforcements considering the solutions used in the Ukrainian railway network, namely KB-75, KKP-1, and KPP-5. Measurements on the railway track compared each solution, and the measurements were analyzed by mathematical statistical methods. The measurements were made every 3 months and covered 3 years, thus covering 12 data sets for the research. The section of line selected for the study is a straight line only with a mixed traffic load (passenger and freight trains) of 60 million MGT per year.
Ahac and Lakusic [24] dealt with gauge degradation modeling in the field of maintenance planning for tramways. They developed a mechanistic-empirical degradation model, i.e., a mixed-combined method based on theoretical and practical principles. Their research was based on the tracks of the 1000 mm gauge tramway network in Zagreb, where the track gauge changes (mainly widening) were investigated. One of the leading causes of this is rail wear, which is significantly dependent on track geometry (horizontal curve radius), rail quality (rail hardness), and support stiffness. Their paper investigated Ri-60 “grooved rail” rail profiles and R200 and R260 rail grades for R ≥ 200 m and R < 200 m site radii. Two basic rail reinforcement schemes were considered as follows: tracked and direct rail reinforcement solutions. In this publication, a complete 4.5 km section of 25 segments of the Zagreb tramway, built and rehabilitated in the period 1997–2004, was analyzed. The homogeneous characteristics of the sections were track geometry (only straight sections were considered), traffic characteristics (only “open track” sections with separated track structure, no tram stops and level crossings, with an average constant speed of 15 km/h were considered) and the previously mentioned combinations of rail quality and rail reinforcement (18 sections were designed with R200 rail quality and indirect rail reinforcement and seven sections with direct rail reinforcement). Considering the results of the tests, it was concluded that the stiffness of the rail reinforcement in the initial degradation stage is negligible during the gauge degradation process up to 35 MGT traffic load. After 35 MGT, the degradation rate decreases significantly for indirect rail reinforcement systems, which develops from 45 MGT for direct rail reinforcements. Above 45 MGT, the model is not suitable for accurate prediction of gauge degradation, in which case additional measurements are required.
Akkermann and Akkermann [25] dealt with the rail gauge trajectory and the micro- and macro-profile of the tracks. In their paper, they proposed the creation of a digital clone to monitor track gauge parameters.
Falamarzi et al. [26] conducted research on track gauge deviation prediction for electrified tracks using artificial neural network (ANN) and support vector regression (SVM) methods. The coefficient of determination (R2) and mean squared error (MSE) parameters were used to characterize the goodness of fit of each model. As a case study, the Melbourne light rail network was considered, which in this case was a 250 km long double-track section with 25 lines. Measurement data was collected in 2013 and 2014, and measurements were made using non-contact optical measuring instruments, taking into account a 10 m string length. The operator, Yarra Trams, provided the data. First of all, the measurement data had to be sorted and filtered, including removing outliers and noise through appropriate mathematical filters. In general, both methods (ANN and SVM) gave similarly promising results, but for straight track sections, the degradation model based on the ANN method gave a more accurate prediction, while for curved-track sections, the opposite was found to be true.
On the basis of the presented exhaustive literature review, it can be asserted that a significant number of international publications investigate the gauge parameter of the superstructure structure of fixed rail transport systems. Due to space constraints and a lack of direct logical connections, the current literature does not provide a thorough analysis of the historical evolution of track gauge parameters. The authors compiled the papers and grouped them into three main categories: (i) measurement possibilities of track gauge(s); (ii) deterioration of track gauge in various fixed-rail applications (tramways, railways, etc.); and (iii) special areas and special results related to track gauges. In group (i), the authors showed and detailed how there are a lot of up-to-date techniques and instruments for measuring fixed-rail systems’ track geometry, including track gauge. This means both contact and non-contact devices, manual and mechanized, as well as automatic solutions (or their combinations). The main issue besides measurement methodology is data storage and data processing. There are manual, automatic, as well as modern, e.g., artificial intelligence solutions. In groups (ii) and (iii), the authors collected literature on the deterioration process of track gauge parameter on fixed-rail transport systems as well as special areas related to them. There are a lot of parameters that can influence the deterioration speed, e.g., the through-rolled axle ton values, the type of superstructure, the age of structural elements, etc. For example, entire tramway networks, or only big part of them, were considered during the analyses. Structural set-ups and superstructural solutions were investigated and the authors of these publications tried to derive general conclusions based on their research. Of course, it is not an easy task because each section can differ from the other(s), and it is very difficult and complicated to formulate fully general scientific statements on this subject.
1.3. The Novelty and Structural Set-Up of the Current Paper
The novelty of this paper is the detailed analysis of ten railway tracks related to ten years of measurements in the past. The measurements contained more track geometry parameters simultaneously; however, only the track gauge parameter was considered. In this study, the curved sections were analyzed. The prior research was the paper [22]. Three of the authors of [22] conducted additional investigation. The considered railway lines were the same. The authors thought that after having analyzed the straight sections of the ten railway lines, the curved sections are also important and interested. To be able to do that, further filters and additional track geometry data were needed. With these details no one has published results on this topic, yet. The considered time interval is ten years, i.e., it can be stated that it is quite a long-term analysis. The applied methods are classic mathematical statistics methodologies; however, the special shape number is also taken into consideration.
2. Materials and Methods
In the following sections, certain terminology is applied as fikkiws: transition curve (TC), circular curve (CC), and the entire curve, which does not divide them into transition curves and circular curve parts (EC).
2.1. Short Introduction of the Investigated Railway Lines
Figure 2 introduces a map of the ten examined railway lines [22]; Table 1 summarizes their main base characteristics.
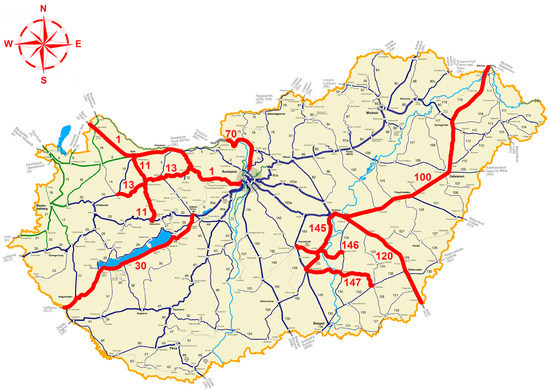
Figure 2.
Map of Hungary’s railway network highlighting the ten examined railway lines in red color and adding their ID numbers.

Table 1.
Description of the ten examined railway lines.
2.2. Statistical Data of the Considered Railway Lines
In addition to a general description of the railway lines studied, the straight-curve ratio of the lines, including the distribution of circular and transition curves, is illustrated in Figure 3, Figure 4 and Figure 5 and Table 2; they also contain statistical base data about the ten examined railway lines.
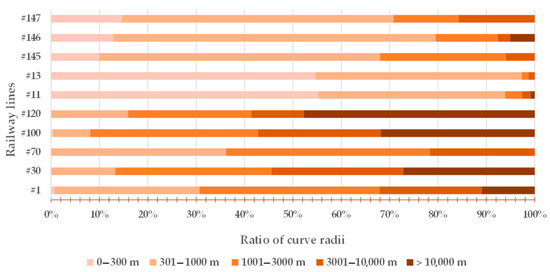
Figure 3.
The ratio of curve radii related to the examined ten railway lines.
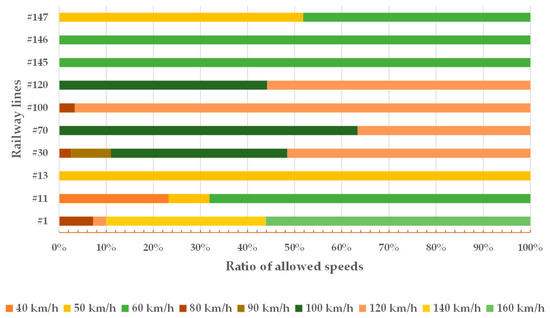
Figure 4.
The ratio of allowed speeds related to the examined ten railway lines.
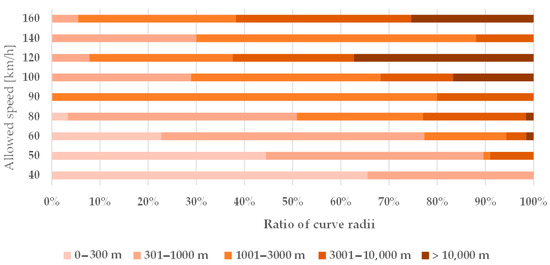
Figure 5.
The ratio of allowed speeds considering the allowed speeds related to the examined ten railway lines.
Table 2.
Length and track gauge values of the examined railway lines.
Table 2 represents the horizontal track geometry elements distribution in the investigated ten railway lines in percentages, and Figure 6 shows the annual loading values (MGT).
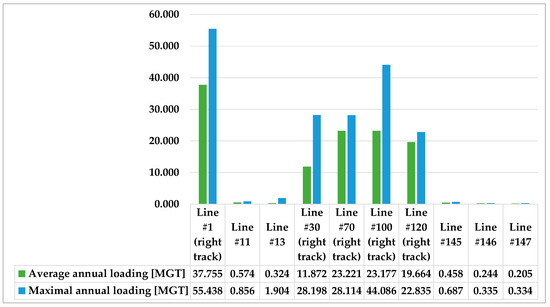
Figure 6.
Annual loading values of the examined railway lines between 2013 and 2019.
2.3. Applied Methods for the Data Analysis
In this paper, the authors applied measurement data provided by railway track geometry measuring and recording cars of MÁV CRTI Ltd., namely the FMK-004 and FMK-007.
There are different measurement possibilities related to track gauge measurement; see [22,27,28,29,30,31].
The investigation used statistical analysis, for which MÁV Ltd. provided the data. The traffic loading data (i.e., MGT) were taken from the official MÁV database. The track data and track geometry measurements were exported from the PÁTER system (railway maintenance and economic assessment system and software in Hungary) and were received in Excel and text (*.txt) format. The track geometry and traffic load data included ten years of measurements (2011–2020). The measurements were made with the track geometry measuring trolleys FMK-004 and FMK-007 owned by MÁV CRTI Ltd.
The measuring systems of FMK-004 are track geometry measuring system as well as clearance gauge measuring system. In the following paragraphs only the first one is introduced and detailed. The summary is prepared according to MÁV CRTI Ltd.’s webpage [32].
In several central European nations, the FMK-004 measuring car performs track geometry and clearance gauge measurements, which is a self-propelled and diesel-powered vehicle. The customer has access to the measurement results in both printed and electronic formats immediately following the completion of the measurement. The clearance measurement requires office post-processing prior to delivery. The measuring systems order data and GNSS coordinates for the measuring results section. A workplace system aids in displaying, evaluating, and analyzing measurement results. The length is 15 m, the axle load is 130 kN, the maximum measuring speed: 100 km/h.
The track geometry measuring system is contact-based, meaning that the majority of measurement results are derived from the movement of the wheels on the rail (altogether 18 smaller or larger wheels on 9 axles). In addition, the measuring system is able to generate alignment and longitudinal level (sinking) diagrams on distortion-free and original chord bases. Using a gyroscope, the cross section is calculated. The twist can be determined for various bases. Measured track geometry characteristics are as follows:
- Gauge;
- Cross level/superelevation/;
- Twist on five different bases;
- Longitudinal level/sinking/on original chord, and in D1 or D2 wavelength range;
- Alignment on original chord, and in D1 or D2 wavelength range;
- Gauge change on any base;
- Average gauge on any base;
- Curvature;
- Twist-differences on five different bases;
- Longitudinal level/sinking/moving standard deviation on any base.
Main services:
- Measuring graphs (different measuring limits with objects);
- List of local defects (taking into account different measuring limits);
- General track condition judgment measuring and qualification numbers (at any length).
The measuring systems of FMK-007 are track geometry measuring system as well as vehicle dynamic measuring system. In the following paragraphs, only the first one is introduced and detailed. The summary is prepared according to MÁV CRTI Ltd.’s webpage [33].
In a number of central European countries, the FMK-007 measuring car conducts track geometry and vehicle dynamics measurements. It is not self-propelled; it was constructed in Hungary in 2001 by repurposing an IC wagon.
Immediately upon completion of the measurement, for which section data and GNSS coordinates are requested by the measuring system, the customer has immediate access to the measurement results in both printed and electronic formats. A workplace system aids in displaying, evaluating, and analyzing measurement results. The length is 26.4 m, the axle load is 140 kN, the maximum measuring speed: 160 km/h.
The track geometry measuring system is non-contact, so measurement results are provided by laser measuring units or inertial units attached to the bottom of the wagon.
The measuring system is also capable of generating alignment and longitudinal level (sinking) diagrams on distortion-free chord bases as well as on the original chord base or any other chord base. The cross section is measured using an inertial unit. The twist can be determined for various bases.
Measured track geometry characteristics:
- Gauge;
- Cross level/superelevation/;
- Twist on five different bases,
- Longitudinal level/sinking/on original or on any chord, and in D1 or D2 wavelength range;
- Alignment on original or on any chord, and in D1 or D2 wavelength range;
- Gauge-changing on any base;
- Average gauge on any base;
- Curvature;
- Twist-differences on five different bases;
- Longitudinal level/sinking/moving standard deviation on any base.
Main services:
- Measuring graphs—different measuring limits with objects;
- List of local defects—taking into account different measuring limits;
- General track condition judgment measuring and qualification numbers—at any length.
In order to start the analysis, preliminary work was performed on the raw data series. The authors combined several days of measurement data and overlapping data in several places to ensure accurate measurement. In this case, they always overwrote the older values with the newer data. Since the authors are looking at curved sections of the trajectory in this paper, straight sections were unnecessary. The measurement data for straight sections were removed by filtering in Excel. The data for TCs and CCs were examined separately, so the next step was to separate the filtered data based on the curves. Then, the analyses were started. It has to be mentioned that in the case of double-track lines (Line #1, #30, #70, #100, and #120), only the right tracks were considered in the calculations and the analyses.
Distribution functions were constructed from the filtered data for statistical time series analysis of the gauge parameter (see Section 3.1).
For each railway line, it was examined whether the data series showed a normal or lognormal distribution. For the lognormal distribution, 10 mm was added to the data to make the logarithm more meaningful, which was also just a transformation parallel to a horizontal axis. The Kolmogorov–Smirnov test was performed using the MS Excel program. The analysis was performed for the sections with transition curves (TC), circular curves (CC), and the entire curves without dividing them into transition curves and circular curve parts (EC) (see Section 3.2).
Section 3.3 investigated the effect of the superstructure on the change in gauge spacing over time. Two railway lines were investigated. Line #13 is built with fishplated rail joints, and Line #1 is a CWR track. In addition to the track system, whether the type of sleeper influences the track gauge was also investigated; the two railway lines were Line #1 and Line #11.
In Section 3.4, selected given curves were analyzed in a detailed manner. Line #1 and Line #11 were selected for this calculation. The track gauge parameter was examined only in the section interval between the beginning points of the transition curves.
2.4. Standards and Regulations
The authors applied the standards and regulations of Hungary based on national specifications [34,35,36] and harmonized European standards [14,37,38,39]. Next to them, the so-called “Technical Specification of Interoperability” (TSI) of the European Union (EU) is also relevant [40]. It has to be mentioned that in curves with small radii, track gauge widening can be applied—if needed— and there must be a transition of track gauge parameter from the nominal to the prescribed. These limits are given by [36].
Table 3 contains the specifications of the TSI related to the track gauge [40].
Table 3.
Immediate action limits of track gauge [40].
Table 4.
Requirements of track gauge in EN 13848-5 [39].
Table 5.
Requirements of average track gauge (considering 100 m length) in EN 13848-5 [39].
Table 6 represents the requirements of MÁV D.54 [36]. There are other different categories in MÁV D.54, i.e., average track gauge and deviation of track gauge; however, in this paper, they are not introduced.
Table 6.
Requirements of track gauge in MÁV D.54 [36].
In Table 6, the abbreviations have the following meanings:
- A: categories related to construction
- ○
- A1: Category of size limit category of track gauge not to be exceeded by the geometric dimensions of track of new material (rail, sleeper, rail fastener, new or renewed ballast in entire cross-section) on a new or renewed substructure;
- ○
- A2: Category of size limits whose limits shall not be exceeded by the geometric dimensions of the track constructed of used (reclaimed) material (rail and/or sleeper are not new and/or ballast not new or renewed);
- ○
- A1 and A2: Values not exceeding the construction size limit shall be required for 90 frost-free (air temperature above 0 °C) days from the date of the first track measurement result that shows the track to be suitable for the given construction speed.
- B: category related to maintenance
- ○
- B: The size limit category, whose limits must not be exceeded by values achieved by maintenance. The assessment of the maintenance work carried out to a B limit provides its rating.
- C: categories related to intervention
- ○
- C1: Alarm limit category (AL) indicating the progressive deterioration of the track geometry. The evolution of the number of defects shall be monitored by comparing the current and previous measurements;
- ○
- C2: Intervention limit category (IL), which, if exceeded, requires corrective maintenance work if the evaluation indicates that the local defect size is expected to exceed C3 by the next track inspection measurement;
- ○
- C3: Immediate action limit category (IAL), which requires action if exceeded: introduction of a speed restriction within a maximum of three days. Thereafter, corrective maintenance of the track geometry must be carried out to remove the speed restriction;
- ○
- If the measured value in a speed range exceeds the C3 limit, the applicable speed shall be set so that the measured value is within the C3 limit;
- ○
- If the value of the fault/defect also exceeds the C3 value for 40 km/h, a speed limit value lower than 40 km/h shall be introduced depending on the structural condition of the track.
- D: category related to closing the railway service on the track
- ○
- D: The speed class-independent size limit category above which the track shall be closed. (This size limit is only for the track geometry characteristics of track gauge widening and twist parameters).
3. Results and Discussion
This section details four different analyses, parallel with Section 2.3.
3.1. Statistical Time Series Analysis of the Gauge Parameter
Distribution functions were prepared from the filtered data for the statistical time series analysis of the track gauge parameter.
Figure 7, Figure 8 and Figure 9 show that the distribution function of Line #1 gives a steeper trend than that of Line #13 (see Figure 10, Figure 11 and Figure 12). The tangent of the graph gives information about the state (condition) of the railway line; the more values approach 0, the better the track’s state. Because of the fact, Line #1 is a main line, and Line #13 is a branch line, so there are differences in track conditions and traffic volumes (loading). Depending on the speeds allowed, the regulation’s requirement is stricter for the main line (i.e., Line #1), so it cannot be too extreme.
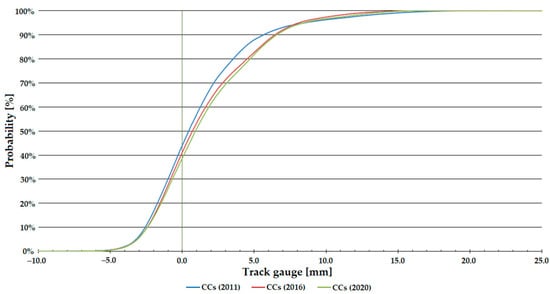
Figure 7.
Distribution functions of track gauge parameter on Line #1, circular curves (CCs).
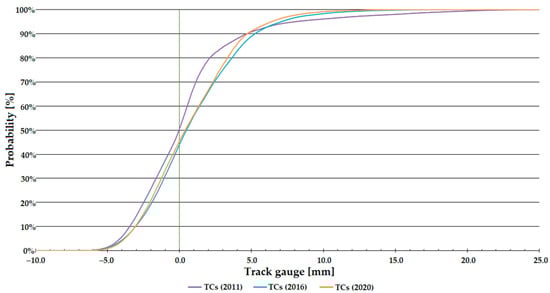
Figure 8.
Distribution functions of track gauge parameter on Line #1, transition curves (TCs).
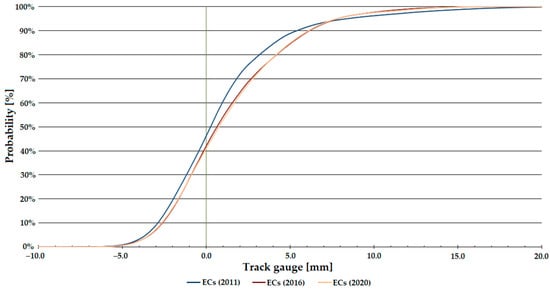
Figure 9.
Distribution functions of track gauge parameter on Line #1, entire curves (ECs).
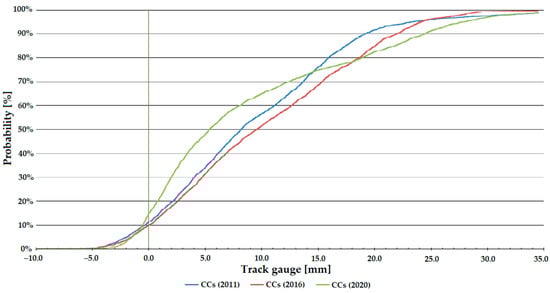
Figure 10.
Distribution functions of track gauge parameter on Line #13, circular curves (CCs).
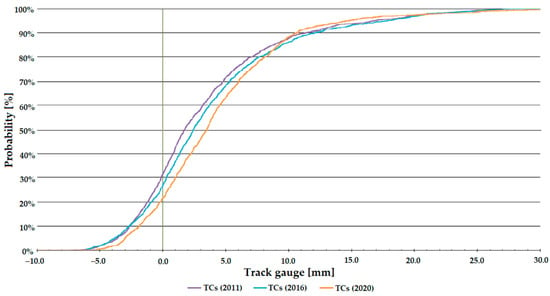
Figure 11.
Distribution functions of track gauge parameter on Line #13, transition curves (TCs).
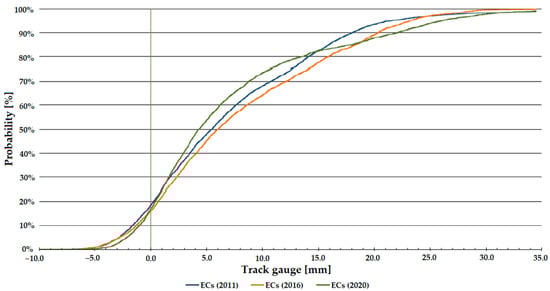
Figure 12.
Distribution functions of track gauge parameter on Line #13, entire curves (ECs).
For Line #1, the transition curve sections showed a deterioration from 2011 to 2016, after which there was an improvement on these sections (see Figure 8).
Figure 9 shows that deterioration is visible for the sections with CCs. For the ECs, on the other hand, there is only deterioration from 2011, with no significant deterioration between 2016 and 2020.
For the selected branch line (see Figure 10, Figure 11 and Figure 12), significant deterioration is observed in the transition curve sections until 2020, but at the end of the line, the track gauge widening of the curve has already decreased. It is likely to be due to rebuilding.
For sections with CCs, a deterioration is observed until 2015, but by 2020, as for the TCs, an improvement is observed, which can also be said for the sections with ECs.
After constructing the distribution functions, the authors determined the quantiles (15%, 50%, and 85%) of the distribution functions needed to calculate the condition characteristic (see Table 7).
Table 7.
Quantiles of distribution functions of track gauge parameter on Line #1.
An additional 10 mm was added to the values to avoid calculating an absolute value (which would have distorted the value of the parameter(s) calculated from the distribution function). It is only a transformation parallel to the horizontal axis and does not affect the comparability of the values. The Vaszary-type shape numbers were then calculated [22].
The calculation of the Vaszary-type shape number (Itrack gauge) is shown in Equation (1), where i15%, i50%, and i85% are the quantiles for 15%, 50%, and 85% probabilities, respectively [22].
The resulting values for the years studied are shown in Table 8.
Table 8.
Quantiles of distribution functions of track gauge parameter on Line #1, considering the modification of track gauge values with adding +10 mm.
The calculated values of Vaszary-type shape numbers are summarized in Table 9, separating sections with CCs, TCs, and ECs.
Table 9.
Vaszary-type shape numbers of the examined curves’ distribution functions.
Looking at the values as a whole, Line #13 is the worst, and Line #30 is the best since the higher the value of the Vaszary-type shape number, the worse the quality of the track. In addition, the most significant part of Line #30 has been rebuilt during the years under study and is, therefore, in better condition than the other lines.
For Line #145, the authors observed that the values had almost halved by 2020 compared to 2011. This represents an improvement in condition due to the work carried out. Likely, the line has also undergone sleeper replacements, sleeper repairs, and track replacements in recent years. The other lines have also shown an improvement in condition over the years.
Comparing the sections with CCs, TCs, and ECs, the authors derived the following results:
- The highest shape numbers are observed in CCs;
- The lowest Vaszary-type shape numbers are in the sections with TCs;
- The ECs are located in between them (see above);
- The reason for the case of CCs is that in these sections, significant lateral forces can act on the vehicles due to the non-compensated lateral acceleration, depending on the vehicles’ speed and curve radius (which is proportional to the vehicle speed squared and inversely proportional to the radius of the curve).
3.2. Examination of Normal and Lognormal Distributions
The analysis of the distribution functions was executed by Kolmogorov–Smirnov (KS) tests. During these analyses, the facts were examined as to whether the track gauge parameters’ distribution functions are Gauss-distribution (GD) or lognormal distribution (LD). The logarithmic function was the “ln”, where the basis is the neutral number “e”.
The “Result” column of Table 10, Table 11, Table 12, Table 13, Table 14 and Table 15 shows that the data do not follow a normal distribution for any lines. The skewness and kurtosis values in the last two columns show how far the track gauge data describing a given track deviate from the normal distribution. In the Result column there are two options, ND means normal distribution, NND means non-normal distribution.
Table 10.
The results of the Kolmogorov–Smirnov test for the sections with CCs of the investigated railway lines.
Table 11.
The results of the Kolmogorov–Smirnov test for the sections with CCs of the investigated railway lines, considering the modification of track gauge values by adding +10 mm.
Table 12.
The results of the Kolmogorov–Smirnov test for the sections with TCs of the investigated railway lines.
Table 13.
The results of the Kolmogorov–Smirnov test for the sections with TCs of the investigated railway lines, considering the modification of track gauge values by adding +10 mm.
Table 14.
The results of the Kolmogorov–Smirnov test for the sections with ECs of the investigated railway lines.
Table 15.
The results of the Kolmogorov–Smirnov test for the sections with ECs of the investigated railway lines, considering the modification of track gauge values by adding +10 mm.
After the Kolmogorov–Smirnov test, probability density functions were constructed for each line, separating the different sections (CCs, TCs, and ECs). Only one of them is shown in Figure 13 due to the required space. The skewness and kurtosis values of the probability density functions can be seen in Table 10, Table 11, Table 12, Table 13, Table 14 and Table 15 in the last two columns.
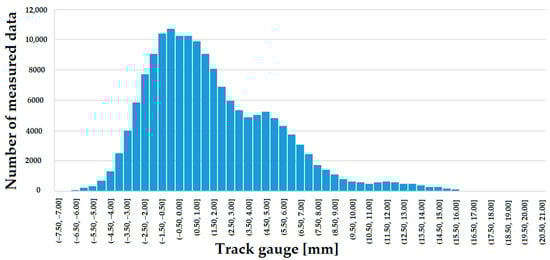
Figure 13.
Probability density function of track gauge parameter on Line #1, circular curves (CCs).
The lines were classified according to the limits of skewness and kurtosis, which shows that Line #11 is the closest to a normal distribution. The transition curves show a more “peaked” picture. For a lognormal distribution function, there is an acceptable degree of asymmetry. Regarding kurtosis, the line distribution functions are higher than the lognormal distribution function.
3.3. Examination of Superstructure Types
The track gauge values are plotted with the sections for the two railway lines studied. For Line #13, comparing the 2012 data set with the 2020 data set, it is noticeable that the track gauge widening has already been transformed into track gauge narrowing in some places over time (see Figure 14 and Figure 15). The reason for this phenomenon has not been clarified. It has been suggested that the section may have been rebuilt, but the track gauge limits related to this speed do not allow for such a track narrowing during rehabilitation.
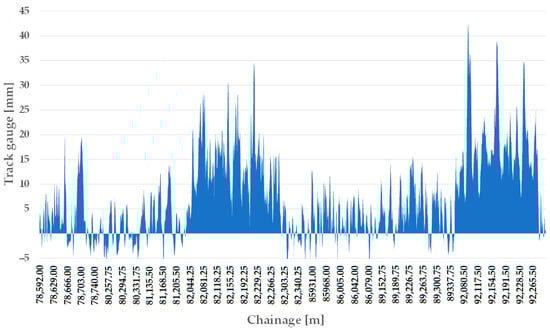
Figure 14.
The longitudinal function of the track gauge on Line #13, considering the measurement data in 2012 and the sections with ECs.
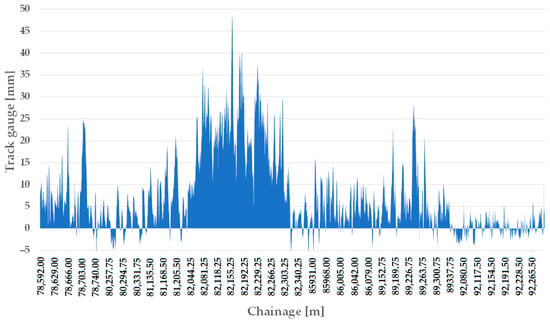
Figure 15.
The longitudinal function of the track gauge on Line #13, considering the measurement data in 2020 and the sections with ECs.
Line #1 has typically experienced track gauge widening over the ten years studied (see Figure 16 and Figure 17), but as with Line #13, there is also evidence of track gauge narrowing despite wear from use.
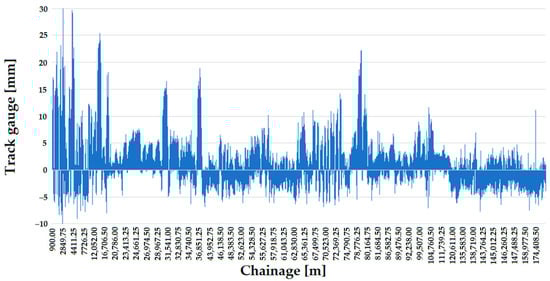
Figure 16.
The longitudinal function of the track gauge on Line #1, considering the measurement data in 2011 and the sections with ECs.
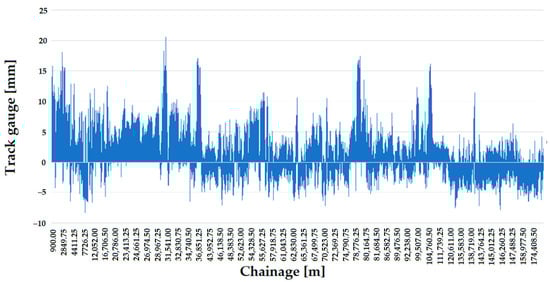
Figure 17.
The longitudinal function of the track gauge on Line #1, considering the measurement data in 2020 and the sections with ECs.
In addition to the track system, it was also investigated whether the type of sleeper or not influences the track gauge. In the section of Line #11 under study, wooden sleepers (see Figure 18) were installed, while on Line #1, reinforced concrete sleepers were used (see Figure 19).
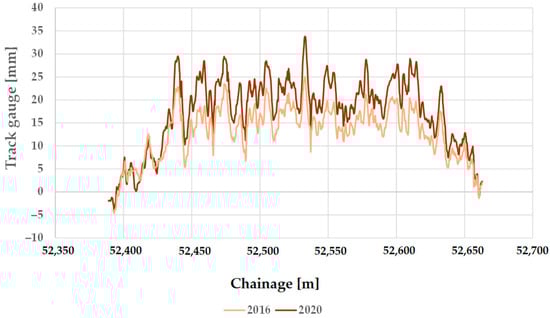
Figure 18.
The longitudinal function of the track gauge on Line #11 (between Zirc and Eplény railway stations), considering the measurement data in 2016 and 2020 and the sections with ECs.
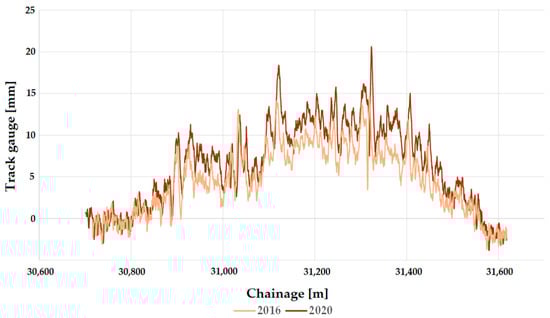
Figure 19.
The longitudinal function of the track gauge on Line #1 (between Biatorbágy and Herceghalom railway stations), considering the measurement data in 2016 and 2020 and the sections with ECs.
Comparing the two figures shows that the values of the track gauge narrowing are almost similar in both cases, but the values of the track gauge widening show a significant difference. Line #1’s maximum track gauge widening value is close to 20 mm, while Line #11’s is close to 35 mm.
The change over five years is 5 mm for the examined main railway line (i.e., Line #1) and 8–10 mm for the branch line (i.e., Line #11). This variation is significant, and it can be concluded that the sleeper type influences the variation in the track gauge.
3.4. Examination of Selected Given Curves
In the selection of the curves, it was observed which curve “stands out” on the line regarding track gauge widening or narrowing. For example, line #1 had the highest value of track gauge widening (see Table 16), so the corresponding curve was analyzed.
Table 16.
Outstanding values of track gauge widening and narrowing of Line #1.
The change in track gauge parameter is plotted based on measurements for 2016 and 2020. TCs and CCs are marked and illustrated in Figure 20. A moving average was also created for the data.
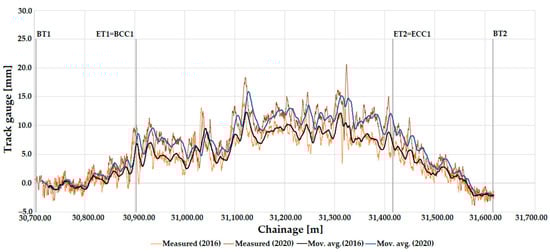
Figure 20.
The longitudinal function of the track gauge on Line #1 (between Biatorbágy and Herceghalom railway stations), considering the measurement data in 2016 and 2020 and the sections with ECs. Moving average (mov. avg.) lines are added. The meanings of abbreviations are detailed in “Abbreviations” at the end of the paper.
The permitted speed on this section of Line #1 is 140 km/h. Therefore, it fits the regulations (see Section 2.4, Table 6).
In the case of track gauge widening, the track gauge value exceeds the C2 intervention size limit category at one point. It falls within the immediate action limit category C3, so a speed limit is required in this section. The transition curve sections are classified as B-C1 (see Section 2.4, Table 6).
Regarding track gauge narrowing, the whole track curve does not exceed the C1 warning size limit category. In addition, the values in the transition curves do not exceed maintenance category B in places (see Section 2.4, Table 6).
Line #11 also included a larger value of track gauge widening, so the curve that contains the 605+59.75 section was examined (see Table 17).
Table 17.
Outstanding values of track gauge widening and narrowing of Line #11.
The speed limit on this section of the line is 60 km/h. On Line #11, in 2016, there was a section with a category D value, meaning the track must be closed (see Figure 21). However, the track gauge value on this section has been reduced to 2020, placing it in the category C2 intervention size limit. The CC varies between categories B to C3 (see Section 2.4).
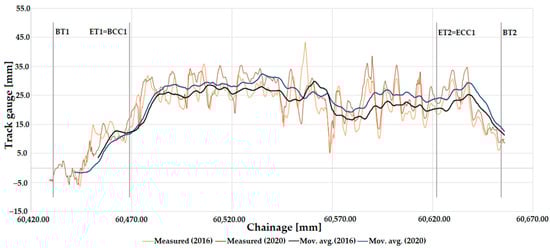
Figure 21.
The longitudinal function of the track gauge on Line #11 (between Zirc and Eplény railway stations), considering the measurement data in 2016 and 2020 and the sections with ECs. Moving average lines are added. Moving average (mov. avg.) lines are added. The meanings of abbreviations are detailed in “Abbreviations” at the end of the paper.
Track gauge narrowing has only occurred in the transition curve between sections 604 + 31 and 604 + 69.
4. Conclusions
The authors conclude their examination in the following paragraphs.
- 1.
- Statistical time series analysis of the track gauge parameter
In the time series analysis, findings were as follows:
- The highest Vaszary-type shape numbers are observed in CCs.
- The lowest Vaszary-type shape numbers are in the sections with TCs.
- For ECs, this parameter lies between the above two results.
- From the straight sections to CCs, the vehicle is guided by the TCs; it was, therefore, to be expected that the track gauge values in the sections with TCs are transitions between the values of the straight lines and CCs, which are almost close to 0, and the CCs’ values.
- 2.
- Examination of normal and lognormal distributions
In the distribution analysis of track gauge parameters in curves, findings were as follows:
- The result of the Kolmogorov–Smirnov test is that the ten railway lines incorporated in the study have neither normal nor lognormal distributions.
- The lines were classified according to the limits of skewness and kurtosis, which shows that Line #11 is the closest to a normal distribution. The transition curves show a more “peaked” picture. For a lognormal distribution function, there is an acceptable degree of asymmetry. Regarding kurtosis, the line distribution functions are higher than the lognormal distribution function.
- 3.
- Examination of superstructure types
In the investigation of track gauge parameters regarding different superstructure types, findings were as follows:
- First, the track system was examined to see how it affects the variation in the track gauge. For example, on some sections of the branch line, the gauge narrowing has been converted to a gauge widening by 2020, while on other sections, the value of track gauge widening has decreased. It could be due to rebuilding, sleeper replacement, or track replacement, but the required data were unavailable.
- In general, there is a 10–15 mm deterioration between 2012 and 2020.
- For the sections of the main line examined, an average deterioration of 5 mm was observed between 2012 and 2020.
- Thus, the type of track system influences the change in track gauge, with more remarkable changes over the years for fishplate jointed tracks.
- The influence of the type of sleeper on the change in the track gauge parameter was analyzed. This analysis was carried out on branch line curves, as no wooden sleepers are applied on main line curves.
- The curve with concrete sleepers shows a change of 5 mm over 5 years, whereas the curve with wooden sleepers shows a change of 8–10 mm. The reason for this is characteristic of the wood, which is sensitive to weathering. Over time, elastic deformations develop, and when this occurs, the reinforcements may also shift.
- The track gauge narrowing is the same for both lines; however, when the maximum value of track gauge narrowing is considered, there is a difference of 5 mm between the curves with wooden and concrete sleepers.
- 4.
- Examination of selected given curves
In the analysis of selected given curves, findings were as follows:
- For this parameter, one main line and one branch line were chosen. Then, the variation of track gauge parameters as a function of time and their moving averages are plotted. In terms of moving average, a deterioration of less than 5 mm was generally observed for the main line, while for the branch line, it was close to 10 mm, despite the main line having a higher traffic load.
- In addition, a further set of curves was examined and categorized according to the intervention size limits.
- Overall, regarding the curves on the main line—with the higher traffic load—the deterioration value of the track over time is less than that of the curves on branch lines. This is because the main line, due to the higher speeds, allowed stricter gauge limits, and more maintenance work on these lines maintenance work is performed on these lines.
- 5.
- Future research possibilities
The authors formulated ideas for future research as follows:
- During the preparation of this article, some sections have been transformed over time from an already occurring widening to a narrowing. To examine the deterioration, taking into account the curve radius categories, traffic loading, and curve radii;
- To investigate how the track gauge changes for small radius curves at lower permitted speeds or large radius curves at higher speeds under the same traffic load;
- The effect of the maintenance work on the track gauge, with particular reference to sleeper repairs and replacements;
- To consider special track sections, i.e., rail joints, turnouts, etc. [10,41,42,43,44].
Author Contributions
Conceptualization, S.F., D.N. and H.H.; methodology, S.F., D.N. and H.H.; software, S.F., D.N. and H.H.; validation, S.F., D.N. and H.H.; formal analysis, S.F., D.N. and H.H.; investigation, S.F., D.N. and H.H.; resources, S.F., D.N. and H.H.; data curation, S.F., D.N. and H.H.; writing—original draft preparation, S.F., D.N. and H.H.; writing—review and editing, S.F., D.N. and H.H.; visualization, S.F., D.N. and H.H.; supervision, S.F.; project administration, S.F.; funding acquisition, S.F. All authors have read and agreed to the published version of the manuscript.
Funding
This research received no external funding.
Data Availability Statement
Not applicable.
Acknowledgments
This paper was prepared by the research team “SZE-RAIL”. The authors thank the technical support of MÁV Ltd. and MÁV CRTI Ltd., among others, Csaba ÁGH (MÁV CRTI Ltd.), Dorottya KOVÁCS-BALÁZS (MÁV Ltd.).
Conflicts of Interest
The authors declare no conflict of interest.
Abbreviations
| 2D or 2-D | two dimensions or two dimensional |
| 3D or 3-D | three dimensions or three dimensional |
| 4G | fourth generation wireless |
| 5G | fifth generation wireless |
| AL | alarm limit |
| ANN | artificial neural network |
| BCC | beginning point of the circular curve |
| BT | beginning point of the transition curve |
| CC | circular curve |
| ECC | end point of the circular curve |
| EC | entire curve considering it between the beginning points of the transition curves or if there is not any transition curve, between the beginning and the very last point of the curve |
| ET | end point of the transition curve |
| EU | European Union |
| GD | Gauss-distribution or Gaussian-distribution |
| IAL | immediate action limit |
| ICP | iterative closest point |
| IL | intervention limit |
| IoT | internet of things |
| IoT-DTG | internet of things enhanced digital track gauge |
| KS | Kolmogorov–Smirnov |
| LCD | liquid crystal display |
| LD | lognormal distribution |
| LED | light emitting diode |
| Ltd. | Limited company |
| MÁV CRTI Ltd. | MÁV Central Rail and Track Inspection Ltd., Budapest, Hungary |
| MÁV or MÁV Ltd. | Hungarian State Railways Ltd., Budapest, Hungary |
| MGT | million gross tons |
| mov. avg. | moving average |
| MSE | mean squared error |
| ND | normal distribution |
| NND | non-normal distribution |
| RCF | rolling contact fatigue |
| RoLa | rolling road (trailers are transported on trains, original name: “rollende Strasse” in German language) |
| SGD | Singapore dollar |
| SIM | subscriber identity module |
| SVM | support vector regression |
| TC | transition curve |
| TSI | Technical Specification of Interoperability (see [40]) |
| Wi-Fi | wireless fidelity |
References
- Bunch, B.; Hellemans, A. The History of Science and Technology; Houghton Mifflin: Boston, MA, USA, 2004; ISBN 9780618221233. [Google Scholar]
- Kemp, E.L.; Metz, L.E.; Kapsch, R.J. Essays on the History of Transportation and Technology; West Virginia University Press: Morgantown, WV, USA, 2014; ISBN 9781938228810. [Google Scholar]
- Czére, B. A Vasút Története (The History of Railway); Corvina Kiadó: Budapest, Hungary, 1989. (In Hungarian) [Google Scholar]
- Gáspár, L. Lifetime Engineering Principles and Durable Roads. Int. J. Pavement Eng. Asph. Technol. 2016, 17, 58–72. [Google Scholar]
- Gáspár, L.; Bencze, Z. Long-Life Pavements—European and American Perspectives. New Build. Mater. Constr. World 2018, 24, 122–135. [Google Scholar]
- Gáspár, L.; Horvát, F.; Lublóy, L. Közlekedési Létesítmények Élettartama (Lifetime of Transport Facilities); Universitas-Győr Nonprofit Kft.: Győr, Hungary, 2011; ISBN 9789639819733. (In Hungarian) [Google Scholar]
- Tóth, C.; Primusz, P. Development of a Road Pavement Structure Diagnostic. Coatings 2022, 12, 1944. [Google Scholar] [CrossRef]
- Király, T.; Primusz, P.; Tóth, C. Simulation of Static Tyre–Pavement Interaction Using Two FE Models of Different Complexity. Appl. Sci. 2022, 12, 2388. [Google Scholar] [CrossRef]
- Fischer, S.; Kocsis Szürke, S. Detection Process of Energy Loss in Electric Railway Vehicles. Facta Univ. Ser. Mech. Eng. 2023. [Google Scholar] [CrossRef]
- Fischer, S.; Harangozó, D.; Németh, D.; Kocsis, B.; Sysyn, M.; Kurhan, D.; Brautigam, A. Investigation of Heat-Affected Zones of Thermite Rail Weldings. Facta Univ. Ser. Mech. Eng. 2023. [Google Scholar] [CrossRef]
- Nugymanova, G.; Nurgaliyeva, M.; Zhanbirov, Z.; Naumov, V.; Taran, I. Choosing a Servicing Company’s Strategy While Interacting with Freight Owners at the Road Transport Market. Nauk. Visnyk Natsionalnoho Hirnychoho Universytetu 2021, 1, 204–210. [Google Scholar] [CrossRef]
- Ramazan, B.; Mussaliyeva, R.; Bitileuova, Z.; Naumov, V.; Taran, I. Choosing the Logistics Chain Structure for Deliveries of Bulk Loads: Case Study of the Republic Kazakhstan. Nauk. Visnyk Natsionalnoho Hirnychoho Universytetu 2021, 3, 142–147. [Google Scholar] [CrossRef]
- Macura, D.; Laketić, M.; Pamučar, D.; Marinković, D. Risk Analysis Model with Interval Type-2 Fuzzy FMEA—Case Study of Railway Infrastructure Projects in the Republic of Serbia. Acta Polytech. Hung. 2022, 19, 103–118. [Google Scholar] [CrossRef]
- EN 13848-1; Railway Applications—Track—Track Geometry Quality—Part 1: Characterisation of Track Geometry. CEN European Committee for Standardization: Brussels, Belgium, 2008.
- Zheng, S.; Peng, L.; Zhong, Q.; Li, L. Gauge and Wear Detection Method for Portable Track Inspection Trolley. Zhendong Ceshi Yu Zhenduan J. Vib. Meas. Diagn. 2022, 42, 600–605. [Google Scholar] [CrossRef]
- Pay, Z.H.; Ng, A.K.; Zhang, Z.A. Design and Fabrication of an Internet of Things Enhanced Digital Track Gauge. In Proceedings of the 8th International Conference on Control, Automation and Robotics, ICCAR 2022, Xiamen, China, 8–10 April 2022; pp. 45–48. [Google Scholar]
- Yilmazer, M.; Karakose, M.; Aydin, I. Determination of Railway Track Gauge with Image Processing. In Proceedings of the 2021 International Conference on Data Analytics for Business and Industry, ICDABI 2021, Virtual, 25–26 October 2021; pp. 510–514. [Google Scholar]
- Zhang, G.; Ma, Z.; Yuan, J.; Kang, D.; Yan, D.; Li, J. Track Gauge Measurement Based on Wheel-Rail Lateral Relative Displacement. Guangdian Gongcheng Opto Electron. Eng. 2020, 47, 190252. [Google Scholar] [CrossRef]
- Shi, H.; Xu, M.; Yu, Z. Track Gauge Measurement Method Based on Least-Square Curve Fitting Theory. Tiedao Xuebao J. China Railw. Soc. 2019, 41, 81–88. [Google Scholar] [CrossRef]
- Tsubokawa, Y.; Ishikawa, T. Development of a Dynamic Track Measuring Device for Gauge and Twist to Reduce Derailment Accidents. WIT Trans. Built Environ. 2018, 181, 253–262. [Google Scholar] [CrossRef]
- Tang, W.B.; Long, Y.H.; Xie, Y.J.; Li, H.J.; Tang, C.B.; Zhang, Z.X. A Channel Rail Gauge Detection System of Modern Tram. In Proceedings of the 15th IEEE International Conference on Networking, Sensing and Control (ICNSC 2018), Zhuhai, China, 27–29 March 2018; pp. 1–5. [Google Scholar]
- Németh, D.; Horváth, H.; Movahedi, M.R.; Németh, A.; Fischer, S. Investigation of the Track Gauge in Straight Sections, Considering Hungarian Railway Lines. Acta Polytech. Hung. 2022, 19, 155–156. [Google Scholar] [CrossRef]
- Aharkov, O.V.; Tverdomed, V.M.; Boiko, V.D.; Kovalchuk, V.V.; Strelko, O.H. Influence of the Structural Design of Rail Fastenings on Ensuring the Stability of Track Gauge in Operating Conditions. In Proceedings of the IOP Conference Series: Materials Science and Engineering—8th International Scientific Conference on Reliability and Durability of Railway Transport Engineering Structures and Buildings, TRANSBUD 2019, Kharkiv, Ukraine, 20–22 November 2019; Volume 708, p. 012001. [Google Scholar]
- Ahac, M.; Lakusic, S. Tram Track Maintenance-Planning by Gauge Degradation Modelling. Transport 2015, 30, 430–436. [Google Scholar] [CrossRef]
- Akkerman, G.; Akkerman, S. Rail Gauge Trajectory, Macro and Micro Profile of Tracks. In Proceedings of the IOP Conference Series: Materials Science and Engineering—8th International Scientific Conference Transport of Siberia 2020, Novosibirsk, Russia, 22–27 May 2020; Volume 918, p. 012153. [Google Scholar]
- Falamarzi, A.; Moridpour, S.; Nazem, M.; Cheraghi, S. Prediction of Tram Track Gauge Deviation Using Artificial Neural Network and Support Vector Regression. Aust. J. Civ. Eng. 2019, 17, 63–71. [Google Scholar] [CrossRef]
- Jover, V.; Fischer, S. Statistical Analysis of Track Geometry Parameters on Tramway Line No. 1 in Budapest. Balt. J. Road Bridge Eng. 2022, 17, 75–106. [Google Scholar] [CrossRef]
- Jover, V.; Gaspar, L.; Fischer, S. Investigation of Tramway Line No. 1, in Budapest, Based on Dynamic Measurements. Acta Polytech. Hung. 2022, 19, 65–76. [Google Scholar] [CrossRef]
- Jóvér, V.; Sysyn, M.; Liu, J.; Fischer, S. Geometry Variation of Ballasted Railway Tracks Due to Weather Conditions. Nauk. Visnyk Natsionalnoho Hirnychoho Universytetu 2023, 2023, 74–79. [Google Scholar] [CrossRef]
- Jóvér, V.; Major, Z.; Németh, A.; Kurhan, D.; Sysyn, M.; Fischer, S. Investigation of “Open” Superstructure Tramway Tracks in Budapest. Infrastructures 2023, 8, 33. [Google Scholar] [CrossRef]
- Fischer, S.; Liegner, N.; Bocz, P.; Vinkó, Á.; Terdik, G. Investigation of Track Gauge and Alignment Parameters of Ballasted Railway Tracks Based on Real Measurements Using. Infrastructures 2023, 8, 26. [Google Scholar] [CrossRef]
- MÁV CRTI Ltd. Track Diagnostics—FMK 004 Track Geometry Measuring Car. Available online: http://www.mavkfv.hu/index.php?f=vaganydiagnosztika_fmk004 (accessed on 28 March 2023).
- MÁV CRTI Ltd. Track Diagnostics—FMK-007 Track Measuring Wagon. Available online: http://www.mavkfv.hu/index.php?lngchg=en&f=vaganydiagnosztika_fmk007 (accessed on 28 March 2023).
- GKM 103/2003; (XII. 27.) GKM Rendelet a Hagyományos Vasúti Rendszerek Kölcsönös Átjárhatóságáról ((XII.27.) Decree of the Minister of Economy and Transport about the Mutual Travarsability of the Conventional Railway Systems). Minister of Economy and Transport: Budapest, Hungary, 2003; pp. 12813–12894. (In Hungarian)
- KÖZDOK. Országos Közforgalmú Vasutak Pályatervezési Szabályzata (Track Alignment Design Regulation of National Public Railways); KÖZDOK: Budapest, Hungary, 1983; pp. 1–185. (In Hungarian) [Google Scholar]
- Hungarian State Railways. D.54, Construction and Track Maintenance Technical Data, Regulations; Hungarian State Railways: Budapest, Hungary, 1988. [Google Scholar]
- EN 13848-2; Railway Applications—Track—Track Geometry Quality—Part 2: Measuring Systems—Track Recording Vehicles. CEN European Committee for Standardization: Brussels, Belgium, 2006.
- EN 13848-6; Railway Applications—Track—Track Geometry Quality—Part 6: Characterisation of Track Geometry Quality. CEN European Committee for Standardization: Brussels, Belgium, 2014.
- EN 13848-5; Railway Applications—Track—Track Geometry Quality—Part 5: Geometric Quality Levels—Plain Line, Switches and Crossings. CEN European Committee for Standardization: Brussels, Belgium, 2017.
- European Commission Regulation (EU) No 1299/2014 of 18 November 2014 on the Technical Specifications for Interoperability Relating to the ‘Infrastructure’ Subsystem of the Rail System in the European Union Text with EEA Relevance. Available online: https://eur-lex.europa.eu/legal-content/EN/TXT/PDF/?uri=CELEX:32014R1299&from=EN (accessed on 8 March 2023).
- Kuchak, A.; Marinkovic, D.; Zehn, M. Finite Element Model Updating—Case Study of a Rail Damper. Struct. Eng. Mech. 2020, 73, 27–35. [Google Scholar] [CrossRef]
- Kuchak, A.T.J.; Marinkovic, D.; Zehn, M. Parametric Investigation of a Rail Damper Design Based on a Lab-Scaled Model. J. Vib. Eng. Technol. 2021, 9, 51–60. [Google Scholar] [CrossRef]
- Szalai, S.; Eller, B.; Juhász, E.; Movahedi, R.M.; Németh, A.; Harrach, D.; Baranyai, G.; Fischer, S. Investigation of Deformations of Ballasted Railway Track during Collapse Using the Digital Image Correlation Method (DICM). Rep. Mech. Eng. 2022, 3, 258–282. [Google Scholar] [CrossRef]
- Németh, A.; Fischer, S. Investigation of the Glued Insulated Rail Joints Applied to CWR Tracks. Facta Univ. Ser. Mech. Eng. 2021, 19, 681–704. [Google Scholar] [CrossRef]


Disclaimer/Publisher’s Note: The statements, opinions and data contained in all publications are solely those of the individual author(s) and contributor(s) and not of MDPI and/or the editor(s). MDPI and/or the editor(s) disclaim responsibility for any injury to people or property resulting from any ideas, methods, instructions or products referred to in the content. |
© 2023 by the authors. Licensee MDPI, Basel, Switzerland. This article is an open access article distributed under the terms and conditions of the Creative Commons Attribution (CC BY) license (https://creativecommons.org/licenses/by/4.0/).