Article

Experimental Application of the Italian Bridge Guidelines to a Stock of Prestressed Concrete Bridges

1
Department of Architecture and Civil Engineering, University of Catania, Via S. Sofia 64, 95123 Catania, Italy
2
Department of Engineering, University of Messina, Vill. Sant’Agata, 98100 Messina, Italy
*
Author to whom correspondence should be addressed.
Infrastructures 2024, 9(11), 196; https://doi.org/10.3390/infrastructures9110196
Submission received: 9 October 2024 / Revised: 26 October 2024 / Accepted: 28 October 2024 / Published: 31 October 2024
(This article belongs to the Section Infrastructures Inspection and Maintenance)

Abstract

:
This study applies the first three levels of analysis outlined in the recent Italian Bridge Guidelines to a stock of prestressed concrete bridges located along the highways connecting the cities of Palermo, Messina and Catania in Sicily, south of Italy. The examined levels of analysis include census, visual inspection and determination of the structural–foundational and seismic Classes of Attention of bridges and viaducts. Data of the census and visual inspection activities were gathered using a custom-made web application. The details, the methodologies and all the features implemented in the web platform were illustrated and discussed. Furthermore, the collected data were described and critically analyzed, offering insights into the strength and limitations of each of the three examined levels of analysis of the Italian Bridge Guidelines. Finally, based on the detected defects and their numerousness with respect to the total number of assessed bridges, the authors proposed a straightforward and practical methodology for prioritizing any subsequent repairing intervention on specific groups of bridges.

1. Introduction

Bridges and viaducts are considered critical assets of the road infrastructure due to their role in the operation of the whole network and, at the same time, to the existence of numerous factors that may impair their functionality. In particular, the lack of maintenance and/or the increase in traffic loads over the service life of the asset (e.g., due to heavier vehicles or more intense traffic) may cause it to degrade prematurely. Therefore, the structural vulnerability, as well as the associated economic and social costs, grow quickly. The infrastructure heritage of Italy is one of the oldest in Europe, and, furthermore, the Italian territory is prone to different natural hazards like earthquakes, landslides and floods. Despite this challenge, only a few Italian Regions and management bodies have invested in risk assessment of bridges e.g., through agreements with academic research groups [1,2,3].
In Italy, since the Polcevera viaduct (also known as “Morandi” bridge) collapsed in 2018 [4], the management and maintenance of bridges have become issues of extreme interest. In 2020, the Italian Ministry of Sustainable Infrastructure and Mobility (MIT) issued the first version of the “Guidelines for the classification and management of risk, safety evaluation, and monitoring of existing bridges” [5], in the following referred to as the Italian Bridge Guidelines (IBGs). In 2022, the current version of the IBGs was released [6] following a period of experimental application on Italian highways. One of the main goals of the IBGs is to offer a tool for the prioritization of maintenance activities to management bodies. To this aim, the IBGs introduced standard and uniform methodologies for the risk assessment of existing bridges and for monitoring and maintenance activities. In the framework of the IBGs, the “risk” is intended as the possibility of undergoing losses due to failure or reduced functionality of the asset. The evaluation of the overall risk is subdivided in four different categories: (1) structural and foundational risk (i.e., the risk associated with the degradation induced by traffic loads and environmental factors), (2) seismic risk, (3) landslide risk and (4) flood risk.
Due to the great number of bridges and viaducts existing on the Italian territory, the IBGs exploit a multi-level approach with six levels of analysis (ranging from Level 0 to Level 5). With an increase in the level of analysis, the amount of the required information and the complexity of the analysis also increase, while the number of the involved bridges decreases. The first three levels of analysis encompass a series of documental and in situ investigations aimed at collecting information to characterize the hazard (e.g., frequency of heavy vehicle traffic, intensity of the peak ground acceleration), the vulnerability (e.g., structural scheme, level of defectiveness) and the exposure (e.g., average daily traffic, presence of alternative paths) of the bridge for the risks under examination. This information is processed by pre-defined logical flows to obtain the “Class of Attention” (CoA) of the bridge. The CoA can assume five grades, namely, high, medium-high, medium, medium-low or low. Depending on the value of the CoA resulting from the IBG process, the management body establishes the subsequent actions to be implemented on the analyzed bridges (e.g., traffic limitation, conduction of further investigations or adoption of a monitoring system). Note that the management bodies are required to apply these three levels of analysis to all the bridges and viaducts under their management. The application of the subsequent levels depends on the actual condition of the single asset.
The literature about the application of IBGs is mainly focused on the first three levels of analysis (L0, L1 and L2). For instance, Scalbi et al. [7] presented an application of IBGs to a set of sixteen Prestressed Concrete (PC) bridges located in the Lombardia and Calabria Regions. As a result of the use of the IBGs, the above researchers underlined the relevance of the maintenance strategies in the through-life management of structures. Zizi et al. [8] applied the IBGs to a group of sixty road bridges of the Province of Caserta (located in the Campania Region). Based on the collected results, these researchers proposed a new methodology to define an inspection priority ranking. Grieco et al. [9,10] suggested an index-based methodology for the disaster risk assessment of existing bridge portfolios, accounting for a variety of natural and human-made hazards and their potential impact on the roadway network and applied their methodology to a set of bridges located in northern Italy.
This paper presents the results of the first three levels of analysis of the IBGs on a stock of PC bridges located in Sicily, Italy and belonging to the A18 and A20 highways. These results are part of a broader experimental campaign commissioned by the management body of Sicilian highways (Consorzio Autostrade Siciliane, CAS). This campaign is one of the first experimentations of the IBGs carried out in Italy on a large stock of bridges [5,6].
To manage the large set of data involved in the implementation of the IBG procedures, a web platform was developed [11]. The web application processes the collected data and automatically computes the CoA of the bridge under examination. Further, the web application allows the user to filter the data and draw up statistics. The results are displayed through a Graphical User Interface (GUI) in the form of histograms and/or pie charts. The possibility to query the data collected in the web application highlighted the finding that groups of bridges with similar intrinsic characteristics are more likely to develop similar defects and thus require similar maintenance interventions. Based on this observation, a new defect index was introduced in this study as a tool for the prioritization of interventions on bridges. The proposed index allows the management bodies to schedule a plan of interventions on groups of bridges with the same intrinsic characteristics and affected by similar defects. Over time, the adoption of this approach can reduce the number of bridges for which an analysis of Level 3 (or higher) will be required.
The authors note that the analyses presented in this paper refer to the entire stock of the considered viaducts and bridges, without any reference to a single one. The use of the results of census and visual inspections is authorized by the data owner (CAS). Based on the results of the visual inspections, the CAS carried out proper restoration works on their bridges to ensure adequate safety levels.

2. Overview of the IBGs for Existing Bridges

The IBGs adopt a multi-level approach consisting of six levels of analyses (from L0 to L5). Each level requires different actions with increasingly accurate investigations, as summarized in the following:
-
L0. Census of the bridges/viaducts of the road network under examination. This step involves the collection of basic information (e.g., geolocation, geometrical data, structural typology, design code) and the research and acquisition of documentation (e.g., executive drawings, calculation reports, documentation of previous maintenance works).
-
L1. Collection of the information needed to characterize the hazard (e.g., frequency of heavy vehicle traffic, intensity of the peak ground acceleration), the vulnerability (e.g., structural scheme, level of defectiveness) and the exposure (e.g., average daily traffic, presence of alternative paths) of the bridge for the risks under examination. At this level, visual inspections are required to collect the information concerning the state of conservation of the bridge. During the inspection, a qualified operator examines the structural and non-structural parts of the bridge/viaduct and fills in a checklist of pre-defined defects for each structural element, plus a form for all the non-structural elements. Also, the operator verifies the structural and geometric characteristics reported in the documentation of the bridge (if available), as well as the geomorphological and hydraulic properties of the involved area. In this phase, “Critical Elements” (CEs) of the bridge are identified by the inspector as the physical elements or conditions whose inherent fragility combined with a high level of defectiveness can impact the overall behavior of the bridge.
-
L2. Elaboration of the information collected in the previous levels though pre-defined logical flows to obtain the “Class of Attention” (CoA) for each of the four categories of risk [i.e., structural–foundational (CoA-SF), seismic (CoA-S), landslide (CoA-L) and flood (CoA-F)] and, finally, the synthetic value of the CoA. Based on the synthetic value of the CoA, a decision can be made on subsequent actions to be implemented (e.g., traffic limitation, further inspection campaigns, refurbishment interventions). In particular, specific inspection campaigns are mandatory for bridges with medium or medium-high CoAs, whereas accurate structural assessments (L4) are required for bridges with high CoA.
Depending on the CoA resulting from the analysis of Level 2, the higher levels of analysis may be activated. These levels are defined as follows:
-
L3. Preliminary structural assessment of the structure in order to recognize the need for a detailed analysis of level L4. The numerical calculations required at level L3 aim to estimate the minimum safety level required by the codes at the time of construction of the bridge compared with the safety level required by the current Italian construction code (NTC18) [12].
-
L4. Accurate structural assessment of the bridge/viaduct according to NTC18 and the IBGs. The IBGs identify three different conditions —“passable”, “operative”, and “adequate”— for an existing bridge as a function of the vehicle load models and the safety level resulting from the L4 assessment. The “passable” condition is related to a maximum time of 5 years, during which the design and execution of safety works must be completed, and, contextually, the limitations of bridge utilization are applied. The “operative” condition is related to an assessment that is performed considering vehicle load models in a period of 30 years. Finally, the bridge is considered “adequate” when the requirements of NTC18 are satisfied.
-
L5. Accurate transportation assessment of the bridge/viaduct within the road network to which it belongs. This level of analysis is currently only established but not yet covered by the IBGs.
In addition to the visual inspections reported in Level 1, the IBGs also consider “Special Inspections”. These inspections are targeted at bridges that fall in areas with evidence of landslides and/or alluvial phenomena and at post-tensioned concrete bridges. Indeed, for these latter typology, visual inspections and common non-destructive investigation techniques may not provide a sufficient description of the actual state of degradation of the post-tensioning system [13]. Depending on the findings of the Special Inspection, the assessment may progress through Level 1 as per the normal case or go directly to a Level 4 detailed assessment. Insights about the Special Inspections are out of the scope of this paper.
This study focuses on the levels of the IBGs as related to the classification of risks and planning of interventions, i.e., L0, L1 and L2. The visual inspections carried out on the stock of bridges investigated in this study were aimed at the evaluation of the structure–foundation (CoA-SF) and seismic (CoA-S) risks only. Consequently, the CoAs related to the other risks (CoA-L and CoA-F) are not discussed in this paper.

3. The Stock of PC Bridges

The protocols of the IBGs were applied to a stock of 301 PC bridges. These bridges belong to the A18 and A20 highways, which connect the cities of Messina and Catania (east side of the Sicily Island) and Messina and Palermo (north side of the Sicily Island), respectively. Both A18 and A20 were completed in the early 1970s and are more than 50 years old. Even though the north and east coast territories of Sicily have been affected by relevant seismic events during the last century (e.g., the Messina strait earthquake in 1908), the bridges of both A18 and A20 were designed and built without significant seismic provisions.
Although the stock under examination consists of different typologies of bridges—the simply supported one is the predominant—made with different materials and construction techniques [e.g., deck with Reinforced Concrete (RC), PC or Steel–Concrete (SC) beams], the PC technology is the most frequent [14,15]. A typical example of a PC bridge on the A18 and A20 highways is shown in Figure 1. Indeed, the predominance of the PC technology as a construction technique for bridges is recurrent throughout the whole Italian infrastructure heritage. Santasiero et al. [16] examined a portion of the State Road SS 658, connecting the towns of Potenza and Melfi in the Basilicata Region (Southern Italy), analyzing a stock of 48 bridges. A total of 71% of the stock examined by the researchers (34 bridges) were built using the PC construction technique. The Fabre Consortium [17] recently published the first results of the experience carried out for the implementation of the IBGs on a large inventory of bridges distributed over the Italian territory, which is mainly made up of PC structures. As a further confirmation, 95% of the Italian bridge database maintained by the Eucentre foundation [18] is made of PC bridges. In addition, a PC bridge can be pre- or post-tensioned, and this characteristic is a key difference because the pre-tensioned system, which is usually made up of sub-horizontal cables in precast girders, is a little exposed to corrosion phenomena. A post-tensioned girder, instead, could be prone to corrosion because the tensioning of cables is carried out on site, and, especially for old structures, it is a source of specific defects, like the leakage of grout, that can facilitate strand corrosion. The post-tensioned system is widespread along highway A20, where several PC bridges/viaducts of significant length are present. Highway A18 is, instead, characterized by several precast bridges/viaducts built with the pre-tensioned system.

3.1. Database Collection

The census activity and the visual inspections required by Level 0 and Level 1 of the IBGs were carried out by qualified inspectors, designated by CAS following an open and competitive selection. The results of these activities were returned in the form of photos and spreadsheet files. Initially, the data were checked by an algorithm programmed to search for incorrect or missing entries or unexpected types of data. This preliminary check highlighted some common filling-in issues. For example, a common error encountered in the census form (L0) and in the descriptive form (L1) consists of the entry of incorrect geographical coordinates of the bridge location that were incorrect or provided in an inappropriate reference system. Also, in the case of open-answer fields, the lack of a predetermined list of allowed responses and the absence of a user manual to guide the inspector caused non-homogeneous or ambiguous compilation. In addition, the operators must indicate the extension (k1) and intensity (k2) of the detected defects by filling out a predetermined form (see an example in Figure 2) in which the admissible values are 0.2, 0.5 and 1. However, it was found that the operators sometimes provided values of k1 and k2 factors equal to 0.2 and 0.5 even in cases where the inspection form (L1) allowed the entry of a unit value only.

3.2. The Web Platform

In order to easily update, manipulate, filter and query the database, a customized web application was developed. A web application was based on the “Software as a Service” (SaaS) model, which consists of hosting a software in a cloud environment (client-server architecture). The client part of the web application, running on the browser of the user, held the functions of acquiring and displaying information; the server part, usually resident on a remote computer, received the input data and provided the client with the processed data, formatted in JavaScript Object Notation (JSON) format. The client was a HTML5/CSS/JavaScript front-end arranged in several reusable components designed in a responsive way to adapt the view at the devices commonly available in the current market. All the data were stored on a server, where a MySQL relational database was installed and managed through customized PHP scripts. The exchange of data between client and server was available through an API system [19], which was designed to perform queries to the database retrieving and processing the selected data. Compared to classic desktop applications, this model offers significant advantages in both terms of use and maintenance. In fact, it allows the user to access and use the web application from anywhere through an internet-connected device and a personal account. Further, since the software runs on a remote server, the resources of the local client are preserved. Finally, since no local software installation is required, it is possible to develop and maintain a single version of the software.
The bridge data were organized in a tree-structure of folders and subfolders, with the main folders named after the highway and the subfolders labeled with the name of each bridge. In the GUI, the data of the single bridge were organized in collapsible forms, one for each level of analysis (L0, L1 or L2), according to the scheme proposed by the IBGs (Figure 2). The GUI allowed both the visualization and editing of each datum (i.e., input, modification and elimination). The entry or change in a data item triggered the re-calculation of the CoA. The same data stock can also be visualized in a map view, as shown in Figure 3, in the case of the bridges of A18.

3.3. Geometrical Properties of PC Bridges

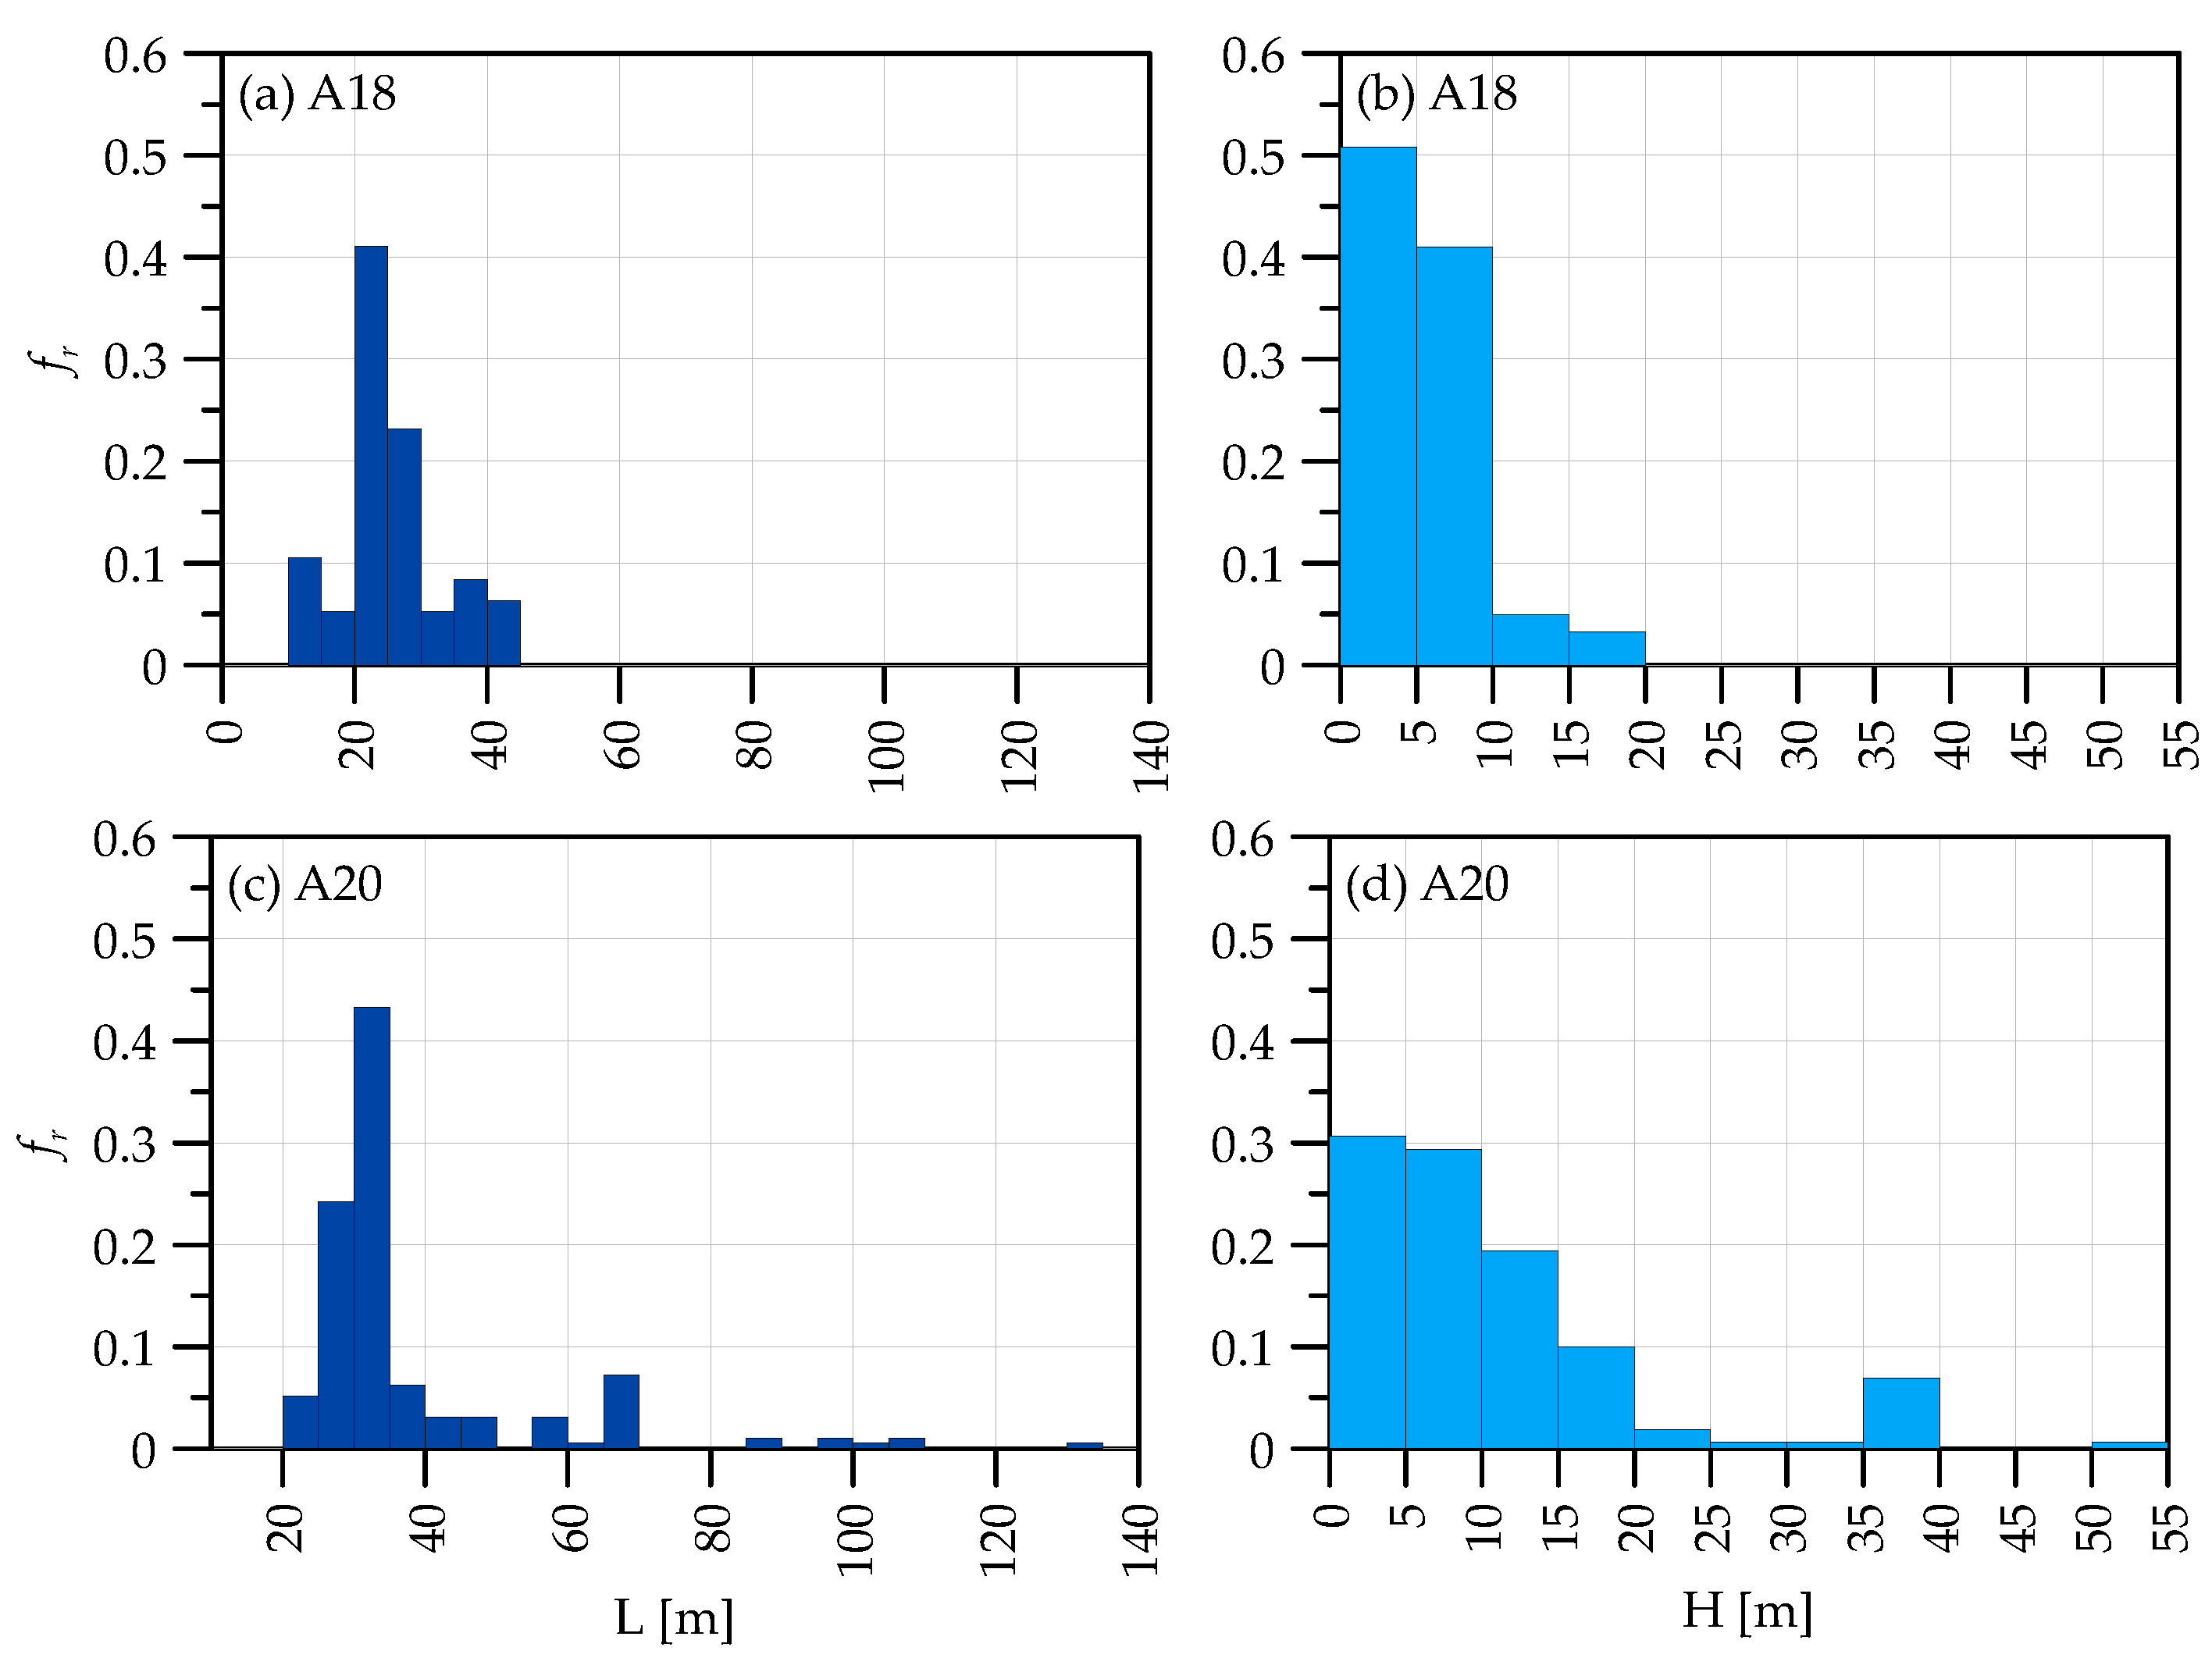
The maximum length of the girder, which is defined as the longest of the span lengths between two consecutive supports of the bridge, and the maximum height of the piers are the parameters chosen to characterize the geometry of the 301 investigated bridges. In detail, Figure 4 shows the relative frequency of the values of the maximum girder length and the maximum pier height for the investigated bridges of A18 and A20. The maximum girder length is often in the range from 20 to 30 m for bridges belonging to A18 and in the range from 25 to 35 m for those belonging to A20. However, in a few bridges belonging to A20, the length of the girder exceeds 100 m. The maximum pier height is always less than or equal to 20 m for the bridges of highway A18, with a predominance in the range from 0 to 10 m. Piers belonging to bridges of A20 have a maximum height up to 55 m, with a predominance in the range from 0 to 15 m. Note that the maximum height of the piers is dependent on the presence of hills and/or valleys and is highly influenced by the morphology of the territory.

4. Risk Analysis of the PC Bridges

In this research work, the CoA of each bridge is evaluated for the structural–foundational risk and for the seismic risk. The evaluation of these risks depends on hazard, vulnerability, and exposure parameters, which are, in turn, subdivided into primary and secondary parameters as provided in the IBGs. Specifically, primary parameters are used to formulate a preliminary evaluation of the hazard/vulnerability/exposure level for the risk under examination. This preliminary evaluation is then modified according to secondary parameters to obtain the final value of the hazard/vulnerability/exposure level (i.e., the hazard/vulnerability/exposure class). The evaluation is based on a scale of five grades that includes low, medium-low, medium, medium-high and high grades.
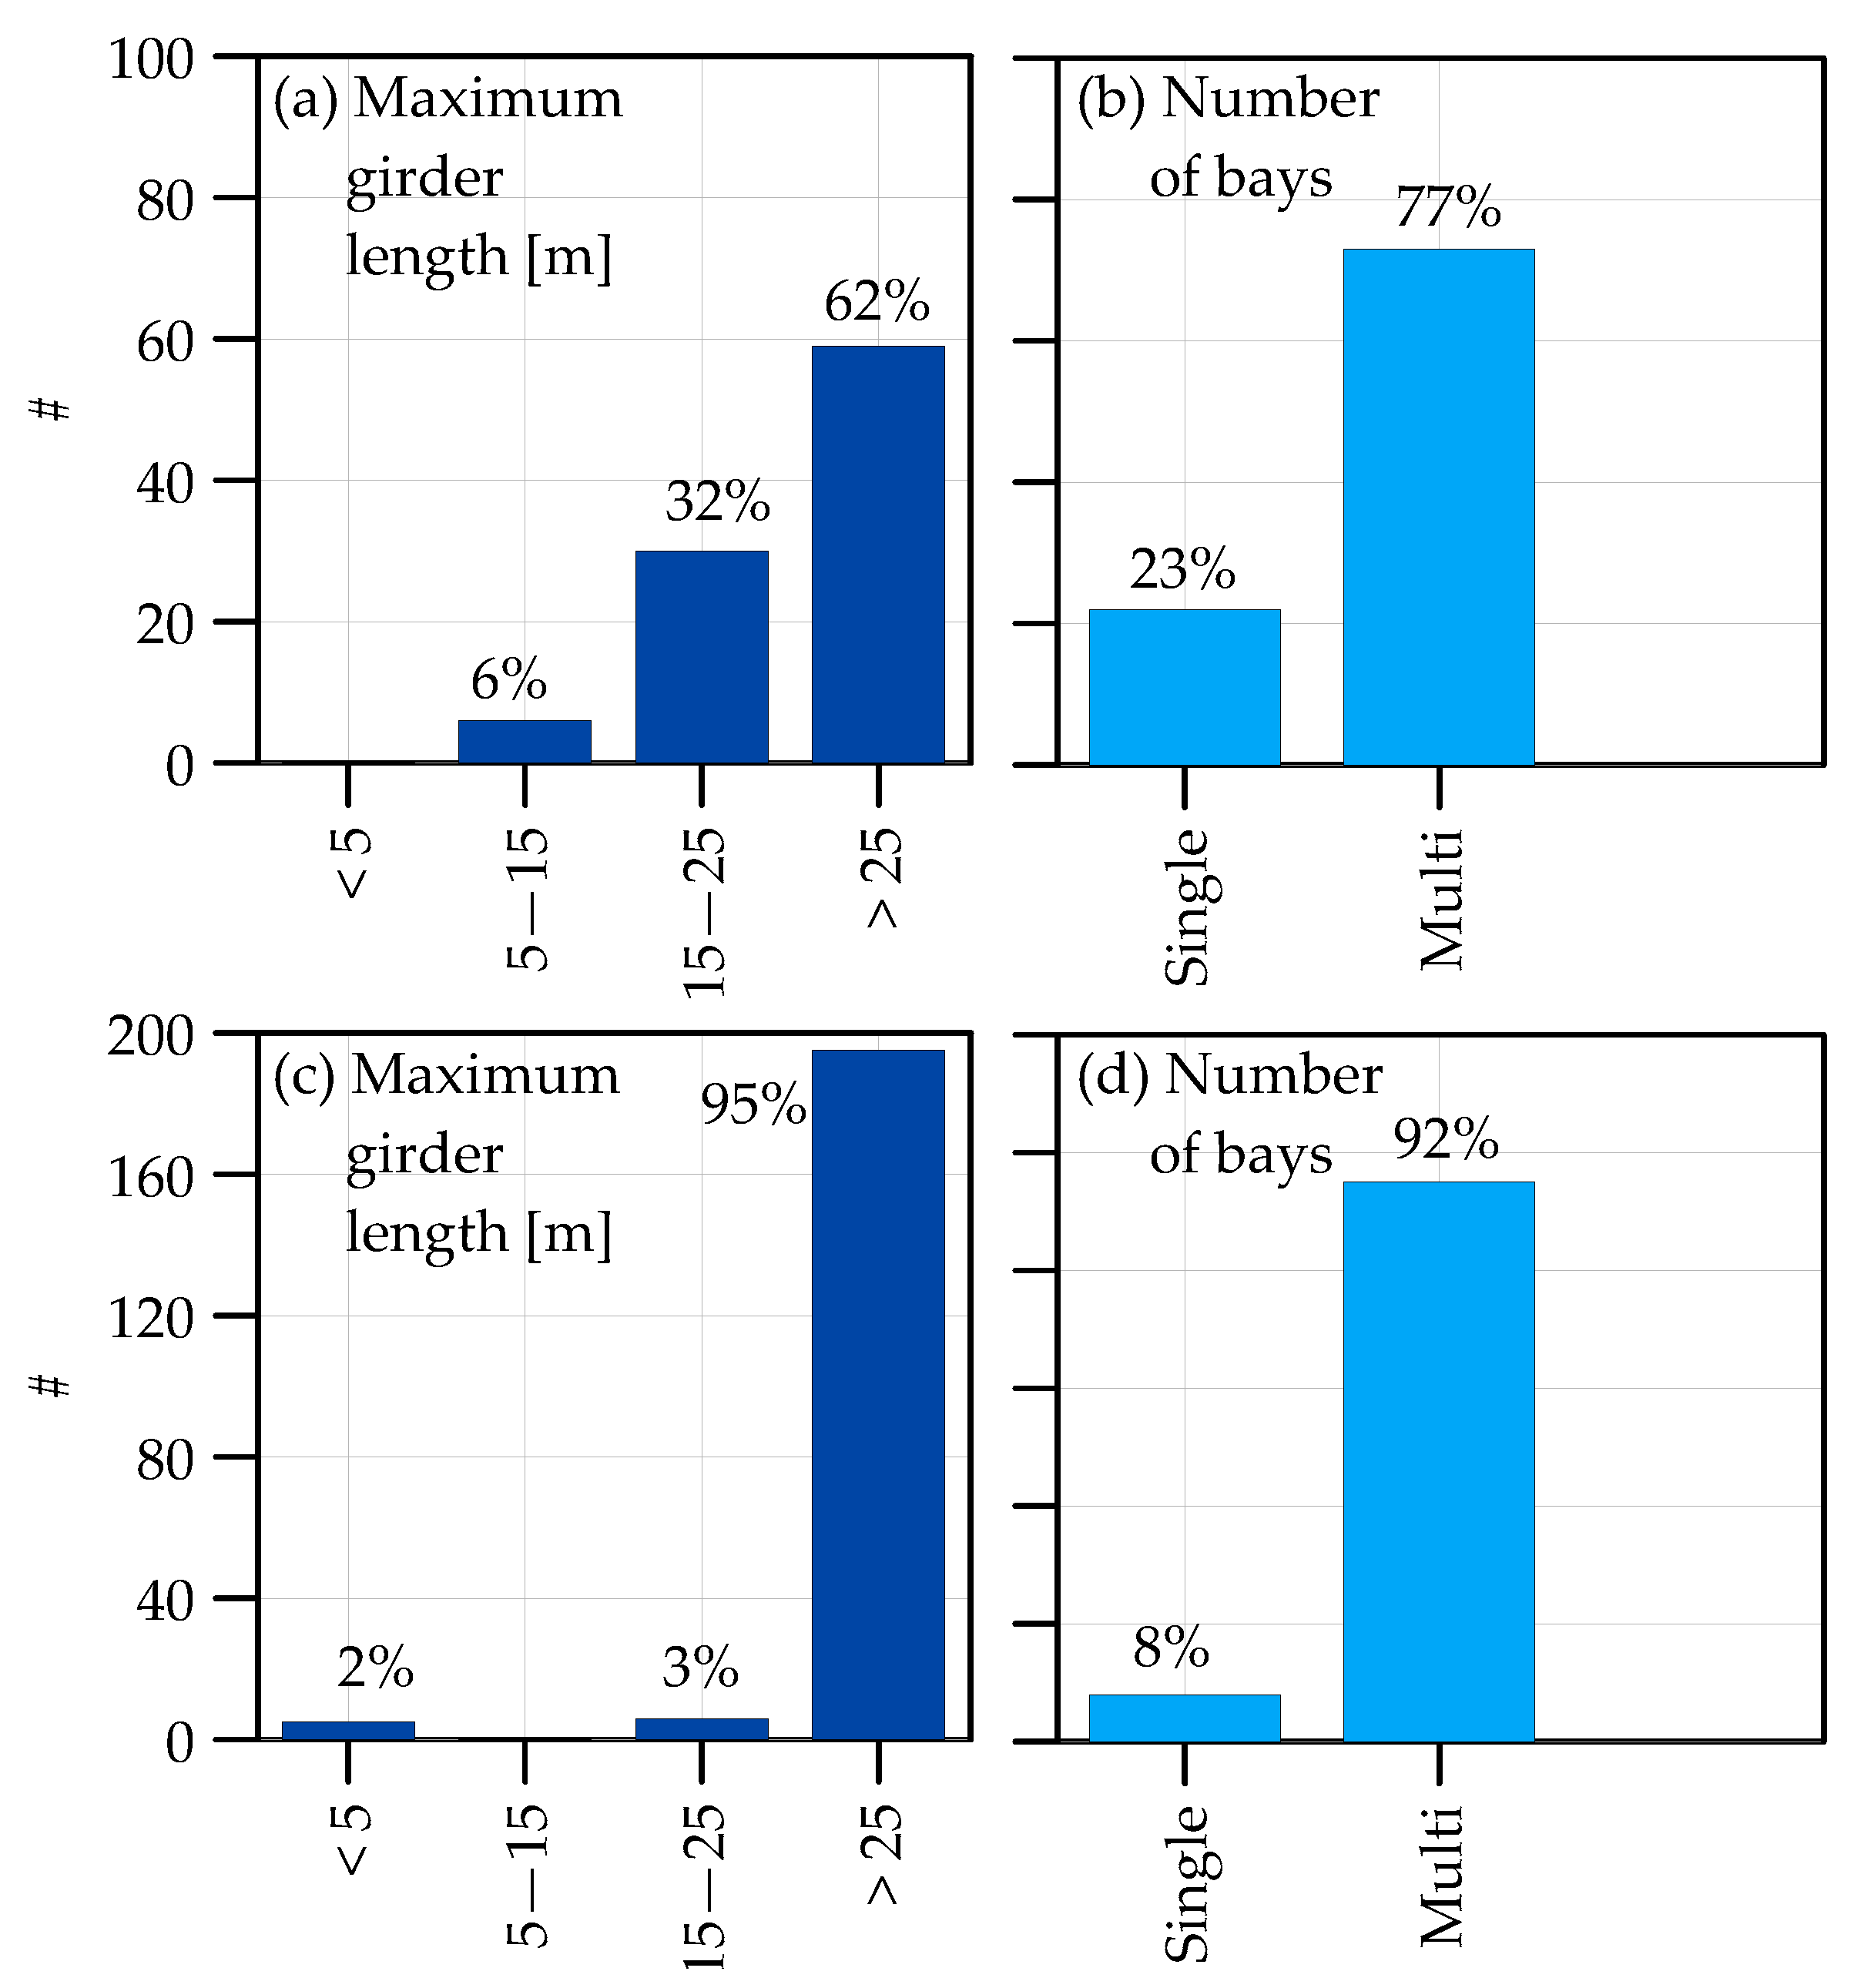
The primary parameters that define the hazard for the structural–foundational risk are the maximum permissible mass of vehicles and the transit frequency of commercial vehicles (i.e., vehicles with carrying capacity greater than 3.5 t). In this case, no secondary parameters are provided by the IBGs. The primary vulnerability parameters consist of the basic structural characteristics of the bridge (i.e., static scheme, maximum girder length, number of bays) and its level of defectiveness. The evaluation of this latter parameter is discussed in more detail in the following section. Secondary parameters consist of information about the rapidity with which degradation phenomena evolve (i.e., construction period) and the code considered for design. Note that, according to IBG provisions, the presence of a certain level of defectiveness is considered more severely for recent bridges designed according to recent codes. This severe consideration is because, the level of defectiveness being equal, the progression of degradation is faster in newer bridges. The static scheme is the same for all investigated structures, while the number of PC bridges with different maximum girder lengths and number of bays is reported in Figure 5. It is clear that the morphology of the territory influences these characteristics of bridges/viaducts. Most of the PC bridges of highway A20 are multi-span and have a maximum girder length greater than 25 m. This finding is also confirmed by Figure 4, which shows the relative frequencies of the girder length. Highway A18 has, instead, a reduced number of multi-span PC bridges/viaducts with respect to highway A20. Also, the maximum length girder is distributed between the various ranges of length considered.
The exposure primarily depends on the Average Daily Traffic (ADT) and average span length. The preliminary value of the exposure parameter is modified depending on the existence of alternative routes, the typology of the bypassed obstacle (e.g., roads, rivers, valleys) and transit of hazardous materials.
The hazard associated with the seismic risk is a function of the local properties of the site, both in terms of Peak Ground Acceleration (PGA), topographic category (primary parameters) and subsoil stratigraphy (secondary parameter). The vulnerability level associated with seismic risk depends on the same parameters that define the vulnerability in the case of a structural–foundational risk. The only difference is the possible presence of CEs that are defined for the CoA-S. Similarly, the exposure level is evaluated based on the same parameters used in the case of a structural–foundational risk. However, in the case of a seismic risk, the preliminary exposure level is adjusted depending on a further secondary parameter, i.e., the inclusion of the bridge in a strategic infrastructure plan of emergency.
The estimation of the transit frequency of commercial vehicles and of the ADT has been made based on the count of all vehicles passing through the toll stations along both A18 and A20 highways. These data were provided by CAS. The analysis of the traffic data highlighted that the number of vehicles/days was always high (i.e., more than 700) on A18 highway, while, on highway A20, the average number of the transits per day was medium (i.e., between 300 and 700) from tollgates 1 to 14 and low from tollgates 14 to 28 (i.e., less than 300) [14,15].
The value of PGA was indicated by the inspectors based on the national seismic hazard map, while the subsoil stratigraphy was assumed as the worst condition in accordance with the standard code [12] due to the lack of specific data. Figure 6 reports the number of PC bridges of highways A18 and A20, respectively, for different values of PGA at the bedrock. Several bridges of highway A18 are localized on sites with high values of PGA (i.e., >0.25), while a large number of bridges, belonging to highway A20, are on sites with medium-high values of PGA (i.e., between 0.15 and 0.25).

4.1. Evaluation of the Level of Defectiveness

The evaluation of the level of defectiveness is a function of both the results of the visual inspections and the criteria indicated in the IBGs. For each type of structural element (i.e., slab, girder, pier, abutment, etc.), the IBGs provide a specific form with a pre-established list of defects (defect forms). During the inspection, a qualified inspector identifies all the structural elements of the bridge and fills in a defect form for each one of them. This procedure was introduced in the latest version of the IBGs [6]. According to the previous version of the IBGs [5], the inspectors were allowed to report the observations relative to a homogeneous group of elements on a single defect form (e.g., a single form for the girders, a single form for the slabs, etc.). The data concerning the defectiveness level used in this paper were collected according to this latter procedure.
All the defects reported in the defect forms are listed in an official document attached to the IBGs. In this document, each defect came with a brief description, a unique identification code and a pre-defined “grade of importance” (G), ranging from 1 to 5. For each defect on the defect form, the inspector assigned a value to the extension (k1) and intensity (k2) factors. In addition, in the case of defects characterized by high values of G (i.e., 4 or 5), the inspector may report whether the detected defect has the potential to affect the static condition of the bridge.
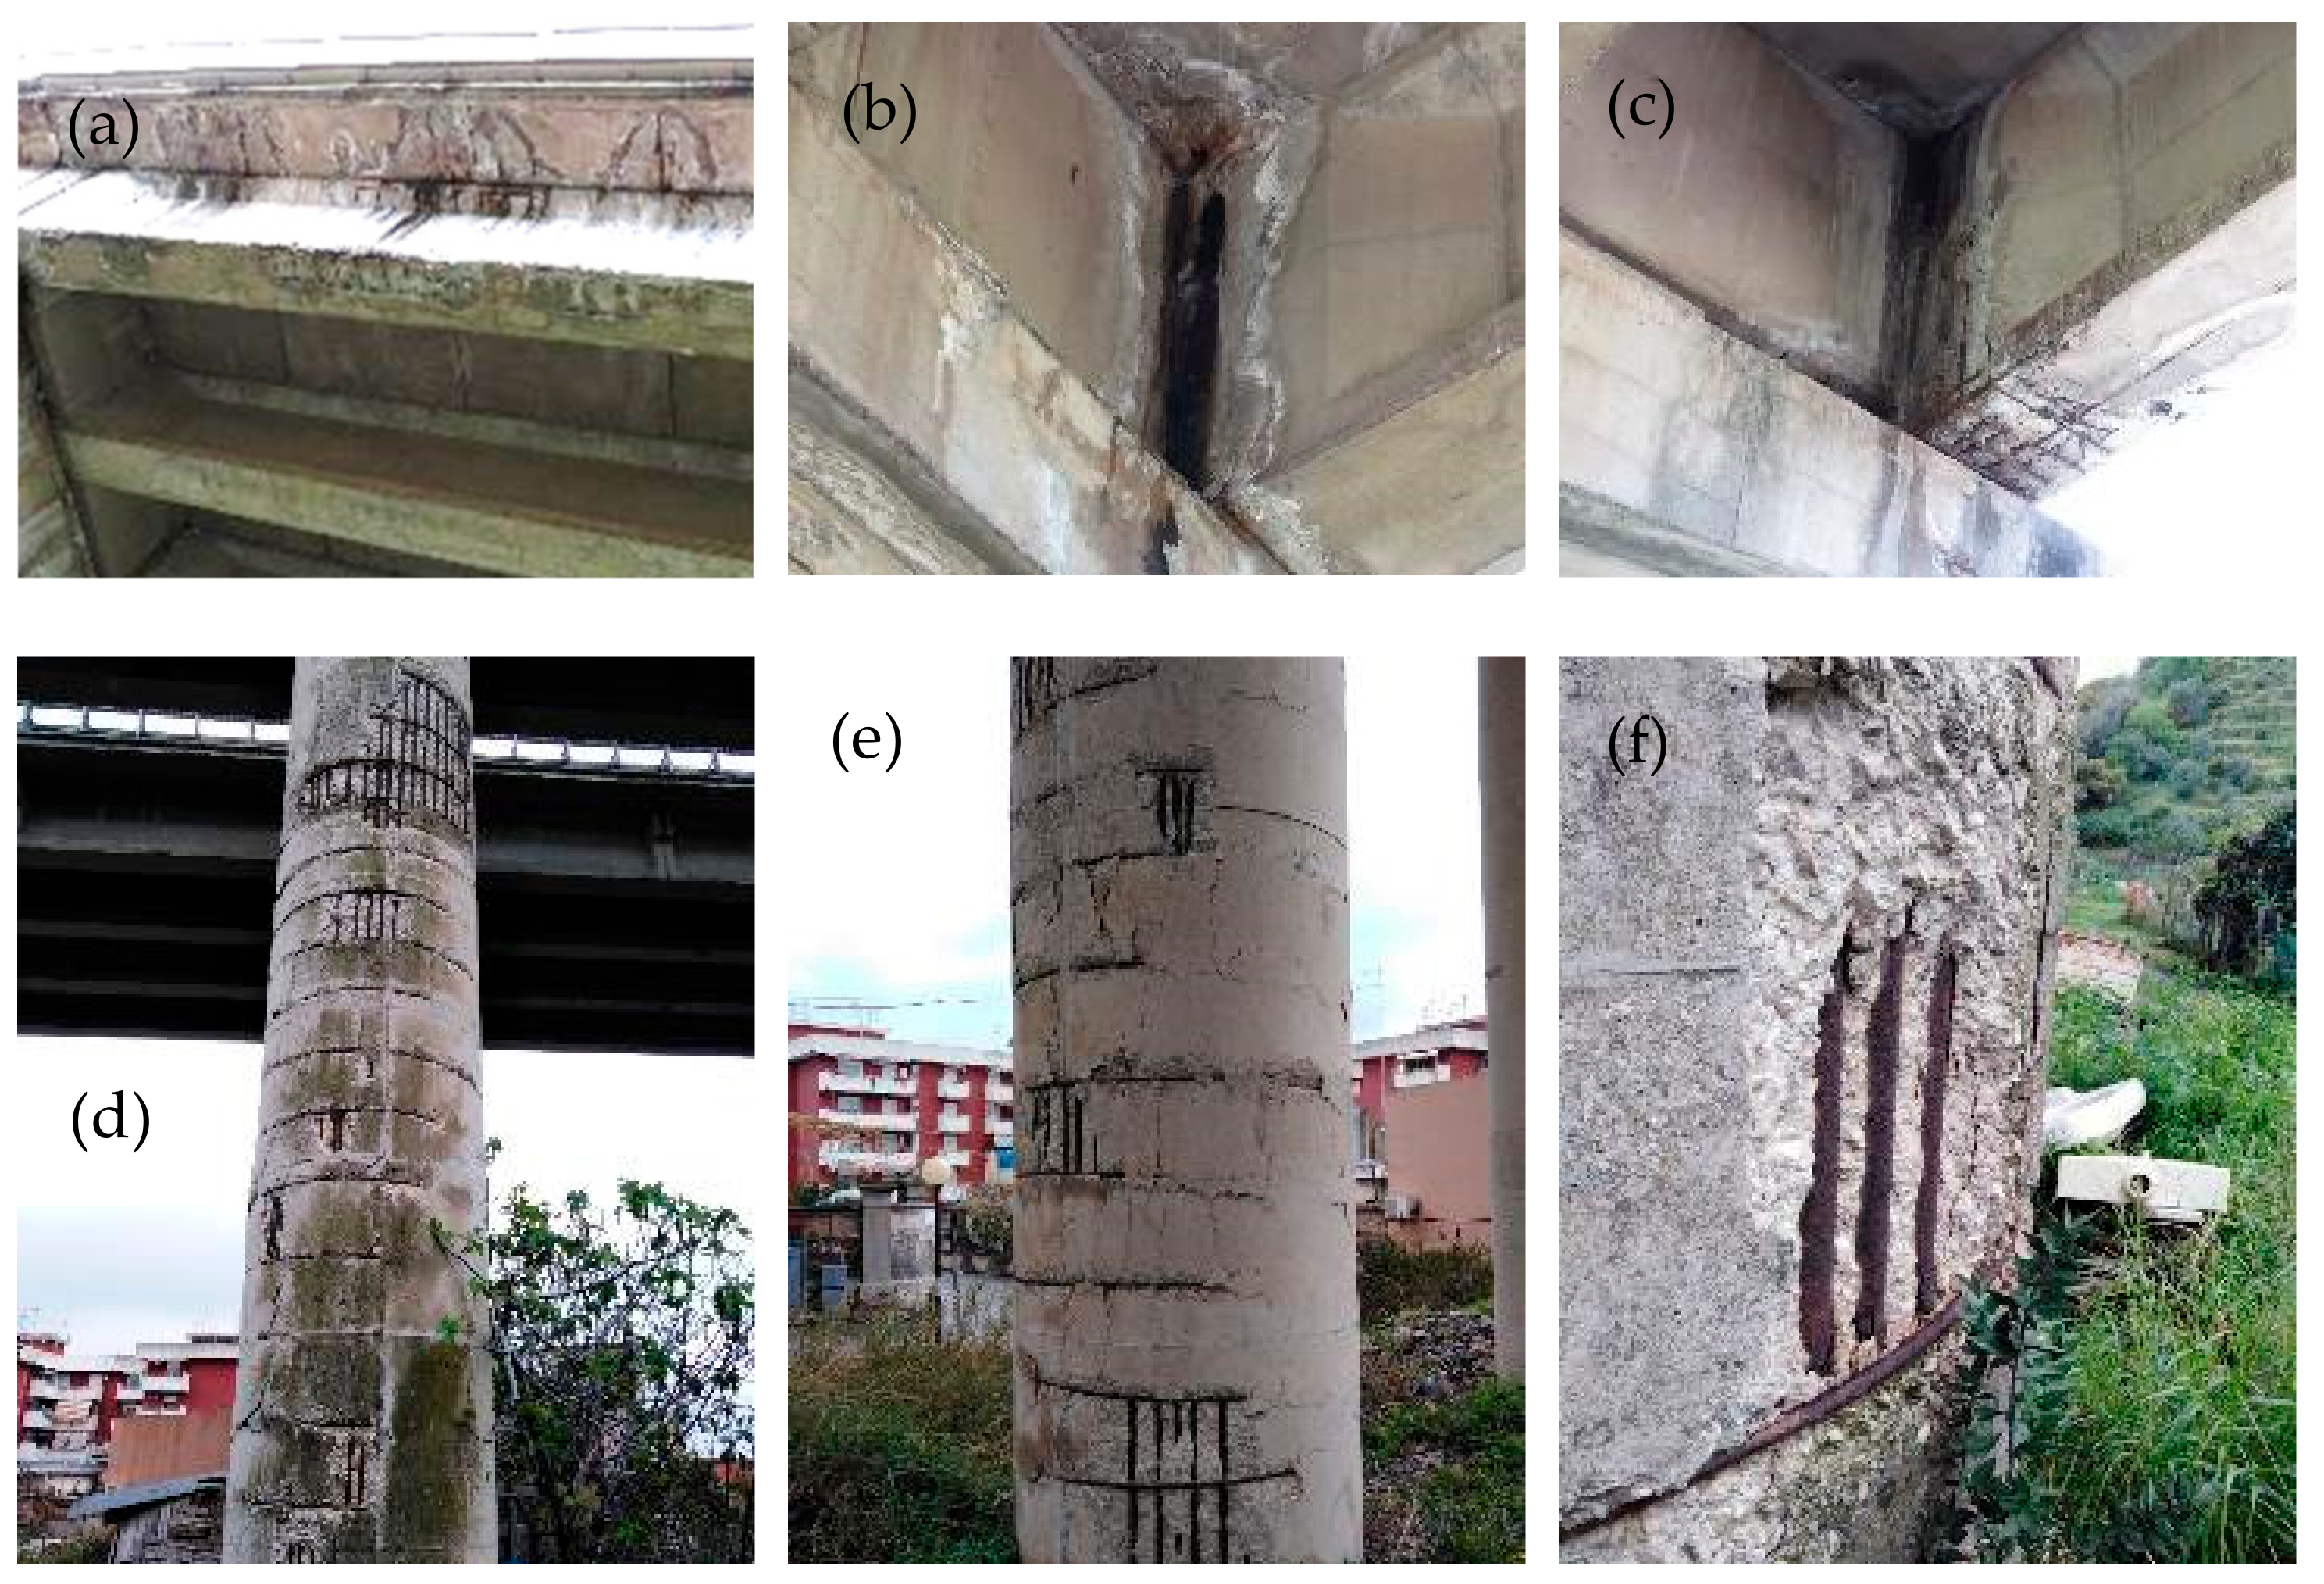
A selection of the defects detected in bridges of A18 and A20 highways are shown in Figure 7, namely, passive (ca-cap_1, G = 1, Figure 7a) and active (ca-cap_2, G = 3, Figure 7b,c) humidity spots, erosion of the external layer of concrete (ca-cap_3, G = 3, Figure 7a,b), spalling of the concrete cover (ca-cap_5, G = 2, Figure 7c–f) and presence of oxidized and corroded rebars (ca-cap_6, G = 5, Figure 7d–f) or stirrups (ca-cap_16, G = 3, Figure 7d–f).
In this phase, Critical Elements (CEs) of the bridge should be identified by the inspection team. The IBGs refer to CEs as both physical elements and adverse conditions whose inherent fragility, combined with a high level of defectiveness, may affect the structural behavior of the bridge. As an example, the IBGs indicate Gerber saddles and prestressing tendons (i.e., well-defined structural components) as well as the existence of extensive crack patterns on a member (i.e., a condition that may exist on multiple structural elements) as CEs for the determination of the CoA-SF. In the case of the CoA-S, the IBGs indicate worn out/damaged bearings as CEs.
However, the IBGs do not provide an exhaustive list of CEs nor a correlation between CEs and the defects provided in the forms. Based on the definition of a CE and on the examples provided by the IBGs, a group of defects was identified, whose presence is related to the existence of CEs. Since the procedure of evaluation of the CoA established by the IBGs is defect-based, this step is necessary for the implementation of an algorithm for the calculation of the CoA. The defects identified as CEs for the determination of the CoA-SF are as follows: piers or abutments out of plomb (dif-gen_6, G = 5), movements undermining bridge foundations (ril-fond_1, G = 5), movements of the foundation (ril-fond_5, G = 5), worn sheaths and the oxidation of prestressing wires (cap_7, G = 4), exposed and oxidated prestressing wires (cap_8, G = 4), cross-section reduction in prestressing reinforcement (cap_9, G = 5), the breakage of prestressing bars or anchorage failure (cap_12, G = 5), the presence of diagonal cracks (ca-cap_10, G = 5), the presence of rushing cracks (ca-cap_13, G = 4), the bending of rebars (ca-cap_17, G = 5) and the defects on Gerber saddles (ca-cap_24, G = 5). Note that, in the latest version of the IBGs, the defect ca-cap_24 associated with Gerber saddles was removed from the list of considered defects. In fact, the definition of this defect was found to be too vague and caused this defect to be reported even in the case of saddles in overall satisfactory condition. However, this defect was maintained here since it was considered at the time of the inspection activities.
The additional defects identified as CEs for the determination of the CoA-S are as follows: a blockage of the bearing (app_3, G = 4), the squashing of plumb bearings (app_6, G = 4), the excessive lateral deformation of rubber bearings (app_8, G = 4), the squashing of rubber bearings (app_9, G = 4) and a loss of the circular shape of roller bearings (app_13, G = 4). To facilitate the reading of the main defects detected on the investigated PC bridges/viaducts, they are listed in Table 1.
For each structural element, the IBGs provide criteria for the attribution of the level of defectiveness based on the number of the identified defects, their grade of importance, the values assumed by their extension and intensity factors and the presence of any CEs. To evaluate the level of defectiveness of the whole bridge, the IBGs require the following steps, suitable for multi-bay simply supported bridges: (1) Organize the structural elements of the examined bridge in two macro-groups: substructure and superstructure. The substructure group contains abutments, piers, foundations and bearings, whereas the superstructure group contains the other elements. (2) Organize the elements of the superstructure in as many subgroups as the number of bays of the bridge. Each subgroup contains girders, slab, joints and transverse beams. (3) Based on the level of defectiveness of the elements in the group, evaluate the level of defectiveness of the bays and the substructure. Finally, attribute to the bridge the maximum level of defectiveness evaluated for the bays and the substructure. The IBGs provide quantitative criteria to attribute the level of defectiveness to a group (i.e., the number of elements in a group with a certain level of defectiveness). Note that, in the case of the examined bridges, the superstructure subgroups collapse in one group only, regardless of the number of bays. This action occurs because the defectiveness data were collected for homogeneous groups of elements (e.g., defectiveness data of all girders were collected in one single form). The results of the inspection activities were catalogued by means of the web application. This action allows users to easily filter the data to find the number of occurrences (N) of a specific defect with a certain value of the extension and intensity factors (k1 and k2) in the considered group of bridges. The number of times a defect was identified is indicated with the symbol Nki,l, where i = 1, 2 refers to the extension or the intensity factor, and l = 0.2, 0.5 or 1.0 refers to the considered grade.
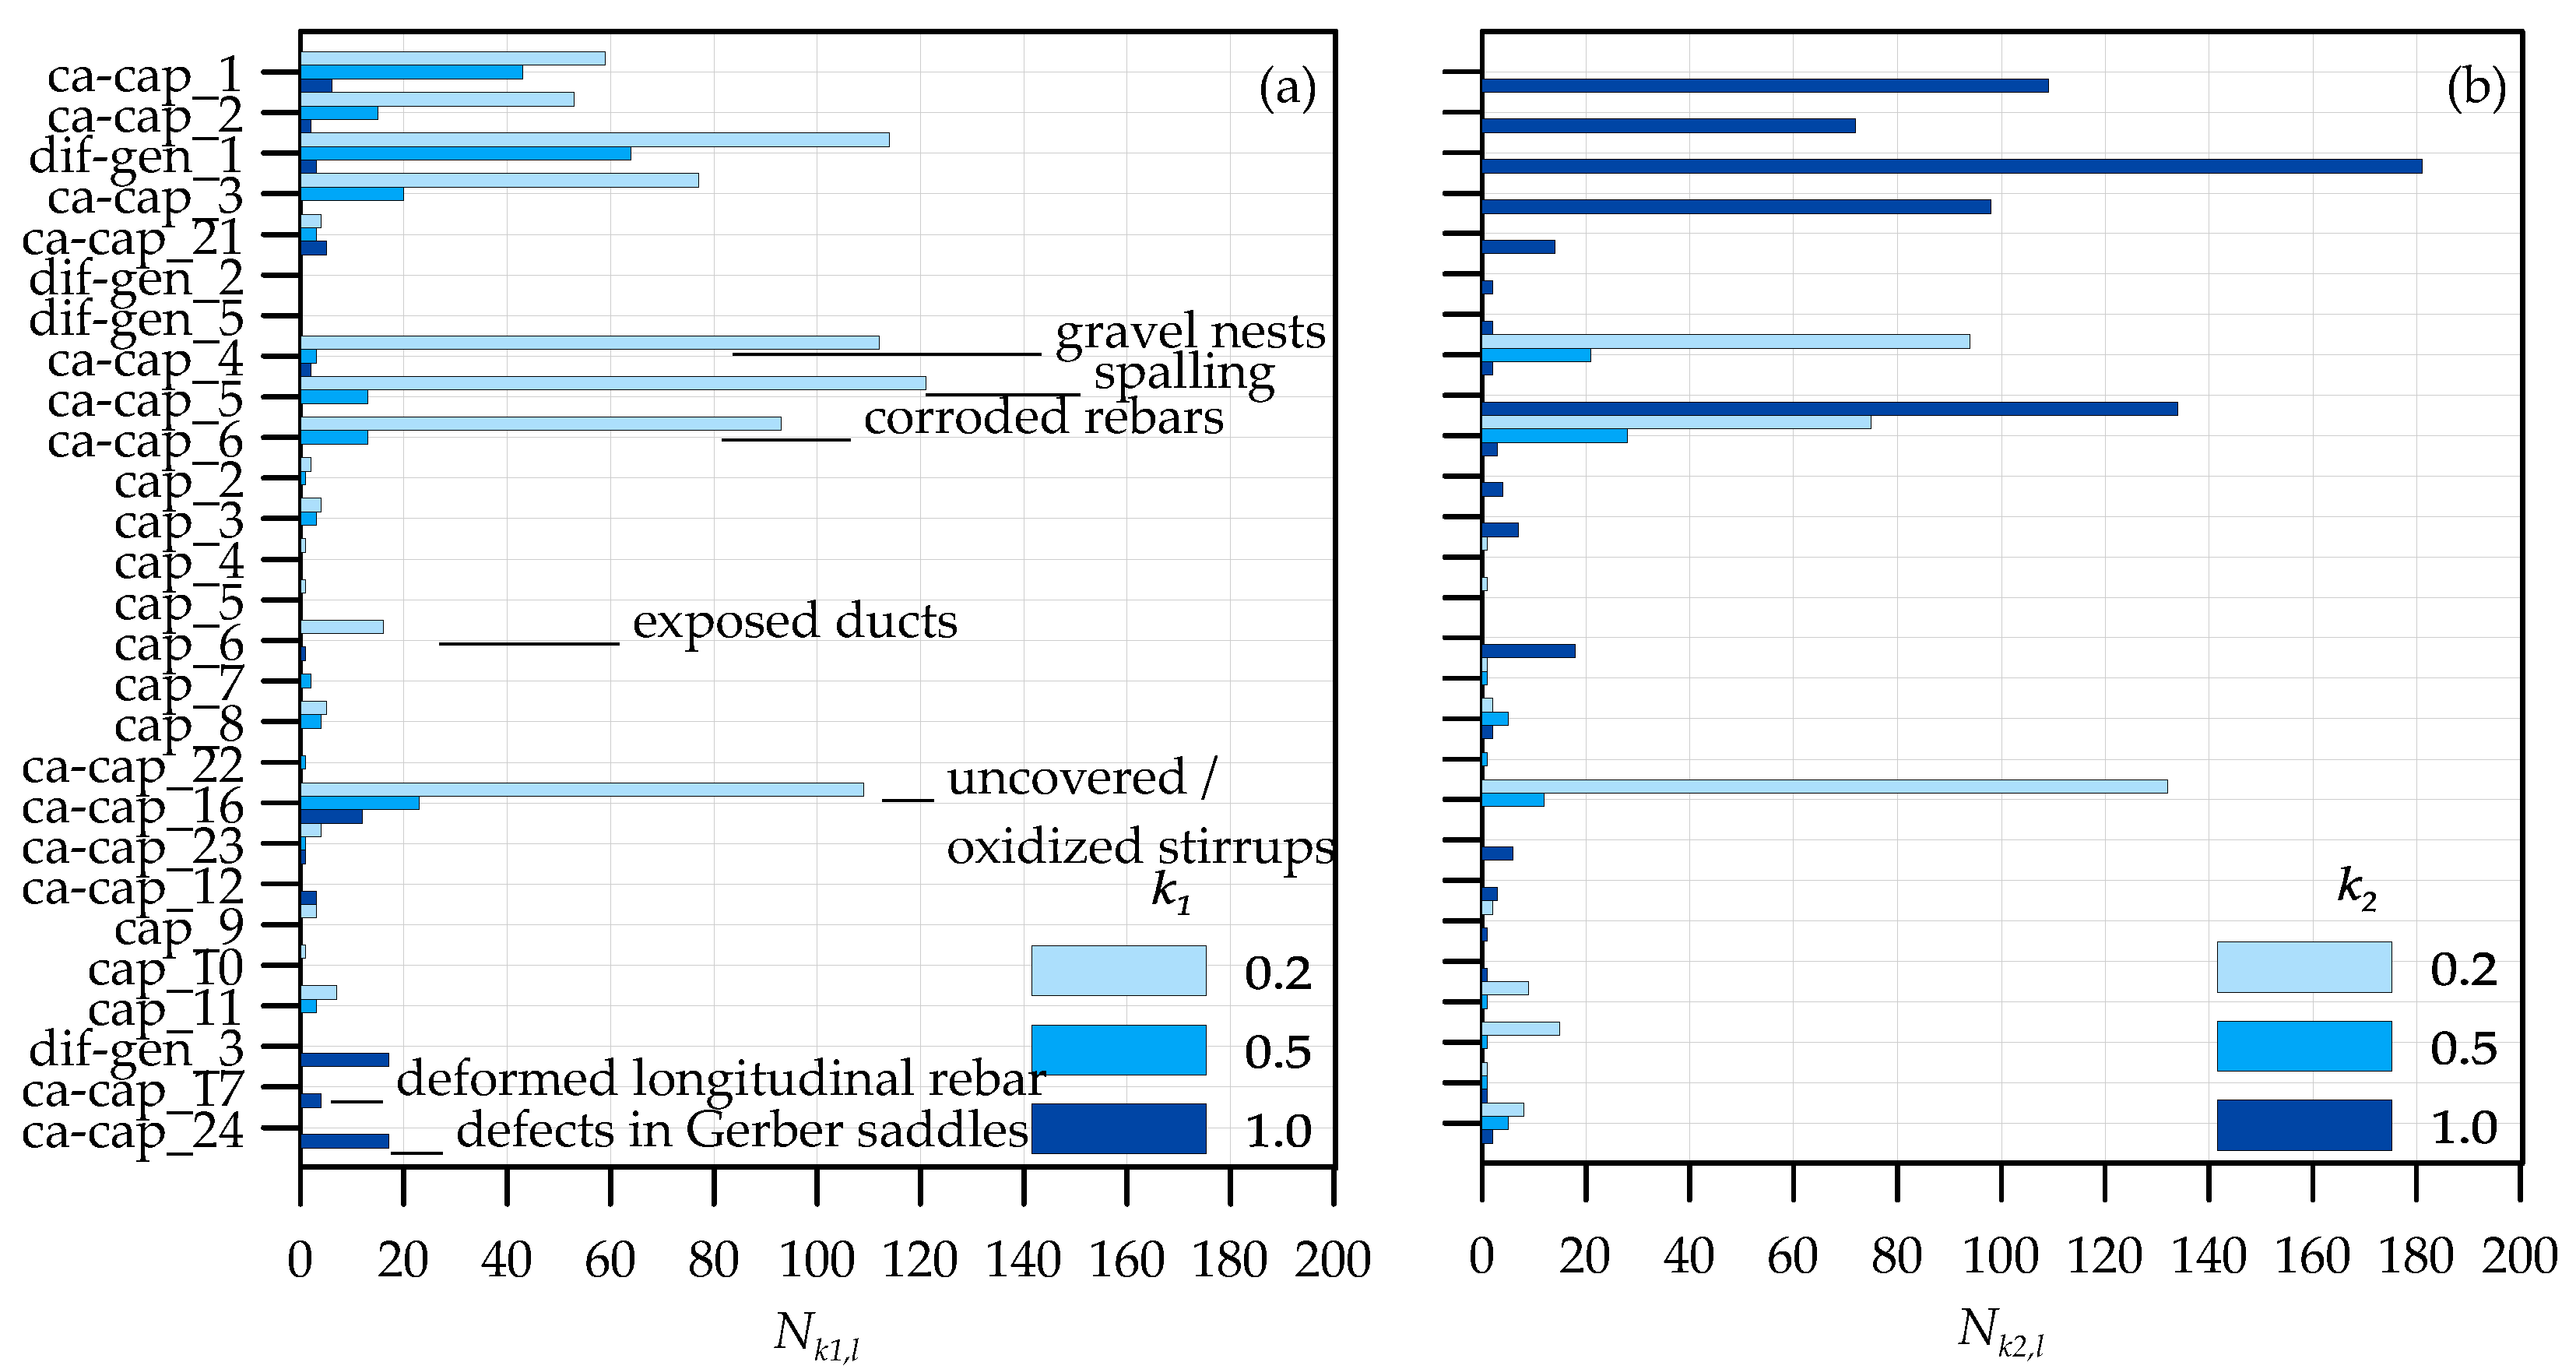
As an example, the charts in Figure 8 and Figure 9 show the values of Nk1,l and Nk2,l (l = 0.2, 0.5 or 1.0) in the case of PC girders of bridges of highways A18 and A20, respectively. The most frequently reported defects for this category of members are as follows: water traces due to inefficient rainwater drainage systems (dif-gen_1, G = 3), passive (ca-cap_1, G = 1) and active (ca-cap_2, G = 3) humidity spots, erosion of the external layer of concrete (ca-cap_3, G = 3), spalling of the concrete cover (ca-cap_5, G = 2) and presence of oxidized and corroded rebars (ca-cap_6, G = 5). In the subgroup of bridges belonging to the A20 highway, the following defects are also frequent: uncovered or oxidized stirrups (ca-cap_16, G = 3) and defects in the Gerber saddles (ca-cap_24, G = 5). Table 1 reports the main defects detected on the investigated PC bridges/viaducts. For a complete list of the detectable defects, the reader is referred to Appendix A of [15].

4.2. Calculation of the Classes of Attention

Once the hazard, vulnerability and exposure classes have been evaluated for the risk under examination, the evaluation of the CoA is straightforward. The IBGs provide a set of five tables (one for each hazard class) that give the value of the relevant CoA for assigned values of the vulnerability and exposure classes.
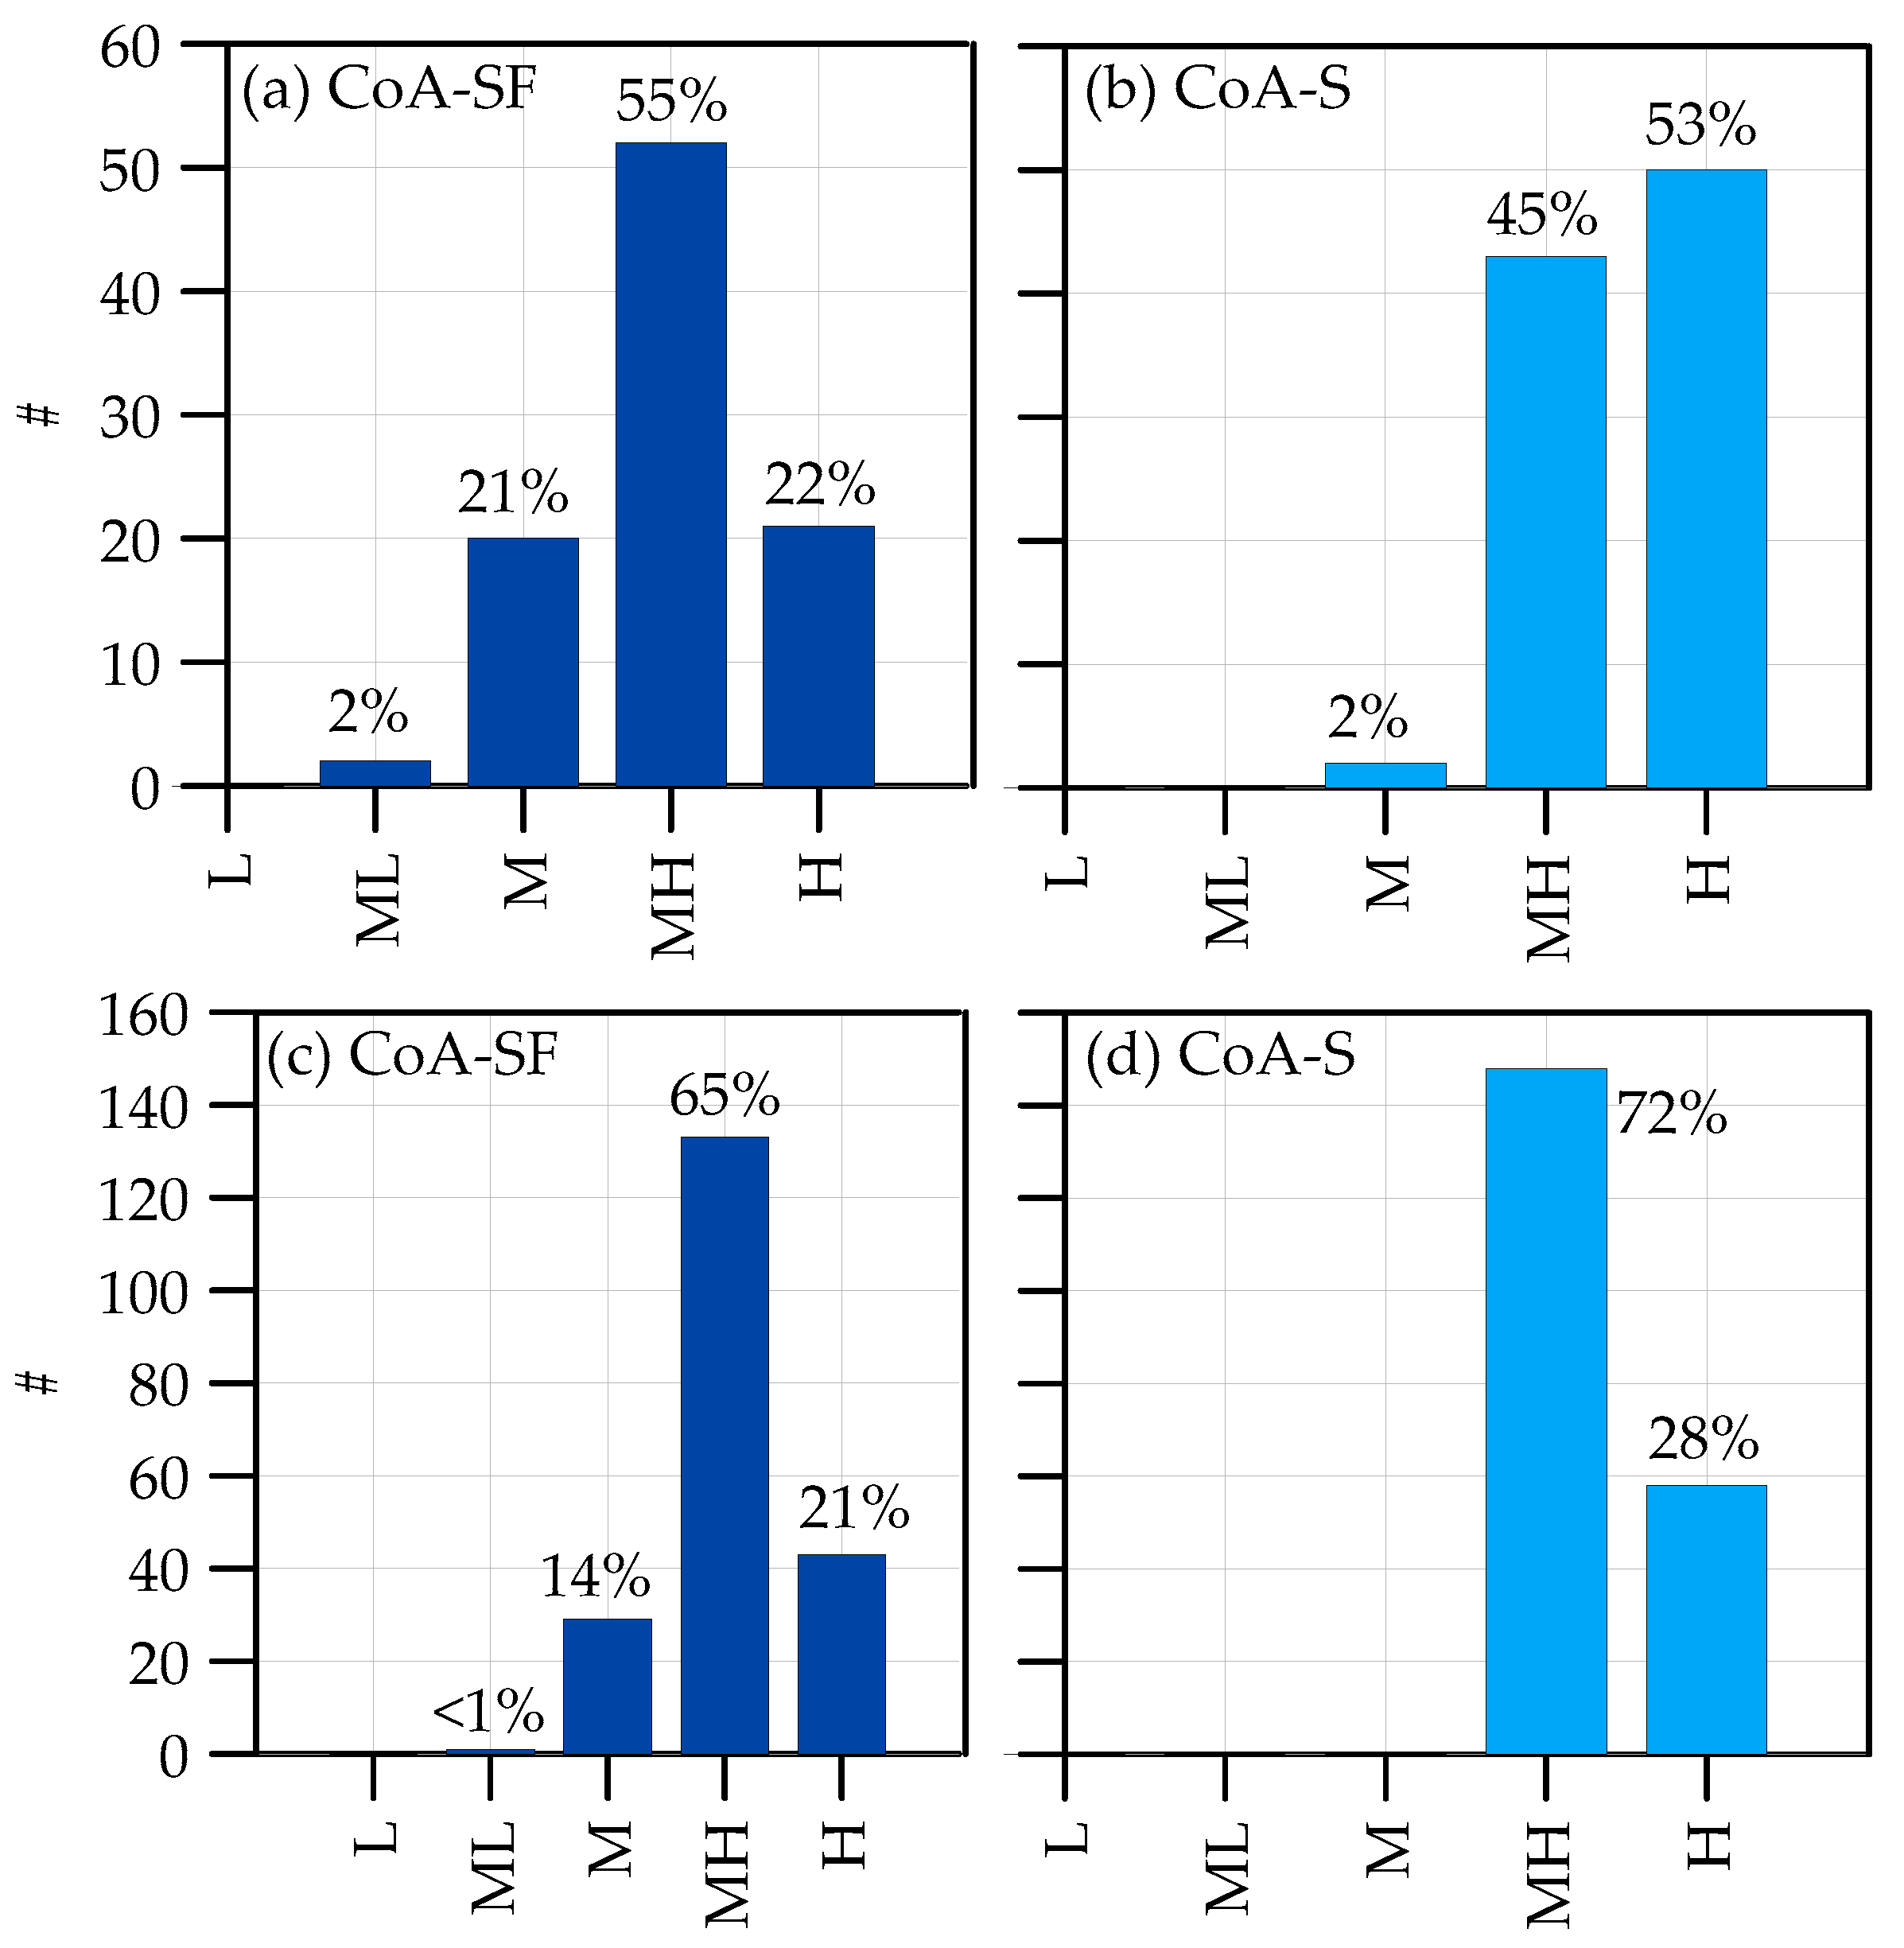
Figure 10 condenses the results of the calculations of the structural–foundational (CoA-SF) and seismic (CoA-S) CoAs for the PC bridges of A18 and A20 highway, respectively.
The histograms show that the CoA-S is generally higher than the CoA-SF for the bridges of both A18 and A20 highways. It can be justified because the hazard related to the CoA-SF is dependent on the traffic load frequency and is higher on highway A18 than on highway A20. By contrast, the seismic hazard is influenced by the seismic property of the site of the bridge in terms of both PGA and soil class. As reported in Figure 6, several bridges of highway A18 are on sites characterized by high PGA (i.e., ≥0.25), while almost all the bridges of highway A20 are on sites with medium-high PGA (i.e., between 0.15 and 0.25). This feature (related to a site-specific factor) together with the fact that the highways have a higher exposure class in the case of the CoA-S (involved in the local emergency plan), leads to the achievement of a discrepancy between the CoA-S levels for the PC bridges of highways A18 and A20, respectively. In addition, the lack of data has led to assume the worst subsoil stratigraphy classes to determine the seismic hazard. The subsoil class is a secondary parameter in the estimation of seismic hazards, and when the IBGs provide that for the subsoil of category C, D or E, the hazard levels increase. However, when the seismic vulnerability is high, the CoA-S is still high regardless of the other two parameters (hazard and exposure). Therefore, it was only in a limited number of cases that the assumption about the subsoil category was able to influence the CoA-S. In any case, a correct estimate of the subsoil category would be appropriate.
The application of the IBGs to the stock of PC bridges returned with the finding that 64 and 108 of the 301 bridges were classified as having a high CoA-SF and CoA-S, respectively. According to the IBGs, the bridges with a high CoA-SF (21% of the examined stock) have a high value of the synthetic CoA, regardless of the value of the CoA-S, CoA-L and CoA-F. Moreover, these results are almost in line with those obtained in [18], even if the latter are obtained considering all the construction typologies and not only the PC bridges.
For the PC bridges with a high CoA, the IBGs require a Level 4 analysis, i.e., an accurate evaluation of the safety level to be carried out according to the provisions of NTC18. This requirement means that in-depth investigations (e.g., evaluation of the mechanical properties of materials, assessment of residual prestress levels in wires) and an onerous numerical analysis are required for 20% of samples [20,21,22,23,24]. To perform a correct assessment study, the knowledge of the conditions of the bridge is fundamental. The structural analysis will have to take into account the results of the inspection activities, focusing on potential issues related to the tendon deterioration. In the literature are available some case study investigations regarding the sudden collapse of PC bridges mainly due to fractured strands and failure of the prestressing tendons as a consequence of their deterioration because of corrosion [25,26].

5. The Prioritization Defect Index

In this section, a defect-based prioritization index (in the following indicated as Prioritization Defect Index, PDI) is suggested and applied to the stock of bridges belonging to A18 and A20 highways. The purpose of the PDI is to highlight the defects that are frequently reported for a certain group of bridges, with a magnification depending on the grade of importance of the defect and on the associated levels of intensity and\or extension. The higher the PDI, the greater the influence of the defect in the level of defectiveness of the considered group of bridges. The application of the PDI to a stock of bridges may help management companies in planning targeted maintenance operations, thus reducing both economic and social costs. In addition, scheduled maintenance allows for the reduction in the level of defectiveness and, therefore, the CoA.
The value of the PDI for a certain defect reported for the bridge stock is given as follows:
P D I = G / G max K 1 K 2
where G/Gmax is the ratio of the grade of importance of the defect to the maximum grade of importance (i.e., Gmax = 5), and K1, K2 are two coefficients introduced to include the influence of the extension and intensity factor (k1 and k2) on the PDI. These coefficients are evaluated according to the following expression:
K i = l l N ki , l N b
where Nki,l is the number of times a defect with an assigned value of the extension (i = 1) or intensity (i = 2) factor (l = 0.2, 0.5 or 1.0) is counted in the considered stock of bridges, and Nb is the number of bridges of the stock.
The PDI returns a value ranging from 0 to 1. Note that the PDI is not influenced by the number of examined bridges because K1 and K2 are normalized with respect to Nb.
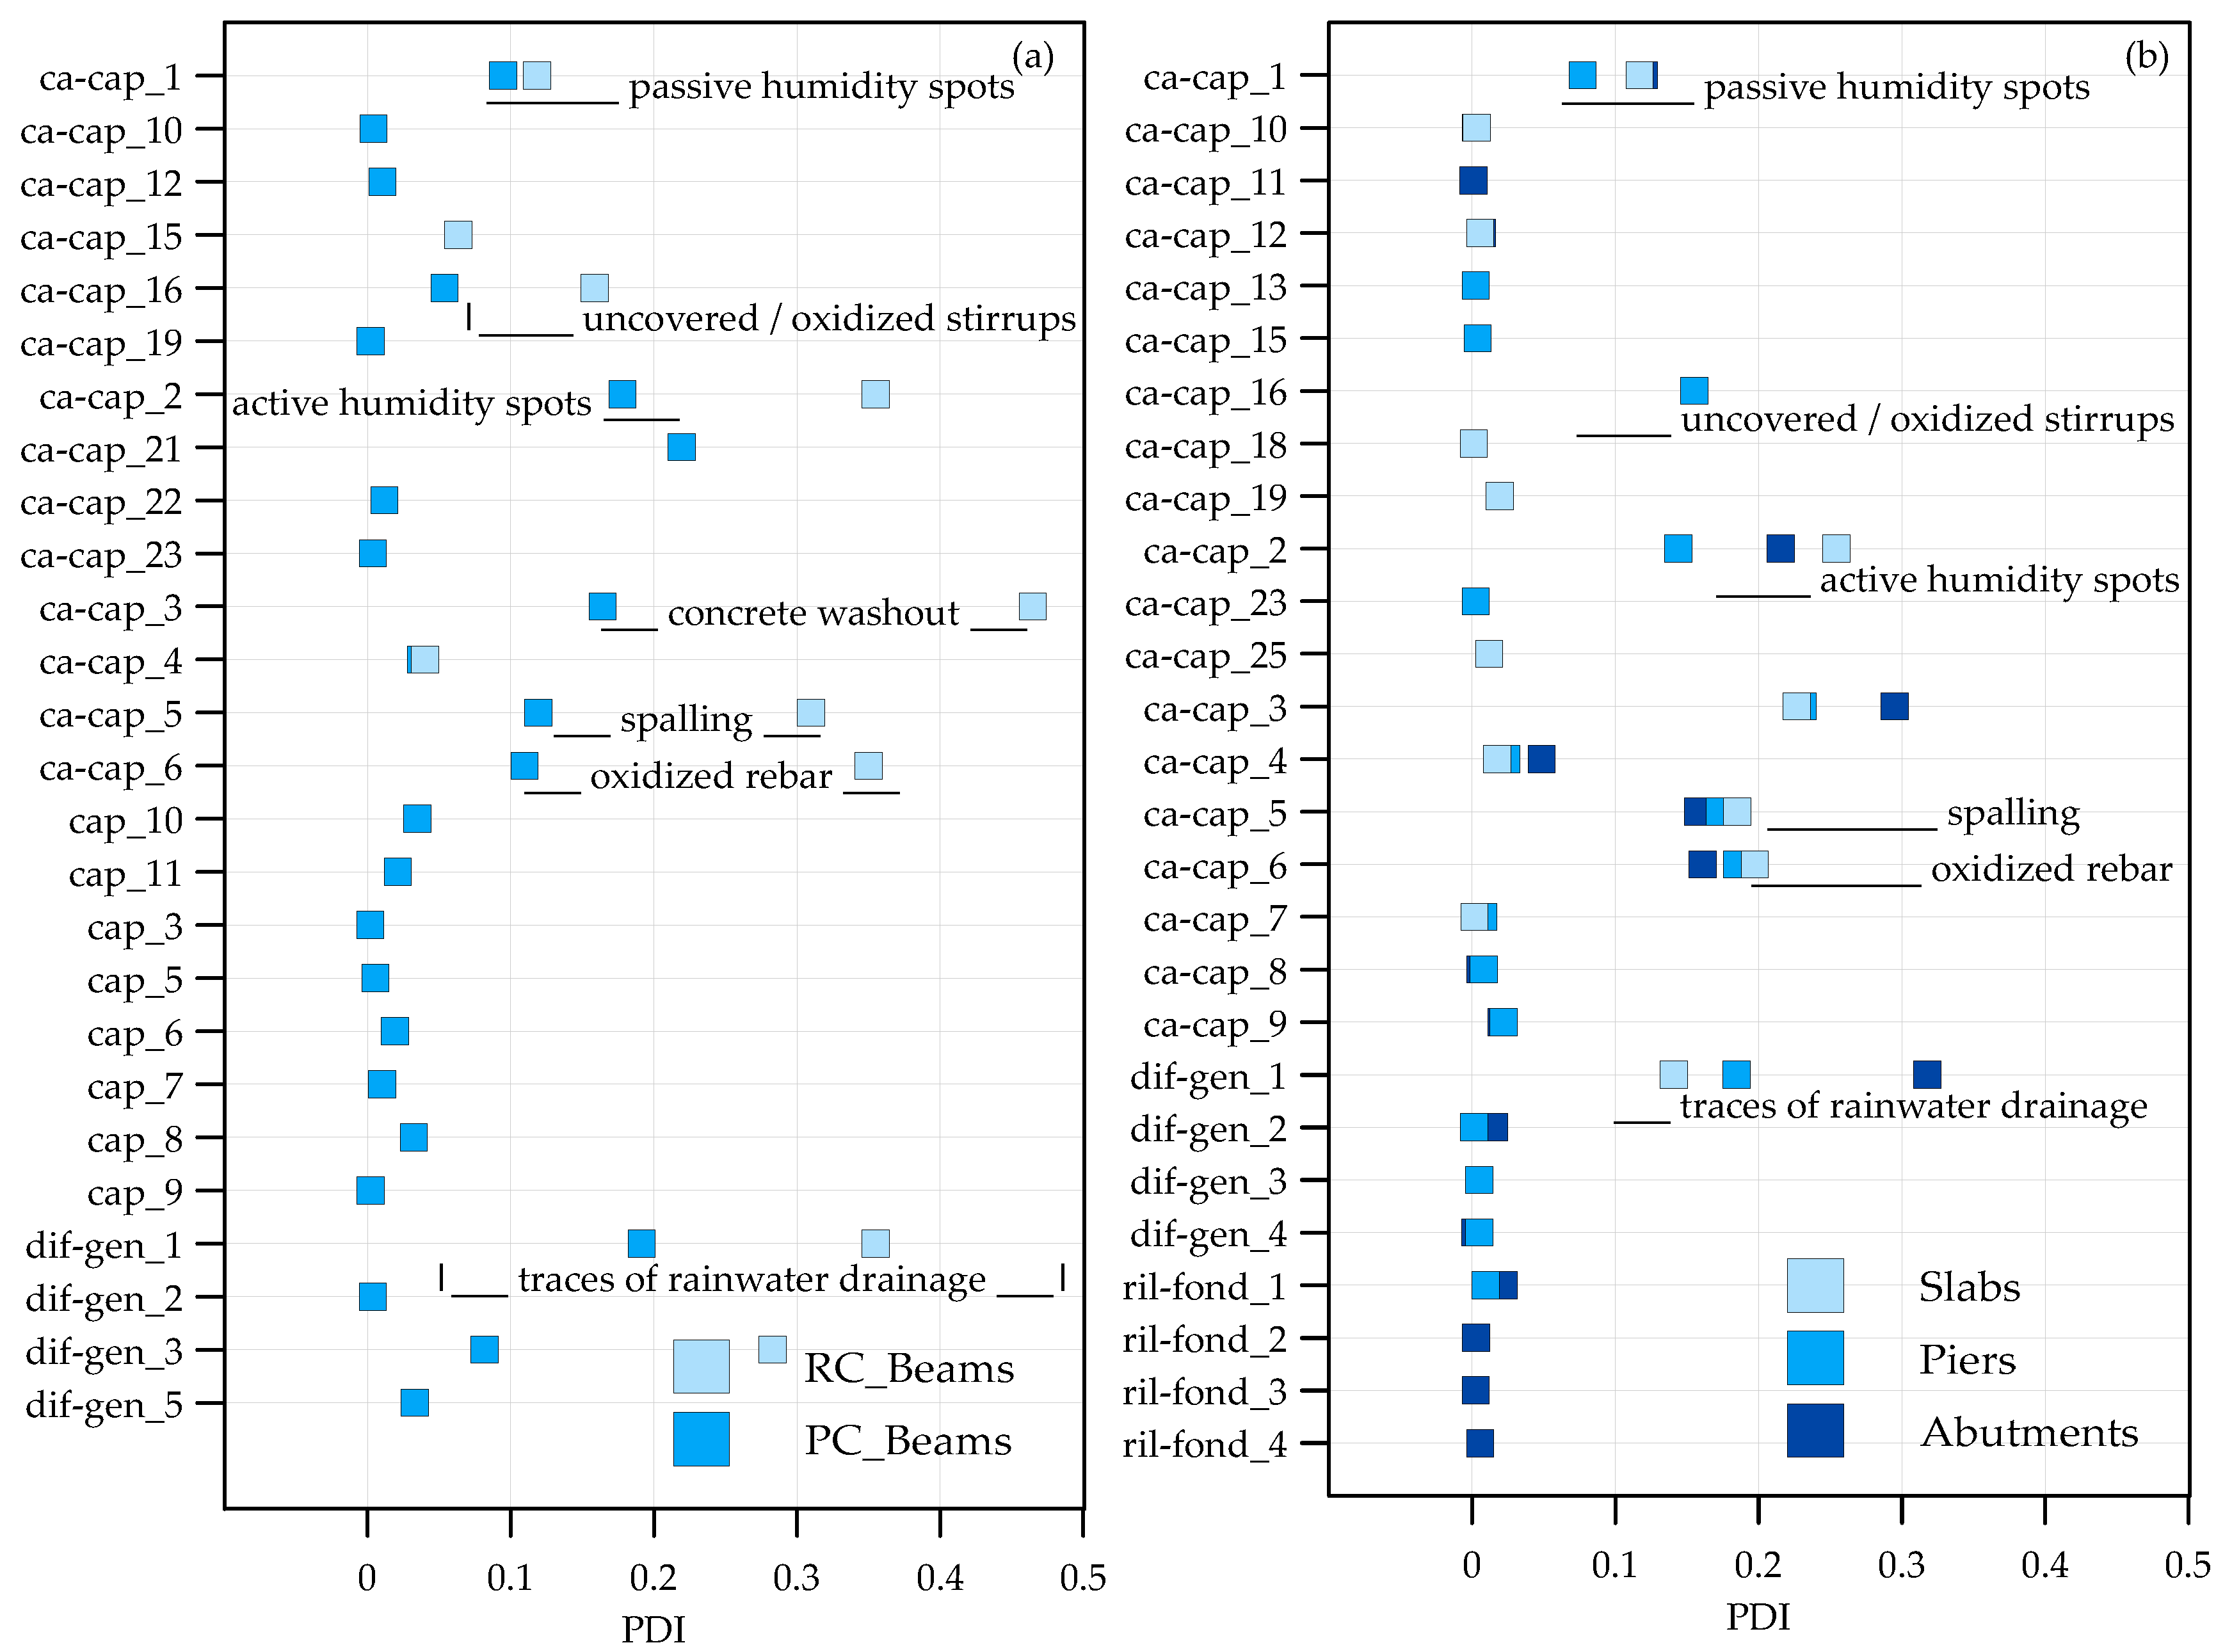
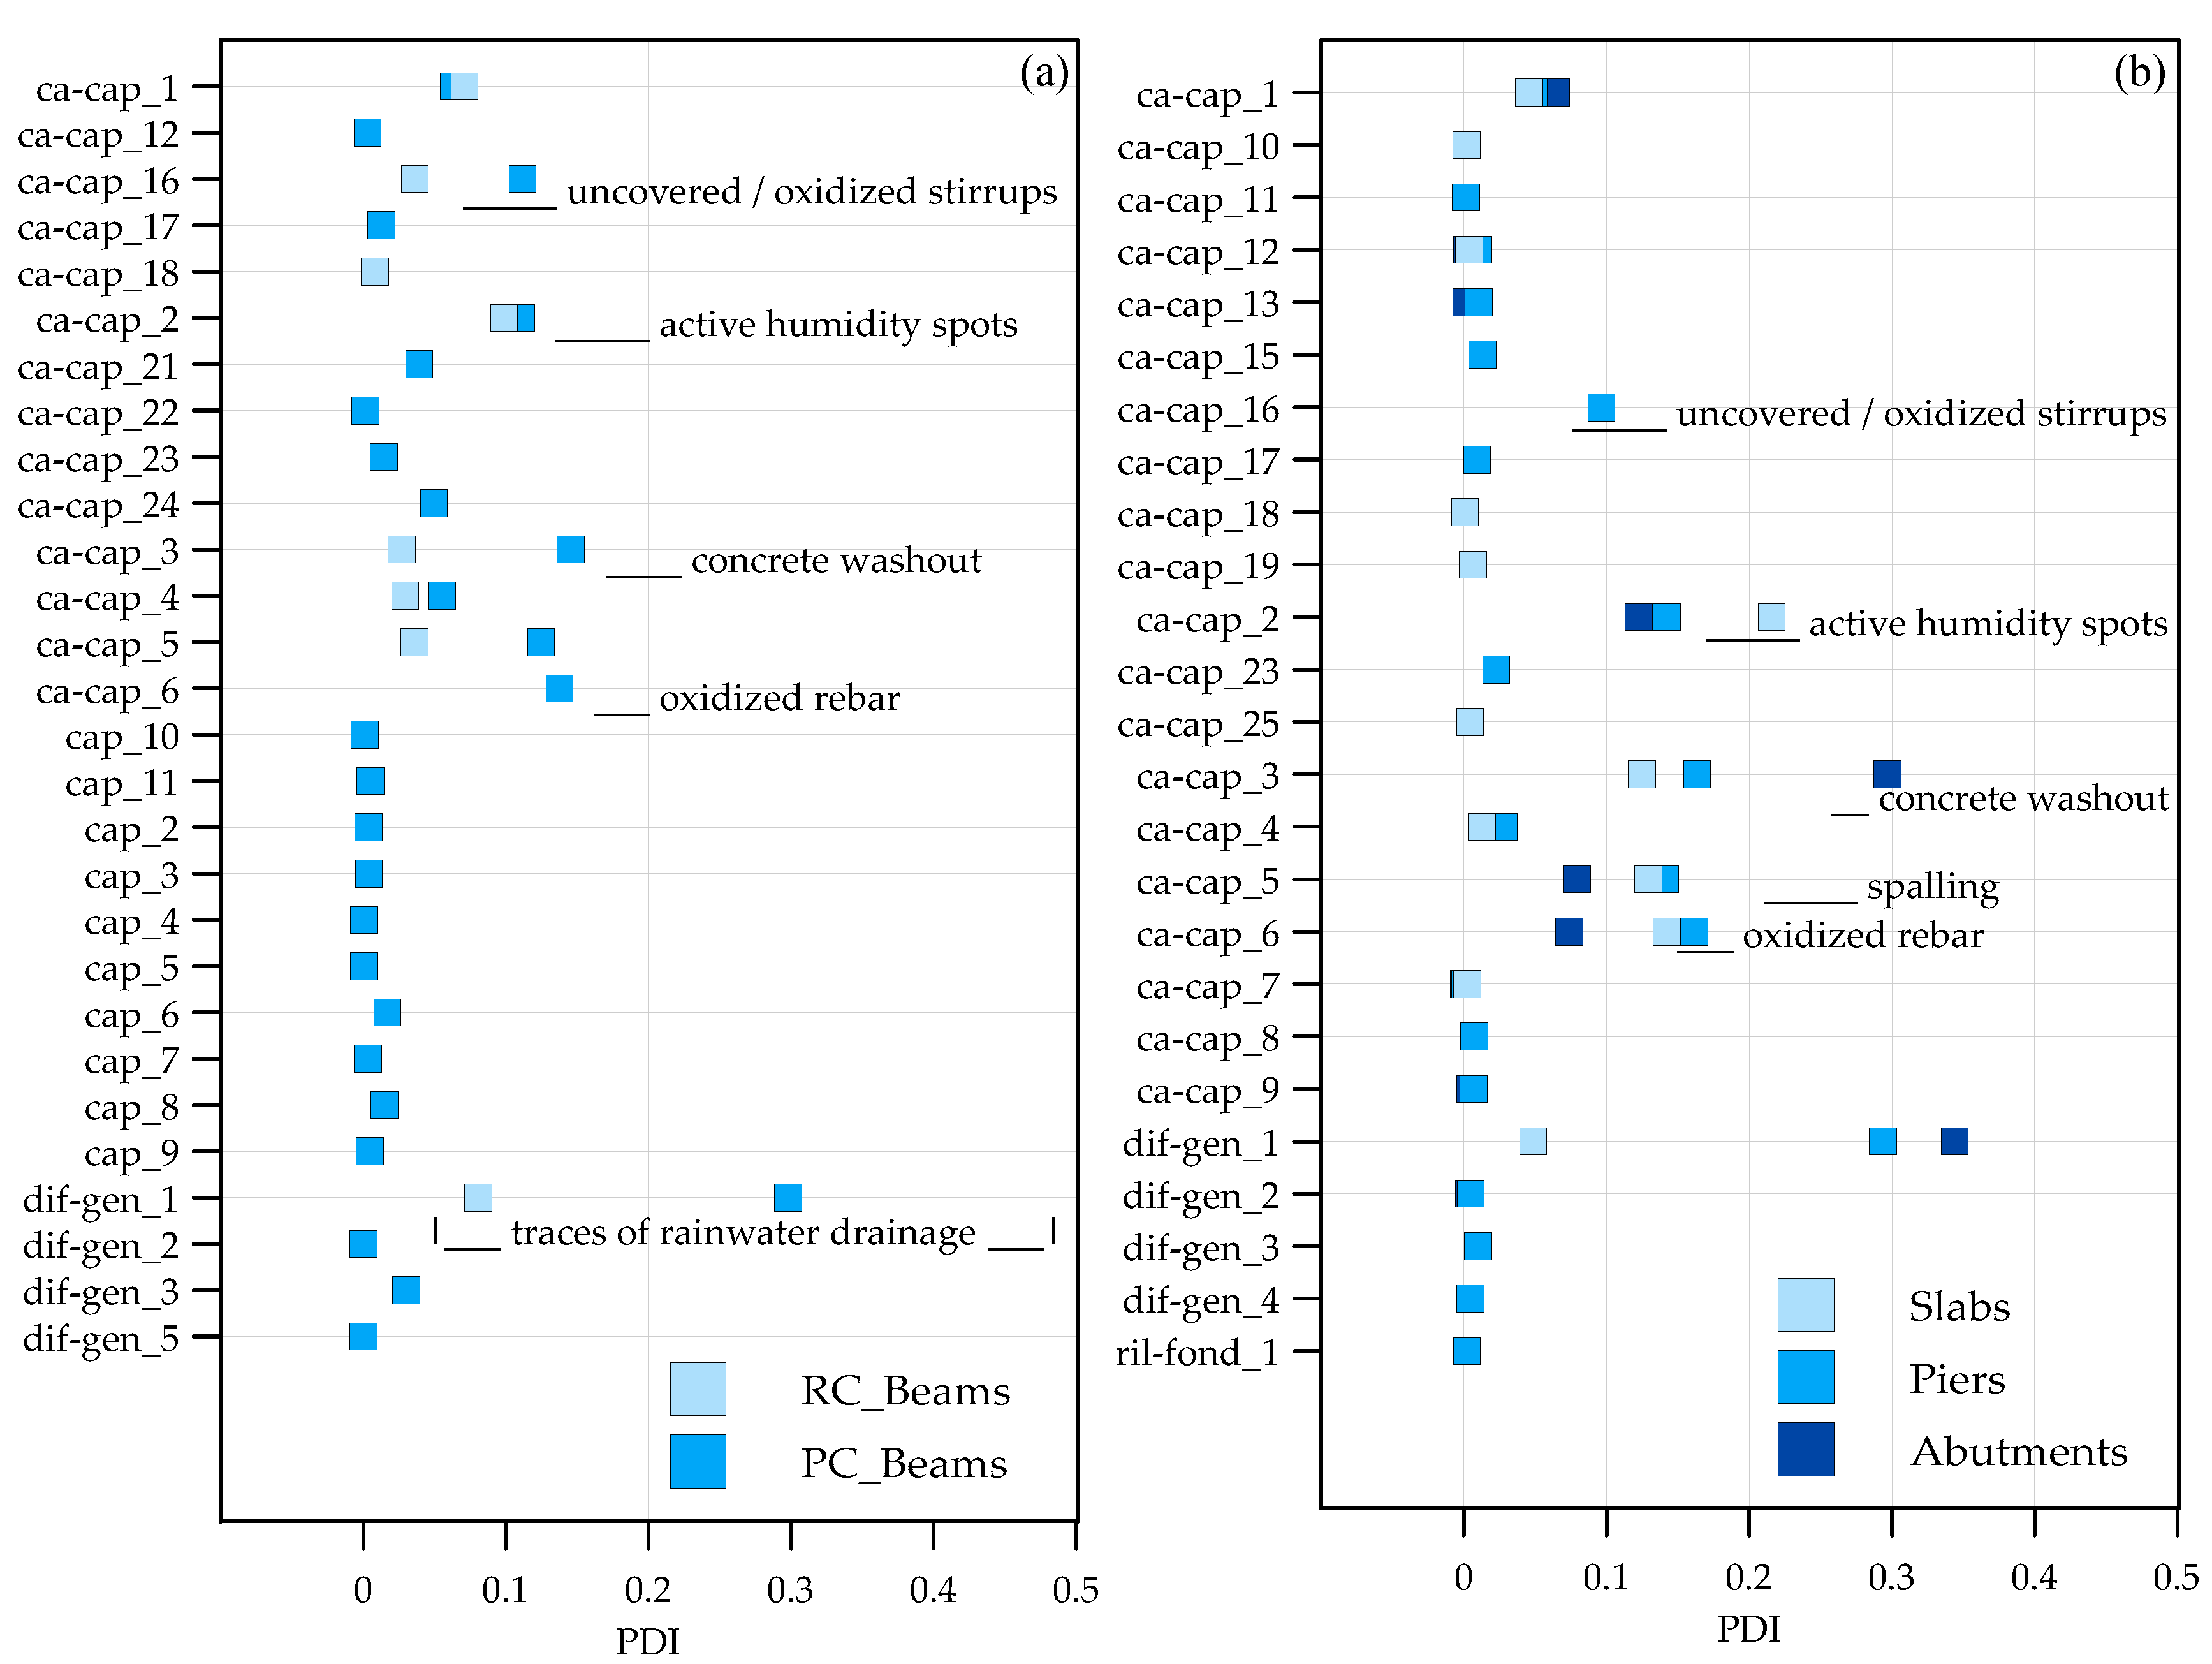
In Figure 11 and Figure 12, the defects detected on the PC girders of the bridges on highways A18 and A20, respectively, were used to calculate the PDI.
In general, the defects with the highest PDI values involved the concrete surface of girders, as already noted in the previous section. In particular, the highest values of PDI are due to the following: water traces due to inefficient rainwater drainage systems (dif-gen_1), passive (ca-cap_1) and active (ca-cap_2) humidity spots, erosion of the external layer of concrete (ca-cap_3), spalling of the concrete cover (ca-cap_5) and oxidized and corroded steel bars (ca-cap_6).
The defects detected on slabs, piers and abutments of the same stock of bridges (Figure 11b and Figure 12b) are in line with those of PC girders and RC beams. In detail, the PDI values of the most severe defects on slabs, piers and abutments range from 0.10 for (dif_gen_1) on concrete slabs to about 0.35 for (ca-cap_3) on abutments. The defects that involve the erosion of the external layer of concrete (ca-cap_3) of slabs and piers and the oxidized steel bars (ca_cap_6) of concrete piers have values of PDI from 0.15 to 0.20.
These results clearly indicate that the bridges of the stock generally suffer from the effects of an inefficient rainwater drainage system. This indication may help the infrastructure management in planning an intervention campaign aimed at replacing/fixing downpipes and drains and, subsequently, restoring the degraded surfaces of girders, RC beams, slabs, piers and abutments.
The types of interventions suggested in light of the PDI values, which were obtained for each defect considered, can be implemented on all the considered PC bridges. In the analysis herein presented, all the defects considered by the IBGs for the PC bridges were taken into account.
In order to facilitate the planning of interventions on groups of bridges by the managing body, it is possible to identify groups of defects from the list proposed by the IBGs for which common types of intervention are possible. At the same time, it is also possible to select subgroups of bridges within the considered stock based on target values of the PDI. By cross-referencing these results, groups of bridges affected by common types of defects can be selected to plan common types of interventions.
Furthermore, in order to define targeted interventions on individual bridges, it may be possible to integrate the information obtained by means of the PDI values with information relating to the characteristics of individual bridges and plan ad hoc interventions for each structure.
The described potential applications of the combined proposal PDI and data collected could be implemented in future works with the help of the developed web application.

6. Conclusions

In this paper, the methodology introduced by the recent Italian Guidelines for the classification and management of the risk, safety evaluation and monitoring of existing bridges (Italian Bridge Guidelines, IBGs) was applied to a stock of 301 PC bridges belonging to the A18 and A20 highways (Sicily, Italy). The data collected by the infrastructure management within the first two levels of the methodology (i.e., L0 census of the bridge stock and L1 defects identification) were organized in a custom-made web application to ease the analyses required for the application of Level 2. The analysis of the data collected in L1 revealed that the most common defects in the considered stock of PC bridges involved the concrete cover of the reinforced and prestressed concrete members. The cause of these defects is mainly attributable to an inefficient rainwater drainage system combined with a lack of maintenance during past decades. This problem caused, in turn, a washout of the affected concrete surfaces, corrosion of the outer reinforcement layers and cracking and spalling of the concrete cover due to the increased volume of corroded reinforcement.
Based on the application of protocols of the first three levels of the IBGs to the considered stock of bridges, the following observations and conclusions were drawn:
-
A preliminary check on the data collected by inspectors revealed systematic input errors and ambiguous data entry due to the numerous open questions proposed in the L0 and L1 forms. It is the opinion of the authors that a multiple-choice formulation of the questions proposed in the forms may be more appropriate in view of an automatic evaluation of the answers.
-
Critical Elements (CEs) are given a great weight in the determination of the Class of Attention (CoA) of the bridge. The IBGs provide a general definition and some examples of what a CE is but does not provide an exhaustive list of CEs, nor a correlation of CEs with the defects provided in the defect forms. According to the authors, this item has the potential to undermine the objective application of the IBGs since each inspection team is given the possibility to establish which group of defects is associated with one or more CEs. A possible solution would be to provide a list of defects associated with CEs for each structural typology and each CoA. In this paper, a list of defects associated with CEs was proposed in the case of multi-bay, simply supported PC bridges for the CoA-SF and CoA-S.
-
Although the initial version of the IBGs provide some differentiation in attributing the level of defectiveness between CEs associated with defects with a high grade of importance (G) or medium grade of importance, the extension or the intensity of the defect is not taken into account. However, it is worth of note that some recent procedural suggestions of the Italian National Agency for Railways, Road and Motorway Infrastructure Safety (ANSFISA) suggest a methodology to take into account the different levels of intensity and extension of defects.
-
The application of the methodology provided by the IBGs to the stock of 301 bridges led to the attribution of a high structural–foundational CoA (CoA-SF) in 21% of the examined bridges and a high Seismic CoA in 35% of the cases. This result means that detailed (and onerous and time-consuming) structural and seismic assessments are required for a large number of bridges.
-
A Prioritization Defect Index (PDI) was proposed as a decision-making tool for the planification of maintenance campaigns on large stocks of bridges. The PDI assumes a value in a range from 0 to 1, depending on the frequency with which a certain defect of importance G occurs in the sample with a given extension k1 and intensity k2. Defects with high values of the PDI should be the focus to design the subsequent maintenance campaign. This focus allows users to plan targeted interventions on the entire stock of bridges, minimizing the economic and social costs.
Potential developments of this research work might include the following:
-
The development of more refined uses of PDI values by selecting groups of bridges affected by common defects and incorporating the properties of each structure in order to plan interventions targeted for groups of bridges or for a single bridge;
-
The integration of the other two hazards considered in the IBGs, i.e., floods and landslides.

Author Contributions

Conceptualization, A.R., P.P.R. and N.S.; methodology, A.F., D.M., D.P., A.R., P.P.R. and N.S.; software, A.F., D.P., P.P.R. and N.S.; validation, A.F., D.M., D.P., A.R., P.P.R. and N.S.; formal analysis, A.F., D.P., P.P.R. and N.S.; investigation, A.F., D.M., D.P., A.R., P.P.R. and N.S.; resources, A.F., D.M., D.P., A.R., P.P.R. and N.S.; data curation, A.F., D.M., D.P., A.R., P.P.R. and N.S.; writing—original draft preparation, N.S.; writing—review and editing, A.F., D.M., D.P., A.R., P.P.R. and N.S.; visualization, A.F., D.M., D.P., A.R., P.P.R. and N.S.; supervision, A.R. and P.P.R.; project administration, A.R., P.P.R. and N.S. All authors have read and agreed to the published version of the manuscript.

Funding

This research received no external funding.

Data Availability Statement

The raw data supporting the conclusions of this article will be made available by the authors upon request.

Acknowledgments

The authors thank the Consortium for the Sicilian Highways (CAS) that authorized the use of the data of census and visual inspection of the examined bridges. This research study was supported by the University of Catania within the research project DU.SO.CA.P.—Durabilità e SOstenibilità delle strutture in Cemento Armato e Precompresso 2020/2022 PIA.CE.RI. Moreover, this presented study was carried out as part of the program of activities carried out as part of the agreement between the ReLUIS Interuniversity Consortium and the Superior Council of Public Works stipulated pursuant to art. 3 of the Decree of the Minister of Infrastructure no. 578 of 17 December 2020; however, this publication does not necessarily reflect the Council’s position and assessments.

Conflicts of Interest

The authors declare no conflicts of interest.

References

  1. Zonta, D.; Zandonini, R.; Bortot, F. A Reliability-Based Bridge Management Concept. Struct. Infrastruct. Eng. 2007, 3, 215–235. [Google Scholar] [CrossRef]
  2. Limongelli, M.P.; Gentile, C.; Biondini, F.; Di Prisco, M.; Ballio, F.; Belloli, M. The Monitoring Guidelines of the Lombardia Region in Italy. Eng. Proc. 2022, 17, 16. [Google Scholar] [CrossRef]
  3. Limongelli, M.P.; Gentile, C.; Biondini, F.; di Prisco, M.; Ballio, F.; Zonno, G.; Borlenghi, P.; Bianchi, S.; Capacci, L.; Anghileri, M.; et al. Bridge Structural Monitoring: The Lombardia Regional Guidelines. Struct. Eng. Int. 2022, 20, 461–484. [Google Scholar] [CrossRef]
  4. Calvi, G.M.; Moratti, M.; O’Reilly, G.J.; Scattarreggia, N.; Monteiro, R.; Malomo, D.; Calvi, P.M.; Pinho, R. Once upon a Time in Italy: The Tale of the Morandi Bridge. Struct. Eng. Int. 2018, 29, 198–217. [Google Scholar] [CrossRef]
  5. Italian Ministry of Infrastructures and Transportations. D.M. 17 December 2020. Linee Guida per La Classificazione e Gestione Del Rischio, La Valutazione Della Sicurezza Ed Il Monitoraggio Dei Ponti Esistenti; Italian Ministry of Infrastructures and Transportations: Rome, Italy, 2020. [Google Scholar]
  6. Italian Ministry of Infrastructures and Transportations. D. M. 1 July 2022. Linee Guida per La Classificazione e Gestione Del Rischio, La Valutazione Della Sicurezza Ed Il Monitoraggio Dei Ponti Esistenti; Italian Ministry of Infrastructures and Transportations: Rome, Italy, 2022. [Google Scholar]
  7. Scalbi, A.; Zani, G.; di Prisco, M.; Mannella, P. The Role of Maintenance Plans on Serviceability and Life Extension of Existing Bridges. Struct. Concr. 2022, 24, 127–142. [Google Scholar] [CrossRef]
  8. Zizi, M.; Bencivenga, P.; De Matteis, G. Handling Policies for Italian Existing Bridges with a Territorial Approach: The Case Study of Caserta, Italy. Structures 2023, 48, 1306–1321. [Google Scholar] [CrossRef]
  9. Grieco, L.A.; Scattarreggia, N.; Monterio, R.; Parisi, F. An Index-Based Method for Risk Assessment of Existing Bridges Subjected to Multiple Hazard. In Bridge Maintenance, Safety, Management, Digitalization and Sustainability, Proceedings of the 12th International Conference on Bridge Maintenance, Safety and Management, IABMAS 2024, Copenhagen, Denmark, 24–28 June 2024; CRC Press: Boca Raton, FL, USA, 2024; pp. 2873–2881. [Google Scholar] [CrossRef]
  10. Grieco, L.A.; Scattarreggia, N.; Monteiro, R.; Parisi, F. An Index-Based Multi-Hazard Risk Assessment Method for Prioritisation of Existing Bridge Portfolios. Int. J. Disaster Risk Reduct. 2024, 114, 104895. [Google Scholar] [CrossRef]
  11. Costantino, G.; Messina, D.; Recupero, A.; Rossi, P.P.; Spinella, N. A Web Platform for Management and Analysis of Existing Bridges. Procedia Struct. Integr. 2023, 44, 1220–1227. [Google Scholar] [CrossRef]
  12. Italian Ministry of Public Works. D.M. 17 January 2018. Nuove Norme Tecniche per Le Costruzioni. Gazzetta Ufficiale; Italian Ministry of Public Works: Rome, Italy, 2018; Volume 42. (In Italian) [Google Scholar]
  13. Fox, M.J.; Furinghetti, M.; Pavese, A. Application of the New Italian Assessment Guidelines to a 1960s Prestressed Concrete Road Bridge. Struct. Concr. 2023, 24, 583–598. [Google Scholar] [CrossRef]
  14. Rossi, P.P.; Spinella, N.; Recupero, A. The Italian Guidelines for Risk and Safety Evaluation of Existing Bridges: A Case Study. In Bridge Maintenance, Safety, Management, Digitalization and Sustainability, Proceedings of the 12th International Conference on Bridge Maintenance, Safety and Management, IABMAS 2024, openhagen, Denmark, 24–28 June 2024; CRC Press: Boca Raton, FL, USA, 2024; pp. 2882–2889. [Google Scholar] [CrossRef]
  15. Rossi, P.P.; Spinella, N.; Recupero, A. Experimental Application of the Italian Guidelines for the Risk Classification and Management and for the Safety Evaluation of Existing Bridges. Structures 2023, 58, 105387. [Google Scholar] [CrossRef]
  16. Santarsiero, G.; Masi, A.; Picciano, V.; Digrisolo, A. The Italian Guidelines on Risk Classification and Management of Bridges: Applications and Remarks on Large Scale Risk Assessments. Infrastructures 2021, 6, 111. [Google Scholar] [CrossRef]
  17. Salvatore, W.; Uva, G.; Venanzi, I.; Mazzotti, C.; Morici, M.; Natali, A.; Dall’Asta, A.; Ubertini, F.; Mannella, P.; Lepori, L.; et al. Application of Italian Guidelines for Structural-Foundational and Seismic Risk Classification of Bridges: The Fabre Experience on a Large Bridge Inventory. Procedia Struct. Integr. 2024, 62, 1–8. [Google Scholar] [CrossRef]
  18. Borzi, B.; Ceresa, P.; Franchin, P.; Noto, F.; Calvi, G.M.; Pinto, P.E. Seismic Vulnerability of the Italian Roadway Bridge Stock. Earthq. Spectra 2015, 31, 2137–2161. [Google Scholar] [CrossRef]
  19. Spinella, N.; Gullì, S. A Web-Based Graphical User Interface for Some Opensees Commands. In Proceedings of the 2022 Eurasian OpenSees Days; Lecture Notes in Civil Engineering; Springer: Cham, Switzerland, 2023; Volume 326 LNCE, pp. 326–333. [Google Scholar] [CrossRef]
  20. Miluccio, G.; Losanno, D.; Parisi, F.; Cosenza, E. Traffic-Load Fragility Models for Prestressed Concrete Girder Decks of Existing Italian Highway Bridges. Eng. Struct. 2021, 249, 113367. [Google Scholar] [CrossRef]
  21. Nettis, A.; Nettis, A.; Ruggieri, S.; Uva, G. Corrosion-Induced Fragility of Existing Prestressed Concrete Girder Bridges under Traffic Loads. Eng. Struct. 2024, 314, 118302. [Google Scholar] [CrossRef]
  22. Minnucci, L.; Scozzese, F.; Carbonari, S.; Gara, F.; Dall’Asta, A. Innovative Fragility-Based Method for Failure Mechanisms and Damage Extension Analysis of Bridges. Infrastructures 2022, 7, 122. [Google Scholar] [CrossRef]
  23. Santarsiero, G.; Masi, A.; Picciano, V.; Musano, A. Preliminary Assessment of Pre-1980 Girder Bridges in the Framework of the Italian Guidelines. Procedia Struct. Integr. 2024, 62, 121–128. [Google Scholar] [CrossRef]
  24. Rossi, P.P.; Spinella, N. Protocol of Investigations for the Preliminary Assessment of the Structural Safety of Highway Overpasses. Structures 2024, 70, 107609. Available online: https://www.sciencedirect.com/science/article/pii/S2352012424017624 (accessed on 27 October 2024). [CrossRef]
  25. Colajanni, P.; Recupero, A.; Ricciardi, G.; Spinella, N. Failure by Corrosion in PC Bridges: A Case History of a Viaduct in Italy. Int. J. Struct. Integr. 2016, 7, 181–193. [Google Scholar] [CrossRef]
  26. Anania, L.; Badalà, A.; D’Agata, G. Damage and Collapse Mode of Existing Post Tensioned Precast Concrete Bridge: The Case of Petrulla Viaduct. Eng. Struct. 2018, 162, 226–244. [Google Scholar] [CrossRef]
Figure 1. Two examples of PC bridges assessed along A18 and A20 highways.
Infrastructures 09 00196 g001
Figure 2. Form for visual inspection of PC girders (web app screenshot).
Infrastructures 09 00196 g002
Figure 3. Geographical positions of PC bridges on highway: (a) A18 and (b) A20 (web app screenshot).
Infrastructures 09 00196 g003
Figure 4. Relative frequency (fr) of length of girders (L) and maximum height of piers (H).
Infrastructures 09 00196 g004
Figure 5. Maximum girder length and number of bays of the investigated PC bridges: (a,b) A18; (c,d) A20.
Infrastructures 09 00196 g005
Figure 6. Peak ground acceleration at bedrock for the investigated PC bridges: (a) A18 and (b) A20.
Infrastructures 09 00196 g006
Figure 7. Some defects identified on PC bridges of A18 and A20 highways.
Infrastructures 09 00196 g007
Figure 8. Number of defects detected on PC girders of bridges of highway A18 at different (a) extension and (b) intensity grades.
Infrastructures 09 00196 g008
Figure 9. Number of defects detected on PC girders of bridges of highway A20 at different (a) extension and (b) intensity grades.
Infrastructures 09 00196 g009
Figure 10. Structure–foundation (SF) and seismic (S) classes of attention of investigated PC bridges: (a,b) A18, (c,d) A20.
Infrastructures 09 00196 g010
Figure 11. Prioritization defect index for PC bridges of highway A18: (a) PC girders and RC beams, (b) slabs, piers and abutments.
Infrastructures 09 00196 g011
Figure 12. Prioritization defect index for PC bridges of highway A20: (a) PC girders and RC beams, (b) slabs, piers and abutments.
Infrastructures 09 00196 g012
Table 1. List of the main defects detected on the PC bridges of highways A18 and A20.
CodeDescriptionCodeDescription
dif-gen_6, G = 5piers or abutments out of plombca-cap_13, G = 4presence of rushing cracks
ril-fond_1, G = 5movements undermining bridge foundationsca-cap_17, G = 5bending of rebars
ril-fond_5, G = 5movements of the foundationca-cap_24, G = 5defects on Gerber saddles
cap_7, G = 4worn sheaths and oxidation of prestressing wiresapp_3, G = 4blockage of the bearing
cap_8, G = 4exposed and oxidated prestressing wiresapp_6, G = 4squashing of plumb bearings
cap_9, G = 5cross-section reduction in prestressing reinforcementapp_8, G = 4excessive lateral deformation of rubber bearings
cap_12, G = 5breakage of prestressing bars or anchorage failureapp_9, G = 4squashing of rubber bearings
ca-cap_10, G = 5presence of diagonal cracksapp_13, G = 4loss of circular shape of roller bearings
Disclaimer/Publisher’s Note: The statements, opinions and data contained in all publications are solely those of the individual author(s) and contributor(s) and not of MDPI and/or the editor(s). MDPI and/or the editor(s) disclaim responsibility for any injury to people or property resulting from any ideas, methods, instructions or products referred to in the content.