1. Introduction
The development of society, the influence of transportation, as well as their corresponding relationships, have become so complex that their use without proper state organization becomes uncertain [
1]. Since 2014, there has been an average vehicle growth of 3% in Latin America and a trend indicating a doubling of currently existing vehicles in the next 25 years, considering this trend from 2014. Faced with this issue, only plans that remain pending or are not being correctly implemented in urban traffic are left. Vehicular noise is a problem to which we give little importance but has an impact on public health, causing issues such as stress, headaches, and irritability, among others. It is well-known that for the World Health Organization (WHO), the optimal limit for street noise should constantly be 30 dB, but this is not met in reality, and in many cities, noise levels exceed 80 dB at their most critical traffic points [
2].
Transportation is one of the primary and largest air pollutants in the world. Several studies show that fuel combustion emits multiple pollutants, which can severely affect the lungs of growing children, leading to a decrease in lung function [
2].
The transition to a competitive economy with low carbon emissions means that the EU must be prepared to ensure that, by 2050, it will reduce its internal emissions by 80% compared to 1990. The European Commission has conducted extensive model analyses with various possible scenarios showing how these objectives could be achieved. This analysis of different scenarios demonstrates that in terms of profitability, it would be optimal to achieve an internal emission reduction of 40% by 2030 compared to the 1990 level and 60% by 2040. The reduction in emissions is 25%. Thus, an annual reduction of approx. 1% would be achieved in the first decade by 2020, compared to the 1990 level. In the second decade from 2020 to 2030, there would be a reduction of 1.5%, and in the last two decades by 2050, there would be a reduction of 2%. It is expected that with the increased availability of more cost-effective technologies, efforts will be intensified, particularly in the transportation sector [
3].
In the 2030 Agenda for Sustainable Development, sustainable transportation is mainstreamed across several Sustainable Development Goals (SDGs) and targets. Specifically, target 11.2 is aimed at providing “access to safe, affordable, accessible and sustainable transport systems for all, improving road safety, notably by expanding public transport, with special attention to the needs of those in vulnerable situations, women, children, persons with disabilities and older persons” [
4].
Accessibility to public transportation in cities increases with population growth and geographical expansion. Recent poorly applied transportation planning techniques have led to unequal access distribution, resulting in insecurity and environmental pollution, while favoring private transportation and neglecting local and non-motorized public transportation [
5]. Traffic congestion is defined as vehicles moving slowly due to limited road capacity. In simpler terms, congestion occurs when traffic demand approaches or exceeds road network capacity [
6]. It is a global phenomenon caused by high population density, growth in motorized vehicles, and inadequate road infrastructure planning. Regular traffic conflicts often occur, mainly due to excessive traffic during peak hours [
7]. The current assessment of the quality of public transportation services in a developing city like Gazipur helps transportation experts make better decisions about future transportation systems to improve service quality, mobility, reduce pollution, and ensure dynamic urban living [
8].
In the analysis of Karachi city, the lack of efficient public transportation is due to the extremely low cost of available cars for all types of Karachi residents, leading to excessive car usage and simultaneously increasing dependency on private cars, resulting in severe issues: accidents, congestion, and economic, social, and environmental impact [
9]. Traffic jams occur not only in metropolises and large cities but also in medium-sized cities like Starogard Gdansk, where traffic congestion has a negative impact on developing economies, society, and the environment [
10].
Similarly, Saltillo, Coahuila, like many other cities worldwide, has been a victim of an inadequate public transportation system for many years, and the outcomes of its initiatives have not resulted in a good transportation system, be it due to the lack of an adequate public transportation system, insufficient operator training, inadequate vehicle supply and service offerings, users unable to plan routes due to inconsistent schedules, etc. [
11]. India is going through the same phase of early urbanization that has already occurred in countries like Japan, the Republic of Korea, and Singapore. The increase in traffic volumes on urban roads has led to almost all intersections being fully congested. Long queues and traffic signal failures are quite common during peak hours. It is also expected that the per capita travel rate for all modes of transport will increase from 0.8 to 1.55 in 2007 and is expected to be from 1 to 2 by 2030 [
12].
The compact yet expanding city with its unsustainable growth generates longer distances. In this case, alternative models may not seem viable, but it is time to consider them. It is worth noting that the volume of both public and private vehicles circulating in a city generates several problems, one of which is related to air pollution that meets and exceeds national air quality standards. Pollution not only affects the health of inhabitants and the vitality of the city but also causes various physical damage to historical buildings [
3].
Traffic congestion is an obstacle for any developing society and affects the country’s productivity level, as people can take more than two hours to commute to work and return home, impacting their work performance and their physical and mental health [
13,
14].
Current urban mobility is causing a series of environmental conflicts highlighted globally, most of which are linked to the use of motorized transportation, responsible for energy consumption, land fragmentation due to road construction, as well as noise and air pollution. Air quality is monitored in some cities worldwide, but in Latin America, particularly in Mexico, the number of cities attentive to this environmental impact is limited, while negative impacts on human health and ecosystems increase [
15].
According to reports from Dirtepol Huánuco, in the capital of the Huánuco department, an average of 25,000 vehicles circulate daily, including motorcycles, three-wheelers, and cars. Of this total, around 13,500 are registered and operate with municipal authorization, while the rest continue to operate informally, causing vehicular congestion in the city’s main streets [
16].
In the city of Huánuco, traffic issues are so complex that other related problems arise and worsen. One of the most serious issues in Huánuco is passenger public transportation. These problems lead to inadequate urban transportation services for users, generating disorder, wasted travel time for both drivers and road users, vehicle congestion, and environmental pollution in the urban area of the Huánuco district, due to a lack of regulation, legislation, and deficient road infrastructure in the urban area of the district.
Comparing with the aforementioned regulation (Supreme Decree No. 085-2003-PCM) and according to the monitoring conducted, we have observed that in most of the assessments, the noise generated in the different detected points has reached extremely high levels, nearly doubling the standard for that type of area and time [
17].
According to Dionisio et al., vehicle congestion of all types in the city has worsened over the past five years, leading to severe air pollution. Due to the lack of public spaces in the urban area, residents leave the city towards the banks of the Huallaga and Higueras rivers in search of recreational spaces, as mentioned by Contreras Ella [
18].
The Huánuco district, whose CO emissions accumulated during the years 2019–2022 have decreased, except for the year 2020. Additionally, it can be indicated that, in the analyzed periods, the highest gas concentrations are found in the central and northeastern parts of the province, mainly due to the location of several district capitals and human activities taking place in these areas. Moreover, the northeast zone shows a distribution of localities justifying the increase in activities generating CO [
19].
Therefore, the objective of this research is to propose a model for designing an urban transportation system to improve vehicular flow, aiming to mitigate vehicular congestion and its associated issues such as environmental and noise pollution.
The report from the Huánuco Transportation Directorate indicates that there are more than 20,000 trimobiles of which only 8200 vehicles are registered as formal in the municipality of Huánuco [
20].
The sound levels are relative, reaching up to 78 decibels, and do not comply with the regulations or national environmental quality standards for noise (Supreme Decree No. 085, 2003), causing noise pollution in the mornings [
21].
According to the interview conducted with Engineer Jorge Luis Escalante Soplín, Transportation Manager of the Provincial Municipality of Huánuco, in the city of Huánuco, 90% of the roads are paved. In the city of Huánuco, there is no access to bicycle lanes except for the exit to the Kotosh Archaeological Site, he also stated that in the urban center of Huánuco, there are 76 authorized stops, most of which have been generating traffic congestion.
The increase in commercial and economic activities, such as the construction of new shopping centers, which have become poles of attraction (migratory flows) due to population growth, and the increase in vehicular transportation, education, and health care, cause persistent problems of traffic congestion and aggravate the urban public. Inhaled carbon monoxide can combine with blood hemoglobin and reduce the oxygen-carrying capacity of the human body, and long-term exposure causes heart disease, edema, severe lung congestion, and nausea, among others [
22].
It was possible to evaluate the noise intensity in 12 points of vehicle congestion identified in the urban area of the Amarilis district, belonging to the metropolitan area of Huánuco, in which it was determined that the noise intensity exceeds the ECA for noise (D.S No. 085-2003-PCM) and the WHO standards in the daytime, the evaluation was carried out for a period of 4 weeks, with monitoring 2 days a week [
23].
One of the main consequences of the chaotic transportation system is the loss of time. This directly affects the economy of users, who lose productive hours when traveling to their workplaces. If this loss of time is broken down among users of motorized vehicles, the greatest cost of time is assumed by users of conventional public transportation, who do not have the privilege of passing over private vehicles [
24].
Therefore, the objective of this research is a public transport reorganization system that allows the improvement of urban vehicle flow.
2. Literature Review
Over the last several decades, mass transit authorities have sought ways to increase transit ridership while also improving transit service quality and operational efficiency. Reflecting this mindset, much of the existing literature focuses on the development of analytical tools/methods intended to improve the utilization of transit vehicles, drivers, and/or other resources (including maintenance crews and funding) [
25].
ChiraChavala and Venter analyzed the impact of automated vehicle- and passenger-scheduling methods on the operating costs of paratransit systems. They found that such methods reduced unit paratransit transportation costs by 13%. Further extending the earlier work of Chira-Chavala and Venter, Pagano et al. assessed the impact of the computer-assisted scheduling and dispatching (CASD) systems on the service quality of paratransit services in central Illinois. They found that CASD systems allowed passengers to enjoy less riding time and more on-time services at both pickups and drop-offs and subsequently enhanced their overall satisfaction with paratransit services [
25].
The CLIMATRANS report which talks about the detailed mitigation policy bundles to be implemented for sustainable transportation in Bengaluru, emphasizes policies for better walking and cycling infrastructure and suggests measures such as congestion pricing, car-pooling, and mixed land use development. The study also talks about the positive environmental effects (such as reduced NOx and COx emissions) due to policies like High Occupancy Vehicle (HOV) lanes in the outer periphery of the city including outer ring road, NICE road, and other highways approaching the city from all sides showing that the HOV lanes, if implemented, will reduce the overall emissions by a considerable amount [
26].
It must be taken into account when analyzing the global transportation system [
27]:
Modes of transportation.
The elements of the transportation system: the people and goods transported; the vehicles that transport them; and the infrastructure network for the movement of vehicles, passengers, and goods, including terminals and transshipment points.
Movements through the transportation system, including passenger and freight traffic from all origins to all destinations.
The total trip from origin to destination through all modes and means, for each specific trip [
27].
The different modes of urban transport in Huánuco-Perú can be categorized by the type of service they provide or the volume of trips made [
28], depending on the type of service they provide:
Private transportation: Operated by the owner of the unit on roads provided, operated and maintained by the state, such as Cars, Motorcycle taxis, Vans, and Bicycles [
28].
Rental Transportation: Used by a person who pays for a vehicle provided by an operator, driver, or employee to accommodate the user’s travel preferences. Request Response Services: Contract Services [
28].
Public transportation: A transportation system that operates with fixed routes and a predetermined schedule, and that any user can access in exchange for a predetermined price [
28].
Which Bus rapid transit, also known as express bus or Cosac (high-capacity segregated corridor) is defined as a bus-based mass transit system that combines the capacity and speed of train systems with the flexibility of buses [
29].
Microbus-Rural Public Transportation Van (Combi)-Coaster: Passengers choose to travel in this medium because users prefer their routes that cover long distances and are very different from each other, in addition to the low cost of the service. On the other hand, this means is very unsafe and has low-quality standards, since its drivers do not respect traffic rules and/or are not formal [
29].
Taxis: According to Ordinance No. 1684 of the MML, there are three taxis: (1) independent taxi, a service provided by natural persons; (2) taxi station, provided by legal entities, with a minimum fleet of 10 vehicles and a communications center; and (3) Taxi Remisse, preferably aimed at tourists as it offers greater comfort, is provided by legal entities, with a minimum fleet of 10 vehicles and a communications center [
29].
Private taxi: In general, the visual characteristics by which we identify them are yellow or white paint, a top taxi sign, and a license plate number stamped on the sides. The benefits appreciated by users of this service are convenience, safety, arrival at the specific destination, and time savings [
30].
A motorcycle taxi is defined as a smaller vehicle consisting of a three-wheeled motorcycle and a small cab that is used as a means of transporting people for short distances [
29].
Mototaxi: This means of transport is a small vehicle with a maximum capacity of 2 passengers, they have very short non-established routes and established stops. In addition, Lima has more than 600,000 motorcycle taxis in operation; however, 40% of these are informal [
30].
Informal modes of transport are integrated into five classes depending on the capacities of the vehicles.
These classes are buses (class I), minibuses and microbuses (class II and III), three-wheelers and motorcycles (class IV), and those non-motorized like bicitaxis (bicycle-taxis) or those drawn by animals (e.g., horses). In this sense, mototaxi is classified as a class IV vehicle. This classification must be carefully used since, in emerging countries, the bicitaxi and mototaxi modes (whose difference lies in human propulsion or combustion engine) both have opposite legal connotations [
31].
Mototaxi emerged when bike taxi service providers changed bicycles to low-cost utility motorcycles and scooters with engines with displacements ranging from 50 to 150 cc. With this technology, physical effort and travel time were reduced in exchange for increased operational costs. This concept is also known as pedicab in the USA, Canada, most European countries, and Oceania; cycle rickshaw in South, Southeast, and East Asian countries; velotaxi in Germany; cyclo in Vietnam and Cambodia; beca in Malaysia; becak in Indonesia; trisikad in the Philippines; or trishaw in Singapore [
31].
This study tries to propose a mass transportation system with the required changes, as well as the proposal of a road design focused on a BRT(Bus Rapid Transit) system within the limits of the urban area of Huánuco, which allows the organization and improvement in the quality offered.
3. Materials and Methods
For the design of the proposal for the urban vehicular flow transportation system in Huánuco, the process began with the generation of an Origin and Destination matrix derived from a travel preferences survey. This matrix was calibrated using vehicular capacity and visual occupancy capacity and inputted into the ArcGIS program based on the previously conducted transport zoning, wherein the data were analyzed and quantified, and the routes for the proposed transport system were designed.
The research was structured into four stages: (1) Data collection on the public and private transportation road network, (2) Importation and creation of the transportation road network in the urban area of the Huánuco district, (3) Zoning and connectivity of the study area, and (4) Creation of the public transportation O/D matrix, supported by digital tools (ArcGIS 10.5, AutoCAD 2018, Excel 2017).
In the processing of the collected data from the travel preferences survey, the statistical program Microsoft Excel was applied for execution and to conduct statistical analysis.
The unit of analysis corresponds to the population of the metropolitan area of Huá-nuco, for which the population >6 years old was calculated, which includes the urban area of Huánuco, the Districts, Amarilis, and Pillcomarca. The population was calculated based on the data available from the INEI Geographic Information System in which there is information on the population as of 2007, the last national census, which processed and projected the population >6 years old, to the year 2023, according to the growth rate which is 0.8%, having an analysis unit of 160,472 inhabitants; however, we cannot analyze due to the cost that would be required, in addition to the fact that it is conducting an investigation, a sample must be determined.
Vehicular and traffic occupancy evaluations were carried out along the Cortina line, and intercept surveys were conducted, all aimed at generating an Origin and Destination Matrix, along with its calibration.
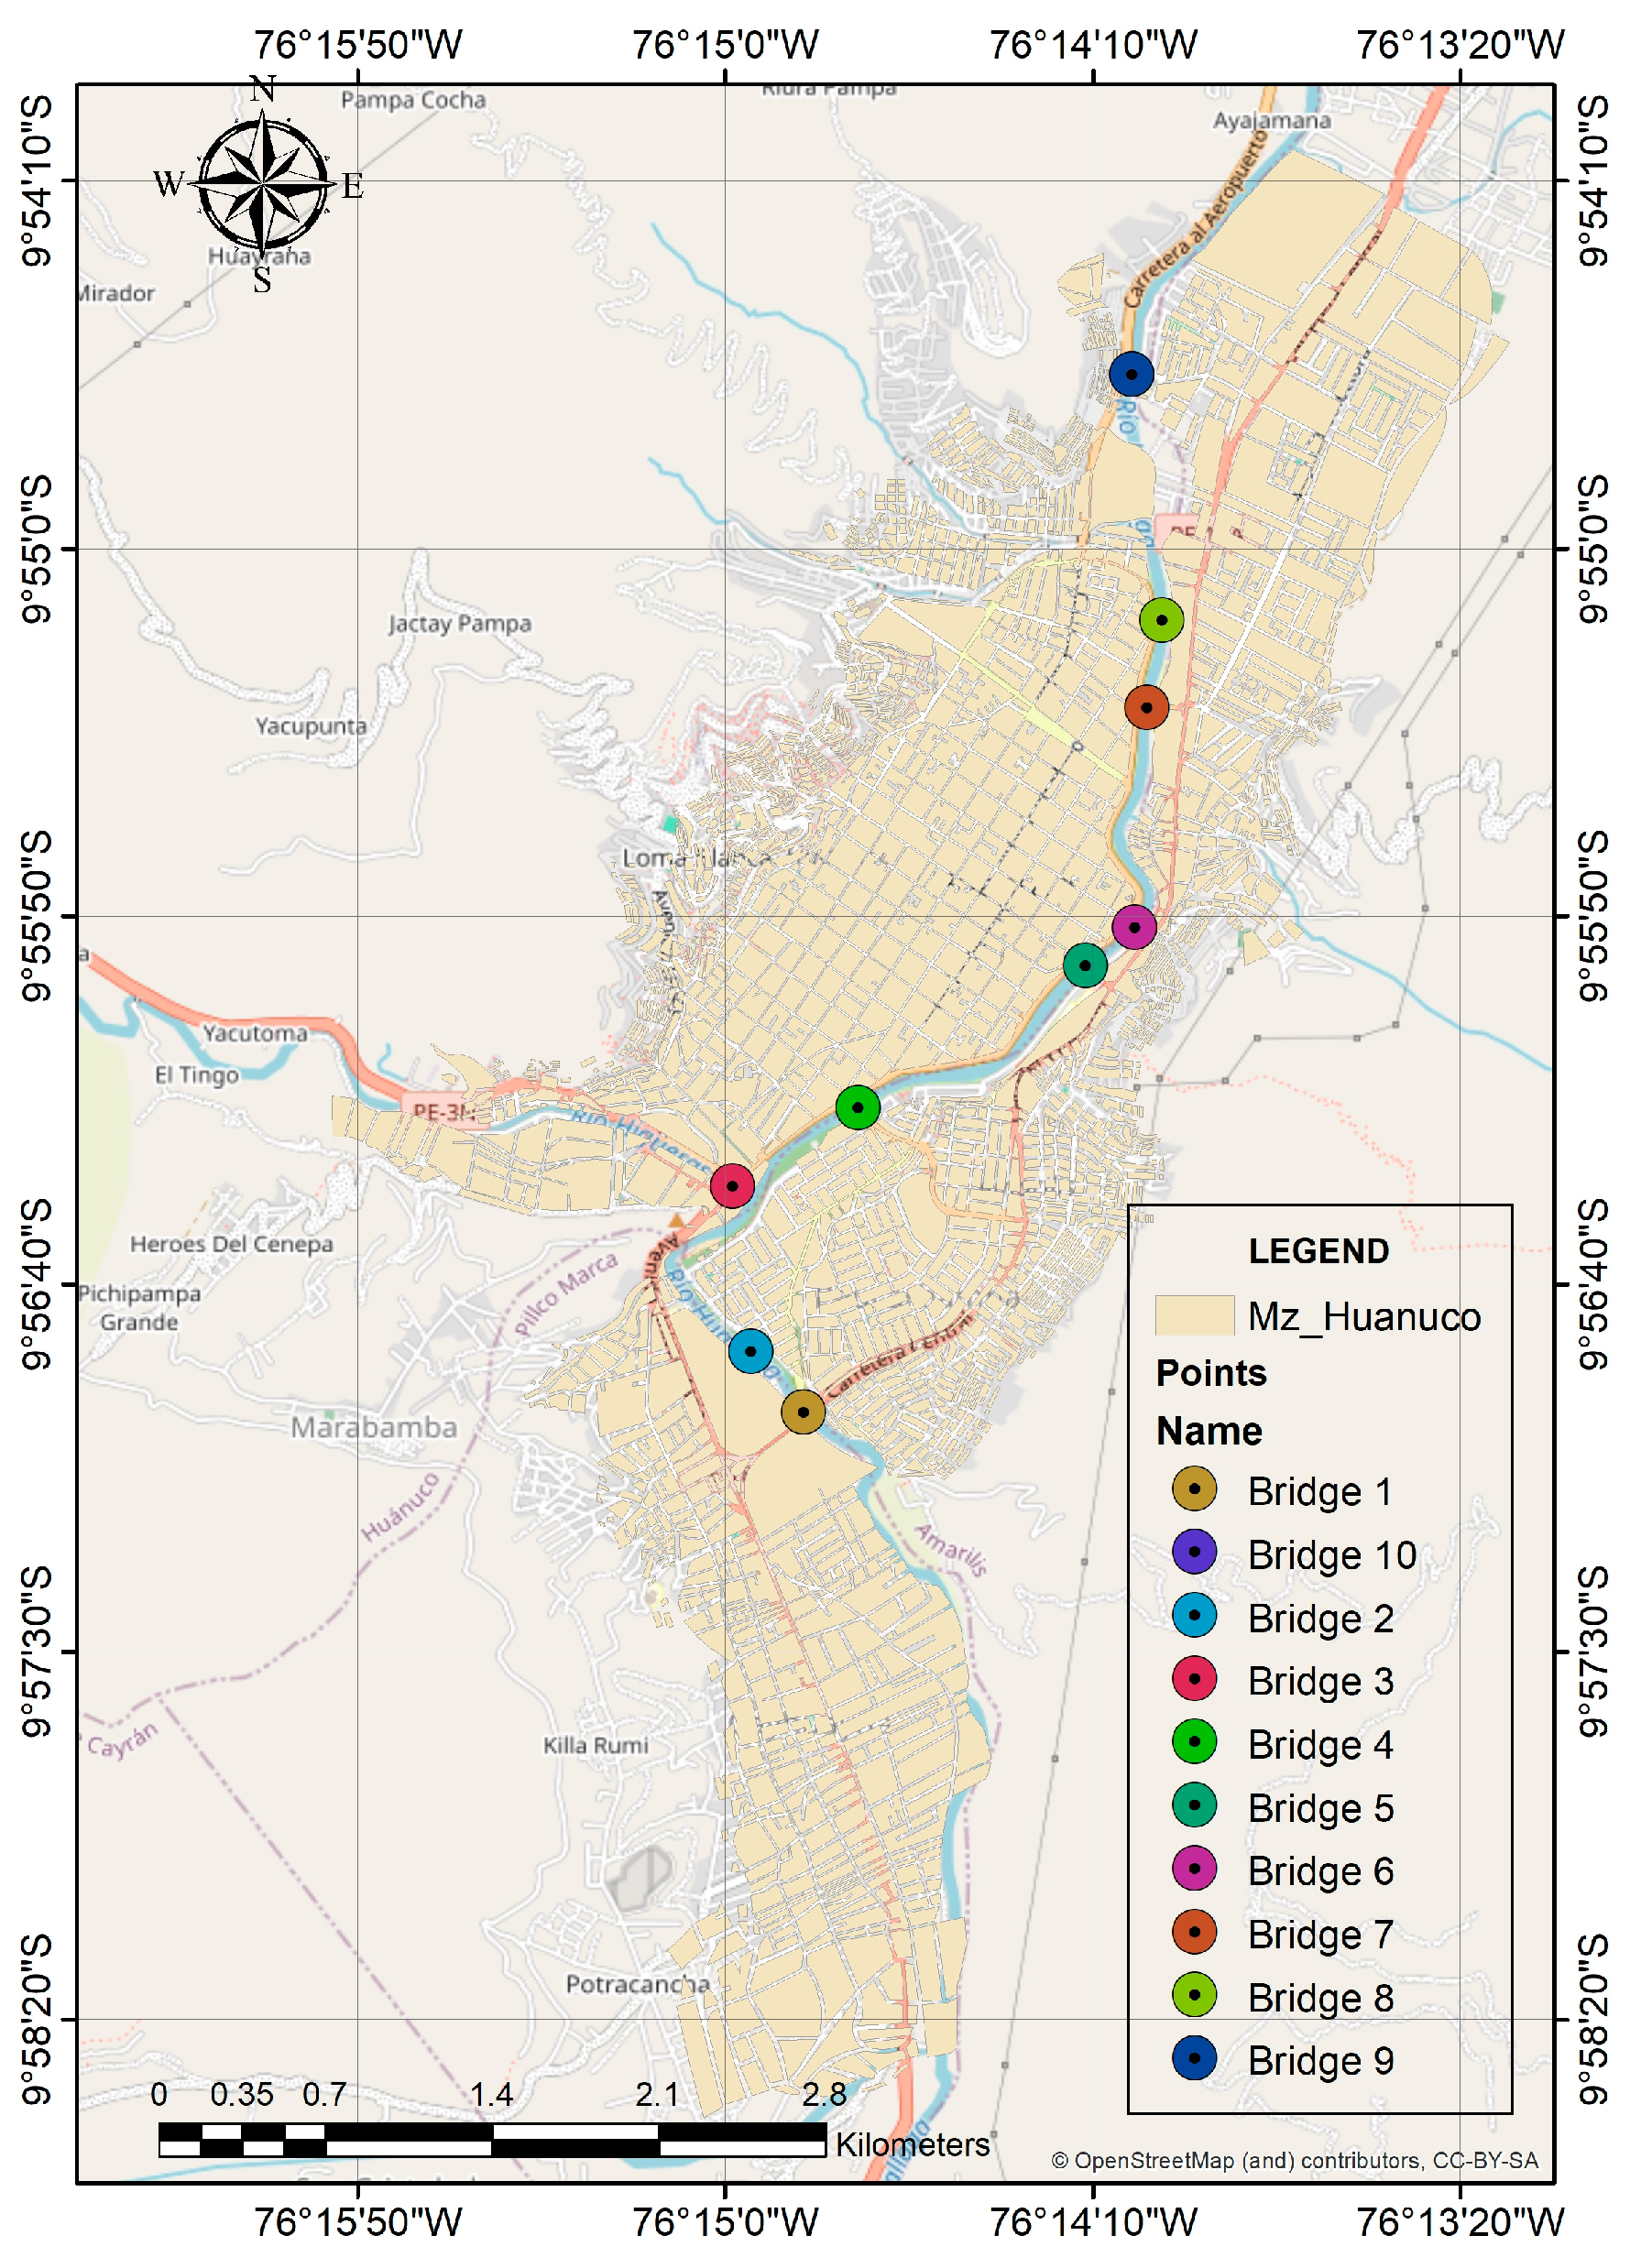
3.1. Curtain Line
The Cortina line is a fictional subdivision that follows natural or artificial boundaries where there are few crossings, such as a river, a railway line, or a central highway. These data were used to feed the Origin and Destination matrix.
The nine identified bridges known as the Cortina line are shown in
Table 1. These are located at natural boundaries and serve as infrastructure to connect roads between the districts of Huánuco, Amarilis, and Pillcomarca, all parts of the Huánuco metropolitan area.
In
Figure 1, you can see the bridges positioned as a “curtain,” distributed within the metropolitan area of Huánuco. These bridges serve as vehicular transfer points between the districts of Huánuco, Amarilis, and Pillcomarca.
3.2. Intercept Surveys
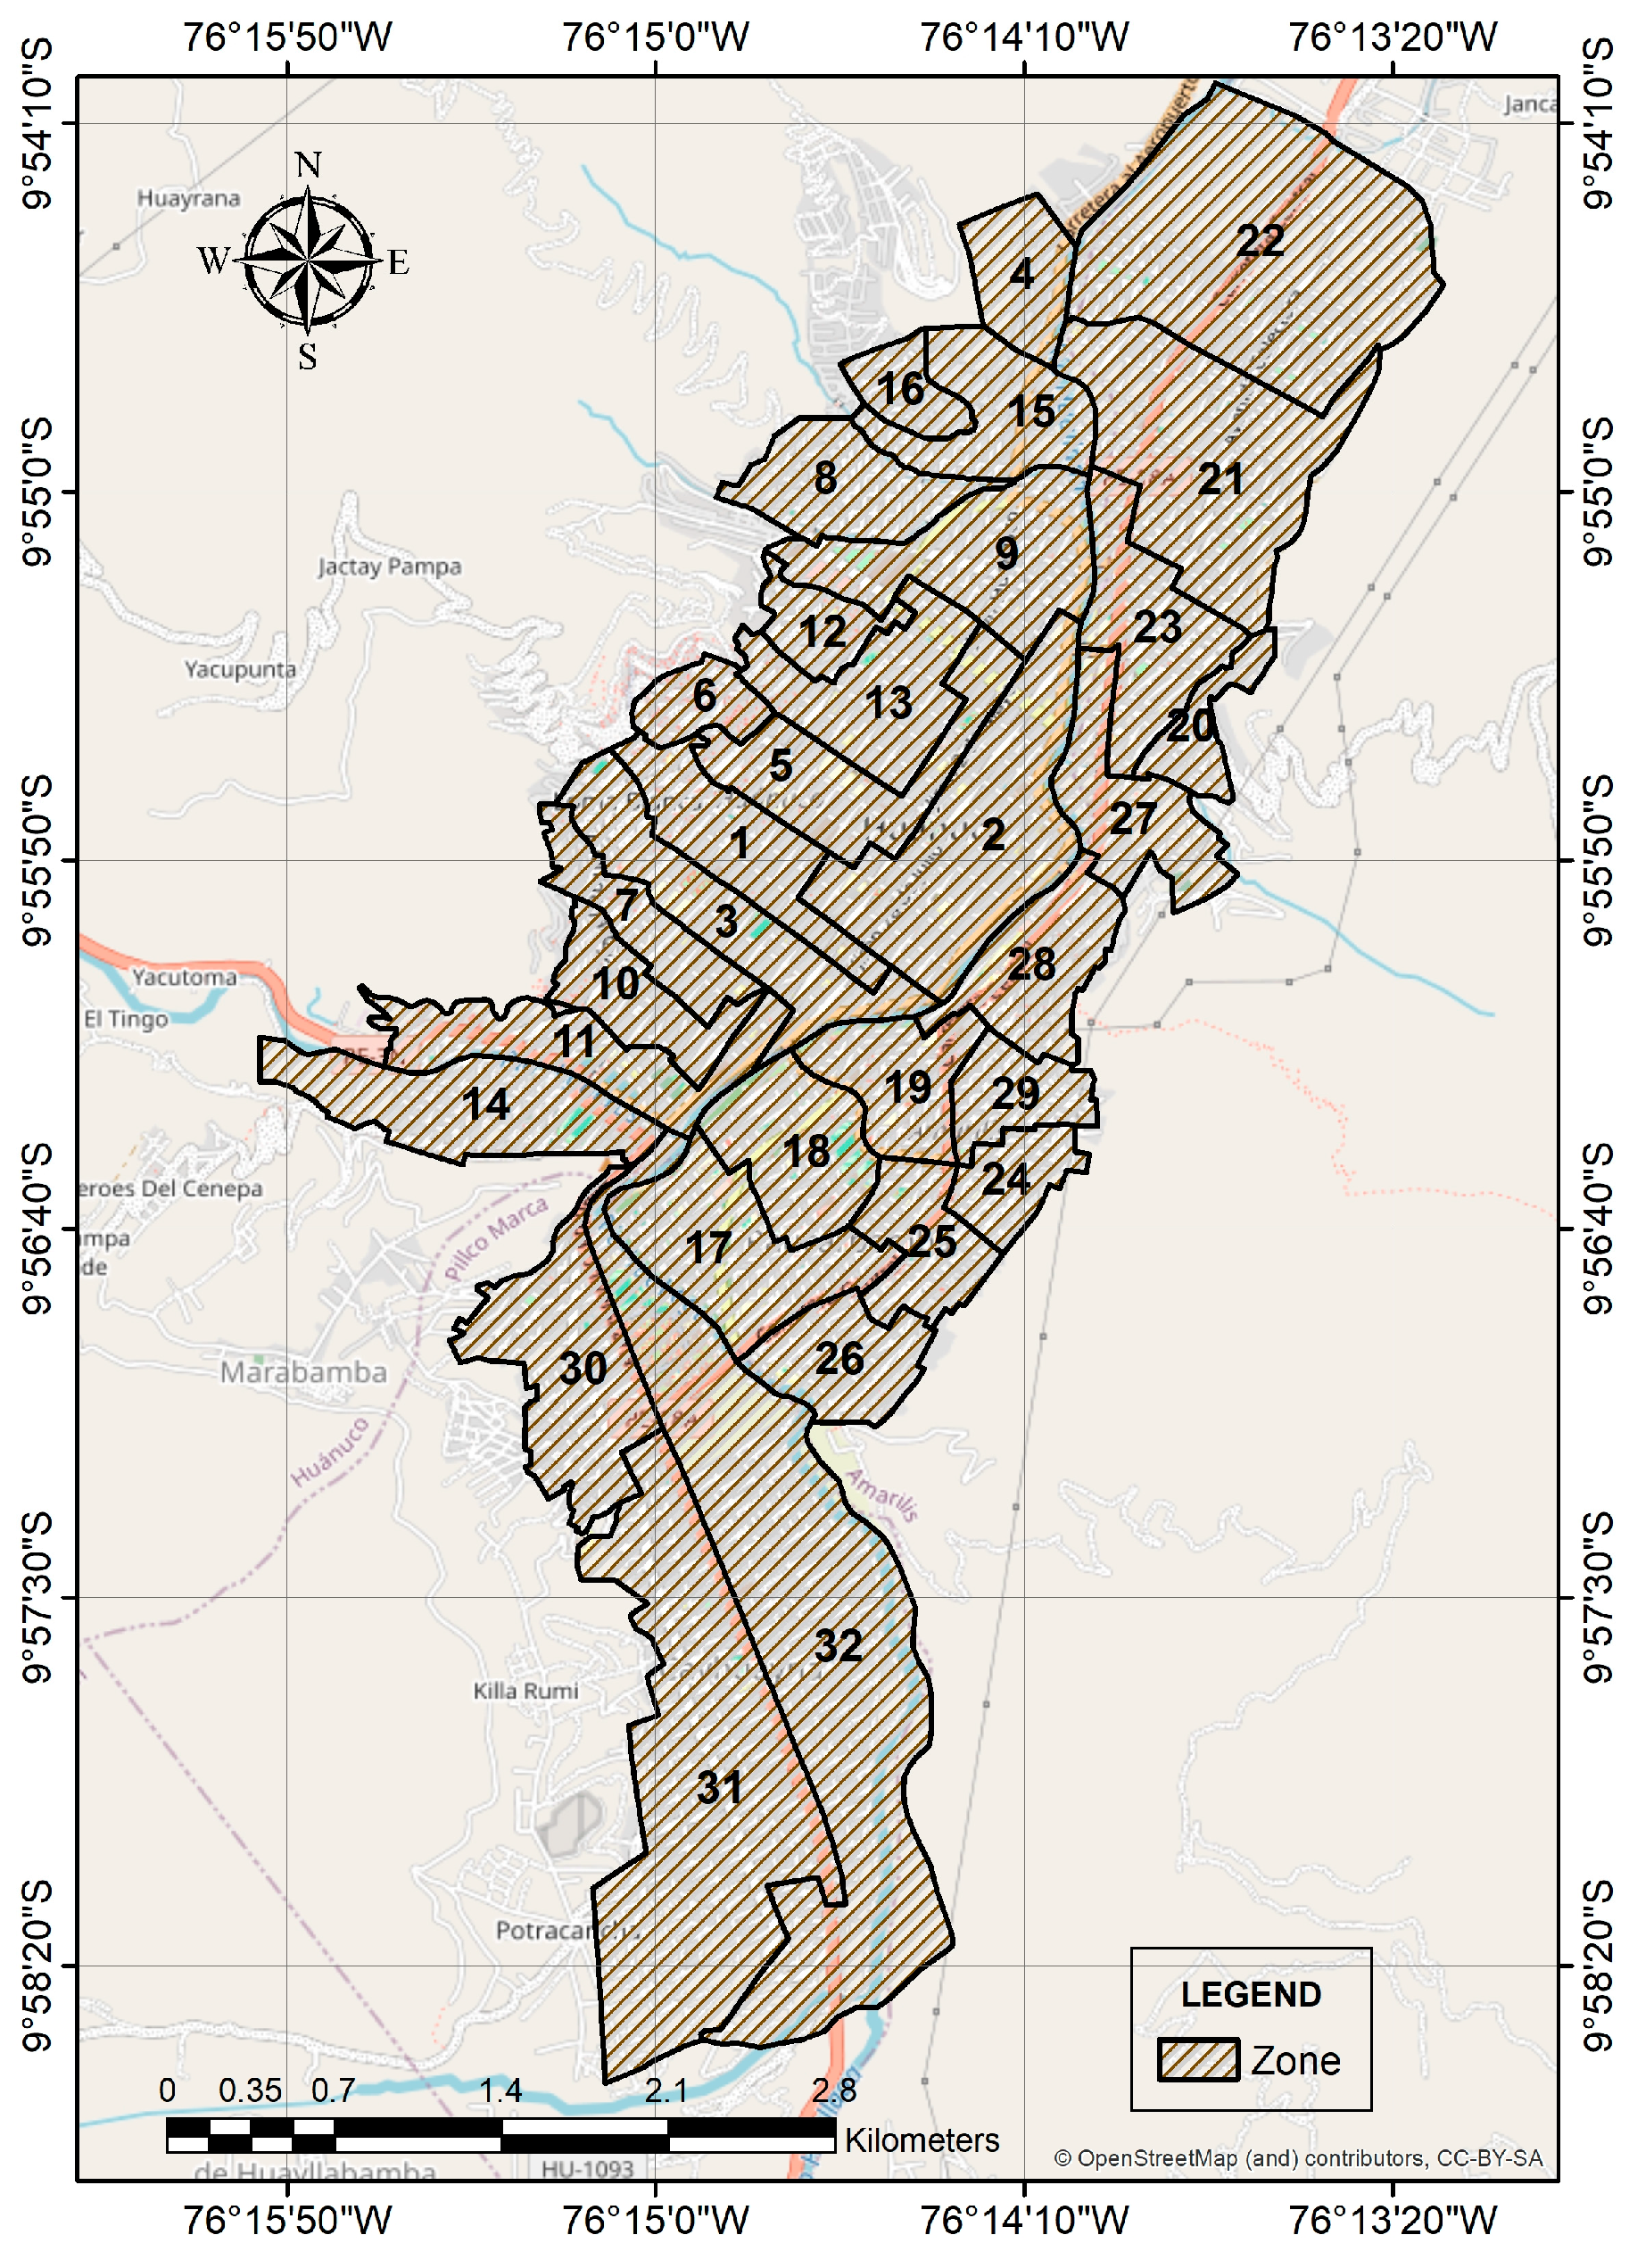
The city of Huánuco is an elongated and dispersed mid-sized city, with a low population density, divided into 32 traffic zones.
Figure 2 displays the zoning of the urban area of Huánuco city, consisting of 32 traffic zones.
The population over 6 years old was estimated for the metropolitan area of Huánuco, encompassing the urban area of Huánuco, including the districts of Amarilis and Pillcomarca. Population estimates were based on available data from the Geographic Information System of the INEI for the year 2007. These data weres processed and projected for the population over 6 years old for the year 2023, considering a growth rate of 0.8%.
This zoning has been carried out based on the existing land uses (residential, commercial, agricultural, industrial) and the existing population density, according to INEI, which is detailed by block as can be seen in the following figure.
The population was estimated by blocks in 2023, working with the population over 6 years old, delineated based on traffic zoning as shown in
Figure 3. These zones were generated considering population size, land use types, and river locations.
The Travel Preference Surveys were conducted in the traffic zones located within the metropolitan area of Huánuco, based on the calculated sample size.
The travel preference surveys were conducted by intercepting individuals residing in each study zone, aiming to gather detailed information about transportation modes, origins, and destinations of their trips, along with socio-economic data provided by residents of an urban area (the survey format can be downloaded at:
Table S1). This survey serves as input for creating the Origin and Destination matrix (the following supporting information can be downloaded at:
Table S2), in connection with the generated traffic zones and the population count in each, with 389 surveys distributed based on population density across traffic zones.
Following data collection, for processing purposes, the research relied on the support of programs such as EXCEL, MAP SOURCE, GOOGLE EARTH, and ARC GIS.
4. Results
4.1. Intercept Survey Results
From surveys conducted with 384 people through intercepts across traffic zones, the following results were obtained:
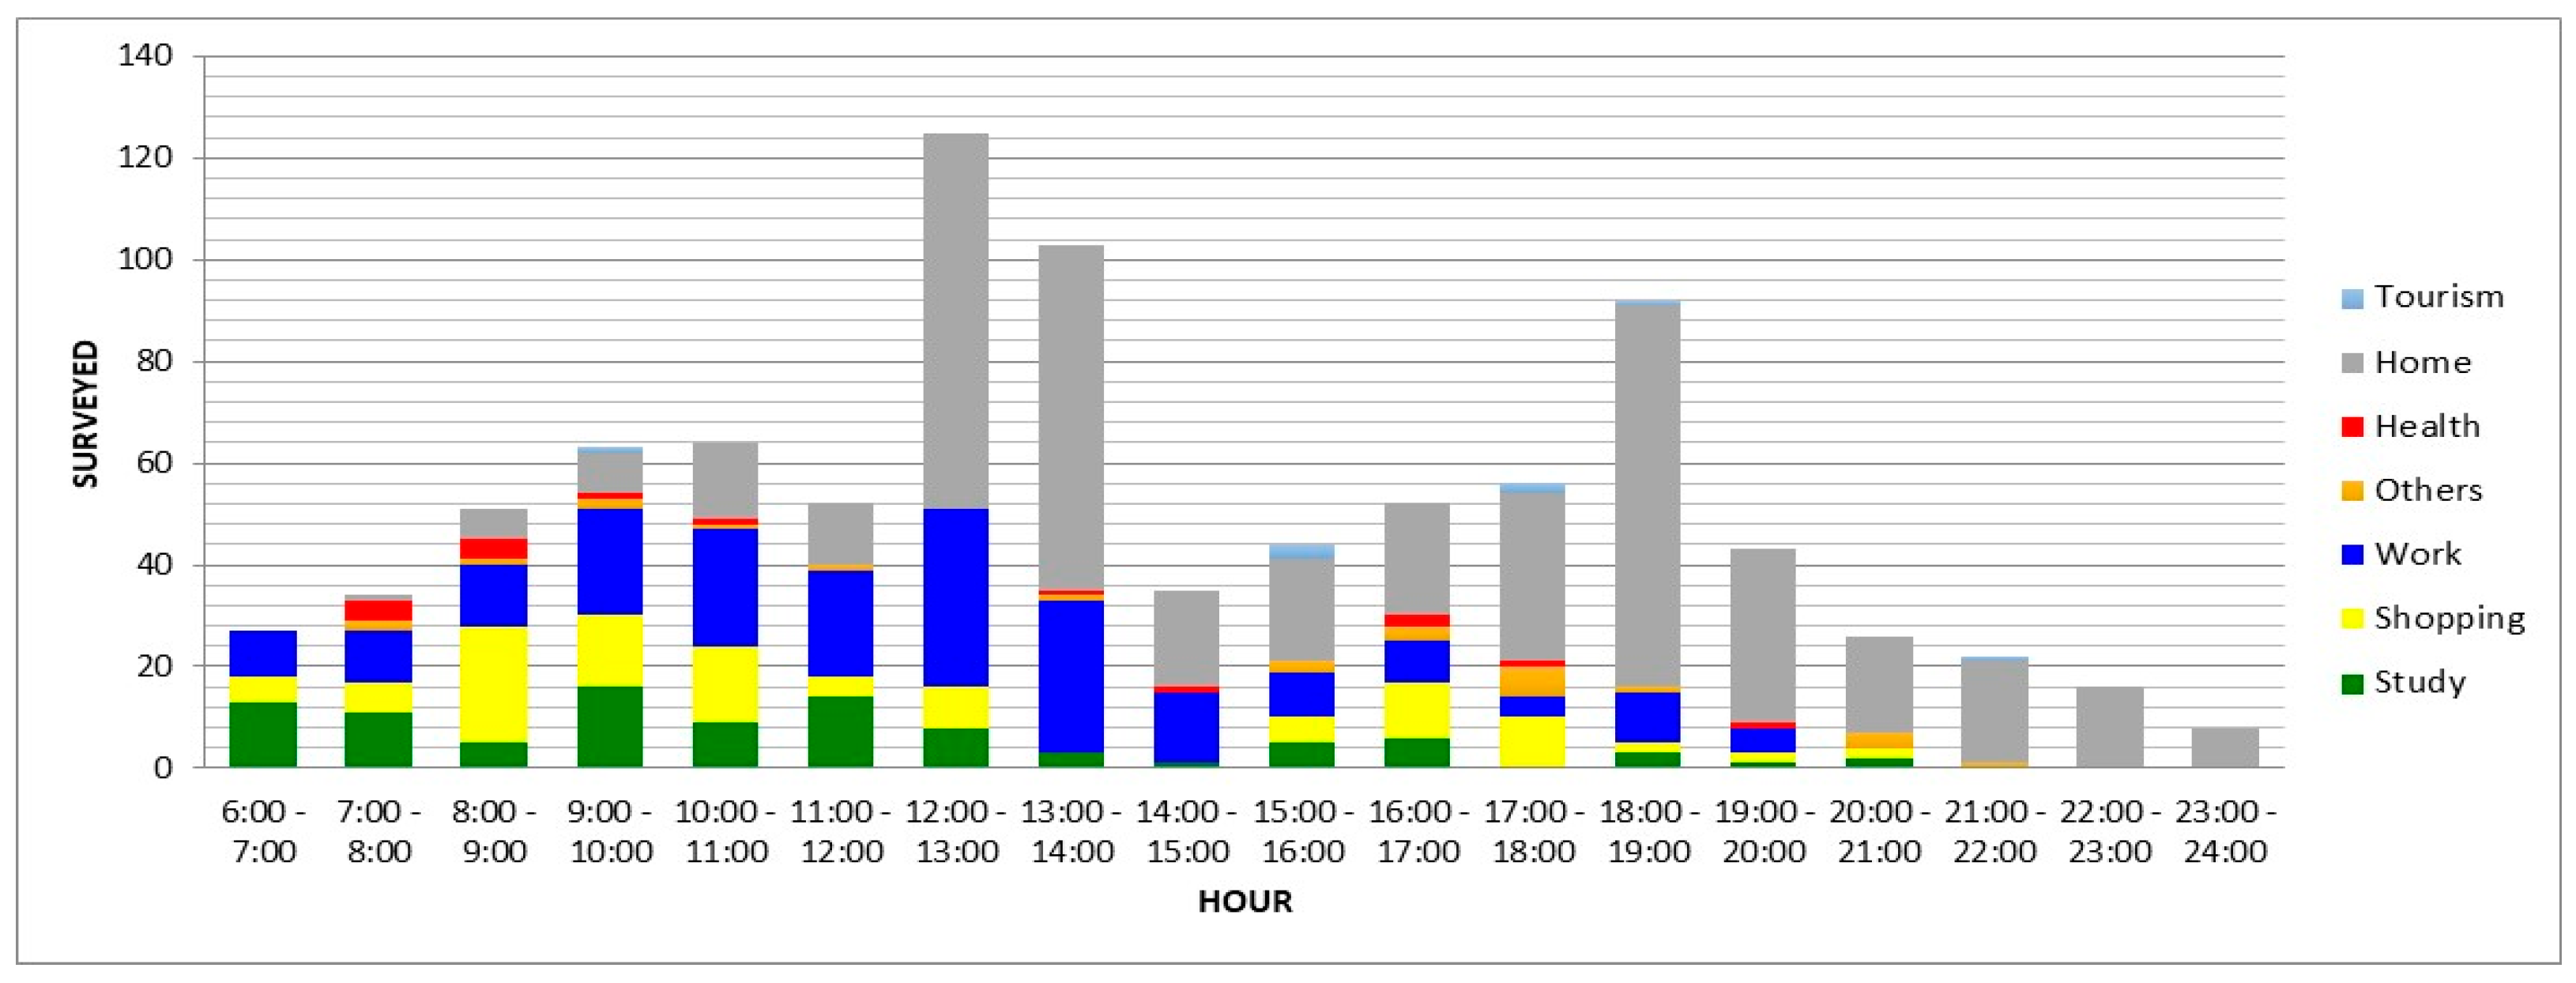
Travel is concentrated during rush hours in the city of Huánuco between 12:00–13:00 h. This is because people return home for lunch, as observed in
Figure 4. Trips during this time are short and the mode of transportation used during the rush hour is the collective car, followed by Rural Public Transportation Van, mototaxi, and walking.
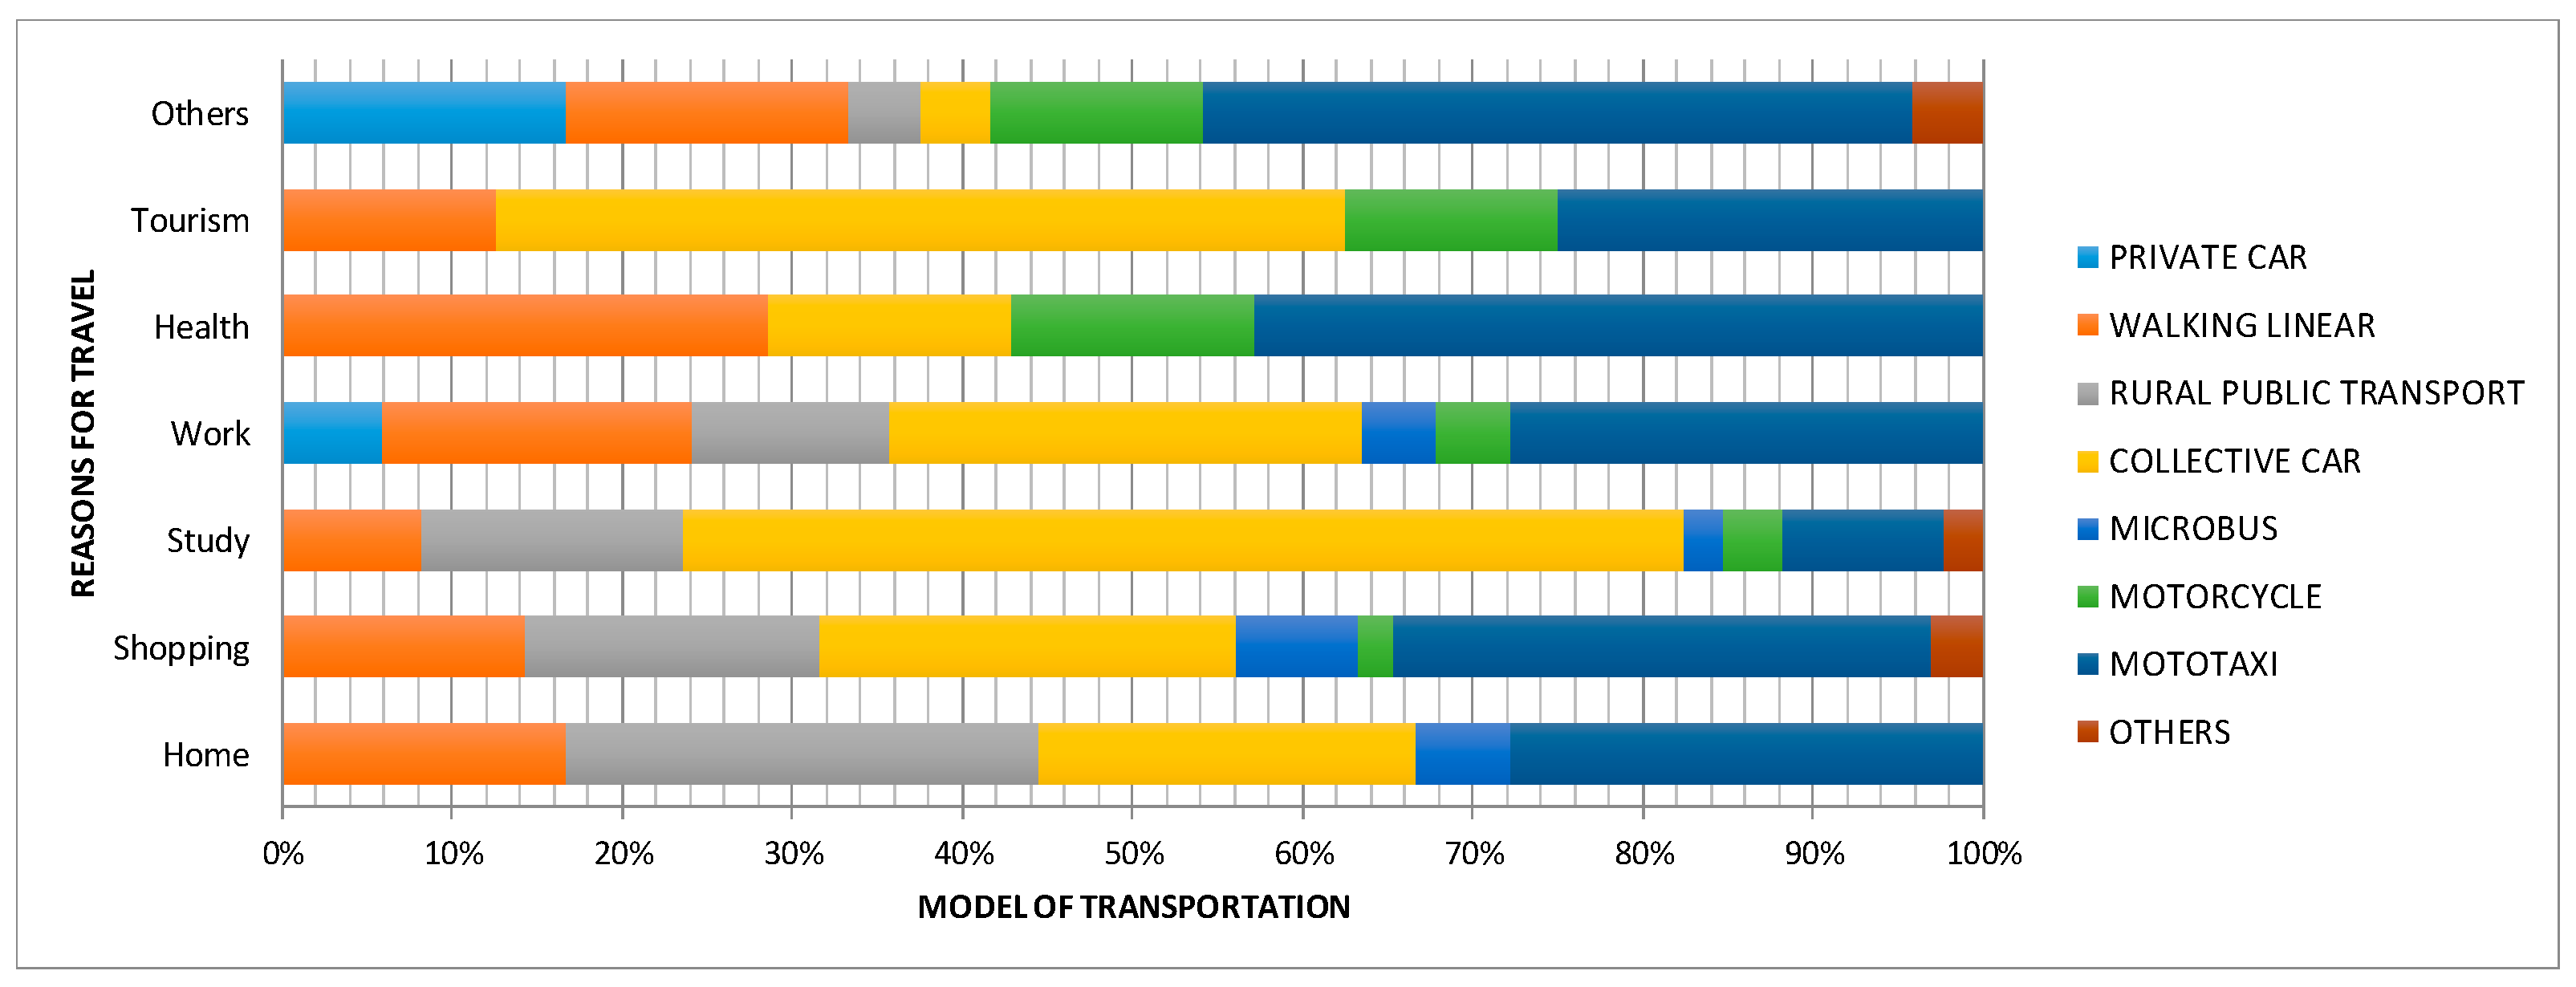
According to reasons for travel, among those who have more incidents at home, a higher percentage travel using the Rural Public Transportation Van (Combi), followed by microbuses and buses. For work-related purposes, they travel using microbuses, followed by collective cars and walking. In terms of studies, they predominantly use collective cars, followed by combis, microbuses, and walking. For shopping purposes, they primarily use mototaxis, followed by buses, vans, and walking, as depicted in
Figure 5.
As modes of transportation according to travel purposes, in the case of the collective car, which represents the highest number of trips, users travel for study purposes, followed by work and shopping. The Rural Public Transportation Van transports users primarily for shopping, followed by work and study. Mototaxis mainly transport users for work and shopping reasons. For walking, users travel mainly for work purposes, followed by shopping and study
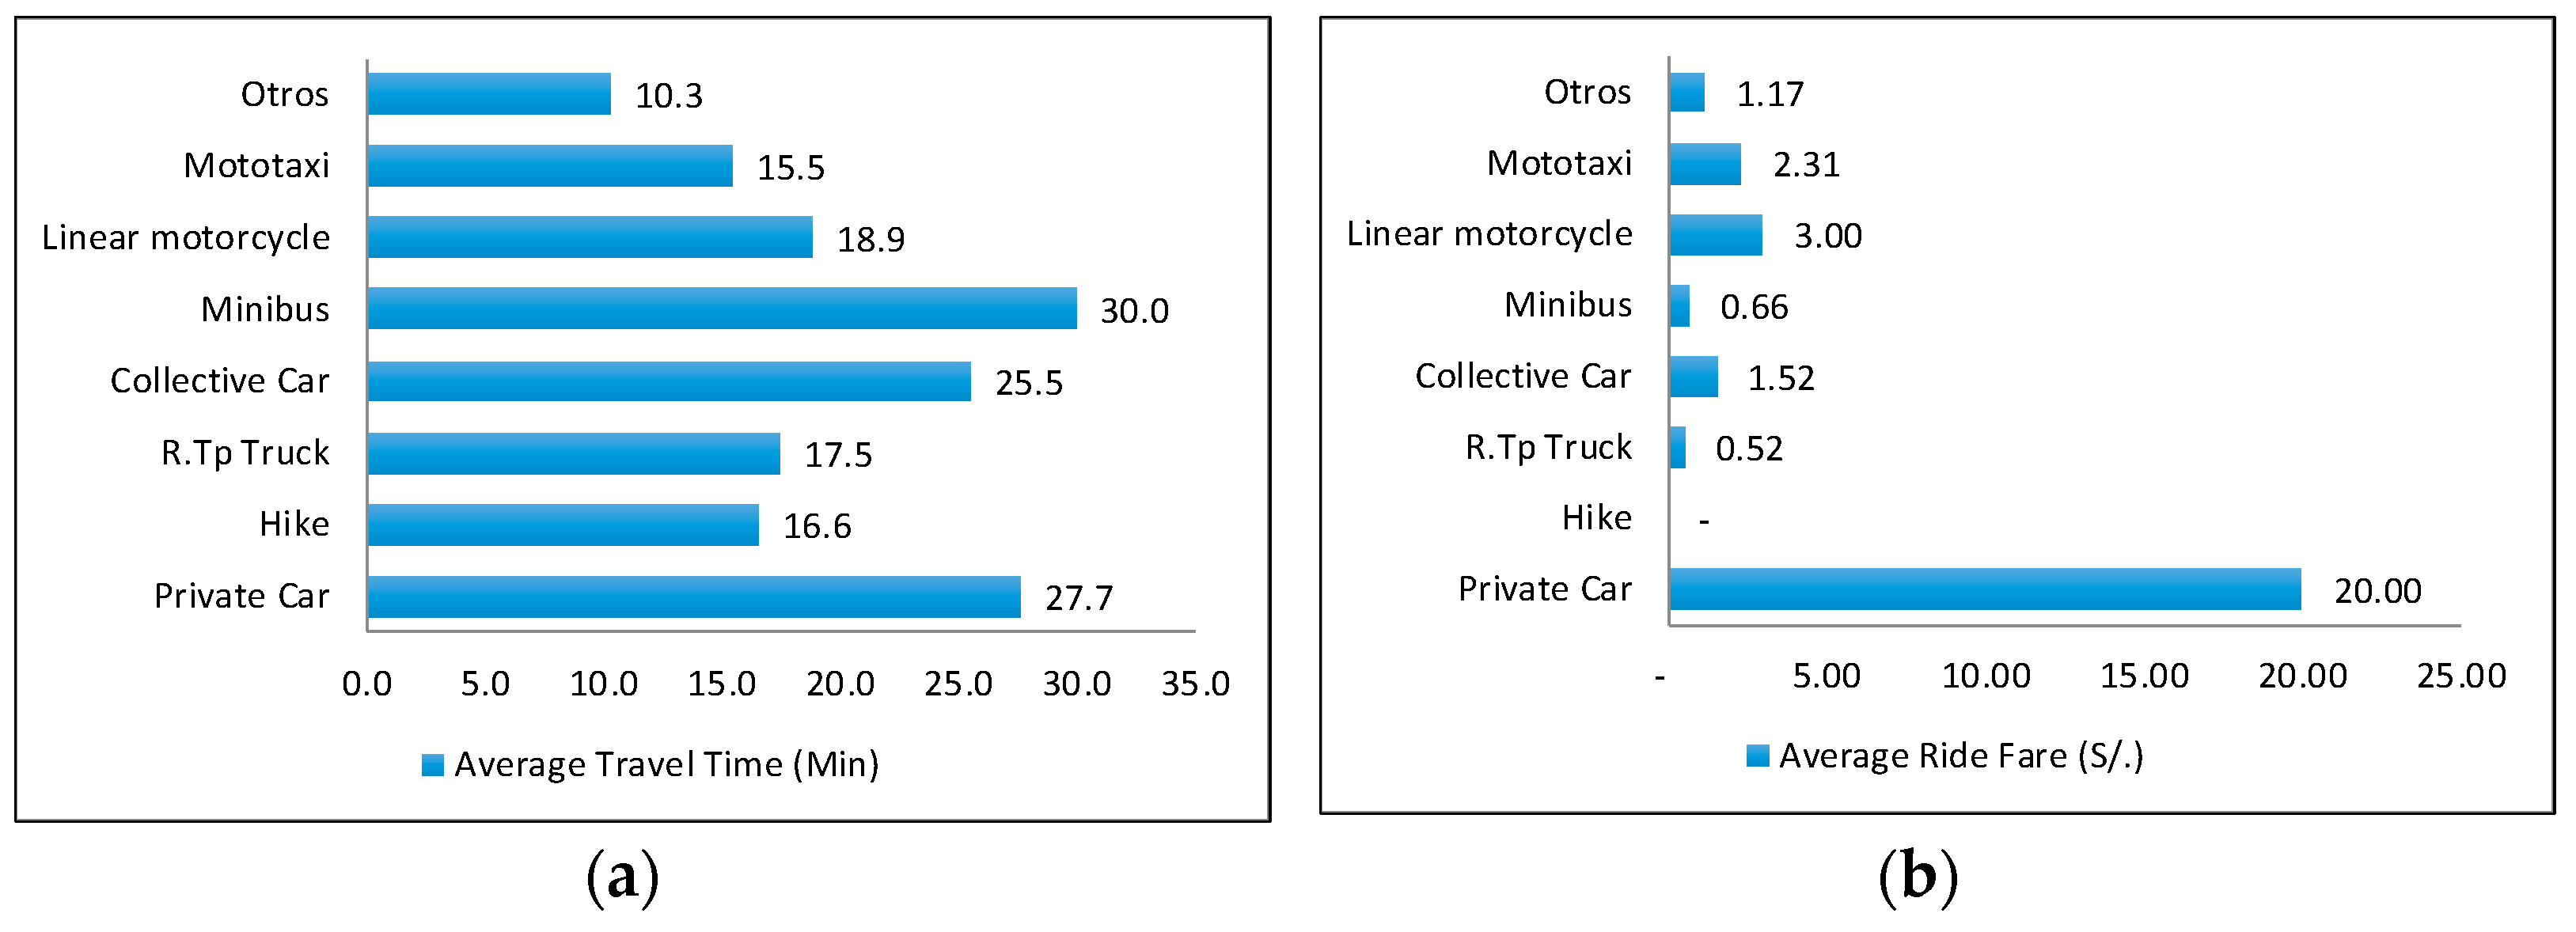
Figure 6, shows the average travel rate in the metropolitan area of Huánuco, the most expensive is the private car with 20 soles, followed by linear motorcycles that have an average cost of S/4.00, and the mototaxis that is used most frequently is S/3.00. Buses have an average cost of S/2.00, the microbus has an average cost of S/1.00, and the Rural Public Transportation Van (Combi) has an average cost of S/1.00; of which the mode of transport with the longest travel time is the minibus, with a 30-min trip, followed by a private car, with a travel time of 27.7 min, buses have a travel time of 25.5 min, linear motorcycles with 18.9 min, minibuses with 17.5 min, ototaxis with 15.5 min, and walking has an average travel time of 16.6 min
From the processing of data from surveys linked to transit areas with the objective of identifying the origins and destinations of the trips, as well as the population expansion and socioeconomic data from the Institute of Statistics and Informatics of Perú, the Origin and Destination matrix was generated, which was calibrated with the vehicle and occupancy capacities. This matrix was used to draw lines of travel desires in order to identify people’s movements and propose and determine mass transportation routes based on these.
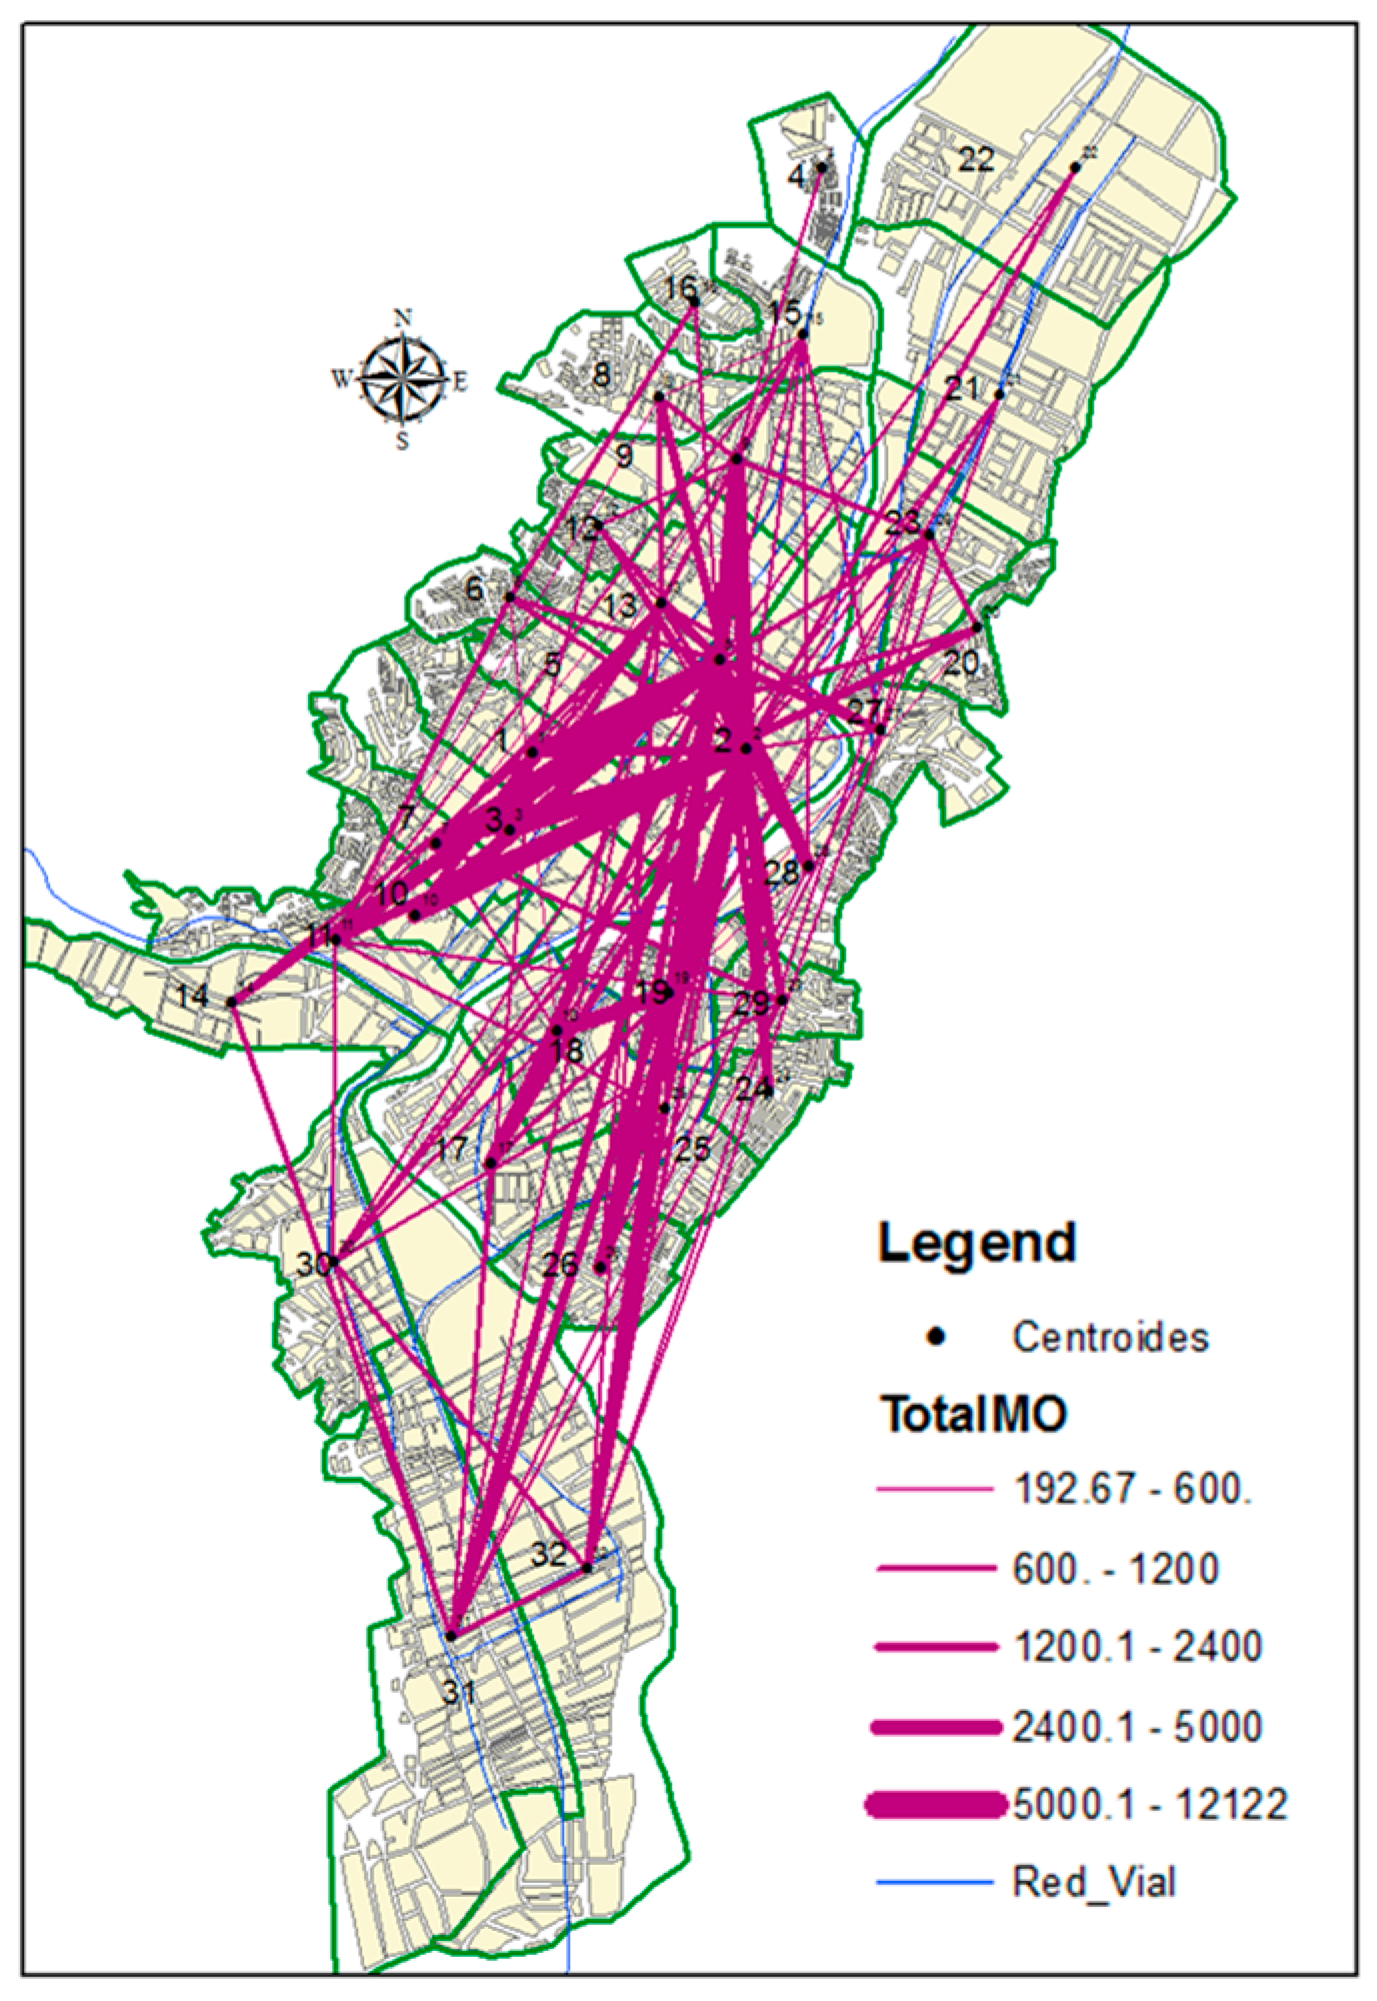
Figure 7 displays desire lines for total trips, where in the city of Huánuco, the highest incidence of trips is represented in zone 2, located in the main square, followed by zones 3 and 1, where the Huánuco Market is situated. In the Amaryllis district, trips concentrate in zone 19, home to Essalud, followed by zone 18 where the Amaryllis Market is located. In the Pillcomarca district, there is not a significant concentration as there are no commercial zones, only the Hermilio Valdizán National University, representing a small number of trips situated in zone 3.
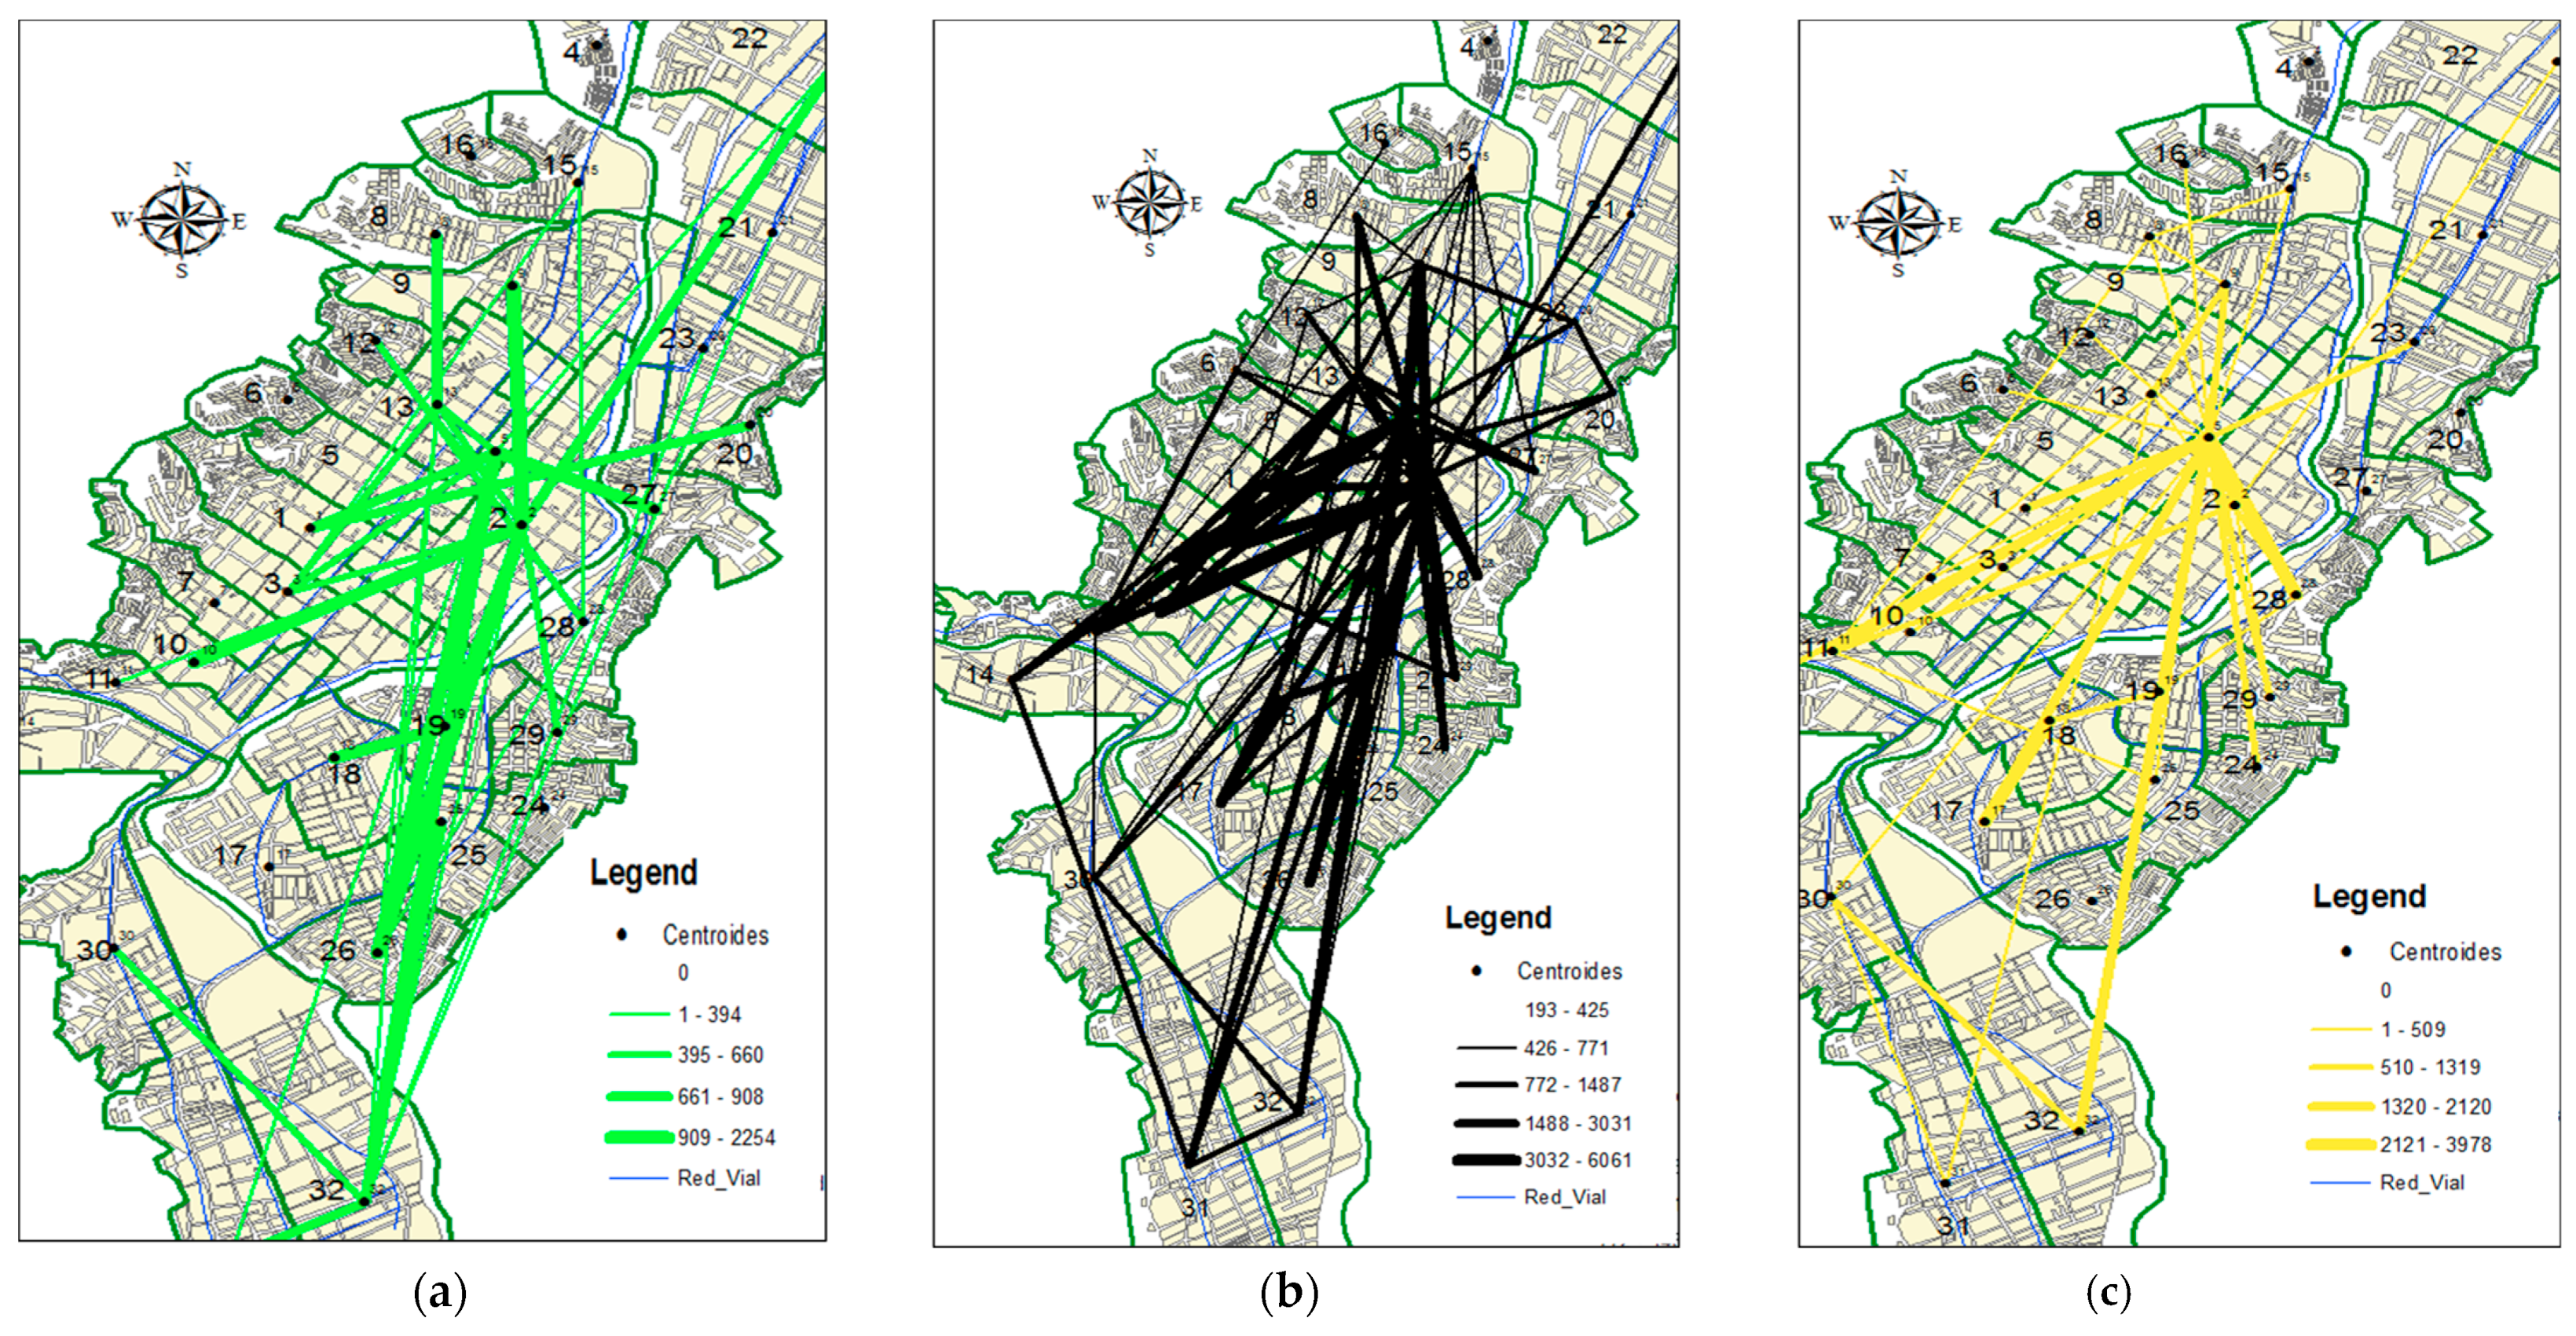
In
Figure 8, you can observe desire line maps for trips related to study, home, and shopping purposes, obtained from the intercept surveys conducted in the metropolitan area of Huánuco. From there, it can be identified that there are study concentration areas along roads in zone 30, where the Hermilio Valdizan National University is located, and in zone 2, where the University of Huánuco is situated. This zone also concentrates on the emblematic schools of Huánuco. Regarding the home-related trips map, it appears scattered, but the highest concentration is found in zones 2, 7, 10, 17, 18, 19, 3, 31, and 32, the areas with higher population density. For shopping-related trips, the concentration is in zones 2, 5, 12, 9, 13, and 8, where the commercial centers and markets of Huánuco are located.
In
Figure 9, you can see the maps of travel desire lines for reasons of health, work, and tourism, obtained from the intercept surveys carried out in the metropolitan area of Huanuco, from which it can be identified that, for health reasons, they have trips in zone 2 where the regional hospital is located, zone 10 where the metropolitan is located, zone 18 and 19 where the Essalud and the C.S. are located. Showing zone 21 where Peru Korea is located, from the map for work reasons, it can be seen that there is a concentration in zone 2 and surrounding areas in the center of Huánuco, where the headquarters of the different institutions are located. On the travel map for tourism reasons, it is observed that trips are made to zone 2 where the main square and the main and oldest churches are located.
Desire line maps for travel modes—walking mode, motorcycle mode—were obtained from intercept surveys conducted in the metropolitan area of Huánuco. From these, it can be identified that pedestrians predominantly travel through the center of Huánuco in walking mode, covering short distances. In the linear map for motorcycle trips, it is evident that most trips are towards areas with considerable distances, primarily concentrating in the center of Huánuco.
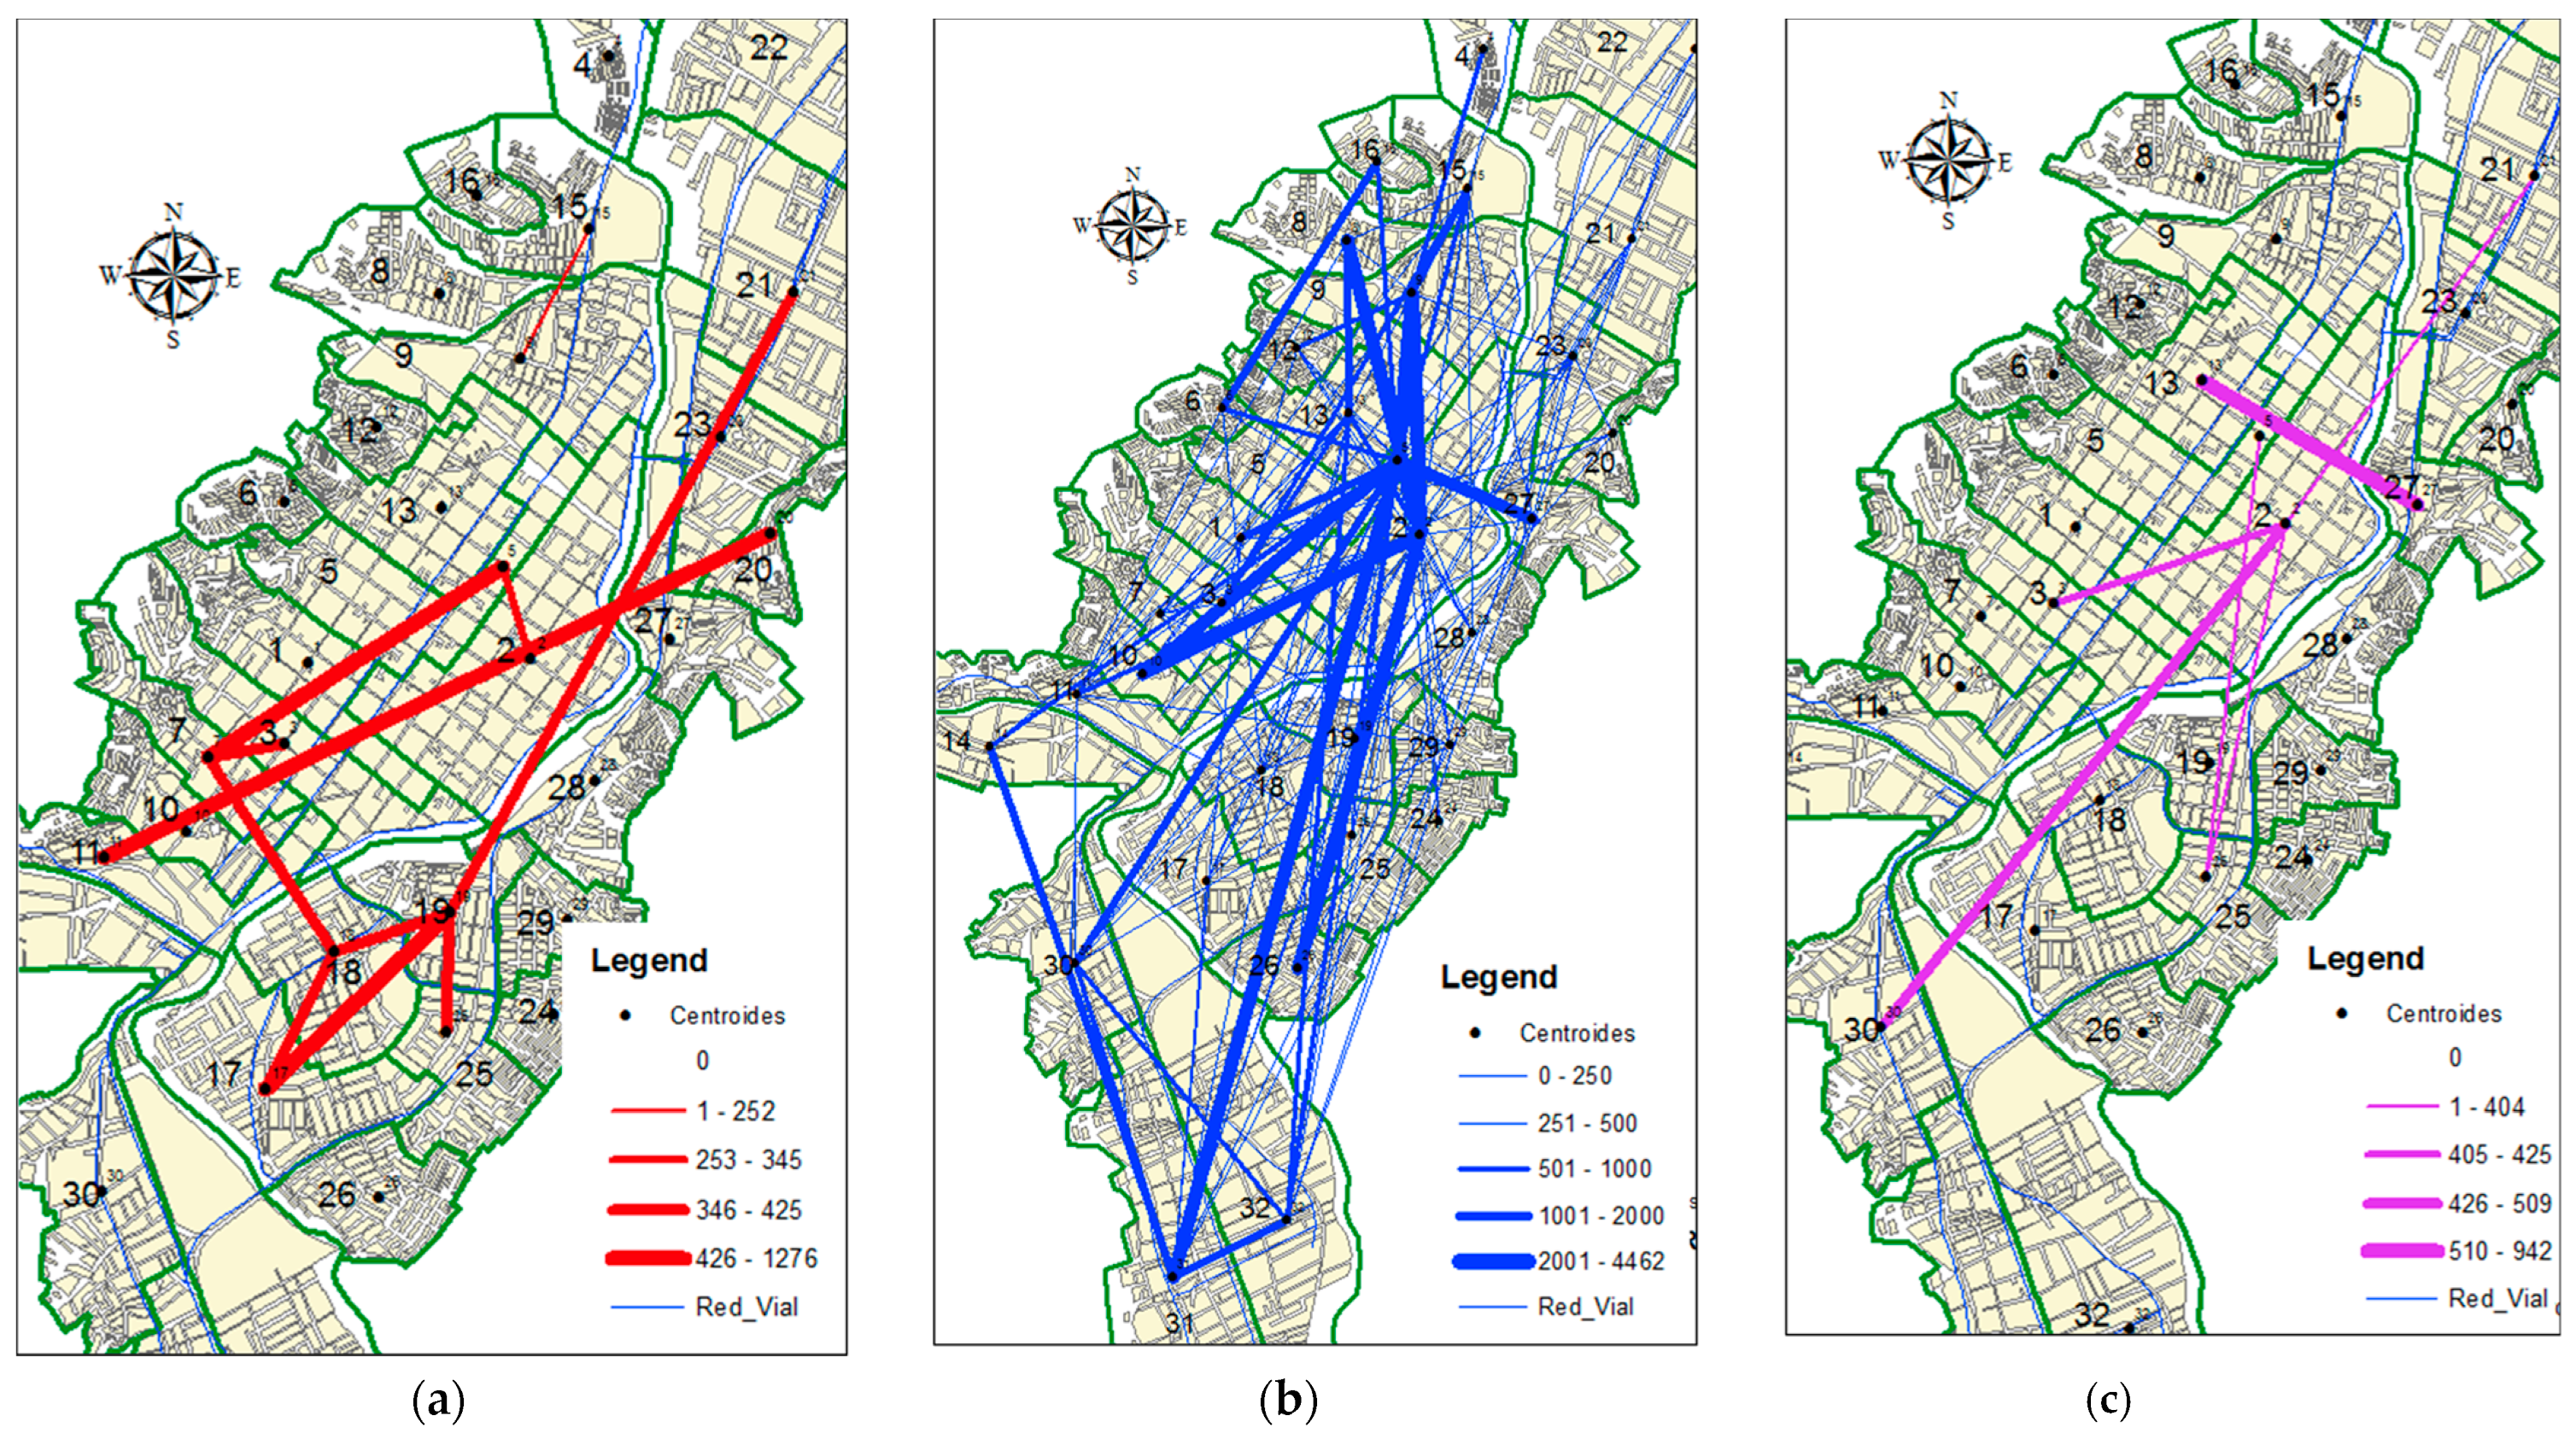
In
Figure 10, you can observe desire line maps for travel modes—Mototaxi mode, Public Transportation, Private Car—obtained from intercept surveys conducted in the metropolitan area of Huánuco. From there, it can be identified that users travel medium distances using Mototaxis, with fares ranging between S/3.00 to S/4.00, primarily between Huánuco and Amarilis. In the Public Transportation mode, there is a higher preference, as trips are observed from Huánuco to Amarilis and Pillcomarca. This is due to fares fluctuating between S/1.00 and S/1.50. In each private car, very few users travel to the center of Huánuco in zone 2, where public and private establishments (banks, Judicial Power, hospitals) are located.
In the Collective Car mode, the majority of travels occur between districts, mainly from Huánuco to Amarilis and Pillcomarca, with a fare of S/2.00. In the Rural Public Transportation mode using a van (Combi), most trips are from Huánuco to Las Moras and Pillcomarca, with ticket costs ranging between S/1.00 and S/1.50. In the Microbus mode, trips are observed from Huánuco to Amarilis, covering that route until reaching Yanag.
4.2. Results of Vehicle Capacity and Visual Occupancy
4.2.1. Vehicle Capacity
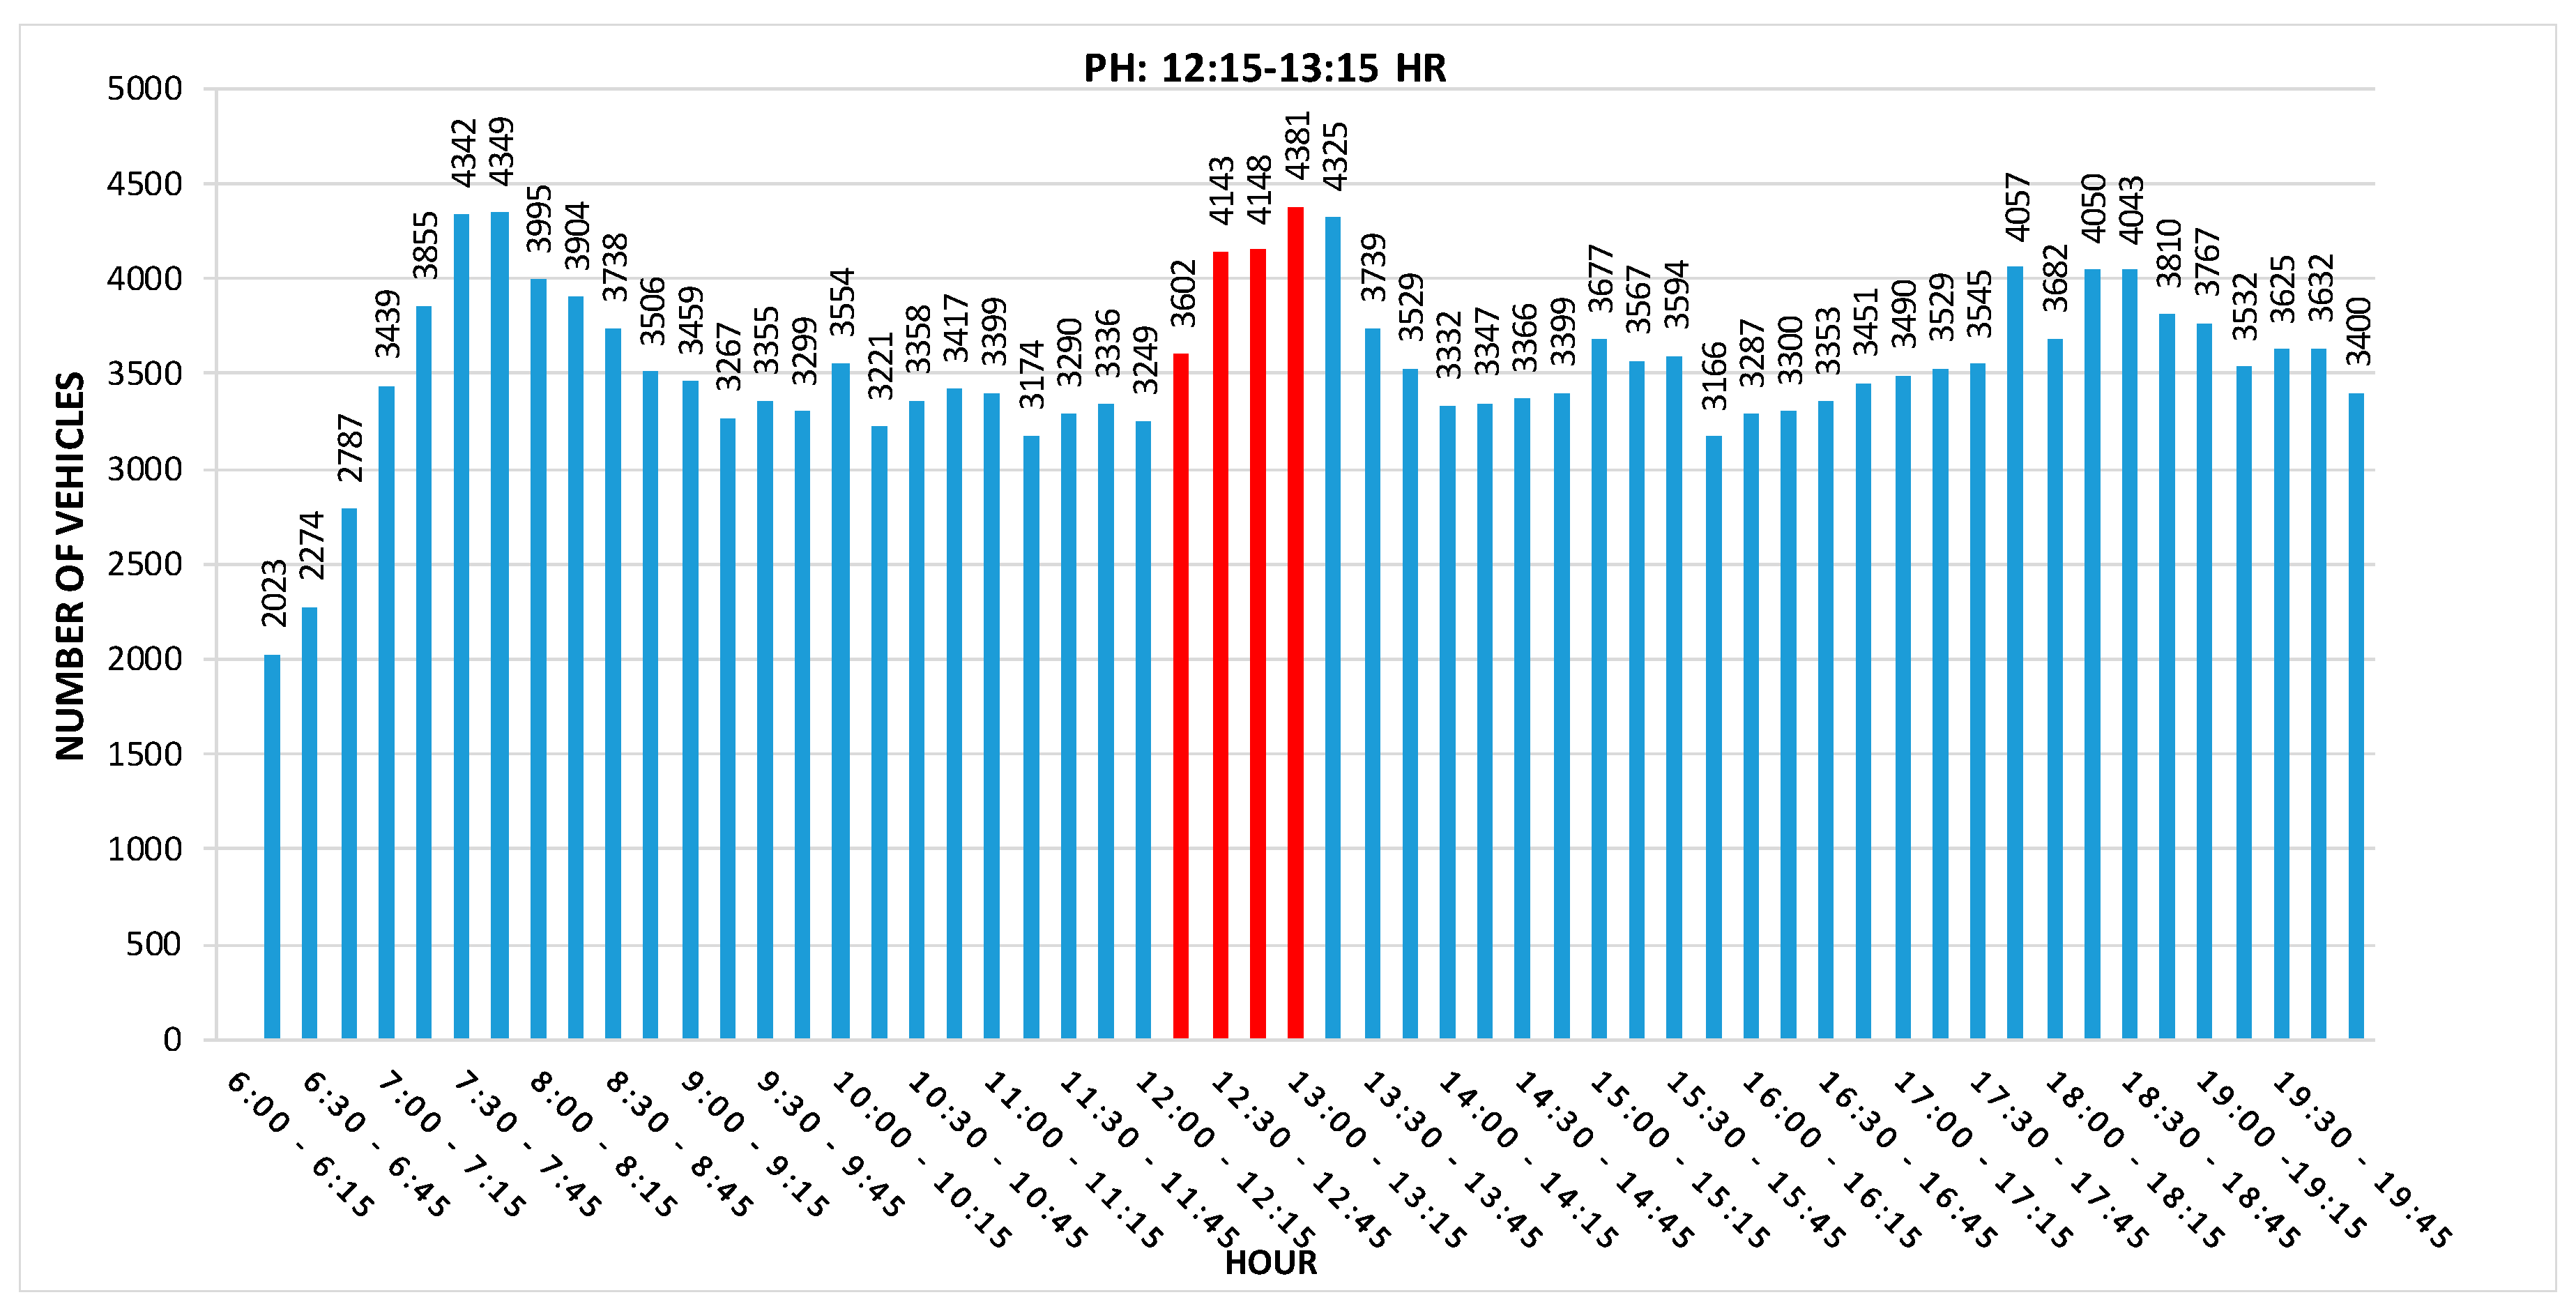
From the vehicular capacity analysis, it has been determined that the peak hour in the Huánuco district is from 12:15 to 13:15 with 16,997 mixed vehicles.
In
Figure 11, you can observe the fluctuation in vehicular flow in Huánuco, identifying that we have a peak hour at noon. This is due to Huánuco residents returning home for lunch. The peak hour is also noticeable in the time interval 12:15–1:15 p.m.
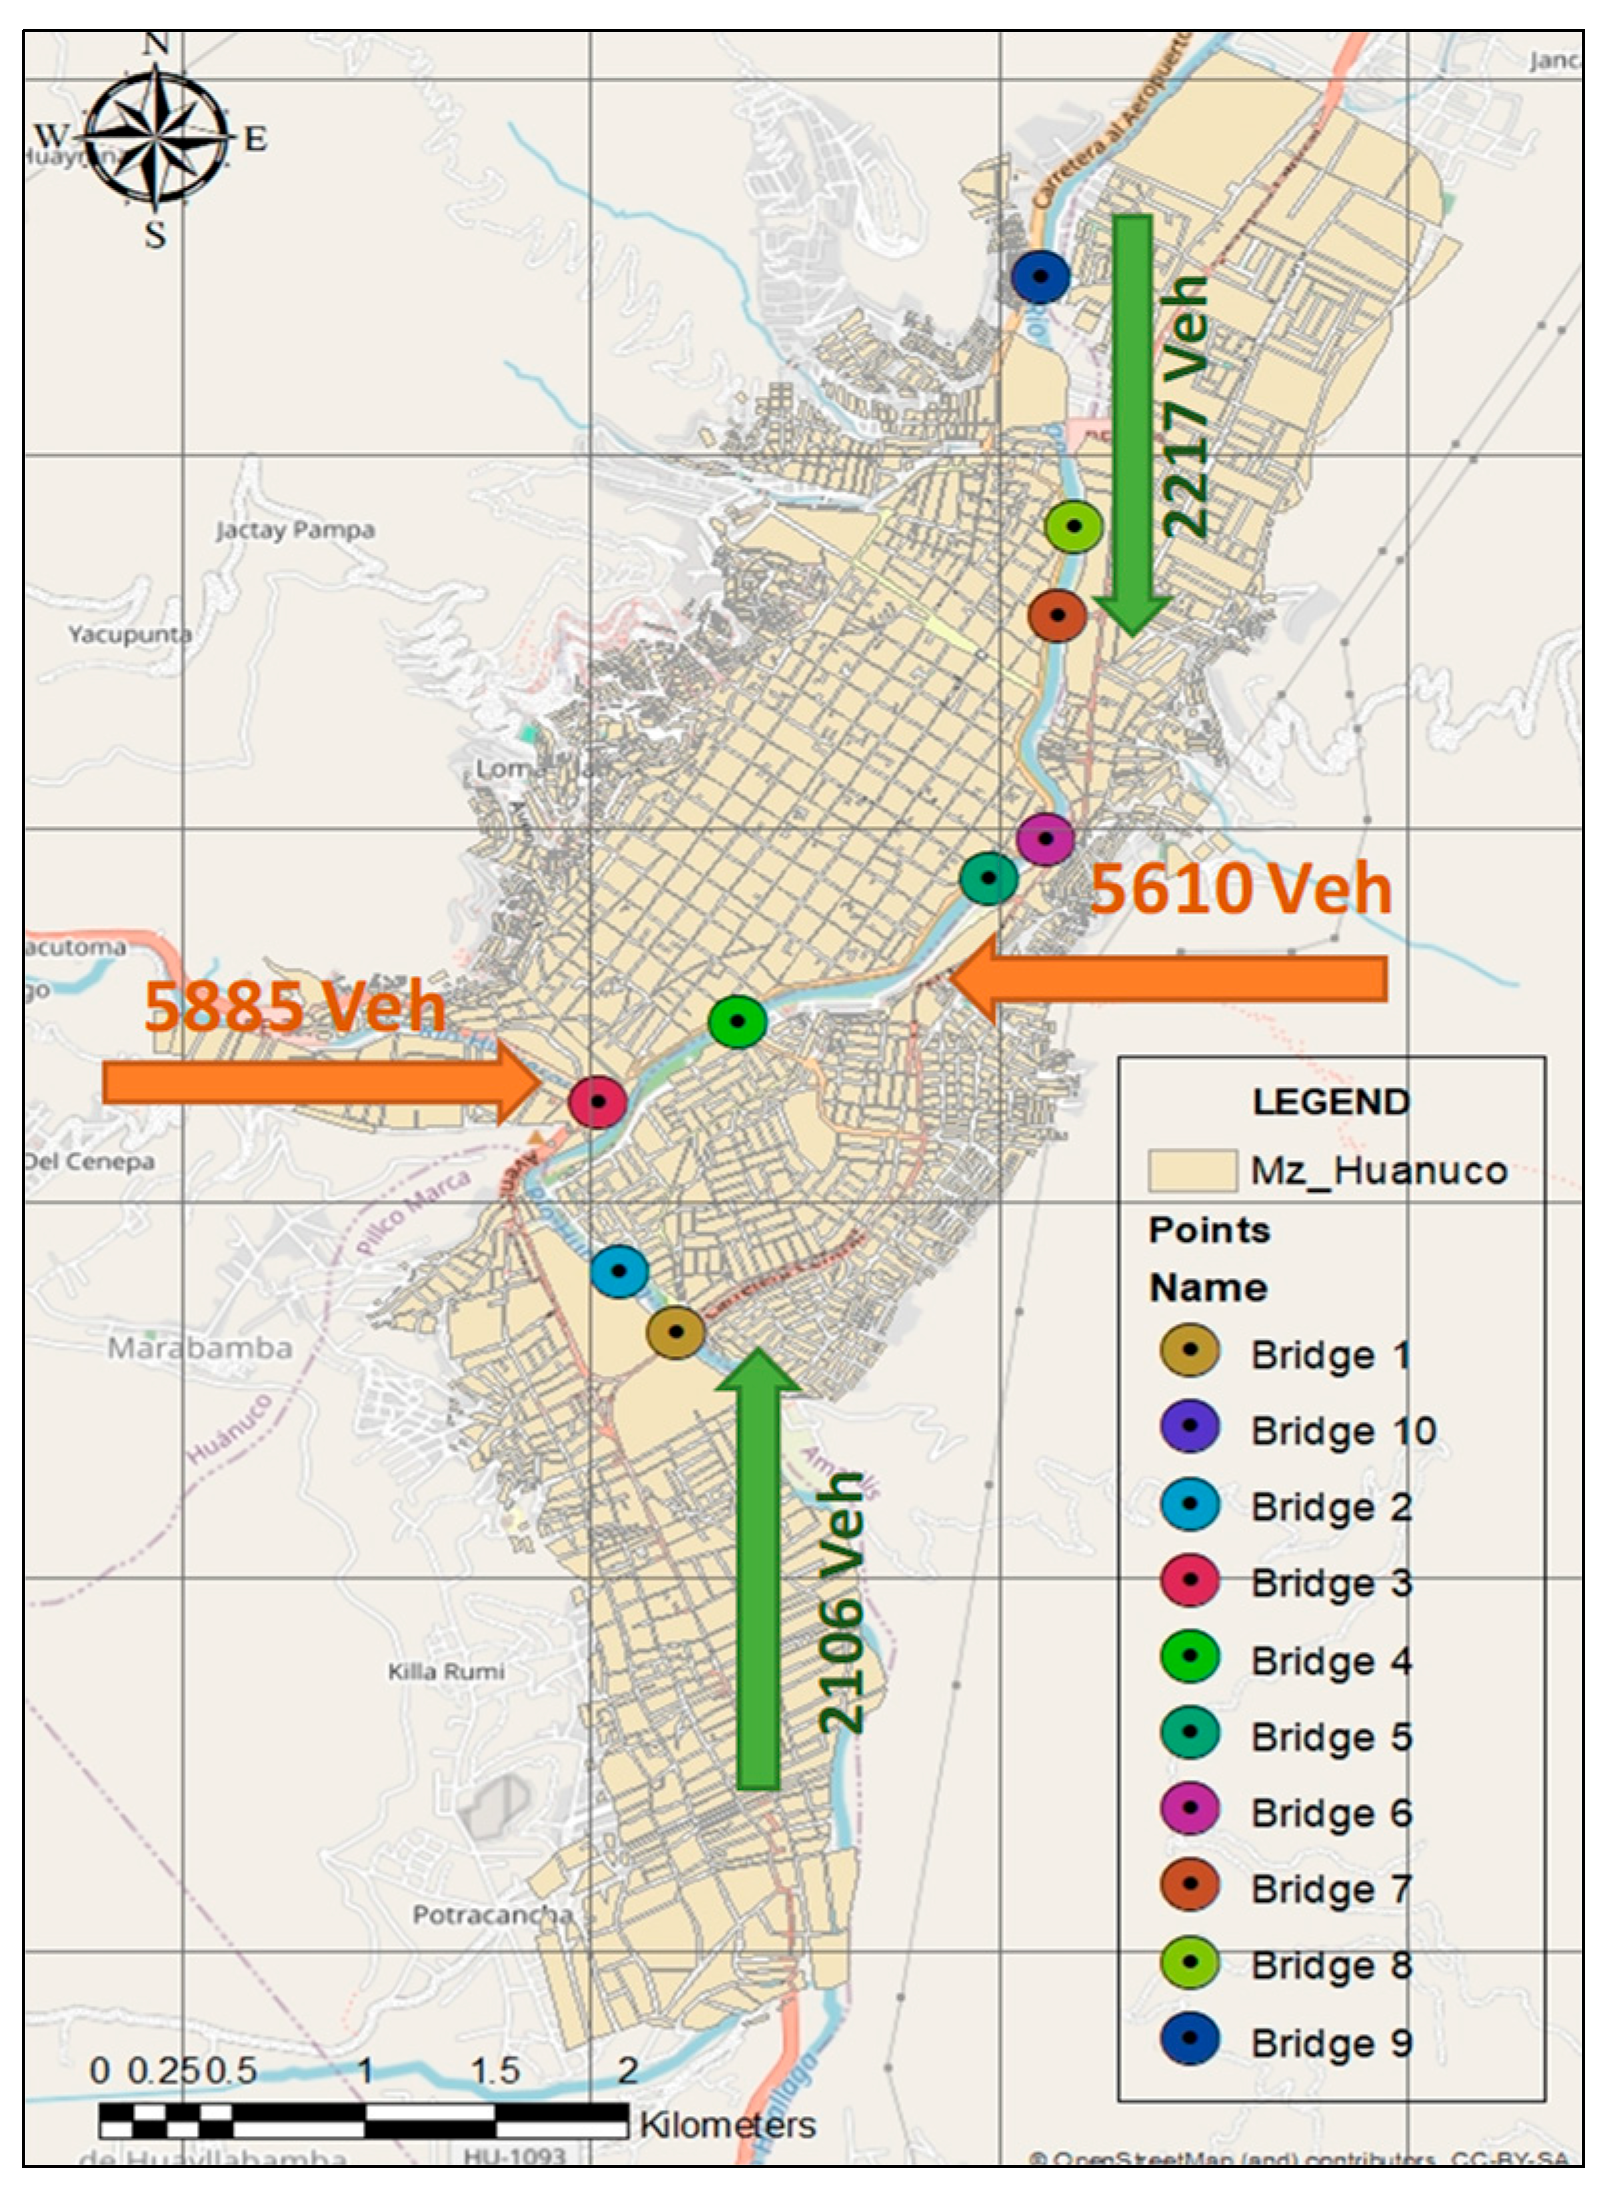
The number of vehicles passing per direction during rush hour in the Huánuco district can be observed in the following figure, indicating that the predominant movement in Huánuco is mostly in the West–East direction with 5885 mixed vehicles, and the East–West direction with 5610 vehicles as can be seen in the
Figure 12.
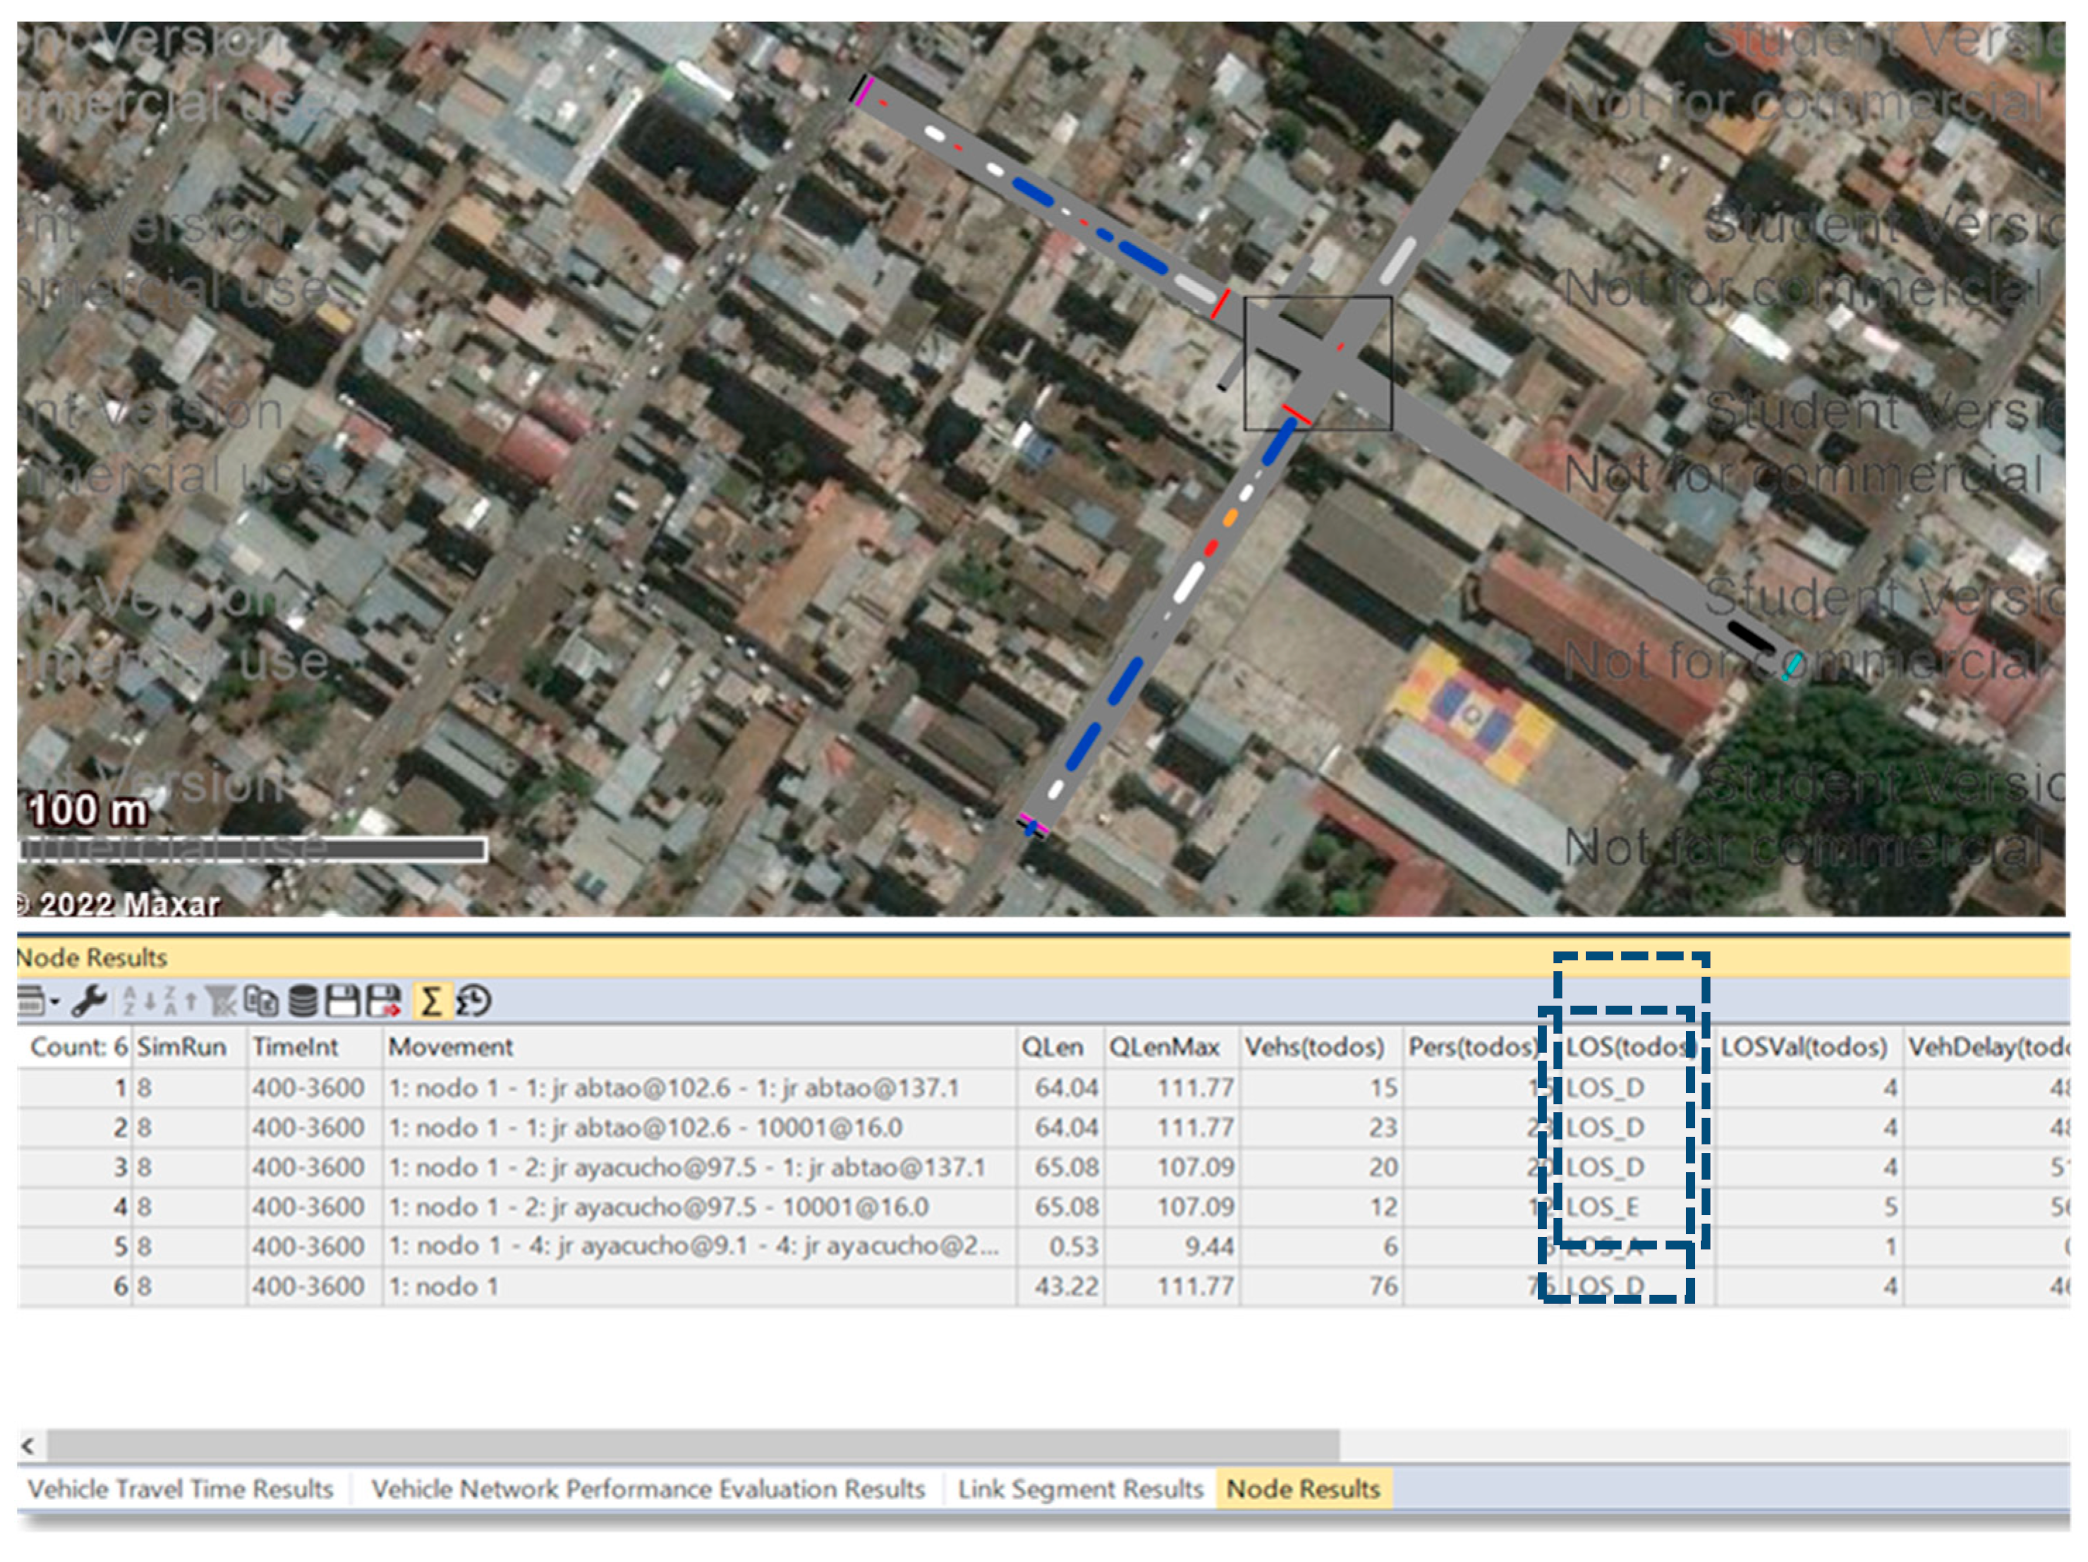
In order to identify the levels of congestion in places with the highest concentration of trips, a modeling of the current state of the operation of the roads was carried out, which is shown below.
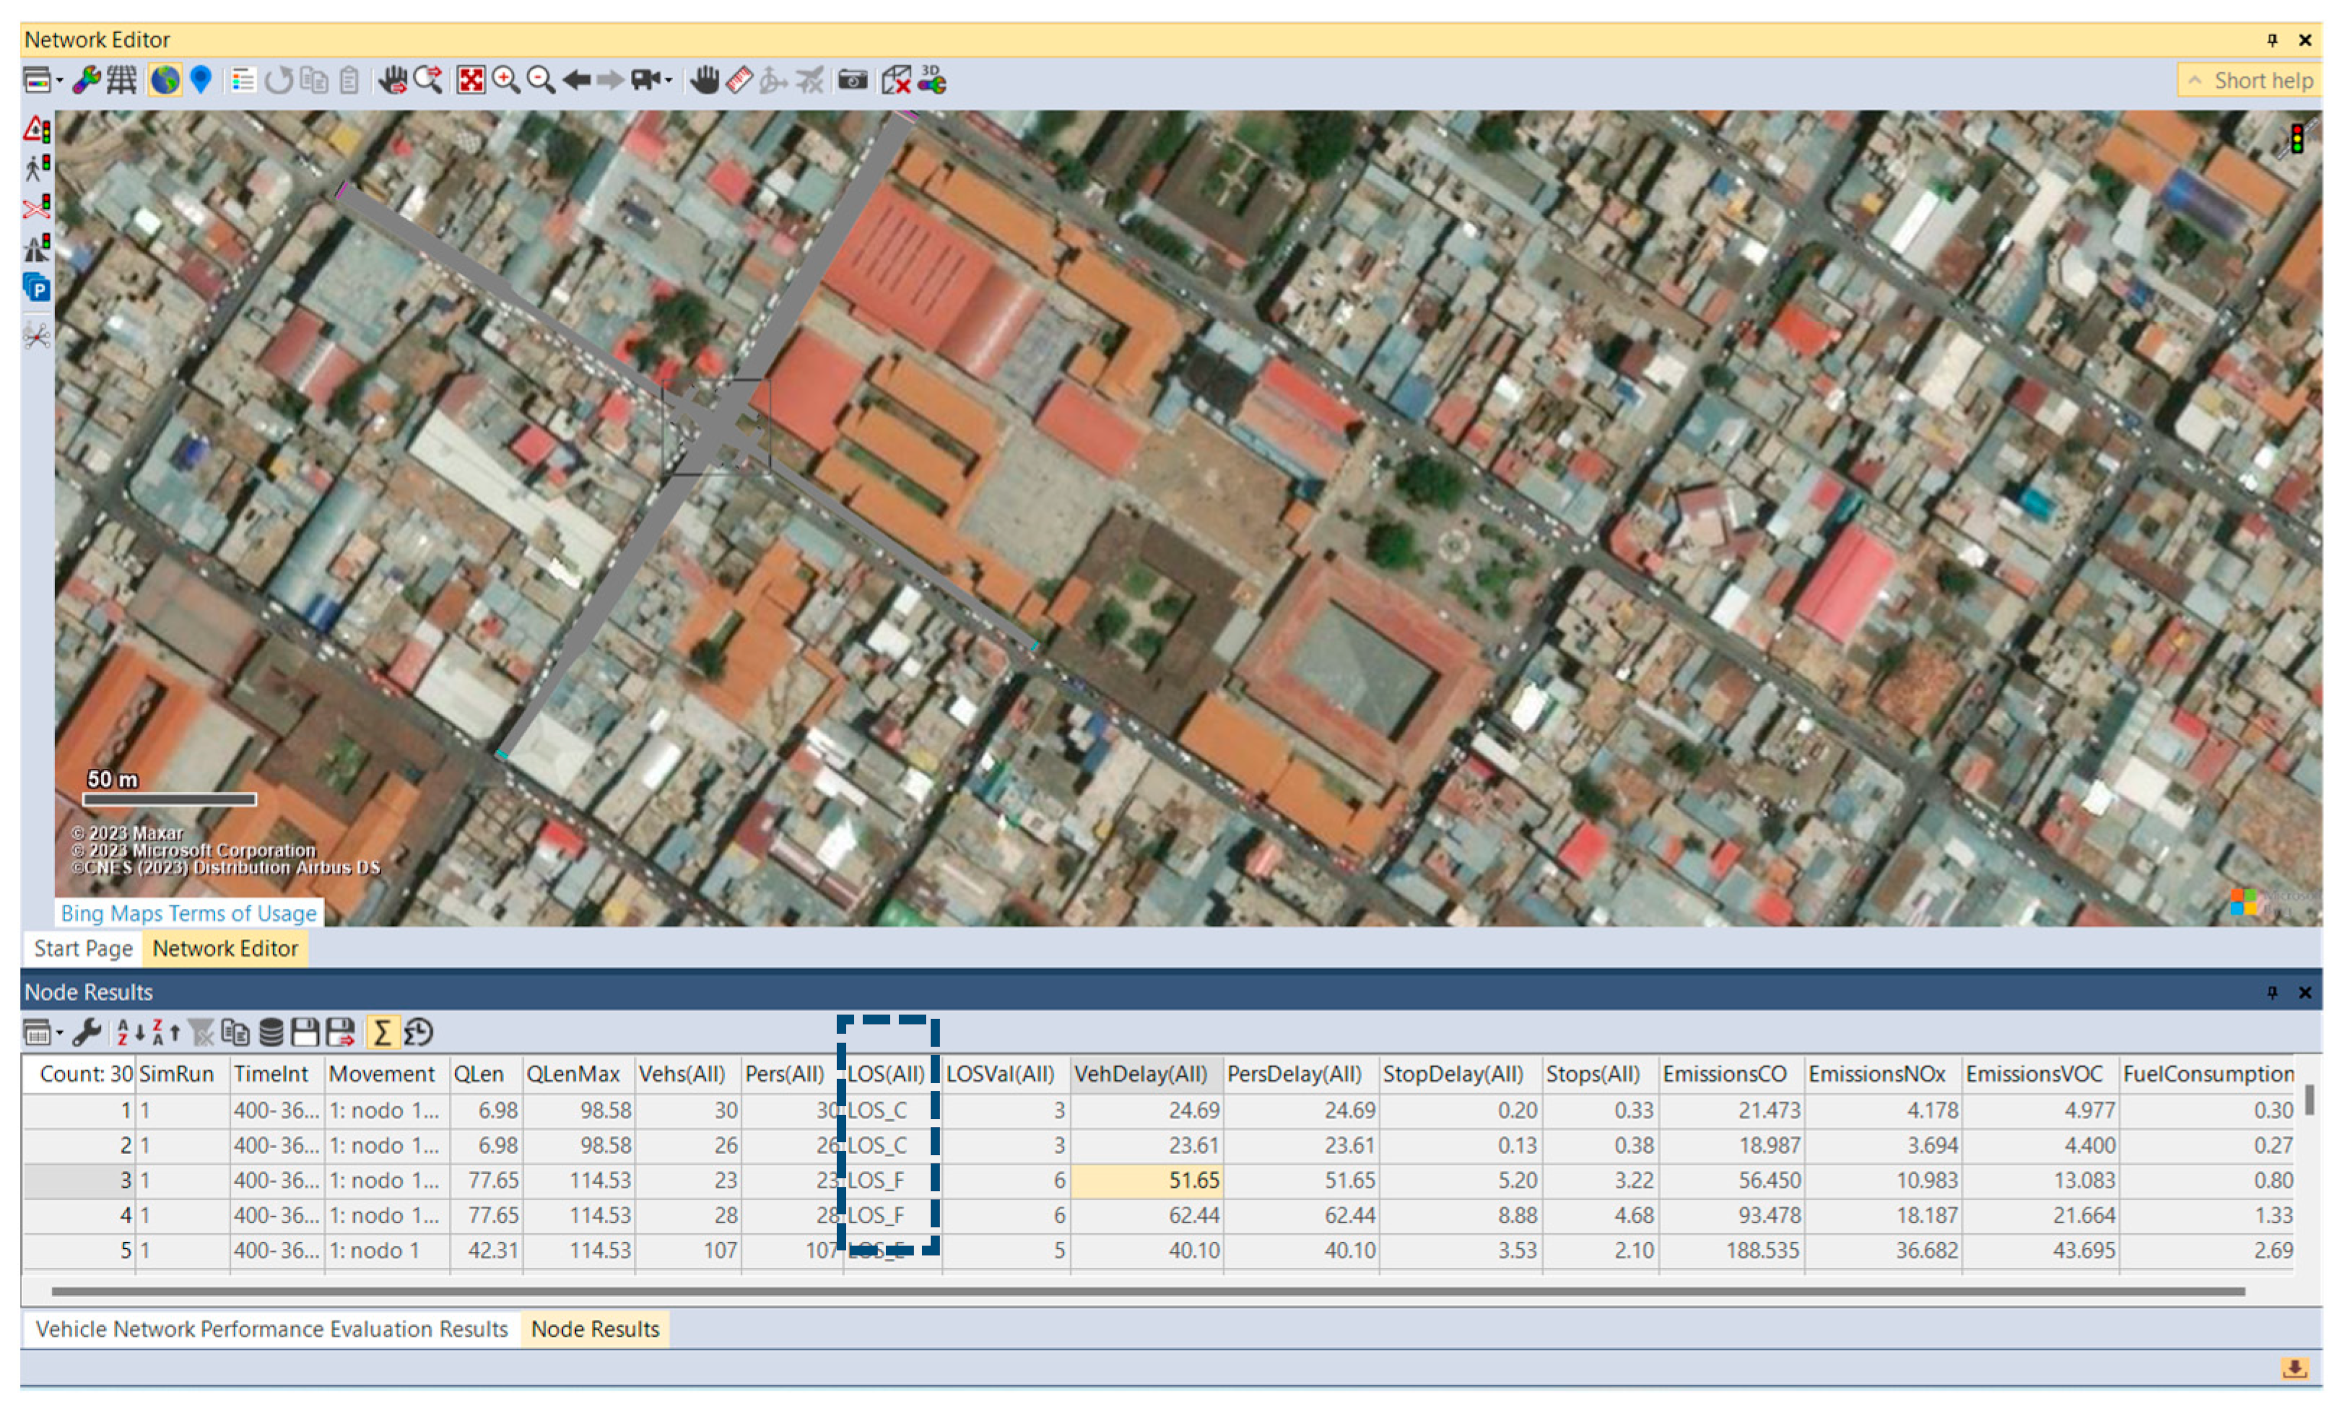
The modeling results, as visualized in
Figure 13, indicate that the intersection has a service road E at rush hour, which describes a saturated intersection, generating lost travel times, as well as environmental pollution [
19]. This intersection is located around the Huánuco Model Market.
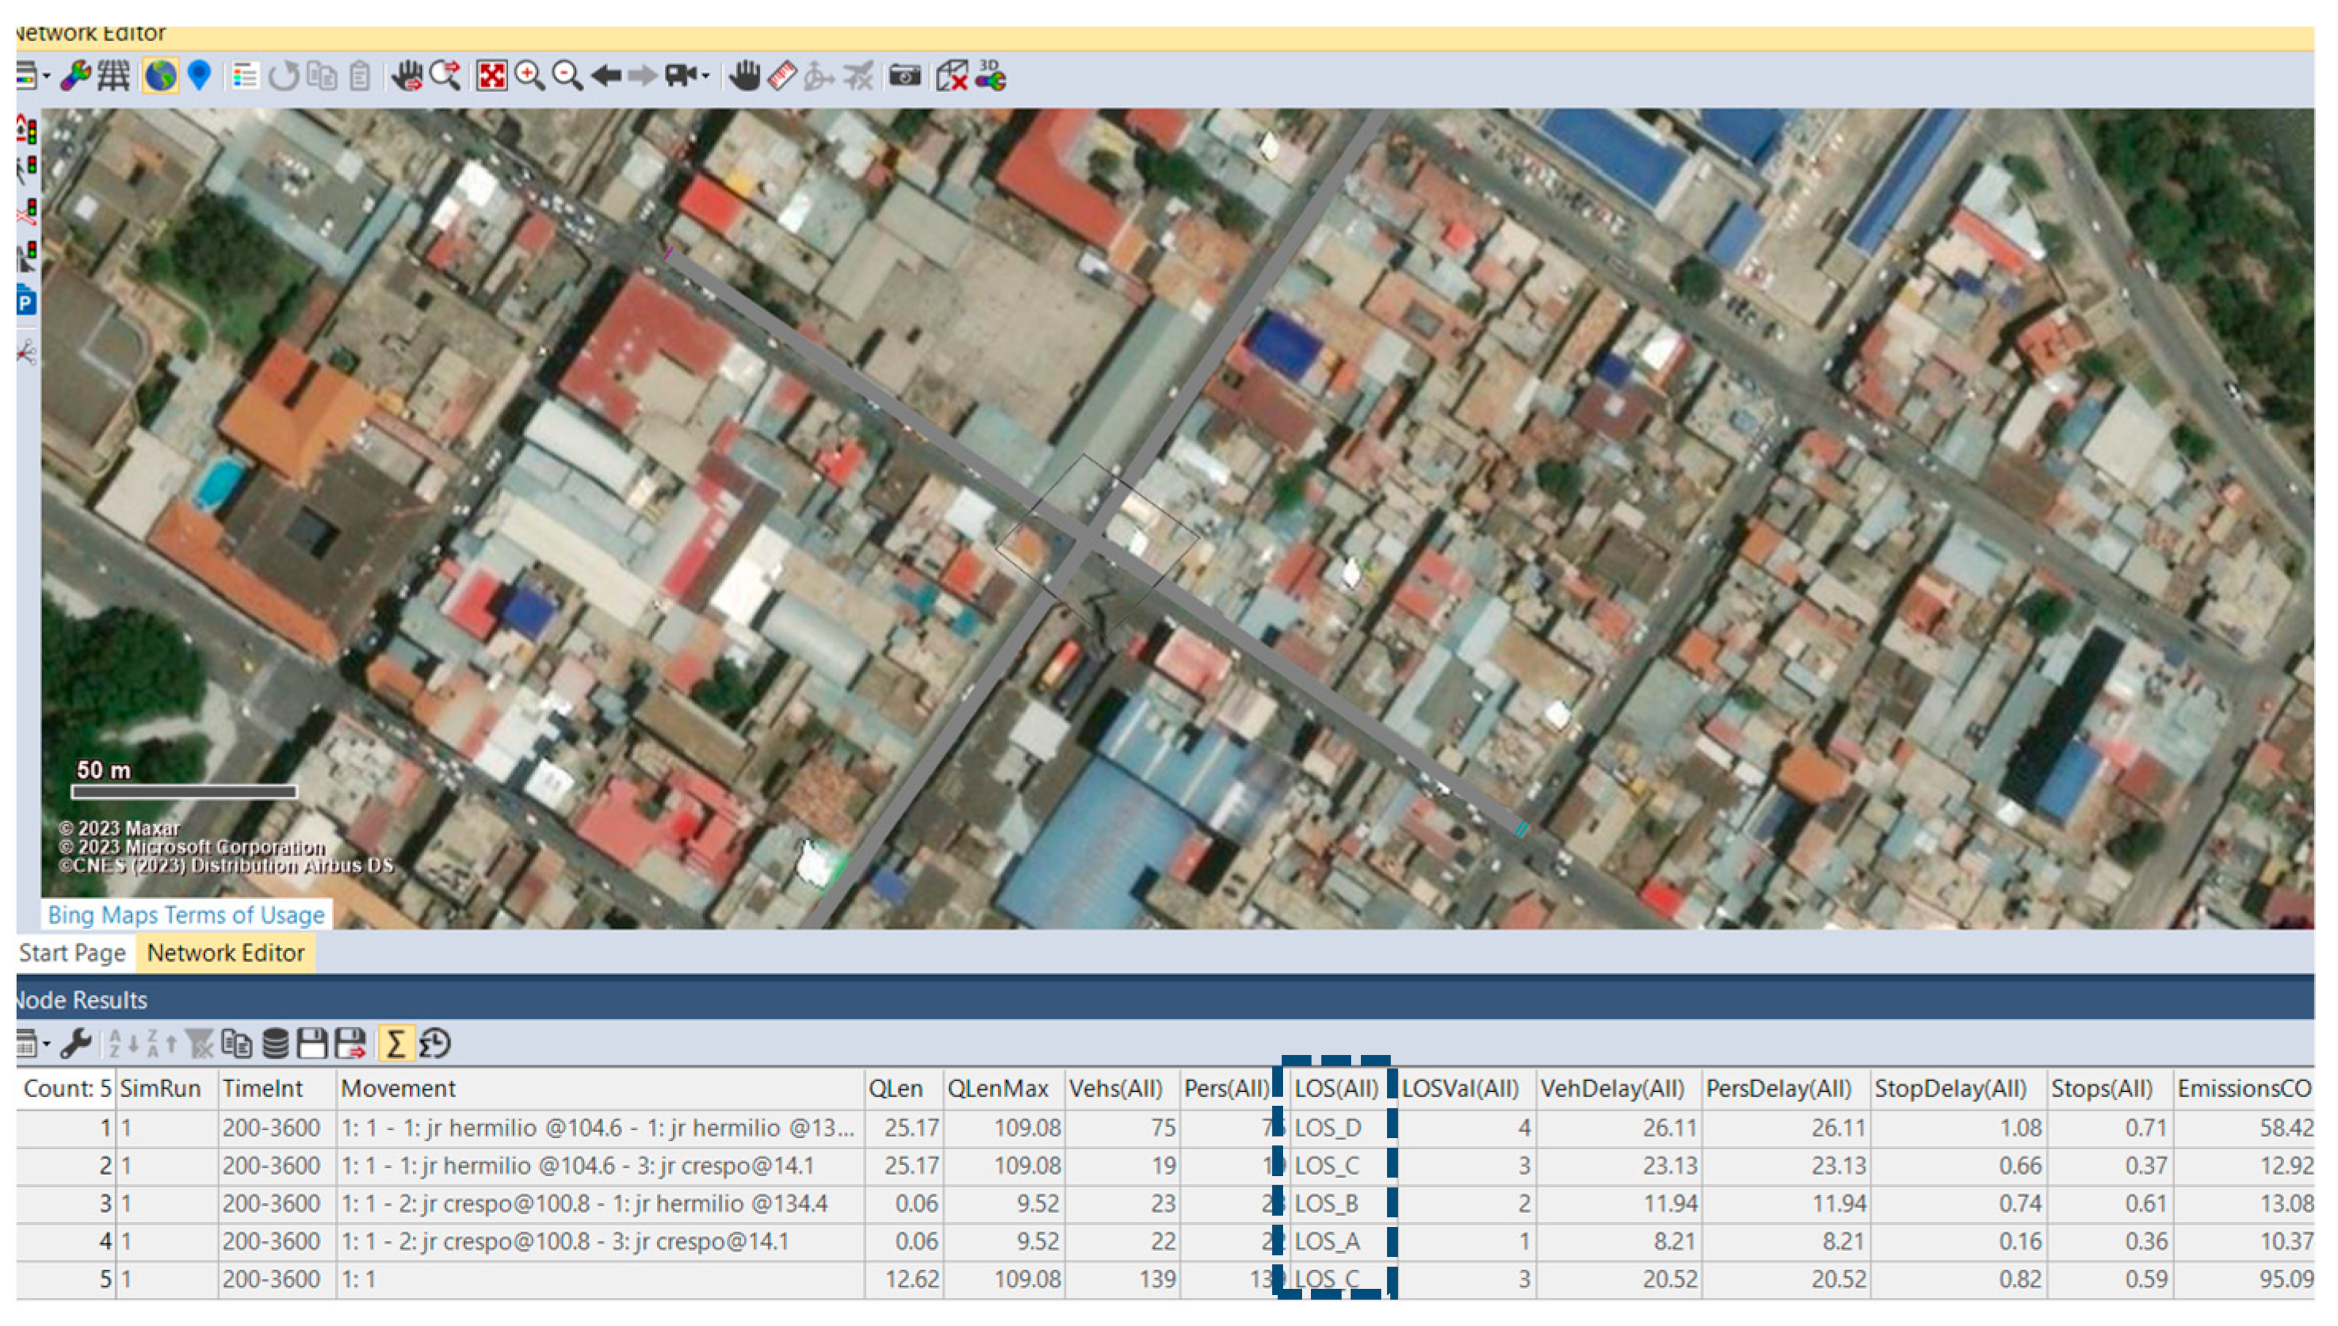
The modeling results, as visualized in
Figure 14, show that the intersection has a service level D at rush hour, which describes a saturated intersection, generating lost travel times, as well as environmental pollution. As contrasted by what was said by Pacheco Chavez et al. [
19], this intersection is located around the Mercado Modelo and the main shopping centers of the city of Huánuco.
The modeling results, as visualized in
Figure 15, show that the intersection has a service level D at rush hour, which describes a saturated intersection, generating lost travel times, as well as environmental pollution [
19]. This intersection is parallel to the main square; however, it does not have as much traffic of vehicles and pedestrians as in the Market, which contrasts with the result.
It is displayed that in the two intersections located in transit zone 2, where the Market is located and adjacent to the main square, there is a level of service E and D that demonstrates that the roads have exceeded their capacity. In the Jiron Crespo Castillo with Valdizán, which is a block that is located 1 block from the main square but not in the center of the shops and financial institutions such as commercial ones, the level of service is C in the node that indicates that it is reaching the capacity limit on this road.
4.2.2. Visual Occupation
From the visual occupancy capacity results during rush hour, the following data were obtained.
During peak hours, the passengers traveling with the existing vehicles in the Huánuco district are shown in the following figure, with the highest incidence being 26,468 passengers in the West–East direction and 20,532 passengers in the East–West direction, as visualized in
Figure 16.
Table 2 displays the number of passengers transported by mode of transportation during peak hours. It indicates that the vehicle type transporting the highest number of passengers is the minibus with 18,826 passengers, followed by the mototaxi with 15,683 passengers, collective car with 9577 passengers, and linear motorcycle with 5914 passengers.
Analyzing the desired lines of travel according to different modes and reasons, as well as the results of vehicular capacity and visual occupation, we can identify that the population of Huánuco predominantly moves towards the city center located in transit areas 1, 2, 3, and 5, focusing on these areas of commerce, public entities, and private establishments of the city. Similarly, in the Pillcomarca district, there is mobility towards the National Hermilio Valdizan University located in zone 32. In the Amaryllis district, mobility concentrates in zones 18 and 19, where insurance and the market are situated. Considering the existing road infrastructure, available space, and the street layout in Huánuco, the following proposal is generated.
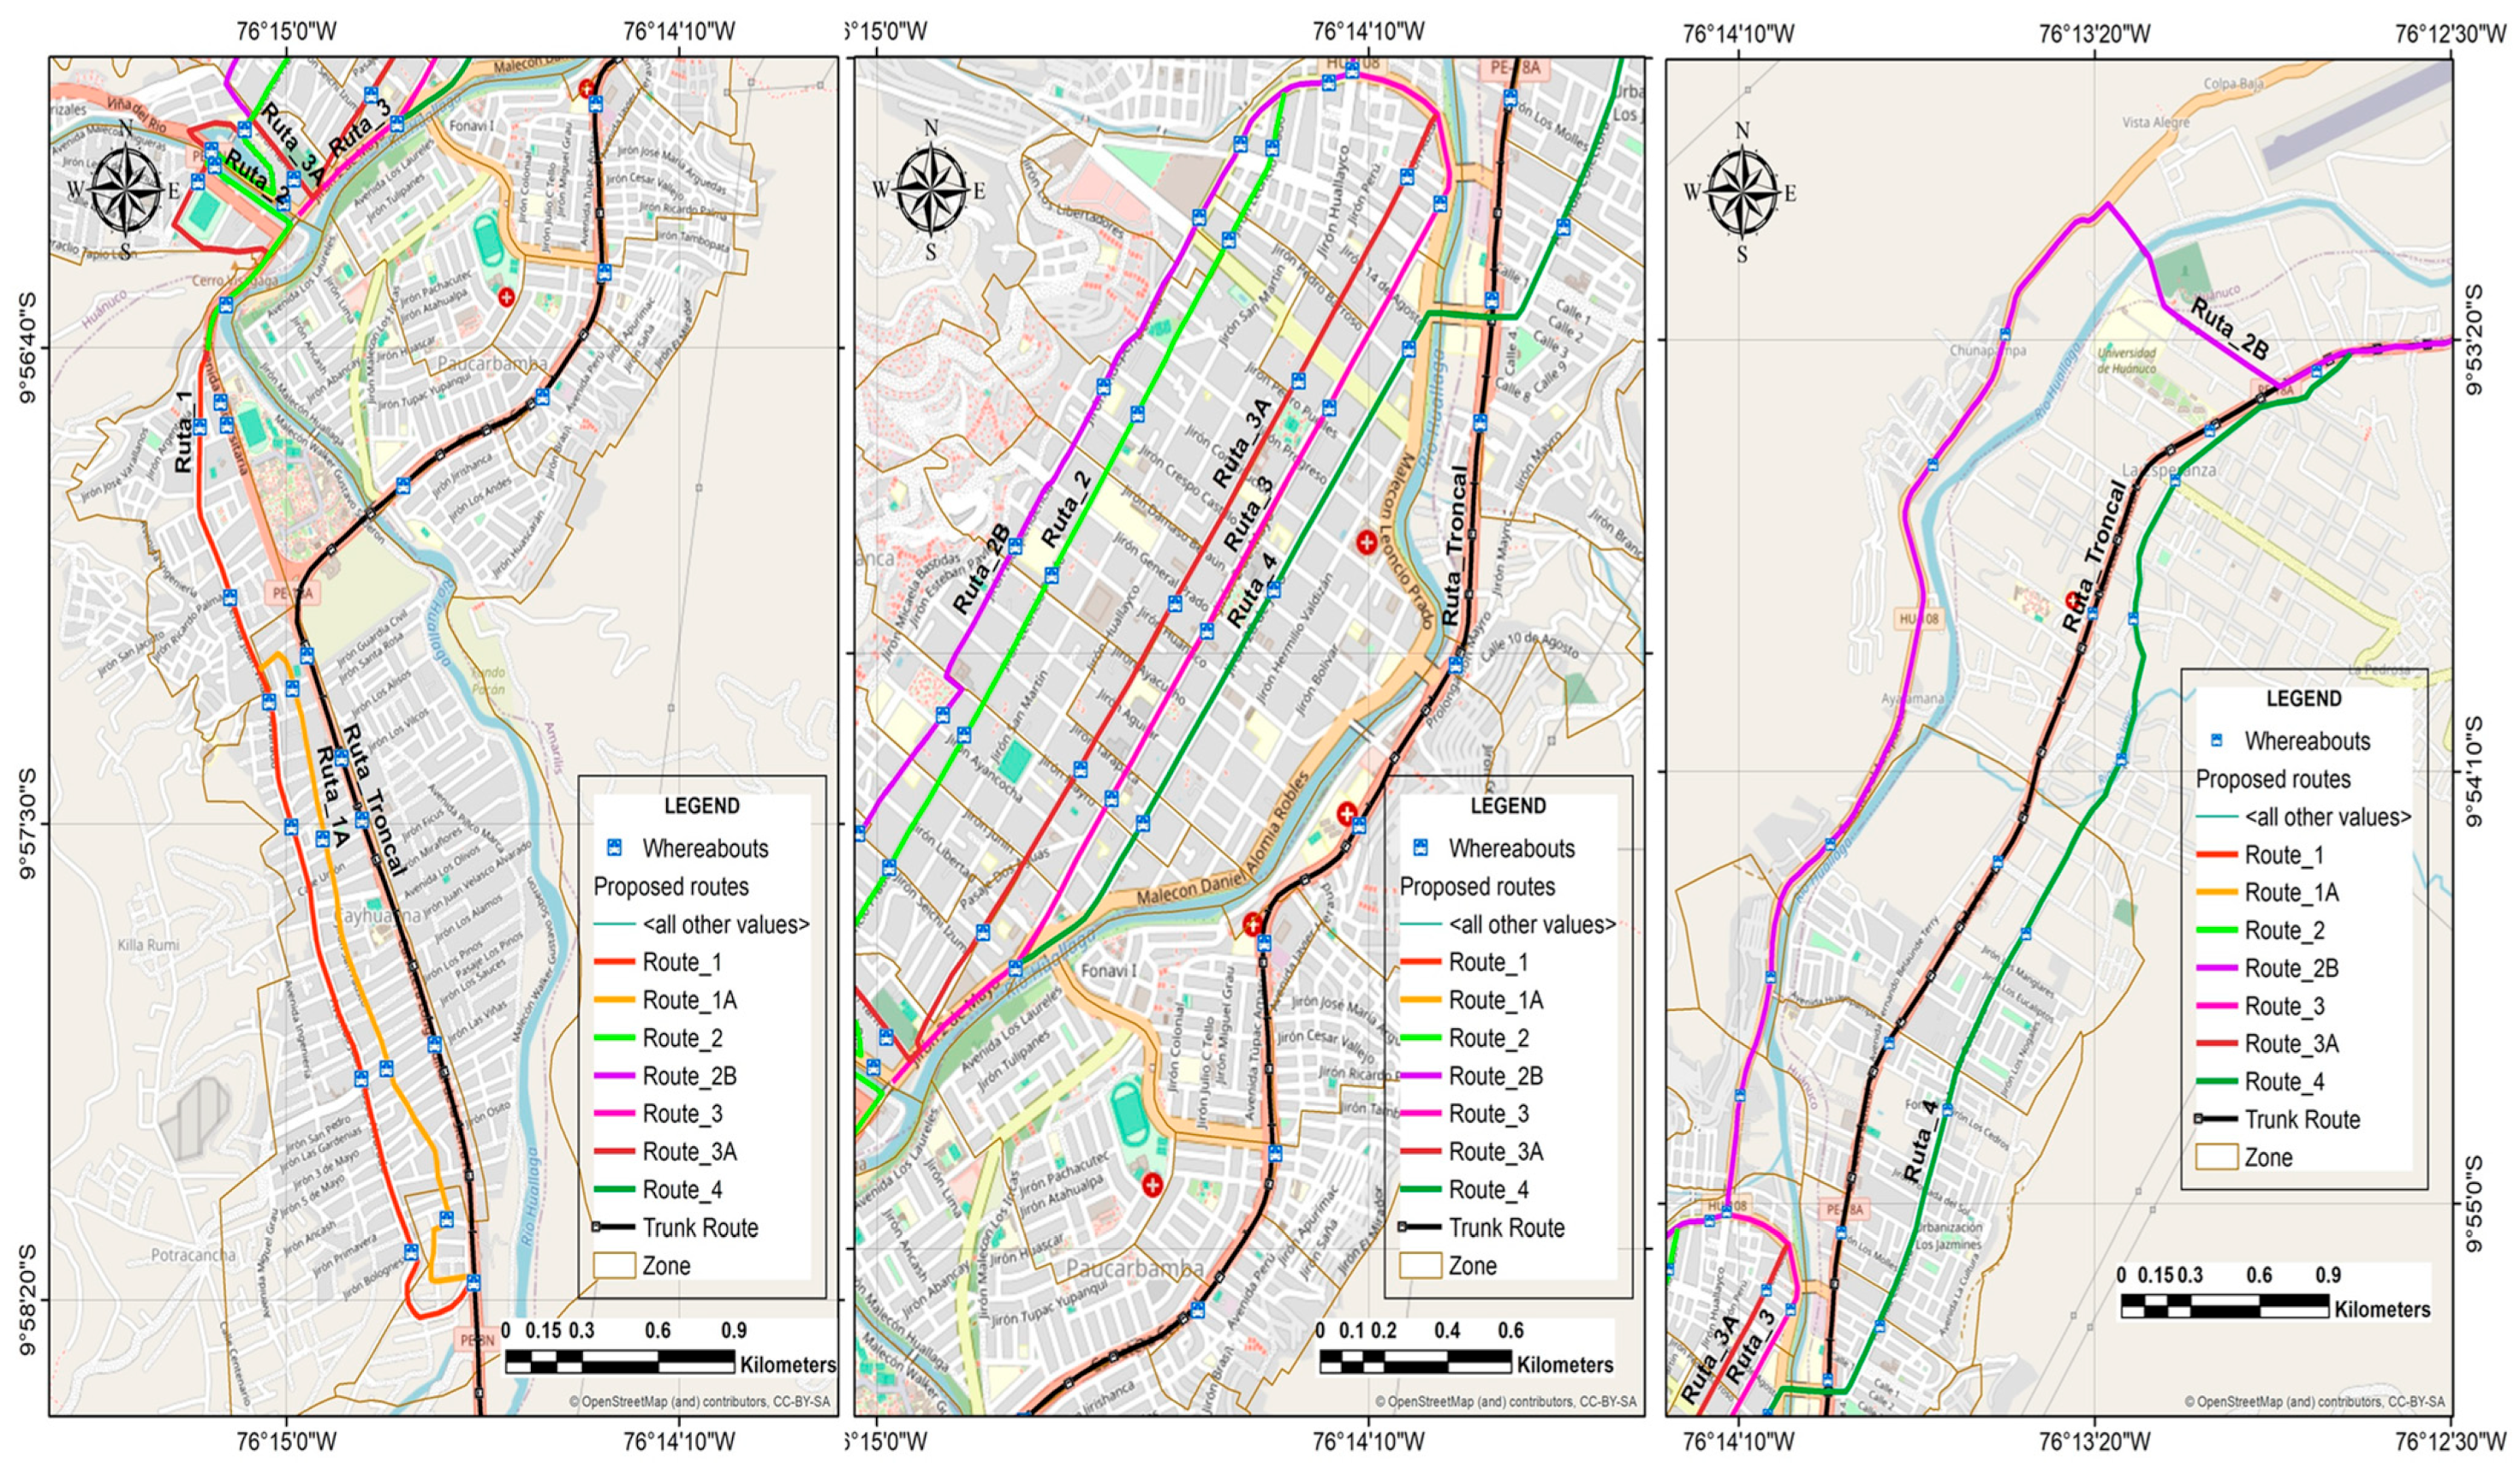
We propose eight routes, comprising seven feeder routes, and one trunk route, each with specific passenger demand per route determined based on passenger demand derived from travel preferences and surveys of vehicular capacity, as depicted in
Figure 17.
4.3. Proposal
Mass transit systems like those in Paris, London, and Seoul offer examples of efficient and reliable public transportation as models for Australian cities. The reality is that while public transport in the established inner areas of Sydney and Melbourne has seen some success in planning, the outer urban settlements of both cities continue to grow and require effective planning and implementation of public transportation [
32,
33,
34,
35].
Distances impact people’s accessibility to public transportation. People take longer to reach their destination, so it is necessary to expand public transport routes to these areas to increase accessibility and reduce the use of private vehicles. Proposing the implementation of the proposed BRT system and public transportation infrastructure [
5].
The service levels on the roads, identified in the modeling of the intersections, indicate that in the historic center, where businesses, public institutions, and the Market are concentrated, have exceeded the capacity of the road, which is why it is necessary to generate solutions to the problems that contribute to reaching that level of service so that transport users have access to public transport with adequate service conditions.
According to results obtained from interception surveys, as well as vehicle capacity, it is identified that the population moves in the longitudinal North–South direction with an average length of 12.5 km in the urban area, as well as the form of urban expansion. It is adapted longitudinally, for which longitudinal routes are proposed that run through the three districts that make up the urban area (Huánuco, Amarilis, and Pillcomarca), the location of loading and unloading of passengers is also taken into account, and the lines of desire are also identified. Of total trips in
Figure 7, the concentration of trips occurs in its greatest proportion in zone 2 where the main square is located, there are commercial areas, the location of public and private institutions such as banks, the municipality, commercial stores, boutiques, among others, for which routes are proposed to be distributed in the three districts of the urban area, identifying in turn the generations of existing trips.
The present research proposes seven feeder routes and one trunk route for the implementation and operation of the routes, as visualized in
Figure 17. For the feeder routes, the exclusive use of lanes for rapid mass transit buses is recommended, aiming to reduce travel times for system users while offering a high-quality transportation system with appropriate infrastructure and a fleet of modern buses.
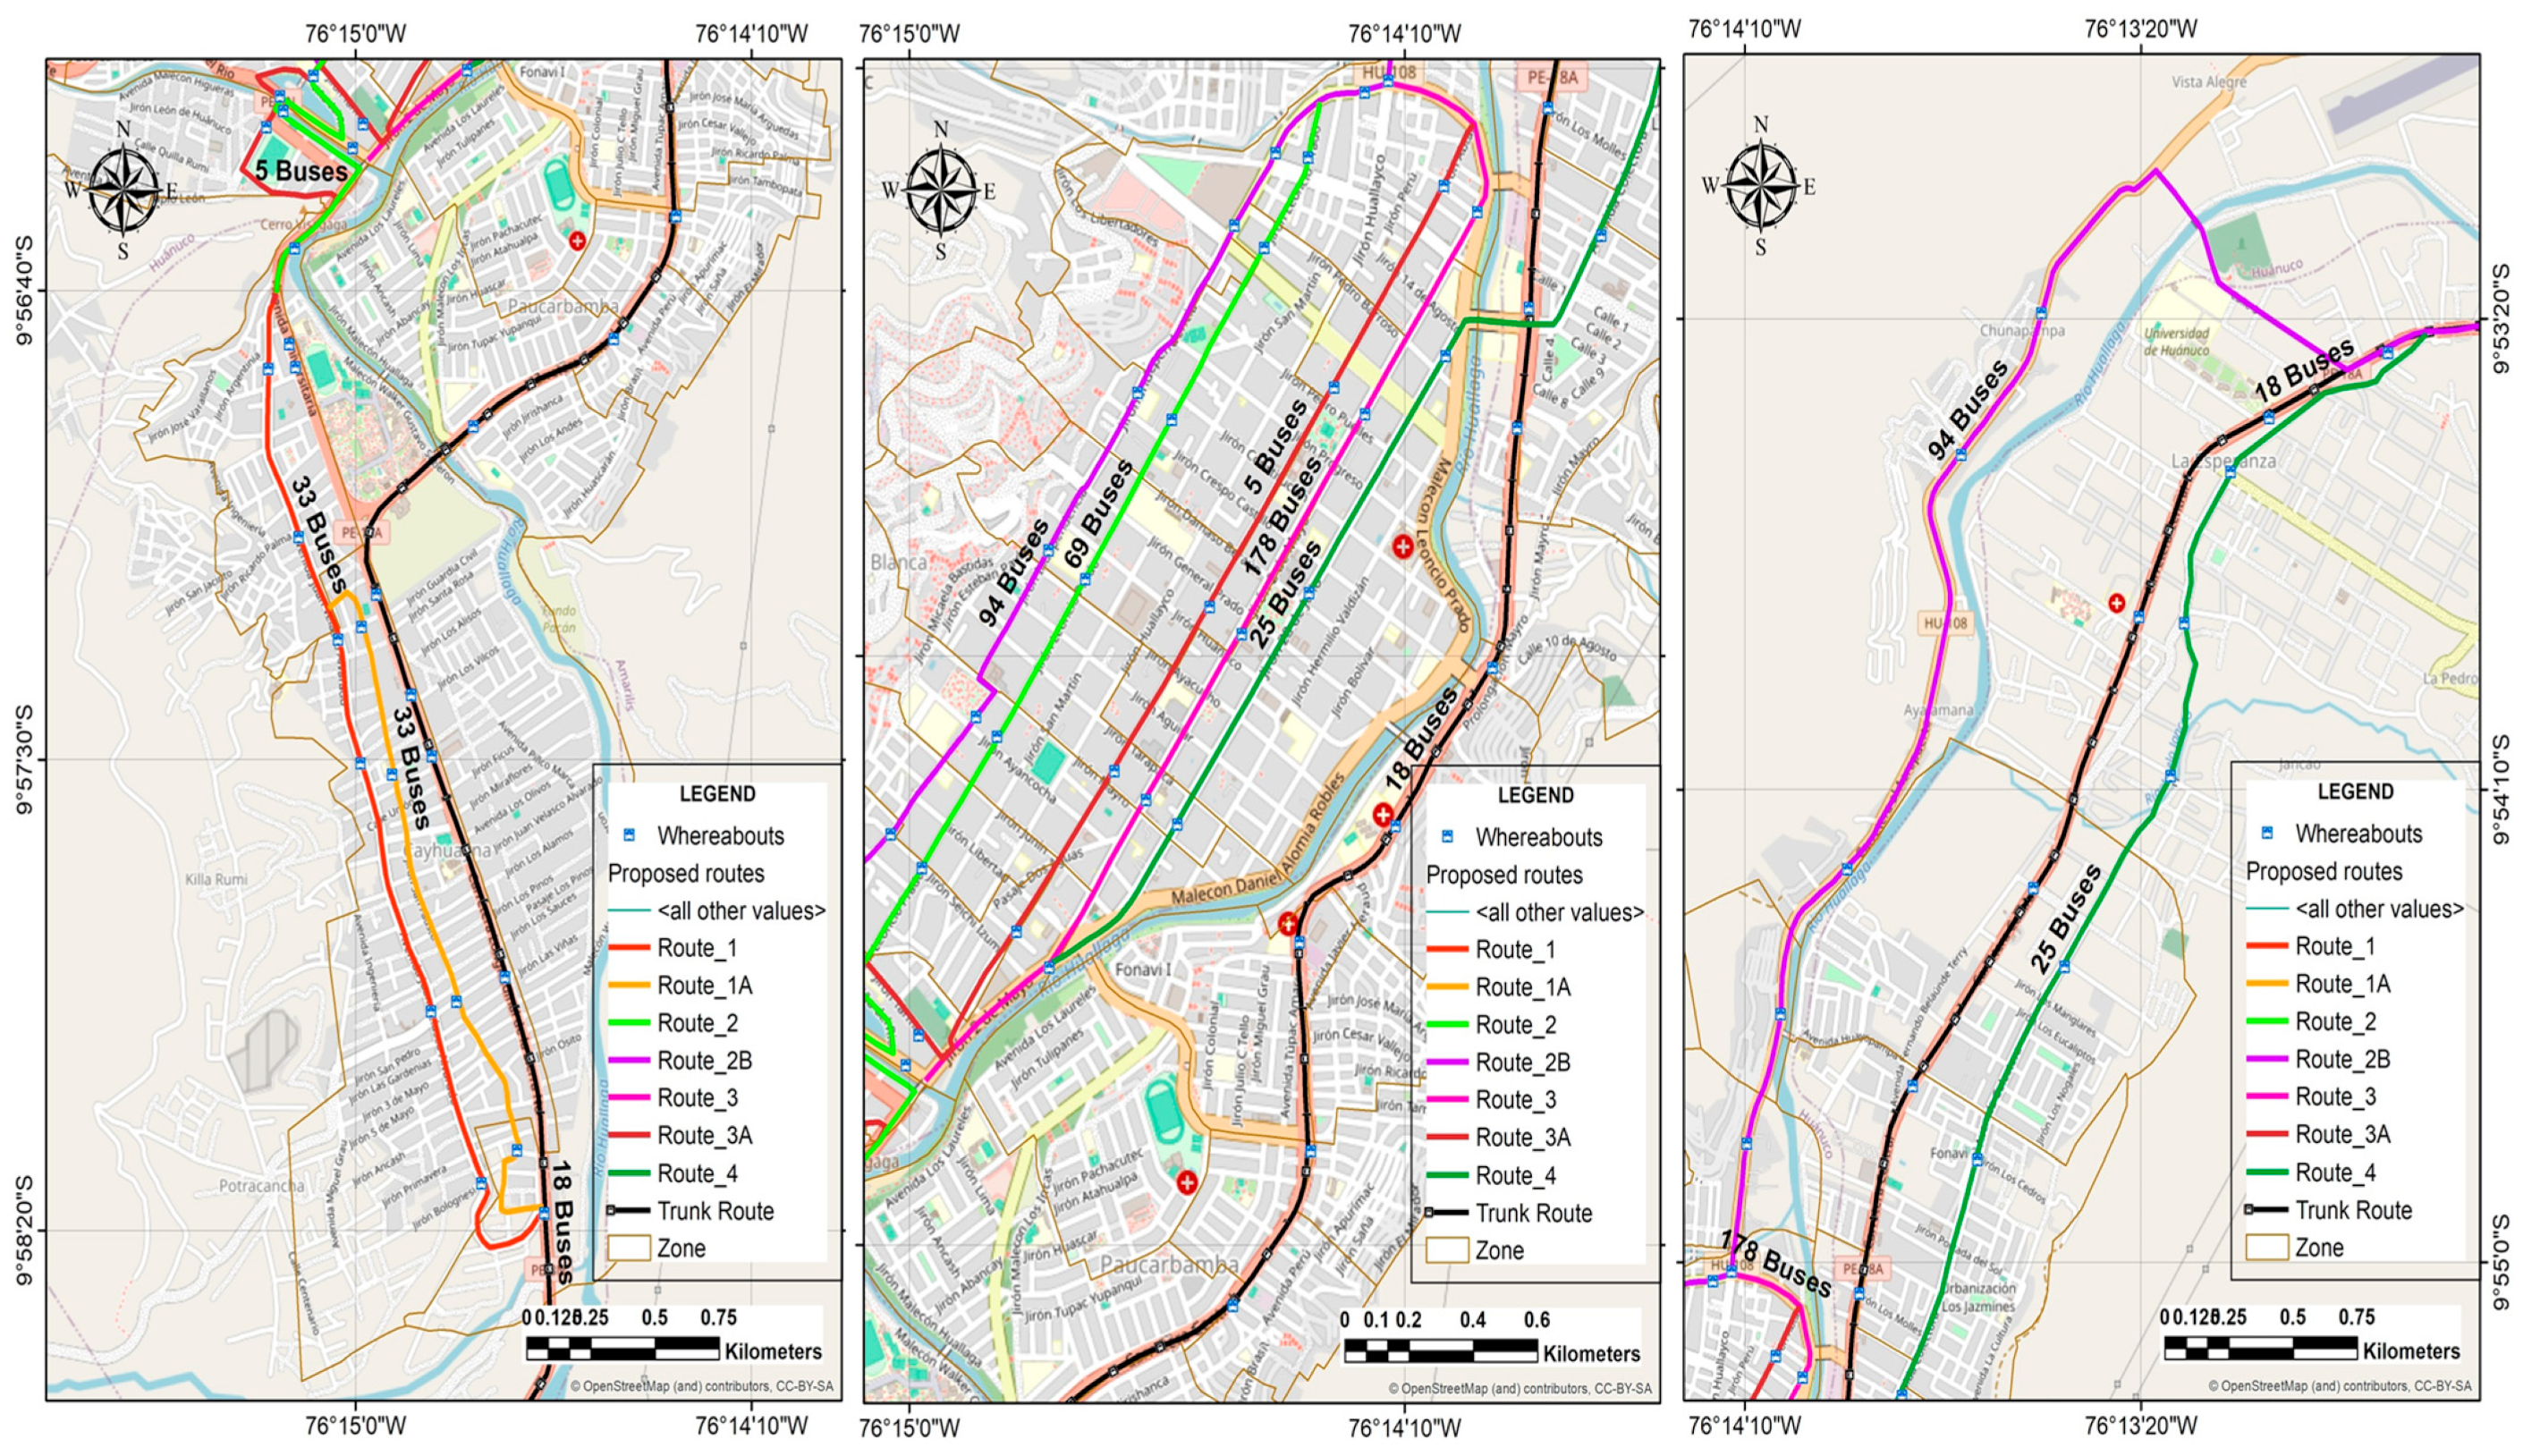
Table 3 indicates the number of buses required and the frequencies for the routes in the West–East direction, which has been calculated according to the existing travel demand for a 20-year projection. In addition, retention buses are included for mechanical contingencies of the vehicles.
In the West–East direction, 394 buses are required to meet the existing transportation demand.
Table 4 indicates the number of buses required and the frequencies for routes in the East–West direction, which has been calculated according to the existing travel demand for a 20-year projection. In addition, retention buses are included for mechanical contingencies of the vehicles:
In the East–West direction, 422 buses are required to meet the existing transportation demand, the following supporting information can be downloaded at:
Tables S3–S9.
Figure 18, shows the number of buses required for the operation of the proposed routes.
The required buses have been identified as follows:
Trunk and Feeder Route: Buses with a capacity of 80 passengers.
Bus characteristics:
Length: 12 m.
Capacity: 80 passengers.
Speed: 20 km/h.
With the implementation of the routes, it is also recommended that motorcycle taxis and collective cars can serve as feeders to the proposed transportation system, in areas where they do not cross the proposed routes, thus achieving the ordering of the transportation system.
4.4. Road Infrastructure
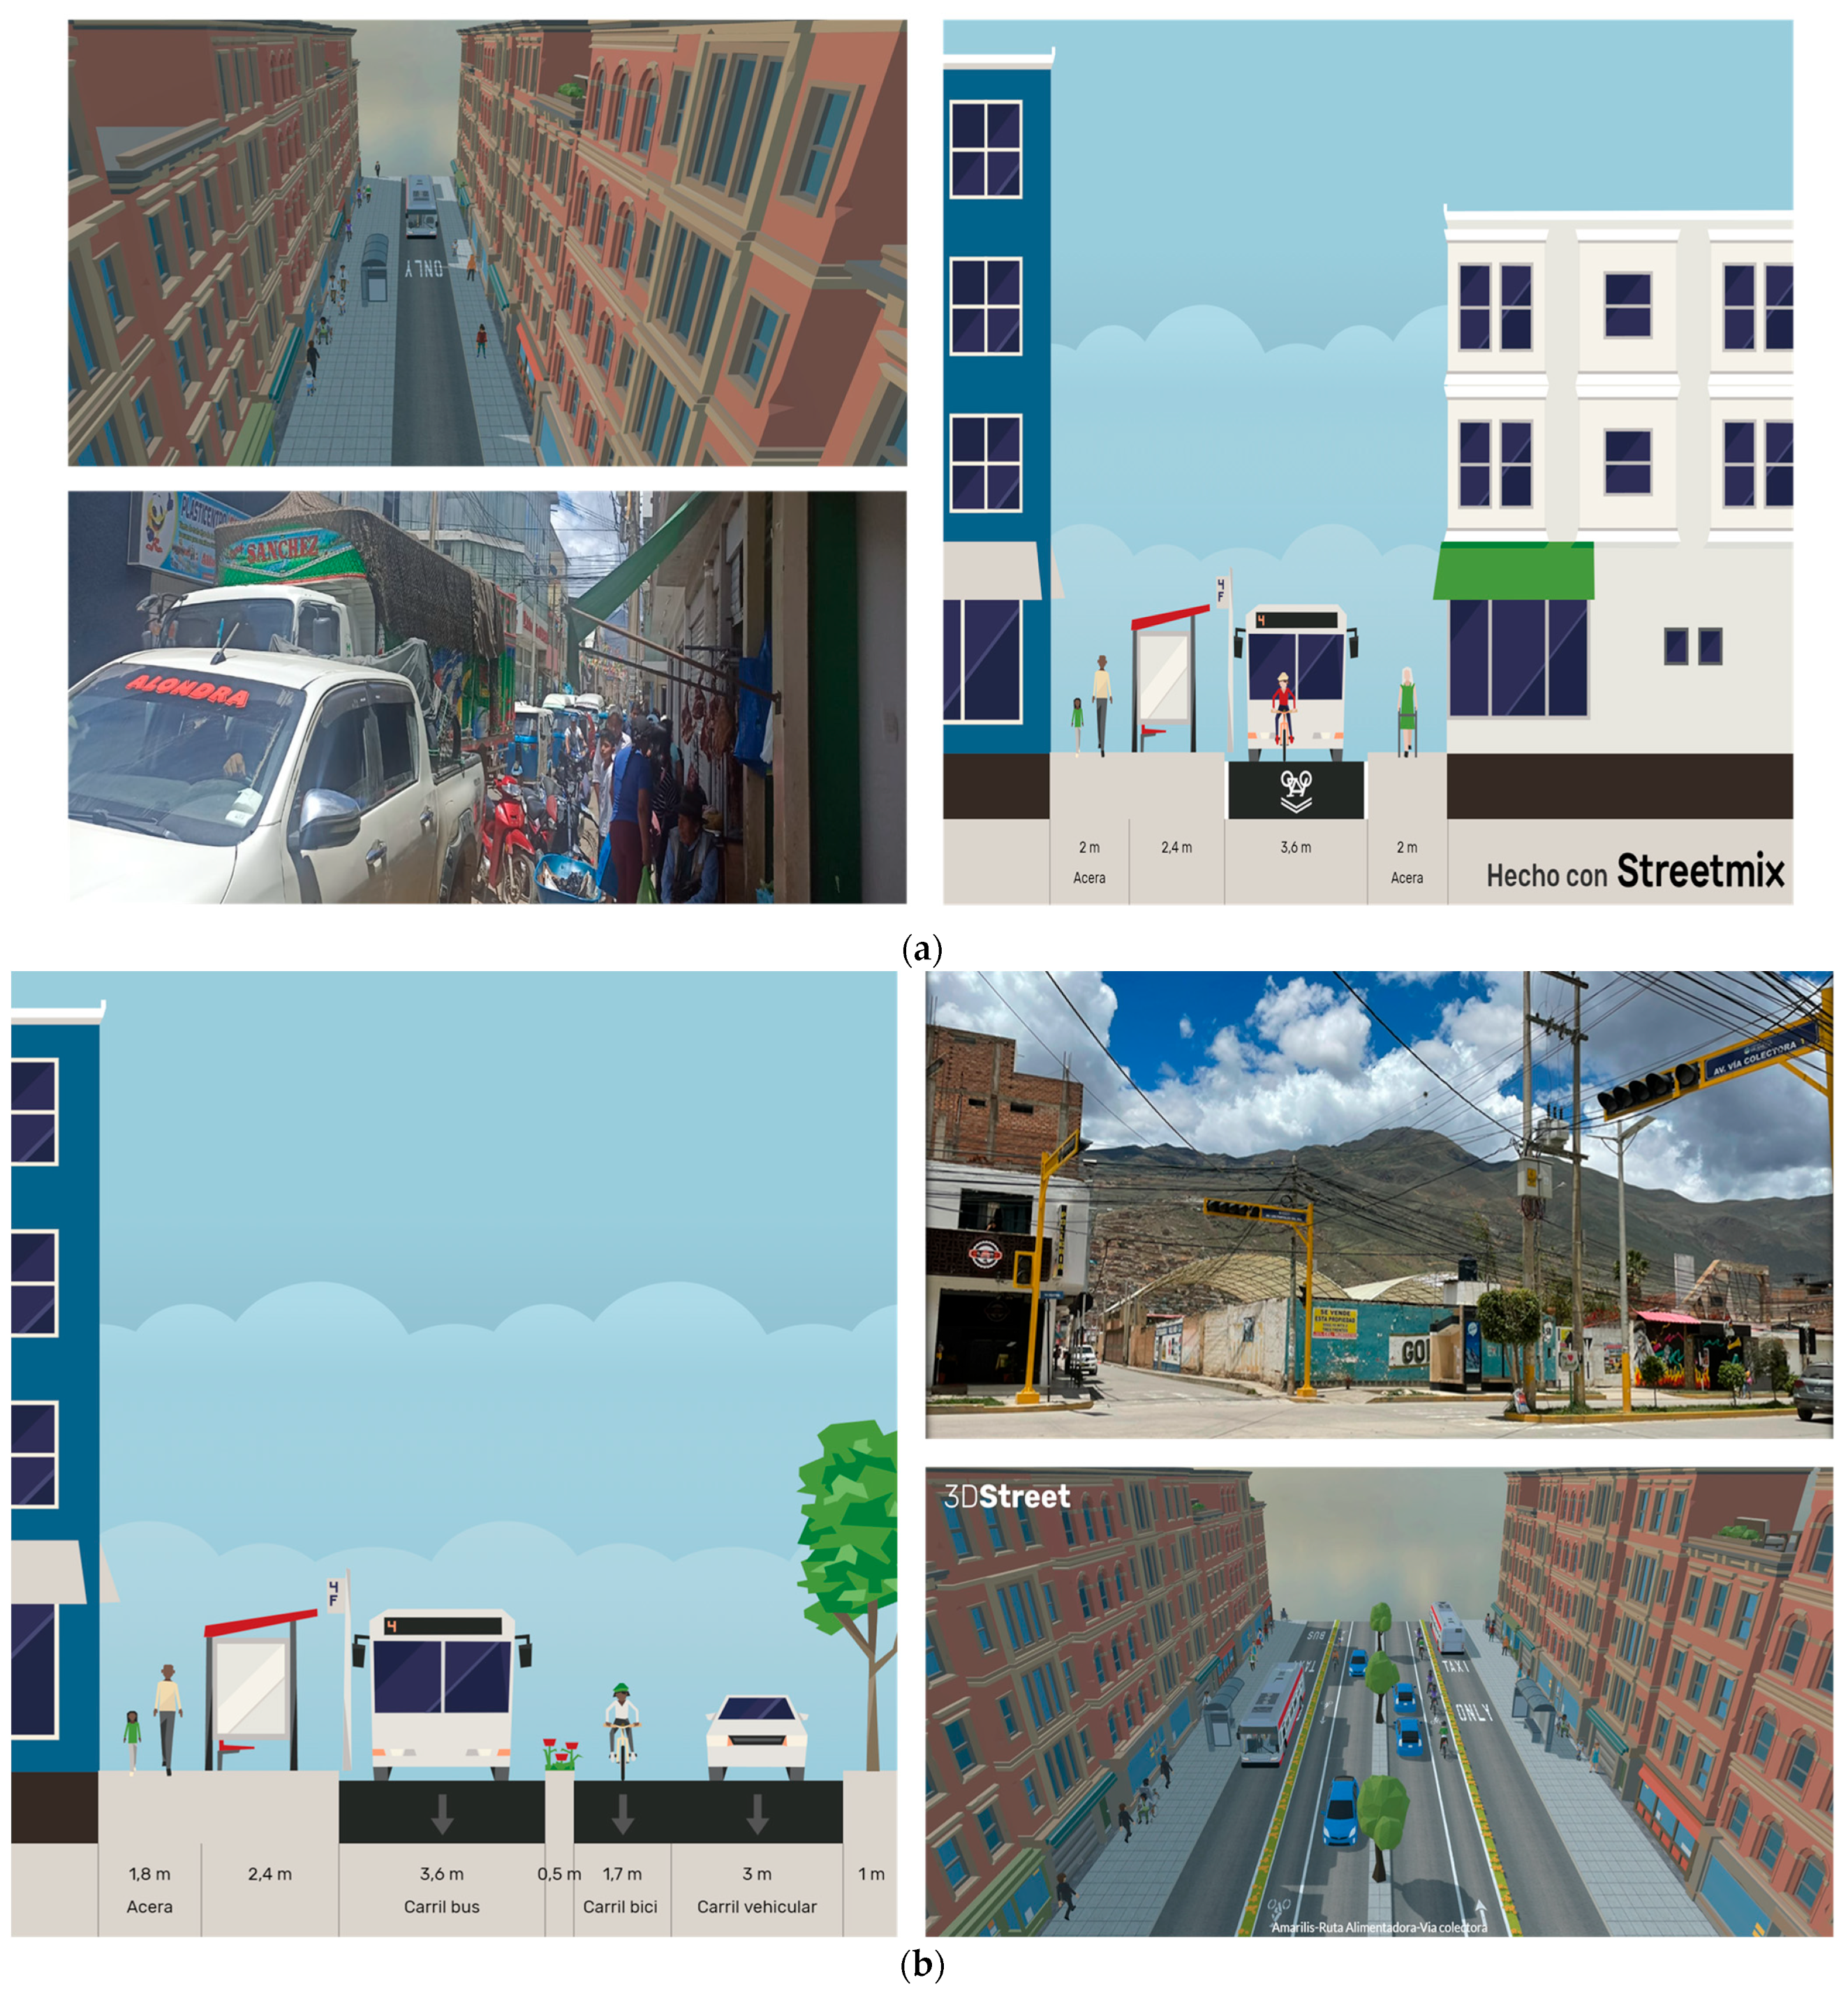
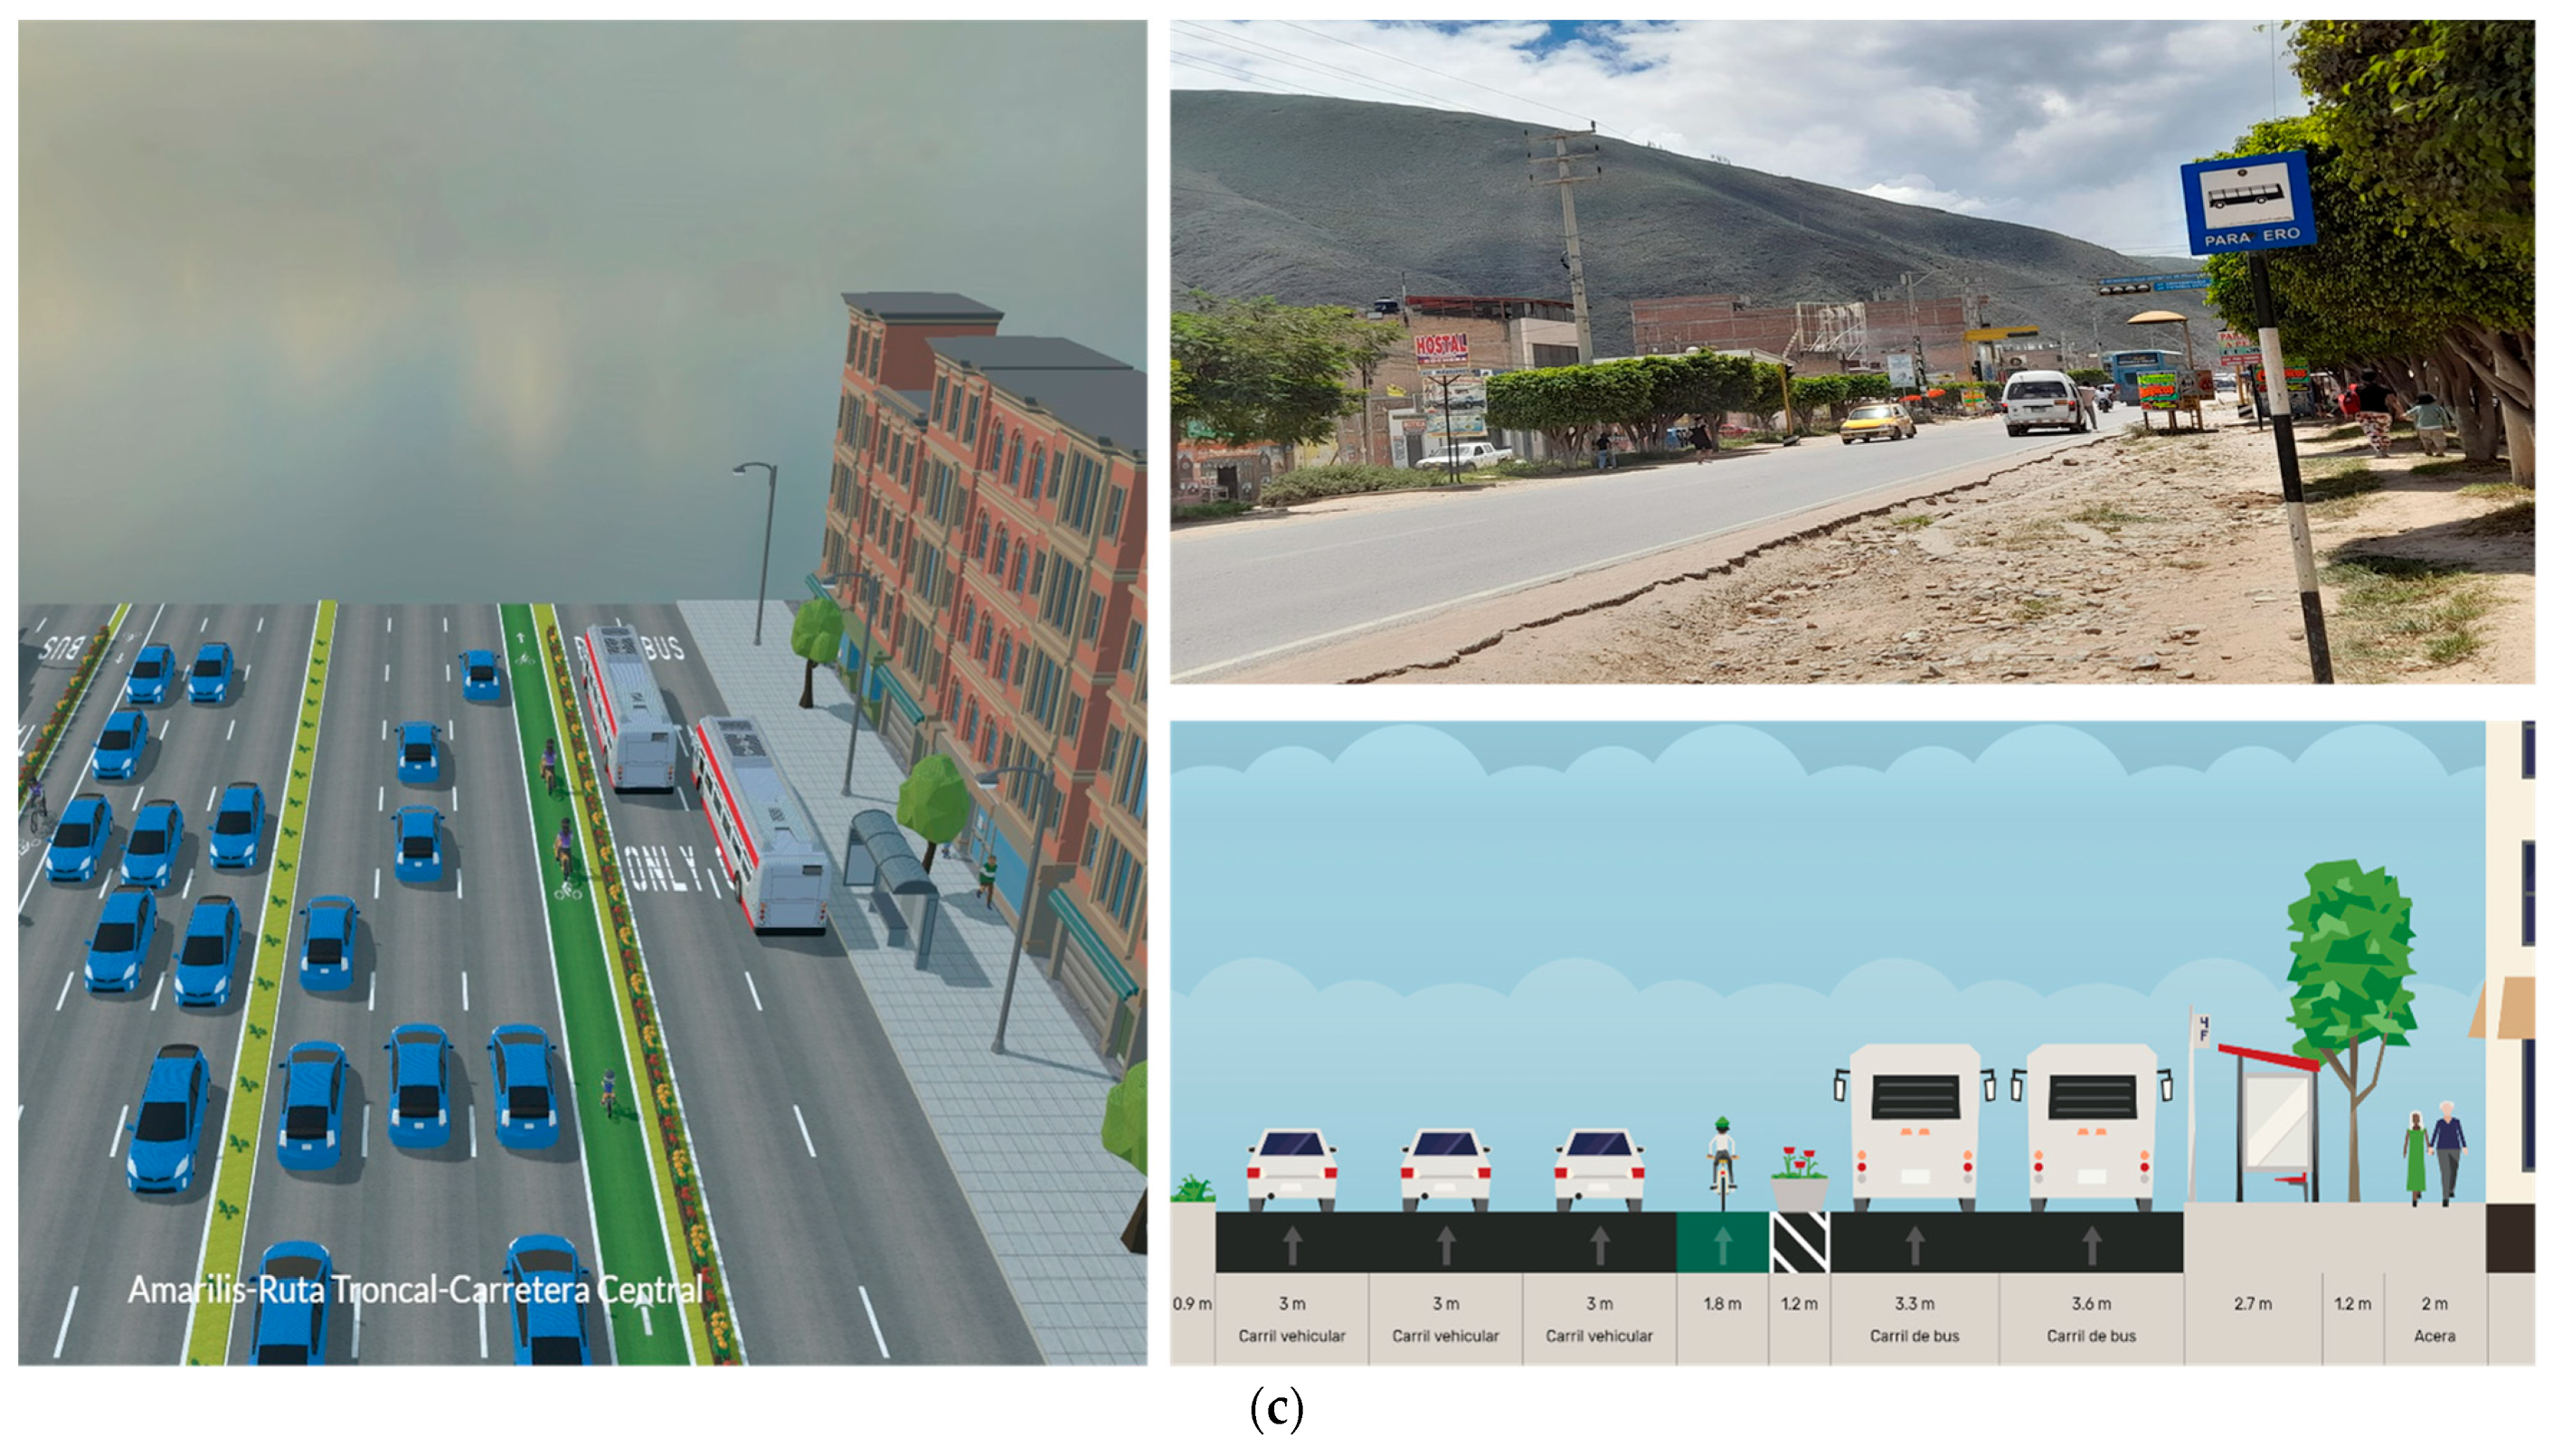
Seven feeder routes and one main route are proposed, covering the districts of Huánuco, Amaryllis, and Pillco Marca. The proposed routes should have the necessary infrastructure, which can be observed in detail in the cross-sections.
Figure 18 and
Figure 19 are visible, forming an integrated transport system. This proposal aims to optimize travel times, provide quality infrastructure, and reduce pollution caused by existing vehicle congestion, including the implementation of a modern vehicle fleet.
The proposal includes the creation of totem-style bus stops and the installation of horizontal and vertical signals, currently lacking in the districts of Amaryllis and Pill-comarca. The considered roads must be equipped with proper road infrastructure, including paving and suitable traffic conditions, as visualized in
Figure 19.
An integrated traffic light network should be established, or alternatively, the synchronization of functioning traffic lights in the metropolitan area of Huánuco should be checked, as this will help improve vehicle flow.
5. Discussion
The mass transit system in various countries worldwide, such as Curitiba, is considered an innovation focused on the economic and social development of the metropolitan region. It maintains a network spanning 790 km, catering to approximately 75% of the population in the Metropolitan Area of Curitiba. Its structure is based on exclusive lanes in each corridor, forming a ‘trinary’ system: three parallel lanes and two rows of interspersed blocks. This system is globally known and recognized for being pragmatic, integrated, efficient, and profitable. Additionally, its usage benefits the environment by reducing car usage, as previously mentioned [
34]. This contrasts with the results of the present research.
The BRT system is a public transport system that reflects the requirements above-mentioned. It has developed mainly in South America, where it was implemented for the first time. Taking into account the positive implications, it has spread globally, especially in Europe. BRT can be an upgrading solution for existing bus line systems that allow contexts with limited economic means to guarantee high-efficiency services, with significant positive implications both in economic and livability terms [
36].
From the results of interception surveys, vehicle capacity, and visual occupancy, it has been identified that in Huánuco, 29% of the population travels by collective taxi, followed by 25% using mototaxis, 17% using rural public transportation vans, and 4% using minibusses. Regarding the return home, 49% use these transportation means, followed by 23% for work, 12% for shopping, and 10% for study. Concerning the return home, it has been identified that for the collective taxi, representing the highest number of trips, users travel for study, followed by work and shopping. The rural public transportation van moves users primarily for shopping, followed by work and study. Mototaxis predominantly transport users for work and shopping. For walking, users travel mainly for work, followed by shopping and study.
Regarding rush hour, the vehicle capacity throughout the urban area of Huánuco has been identified to peak from 12:15 to 13:15, with 16,997 mixed vehicles circulating, representing 11.67% of traveling vehicles in the district on the day.
There is a 29% demand for passengers in collective vehicles; however, within the vehicle fleet, this represents 18% of the available supply, leading to inefficient service, displacing 16% of passengers. Similarly, there is a 25% demand for passengers in mototaxis; however, within the vehicle fleet, this represents 38%, indicating it is the most abundant transportation mode, causing the highest percentage of traffic congestion, currently displacing 25% of passengers. For public transportation in minibusses and rural public transportation vans (combi), there is a 21% demand for passengers; however, within the vehicle fleet, this represents 12%. However, this mode of transportation displaces 39% of passengers. This suggests that users of the transportation system prefer to use these economical modes, although there are enough units and the necessary number of routes. Currently, microbuses and Rural Public Transportation Vans (combi) in Huánuco transport the population from Huánuco to Amaryllis and Pillcomarca but do not meet the existing demand, which also contributes to the generation of environmental pollution in the world [
2].
The city of Huánuco currently lacks an efficient transportation system and quality infrastructure due to poor transportation service offerings, vehicular congestion in the city, and inadequate road infrastructure, resulting in environmental and noise pollution. This research focuses on providing solutions to the identified deficiencies.
To cater to the demand from South to North of 135,343 passengers, the creation of one main route and seven feeder routes is proposed, requiring 422 buses, suggesting totem-style stops, road infrastructure as observed in
Figure 17,
Figure 18 and
Figure 19, and exclusive lanes for the operation of this Mass Transit System. Similarly, to cater to the demand from North to South of 118,958 passengers, the proposal includes the creation of one main route and seven feeder routes, requiring 394 buses, suggesting totem-style stops, road infrastructure as seen in
Figure 17,
Figure 18 and
Figure 19, including exclusive lanes for the operation of this Mass Transit System.
With the implementation of the proposal, it is also recommended to include motorcycle taxis and collective cars as feeders to the system, as well as the restructuring of existing transport routes so as not to interfere with the proposal. As well as the supervision and regulation of the Transport System, with which we will be able to order the Transport System, and, as Vilma Tapia et al. maintain, vehicular rearrangement can contribute to the continued reduction in various environmental pollutants [
37].
Discouraging private transportation use and promoting the use of efficient public transportation will improve traffic conditions and alleviate vehicular congestion, thereby contributing to the success of this proposal. As mentioned by Kathryn Robson [
38], and as also maintained by Vajjarapu Harsha et al. in her research, the study states that the fare restructuring of BMTC bus service and introducing BRT lanes will be helpful in decongesting the roads in Bengaluru as well as in reducing the vehicular emission. The modeling shows the positive effect of restructuring the BMTC fares as it is increasing the mode share of the buses by more than 2% and also increasing the revenue by more than 15%. From emission plots, the fare restructuring would actually reduce the total Vehicle Kilometers Travelled (VKT) by all modes combined and will help reduce the emission of NOx, CO, CO2, PM, and HC into the atmosphere [
26].
In Lima, the implementation of an integrated system has improved the city’s mobility, as well as the renovation of urban public spaces, with similar results obtained in Bogotá and Curitiba [
39].


