Abstract
Wolf Rock Lighthouse is a Victorian era masonry structure located in an extreme environment facing the fiercest Atlantic storms off the southwest coast of England whose dynamic behaviour has been studied since 2016. Initially, a modal test was used to determine modal parameters; then, in 2017, a monitoring system was installed that has operated intermittently providing response data for a number of characteristic loading events. These events have included wave loads due to storms, a small UK earthquake, helicopters landing on the helideck, and the grounding of a ship on the reef. This is believed to be the most extensive experimental campaign on any structure of this type. This paper briefly describes a unique project involving the characterisation and measurement of dynamic behaviour due to different forms of dynamic loading.
1. Introduction
The lighthouses constructed during the 19th century on rock outcrops (reefs) around the shores of the United Kingdom remain as vital aids to maritime navigation in addition to and despite virtual systems such as GPS []. By their nature, they are constructed in locations exposed to severe weather, and the present structures are evolutions from prior designs that failed or proved to be unserviceable. Particular examples showing progressive improvements in structural design are the sequence of lighthouses that have occupied the Eddystone [,,,], south of Plymouth UK, and Bishop Rock [,], west of the Scilly Isles.
Apart from a study on Skerryvore Lighthouse by the Scottish engineer Stevenson [], the severe environmental loads these lighthouses endure have only recently been quantified, as part of a study [] funded by the UK Engineering and Physical Sciences Research Council (EPSRC), which stemmed from a pilot study on Eddystone Lighthouse []. The research project commenced in 2016 and combined physical and numerical simulations of lighthouse loading and performance, supported by direct measurements of full-scale performance. In particular, it featured Wolf Rock Lighthouse, which, due to its location in the Southwest Approaches (to the southwest of Great Britain and Ireland), is exposed to the full force of North Atlantic storms. This paper describes what is believed to be the most extensive experimental campaign undertaken on a structure of this type.
2. Description of Wolf Rock Lighthouse
The present structure at Wolf Rock (Figure 1), 15 km west of Land’s End (Cornwall), was built after learning from the experiences of previous British lighthouse designs and has functioned with only minor repairs to its superstructures to the present day. In fact, since 1988, Wolf Rock Lighthouse has been operated remotely and now only accommodates personnel during maintenance visits.
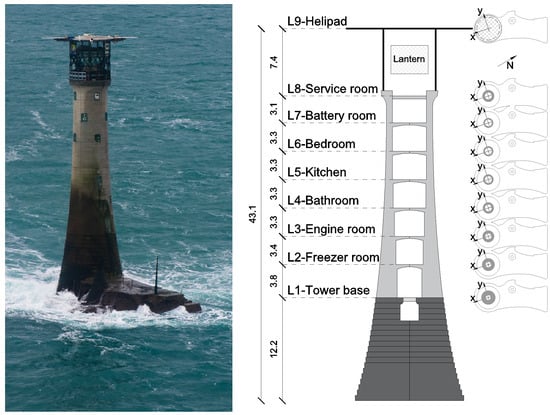
Figure 1.
Wolf Rock (photo James Bassitt) and internal layout (heights in m).
The lighthouse lies at 49°56.72′ N 05°48.50′ W, with 36.6 m deep water close to the reef on all sides but the southeast. With a design by James Walker, construction under the supervision of James Douglass [] began in 1862 with the working time available on the rock highly dependent on and restricted by weather and tides. In 1864, the landing platform was complete with the first masonry course of the tower in place, and the tower was finally completed in 1869.
The tower was constructed as 70 courses of 2–4 t granite blocks, quarried and pre-shaped before being shipped to site. The 1st course of two blocks and the complete circular disk of blocks of the 2nd course were each secured to the rock below by 50 mm diameter metal bolts sunk 0.3 m into the rock. Face stones in the external ring of blocks were dovetailed vertically and horizontally to fit vertical and circumferential neighbours, with stone in the 3rd to 20th courses also bolted into the course below. In addition, gaps were cemented for further anchorage and to prevent water ingress. In effect, the lighthouse is securely and mechanically locked to the reef on which it stands, but there remains a possibility that an extreme breaking wave could cause damage to the masonry structure.
The outside diameter reduces from a maximum 12.23 m at its base to a minimum 5.18 m under the lantern gallery with an internal diameter increasing from 2.74 m for the entrance room to 3.96 m at the lantern gallery, and the total volume of granite is 1260 m3 having a mass of 3350 t.
Wolf Rock was, in 1972, the first UK lighthouse to be equipped with a helideck as a precursor for automation to reduce operating costs. Initially, the helideck allowed for safe and regular transfer of personnel, supplies, and equipment instead of the previous weather-dependent and perilous transfers by boat and winch, but following full automation in 1988, the helideck was essential for quick access of a technician in case of a failure to operate, as well as for routine maintenance. The 6.35 m tall steel frame helideck comprises square and rectangular hollow sections with aluminium infill panels in the landing pad grillage to distribute live loads (helicopter, freight, etc.) to the frame. The total mass is unknown but is estimated to be 12 t. The mix of a lightweight flexible steel frame on a rigid masonry tower leads to interesting dynamic properties identified in the modal testing; indeed, anecdotal lighthouse keeper accounts are of a change to vibrations experienced in strong storms. It is the helideck that bears the brunt of fierce storms, with infill panels occasionally being forced out of the landing pad.
3. Modal Tests
Modal tests were carried out on a set of rock lighthouses around the UK in the period 2016–2021 [,], including Wolf Rock, as well as lighthouses at Les Hanois, Eddystone, Longships, and Bishop Rock around the southwest of the British Isles, and all featuring helidecks atop the masonry towers. In addition, lighthouses at Fastnet (west Ireland) [] and Dubh Artach (west Scotland), both featuring helicopter landing pads on the rock outcrops, were studied. Two distinct modal tests were carried out on Wolf Rock Lighthouse (in 2016 [] and 2019 [], as described here).
Modal testing was intended to identify one or two candidates for long term monitoring and detailed condition assessment supported by numerical modelling of the loads and structure. For the candidate structures, the modal properties, specifically natural frequencies and mode shapes, would be used to validate the finite-element and discrete-element modelling of the structures. Damping ratios and modal masses would also be obtained, the latter being crucial for relating wave loading to response in forward or backward estimations. Wolf Rock and Fastnet were chosen for more detailed investigation and monitoring, with Wolf Rock Lighthouse turning out to be the more interesting of the two.
All the lighthouses tested have the classical curved profile and superficially, due to their apparent axial symmetry, they might be expected to have pairs of horizontally orthogonal modes with identical or very close frequencies. Eigenvectors would align with specific strong and weak (principal) axes arising from structural details such as openings for windows and doors. The uncertainty of the alignment and difference between mode frequencies in a pair would depend on the breaking of perfect axial symmetry.
There are two types of modal test technology used in civil structures. Forced vibration testing (FVT) is still used for largely horizontal structures such as footbridges [], floors [], and grandstands [], but applications on towers are now rare, typically due to the logistical challenges of moving heavy shakers. Until algorithms for reliable operational modal analysis (OMA) were developed, FVT was the favoured technology since it mapped from ground vibration testing of aircraft where algorithms for experimental modal analysis had been developed. Some notable historical applications on tall civil structures include the Transamerica Building [] and an industrial chimney []. Progress in the development of OMA algorithms [,], low frequencies, and ambient loading (usually wind) mean the preferred approach for towers is now an ambient vibration survey, which lacks the capability for direct identification of modal mass and may miss identification of some modes.
Both testing methodologies were considered for deployment on Wolf Rock Lighthouse, limited by the logistics of helicopter access restricting both equipment and the time available on site. The first modal test in July 2016 focused on forced vibration using an electrodynamic shaker and power amplifier plus a set of 12 accelerometers, cables, and a signal recorder/analyser. Due to lack of time, minimal ambient measurements were made, but a second ambient vibration test in January 2019, with the luxury of an overnight stay, allowed an extended recording of ambient vibrations to improve the reliability of modal parameter estimates.
3.1. Forced Vibration Test
Due to the uncertain viability of OMA on ambient vibration data from such rigid structures with no knowledge of ambient vibration levels during calm weather, it was decided to use an electrodynamic shaker, which required careful planning with respect to possible magnetic interference with the helicopter and manhandling between the helideck to the lighthouse masonry structure. As a ‘dry run’ on moving shaker and accelerometers vertically in a lighthouse, a forced vibration test was first carried out on Smeaton’s Tower on Plymouth Hoe, the now redundant and relocated predecessor of the present-day Eddystone Lighthouse.
Wolf Rock Lighthouse has nine levels (Figure 1), from the entrance (level 1) to the helideck (level 9). Level 8 is the service room atop the masonry tower, and there is also a mezzanine walkway (not counted as a level) externally around the steel lantern enclosure. Level 7 is the battery room housing the cells for the solar array around the helideck which powers the lighthouse while unmanned, while a generator is operated during technical/maintenance visits.
In the array of accelerometers deployed, reference accelerometers were set up and maintained at several levels in a pair of predefined orthogonal axes, with the x-direction being set in the approximate southerly direction and 45° anticlockwise from the axis of the (level 1) entrance door, which is rarely opened and is set in a 2.3 m deep corridor.
Swept sine excitation was planned to use setups comprising two sets of roving accelerometer locations or ‘swipes’, each with two (orthogonal) shaker directions so that mode shapes could be mapped across all nine levels, totalling four ‘setups’. Time on site was strictly limited between arrival (09:35) and departure (16:30) of the Trinity House helicopter. Moving equipment throughout the tower, laying signal cables, and setting up for measurement took three hours, so by 12:35 accelerometers had been distributed to levels 1, 2, 5, 6, 8, and 9 and oriented as biaxial x/y pairs.
The lighthouse has a sequence of spiral staircases between levels along which signal cables needed to be laid. Avoiding disorientation and preserving alignment between accelerometer pairs at different levels was an unusual requirement for a modal test, requiring reference to floor plans marking salient features such as windows and bulkheads. Figure 2 shows the shaker in position at service room level (lantern gallery), biaxial accelerometer pair on the helideck (level 9), and biaxial pair with alignment jig in the freezer room (level 2).
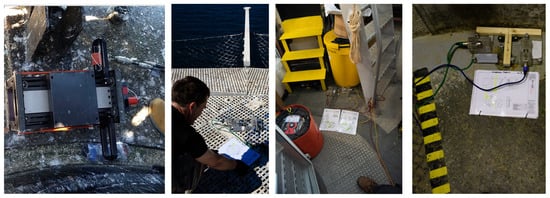
Figure 2.
Modal test. Left to right shaker, accelerometers on helideck, in service room (with steps on right that lead up to lantern level), and (with alignment jig) in freezer room.
To illustrate the challenges in effecting reliable measurements, the sequence of individual measurements (‘runs’ not for system checks) is summarized in Table 1. For ambient vibration measurements (run2 and run14), the shaker was not operating, and response was due to ambient actions of wave and wind. Due to the calm weather conditions, the shaker was driven first in the x-direction (only) with a broadband random signal, followed by a swept sine excitation to enhance the response and provide a clearer picture of the modes. Based on the quality of response data and the presence of peaks in the frequency spectra from the ambient and random excitation, it was decided to use swept sine shaker excitation focusing the force within the narrow range 3.4–8 Hz to obtain the most reliable modal parameter estimates.

Table 1.
Measurement details, data acquisition runs, and forced vibration ‘setups’.
There were significant issues with operation of the APS 114 electrodynamic shaker (believed to be a result of transport via helicopter), so the four best and longest duration recordings (runs) were used for modal analysis.
Figure 3 shows ambient response spectra from run2, showing several notable features. The strongest two signals (by an order of magnitude) are for the helideck. Other signals are from the masonry tower for which there appear to be three peaks in the range 0–10 Hz, one around 14 Hz and one around 21 Hz. As well as peaks at frequencies found in the masonry tower, there are other peaks occurring in the helideck at 5.1 Hz and 11 Hz. There are also sharp spikes around 12 Hz and 24 Hz which are most likely not true vibration modes but due to operation of the generator which does not operate at a single constant speed (an extra peak is seen in run5). Peaks believed to represent vibration modes were investigated via operational modal analysis and (including the shaker signal) experimental modal analysis in the frequency domain.
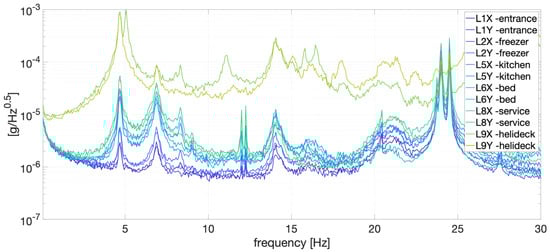
Figure 3.
Wolf Rock ambient response, run2.
Frequency response functions obtained using the shaker are examined in Figure 4 using both types of frequency response function (FRF) estimator, i.e., ‘H1′ and ‘H2′ [], which are, respectively, appropriate when ‘noise’ appears/does not appear on the response signal. The coherence function in the lower plot shows the 5.1 Hz signal appearing closer to 5 Hz uncorrelated with the shaker (input), and the peak disappears when using the H1 FRF estimator; hence, it is purely a helideck mode with zero involvement of the tower.
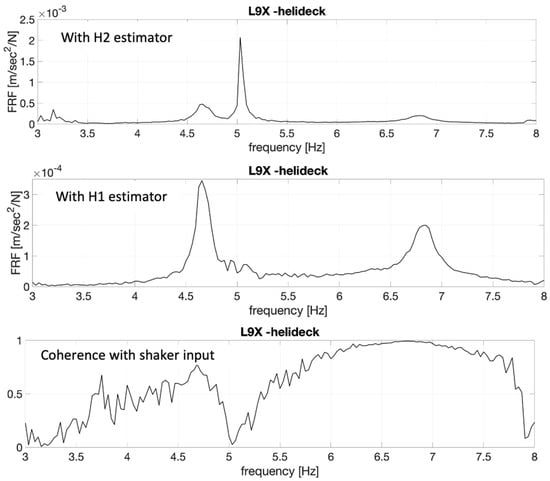
Figure 4.
FRFs between helideck (L9) and shaker in x-direction (run18) using H2 FRF estimator (upper), H1 estimator (middle), and coherence function (lower).
The best estimates for modal parameters obtained using the global rational fractional polynomial method [] on the FRFs are given in Figure 5. For practical purposes, only the first two modes in each direction are relevant, having almost identical mode shapes, masses, and damping ratios and frequencies for the two directions, so that direction of loading will have a negligible effect on the response. The helideck responds much more strongly in the lowest freuqency pair of modes, which have much larger modal mass for unity scaling at the top of the tower and which will be less strongly excited by horizontal (wave) loads on the tower.
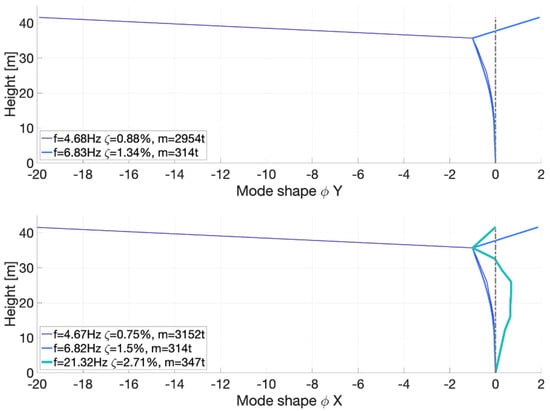
Figure 5.
Key modal properties from forced vibration test.
3.2. Ambient Vibration Survey
The ambient response data from the 2016 measurements were limited and insufficient to identify mode shape orthogonality other than for the assumed directions imposed in the forced vibration test. This is rather a curiosity of structural dynamics, but the issue of distinguishing distinct orthogonal eigenvectors and their preferred alignment in axisymmetric vertical structures has parallels in other applications such as telecoms towers and industrial chimneys. Hence, in 2019 [], an ambient vibration survey limited to selected locations in the tower (excluding the helideck for operational and weather reasons) but with extended duration (due to an overnight stay) was used to track the modal parameters (frequencies, mode shapes, and damping ratios) of the first two modes. The identified eigenvector/mode shape directions happened to align with the triaxial accelerometer installed for long term monitoring in September 2017 (and discussed in the remaining sections of the paper). Figure 6 shows the y-direction uniaxial QA 750 accelerometers aligned with the (negative) y axis of the triaxial monitoring accelerometer at level 7.
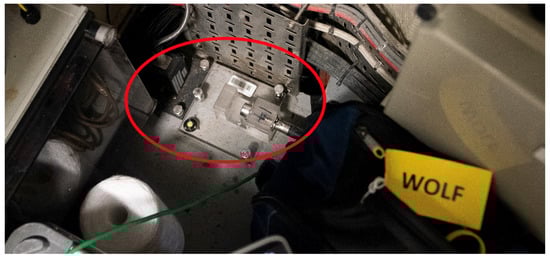
Figure 6.
y-direction uniaxial accelerometer in corner of battery room (level 7) adjacent to triaxial monitoring accelerometer.
The Bayesian operational modal analysis (BAYOMA) procedure [] was applied to acceleration signals recorded for eight hours starting 23:11 on 18 January 2019 from four biaxial accelerometer pairs, at levels 1, 5, 7, and 8. The recording was broken into 96 5 min segments from each of which mode shapes, frequencies, and damping ratios were estimated. Singular value decomposition (SVD) of cross-power spectral densities from a sample is shown in Figure 7 indicating four mode pairs. Mode 3 at ~6.16 Hz was not distinct in the overnight recording and was not tracked.
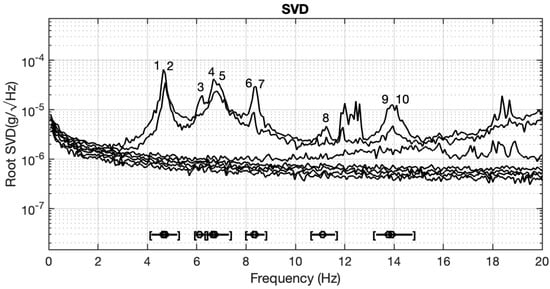
Figure 7.
Singular value decomposition of acceleration cross-power spectral density.
Variation of natural frequencies for mode pairs 1/2 and 4/5 over the eight hours is shown in Figure 8. Mode pair 1/2 frequencies are well separated compared to the forced vibration test values and are identified with high certainty (i.e., with low variance error). Mode pair 4/5 frequencies are close, have higher variance errors and are lower than the forced vibration test values.
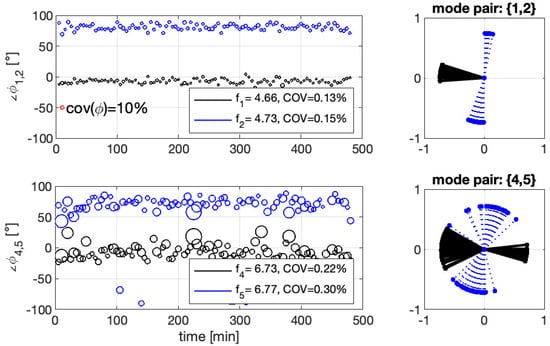
Figure 8.
Mode shape level 8 ordinates for first two mode pairs from Figure 7.
Mode shapes for these mode pairs are, apart from the missing helideck ordinate, similar to the first two mode pairs in Figure 5, and variation in the level 8 (service room) ordinate over the 8 h is shown in two ways in Figure 8. This indicates that, for the modes that matter, i.e., those pairs below 8 Hz, the accelerometers used in the ambient vibration measurements (and the monitoring) were/are fortuitously aligned with the mode eigenvectors. The plots on the left indicate the coefficient of variation by the circle diameter. The first mode pair, which is known from the forced vibration test to strongly engage the helideck, has relatively stable alignment.
4. Monitoring
A single JA-70SA triaxial servo accelerometer was installed in level 7 (battery room) (Figure 6) on 7 September 2017 with the positive x axis having a compass bearing of 33°. A National Instruments data acquisition system located in the lantern room (Figure 9) samples acceleration signals at 128 Hz and stores them as 10 min TDMS files on a USB drive, with the system automatically reset at midnight once a week to deal with the system crashing. Communication to land using 4G mobile communication was initially established but failed after a year of operation and it has never been possible to retrieve data other than manually during a visit by maintenance crew. Ideally, the system records 144 data files every day, but occasionally fewer are recorded and there are days of no data. For the period of available data (at time of writing, 8 September 2017–12 July 2023) 972 full or partial days of data are available with numerous gaps, for example during the COVID-19 pandemic when maintenance visits could not be used to retrieve data. From the collected data, significant events have been recorded, some of which are described here.
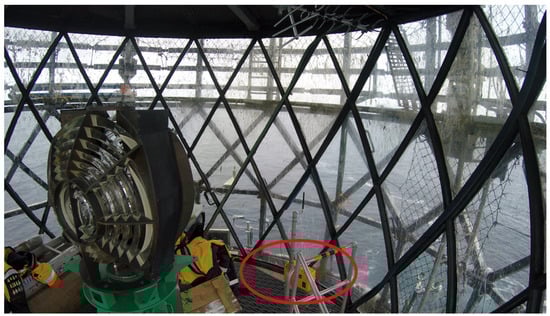
Figure 9.
Yellow logger (data acquisition, storage, and communication) box in lantern room. Steel framework of helideck is visible outside.
4.1. Wave Loading during Storms
Unsurprisingly, the greatest risk to a rock lighthouse is the ferocity of the storms and the wave impacts which have led to the destruction of many structures worldwide, most spectacularly in the case of the first Eddystone Lighthouse [], which was swept away by the Great Storm of 1703 []. Direct measurement of these forces is practically impossible (authors found only the attempt by Stevenson []), so the approach adopted is photographic recording of waves (which at the time of writing has not captured the most extreme events), simulations based on known wave climate, and indirect estimation via the monitored dynamic response.
A sample of acceleration data is shown in Figure 10 for one day of relatively strong wave-induced response (23 September 2017), successively zooming in to individual transient responses to breaking waves. The stronger response occurs during the two periods of high tide (tidal range can reach 5 m), and the spectrogram shows that the mode pair around 6.8 Hz is the most strongly excited.
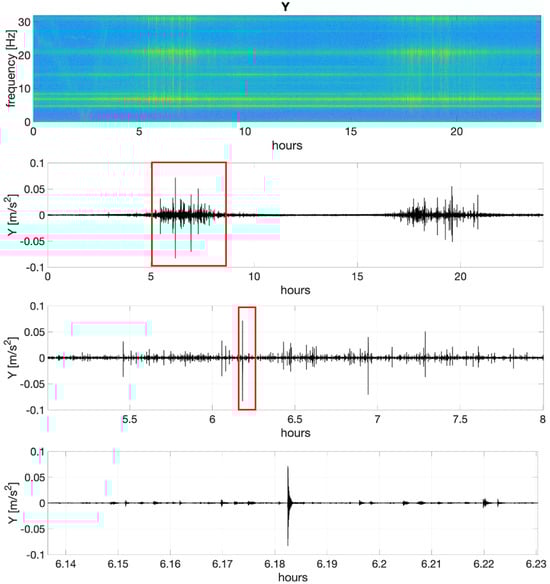
Figure 10.
Sample of wave-induced response during 2017 storm season. Top two rows: time–frequency plot (spectrogram) and time history for complete day, lower two plots successive zoom into single wave impact.
During the monitoring period with available data, several storm events were captured, the majority named by the UK Meteorological Office, others named by the USA (Ophelia), Portugal (Diana, Irene), or France (Matthis). The strongest recorded acceleration was during Storm Brian which reached 2.6 m/s2, (Figure 11) corresponding to 0.7 mm level 7 displacement aligned south of west, consistent with prevailing wind (hence breaking wave) direction.
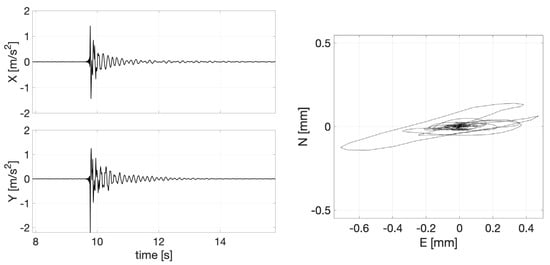
Figure 11.
Response to wave impact during Storm Brian as acceleration and displacement trajectory.
Figure 12 shows peak 10 min velocities over five storm seasons (much of 2020/21 was missed due to COVID-19). Rather than taking accelerations for the strongest wave impacts, peak velocities obtained from the vector sum of integrated level 7 accelerations are shown as they directly indicate wave loads. This is due to the impulsive nature of the response (evident in Figure 10) via the relationship of known modal mass and change of velocity (the indicated peak values) to wave force × duration.
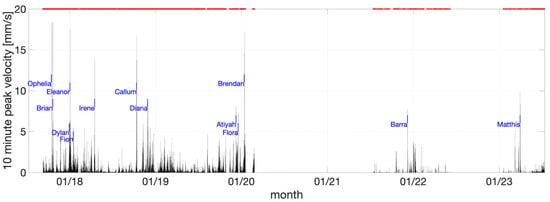
Figure 12.
Recorded battery room peak velocities. Red dots indicate available data.
This information has been used to estimate the wave forces experienced due to breaking waves for ex-Hurricane Ophelia. The inertia force of an exemplar extreme wave impact (envisaged via the modal mass for unity mode shape at level 7) is shown in Figure 13. Via the Bayesian inverse identification process described in [], the response corresponds to a peak force of 7 MN if applied as a breaking wave impact 7.15 m above the tower base and with the strongest part, a double-peak impulsive component lasting 0.06 s. In fact, knowledge of the point of wave impact is not known and is one objective of the video system now in operation.
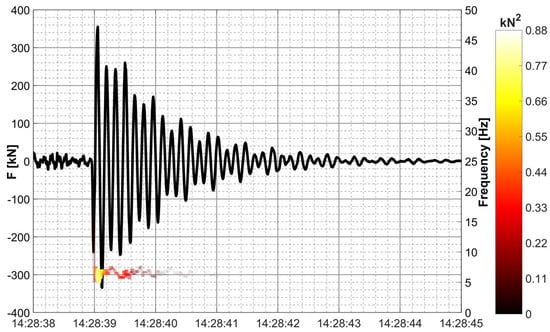
Figure 13.
Inertia force based on acceleration signal and modal mass and instantaneous frequency.
It is the impulse (integration of force with respect to time) that delivers the change in momentum observed as velocity change via the data acquisition system, with the duration of the wave impact being a fraction of a second. If the response is a linear elastic vibration, the impulse can be estimated via modal mass and the peak modal velocity due to the impulse.
Anecdotal experience of Wolf Rock Lighthouse keepers correlates with a vibration which could be sufficient in extreme storms to dislodge the contents of shelves. The present Bishop Rock Lighthouse [,] is an extended and strengthened form of the original lighthouse completed in 1858 which was known to vibrate ‘considerably’ during hurricanes [], sufficiently to damage the optical system. Anecdotal experience of lighthouse keepers is that the strengthened Bishop Rock Lighthouse vibrates less than Wolf Rock Lighthouse.
Through a process beginning with characterisation of the local wave climate [], it is found that for 2067 climate and sea level conditions, and for a 250-year return period, a maximum impact force on Wolf Rock Lighthouse due to a slamming wave would be delivered between 9.7 m and 18 m above the tower base, with a peak force of 51.15 MN, duration of 0.07 s, and impulse of 1.525 MNs. Keying and dovetailing would prevent failure but the uplift force limit without keying is 5.7 MN, so the result [] would be rigid body motion (rocking) with opening of gaps between the keyed courses up to 0.022 m on the upper joints opposite the impact and horizontal movement peaking at 0.276 m after 1.15 s. Horizontal translational velocity would be 1.5 m/s.
There is also a potential threat to the helideck for which the analysis indicates tensile loads approaching yield strength of the connecting bolts between the helideck and the steel bars embedded in the tower.
The concept that the modern helideck is more vulnerable than the Victorian tower led to an investigation into possible future designs of helidecks, which involved a comprehensive modal test of the helideck structure of Bishop Rock Lighthouse [].
4.2. Helicopter Operations
While (for safety reasons) it has not been possible to record helideck accelerations directly during helicopter landing, unloading, loading, and takeoff, it has been possible to record the tower response on numerous occasions via the monitoring system or the accelerometer array used for ambient vibration survey. The aircraft currently used is an Airbus EC135 with a four-bladed rotor (Figure 14) with 100% rotor speed achieving approximately 400 revolutions per minute (RPM).
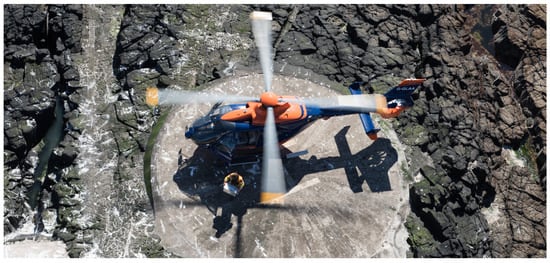
Figure 14.
EC135 helicopter G-GLAA on Dubh Artach lighthouse helipad.
Two occasions are shown in Figure 15. The first is for the afternoon of 6 January 2020 when the same helicopter made two visits to ferry workers from the lighthouse to Land’s End (St Just) airport, a distance of approximately 20 km. There is a strong steady state signal around 0.03 m/s2 with an amplitude of 6.65 Hz. This is consistent with other known helicopter visits. The second occasion is during the ambient 2019 vibration survey (for which simultaneous monitoring data are not available) showing three periods: a steady 5.02 Hz period between two short periods of vibration, first at 6.66 Hz then at 6.69 Hz. This appears to be a unique recording (among all the monitoring data). The higher frequency corresponds to ~400 (rotor) RPM observed using video recording of the aircraft landing at the lighthouse, while the lower frequency corresponds to ~300 RPM observed from audio recording of the aircraft (idling) on the ground at Land’s End Airport.
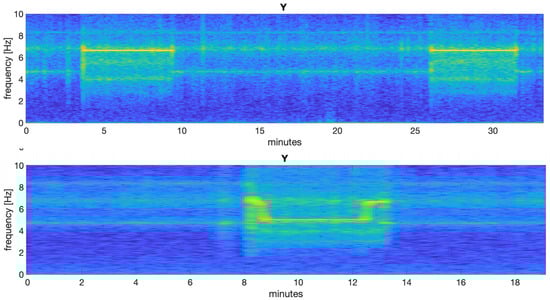
Figure 15.
Spectrograms of level 7 response for helicopter visits in 2020 (upper) and 2019 (lower).
The upper and lower frequencies correspond closely to the 5.01–5.1 Hz mode evident from 2016 ambient response (Figure 3) and the 6.73 Hz and 6.77 Hz estimates obtained from the 2019 ambient response (Figure 8). The forcing function due to the rotors at both full and idling speeds is apparently close enough to mode frequencies to cause resonant amplification.
Even using mode shape ordinates obtained from the forced vibration test to rescale the level 7 vibration amplitudes to estimate helideck accelerations, the levels of vibration would not be at a level and duration that would affect the structure condition.
4.3. Earthquake
The United Kingdom does not experience strong earthquakes, but there are occasional relatively strong tremors, such as the 4.6 ML Richter local magnitude event of 17 February 2018 [] around 2:30 P.M. with epicentre at Cwmllynfell, South Wales, approximately 230 km northeast of Wolf Rock. The triaxial response of Wolf Rock Lighthouse, occurring at low tide and with moderate level 7 accelerations due to breaking wave impacts of a rising tide, is shown in Figure 16, with signal duration consistent with the local (Wales) seismometer recordings of the event.
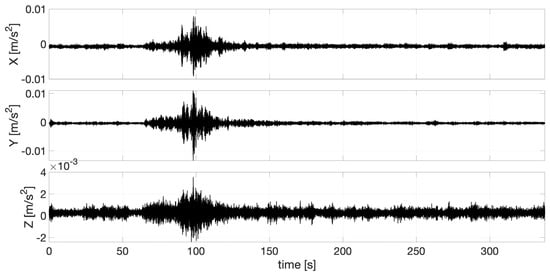
Figure 16.
Acceleration time series due to earthquake.
The response is mainly in the second mode (Figure 17; x/east is similar):
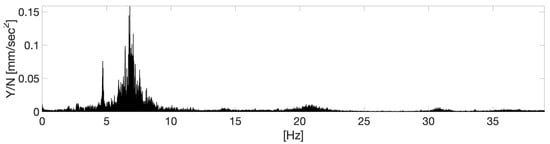
Figure 17.
Acceleration FFT due to earthquake.
4.4. Ship Grounding
On 10 July 2023, the RoRo cargo ship Mazarine, enroute from Ireland to Belgium, lost power and drifted onto the reef of Wolf Rock. Marine tracking shows that the grounding occurred at 09:27 UTC (10:27 local time). The tide was still rising at the time (high tide at 10:00 UTC) and the ship rotated around the stern, resuming a drift towards the Cornish coast at 09:50 (Figure 18).
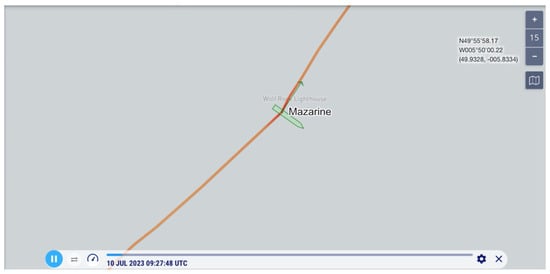
Figure 18.
Trajectory of Mazarine, indicating grounding at 09:27.
There was concern about a possible impact with the lighthouse itself, and a Trinity House helicopter (fortunately serving nearby Trinity House assets at the time) was sent to fly by for a visual inspection after the ship had moved, followed by landings on 11 July 2023 and 13 July 2023 July, giving an opportunity to retrieve monitoring data.
The y/north acceleration for the period from 6 A.M. to noon is shown in Figure 19 and features typical breaking-wave impacts (for a relatively windy summer day) but no evidence of the ship directly impacting the structure.
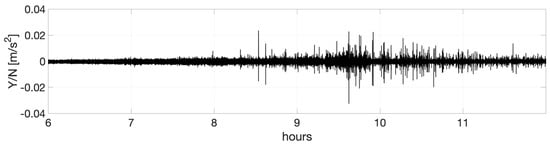
Figure 19.
Acceleration response between 6 A.M. and 12 noon, 10 July 2023.
4.5. Vibration Monitoring of Other European Lighthouses
As part of the same project [], limited monitoring was carried out at Fastnet Lighthouse [] off the southwest coast of Ireland. Due to its reduced exposure to large waves compared to Wolf Rock Lighthouse and standing relatively high on Fastnet Rock, the observed levels of response were at least an order of magnitude compared to Wolf Rock Lighthouse. With unreliable internet connection and more complex travel (first from England to Ireland), the monitoring system was removed after a short period of operation. Other monitoring projects have involved Eddystone Lighthouse [], a set of French lighthouses (phares) including La Jument off the coast of Brittany, and Norströmsgrund Lighthouse [] in the North Baltic Sea close to Luleå. However, the Wolf Rock study is unique in combining extended monitoring with modal testing including modal mass estimation for back-analysis of wave forces.
La Jument is famous due to the 1989 aerial photograph by Jean Guichard [] of a large breaking wave and has been monitored [,] using a set of four triaxial accelerometers set at different heights together with X-band radar and stereo-video imaging to capture breaking waves and structural responses. The first mode for La Jument is at 3.66 Hz for a peak acceleration of 3.3 m/s2 recorded on 3 January 2019. Norströmsgrund Lighthouse is a rare example of direct measurement of ice forces on a structure (another example being Confederation Bridge [] in Canada). As well as ice forces, biaxial accelerations were monitored and provided information on the variation of modal frequency and the damping ratio. It was found that the first vibration mode at 2.9 Hz was the most influenced by the ice actions in terms of dynamic response and high damping, believed to be due to interaction at the ice–structure interface.
Other vibration data are available only for short periods but sufficient to at least identify first mode (f1) frequencies. For example, data made available to the authors for other French lighthouses indicate lower f1 frequencies than La Jument, and data from modal tests of other rock lighthouses of a similar design to Wolf Rock around the British Isles [,] indicate a range of f1 frequencies from 4.05 Hz to 5.75 Hz.
5. Final Comments
The response of Wolf Rock Lighthouse to earthquake, helicopter, and ship grounding is negligible compared to the effect of breaking wave forces. Response levels observed at the battery room level during the monitoring period just reach the level below which ‘damage that reduces the serviceability of the building will not occur’ for an ‘industrial building’ according to most stringent standard, the German DIN 4150. At the other extreme, the 250-year breaking wave load would lead to a rigid body horizontal movement of 0.276 m, without structural failure. Such an event could be a risk to helideck holding down bolts. The only damage due to breaking waves sustained to date has been the dislodging of helipad infill panels. The endurance of the masonry structure since completion in 1869 is a remarkable testament to the skills of the Victorian era engineers who designed and constructed it. The successful evolution of design that led to the classical form of Wolf Rock and other lighthouses around the British Isles is apparently reflected by their high first mode frequencies. Wolf Rock Lighthouse has survived a century and a half, and even with climate change the masonry structure (and others of its type) seems likely to survive another century, with a continuing need for both visual (lighthouse) and virtual (e.g., GPS) navigational aids. This is just as well, as the capability to build such a robust structure in such an extreme location will almost certainly have disappeared.
The knowledge of wave loading derived from the project has possible applications in wave loading of wind turbines, while the experiences in modal testing and monitoring have informed dynamic testing and monitoring of other extreme structures and monitoring of tower-like structures such as industrial chimneys, as well as marine breakwaters.
Author Contributions
J.B. (James Brownjohn) obtained funding, carried out some of the modal analysis, analysed the monitoring data, and wrote the paper. A.R. was the original initiator for the whole project and obtained funding. J.B. (James Bassitt) participated in the 2016 modal test, built the monitoring system, and collected the bulk of the monitoring data. A.A. participated in the 2016 modal test and carried out the inversed force identification. Z.Z. carried out the BAYOMA analysis of the 2019 data. P.D. supported the project from the beginning and facilitated all the measurement and data retrieval exercises through arranging and funding the helicopter visits and providing access to the structure and historic structural information. All authors have read and agreed to the published version of the manuscript.
Funding
This research has been supported by EPSRC (grant references EP/N022947/1, EP/N022955/1 and EP/NO23285/1).
Data Availability Statement
Data may be available from the author on reasonable request subject to permission from Trinity House.
Acknowledgments
We acknowledge with thanks the data acquisition in 2019 by Alex Pavic.
Conflicts of Interest
The authors declare no conflicts of interest.
References
- Turner, N.M. Traditional Aids to Navigation: The Next 25 Years. J. Navig. 1997, 50, 234. [Google Scholar] [CrossRef]
- Douglass, W.T.; Webb, S.; Owen, G.W.; Redman, J.B.; Beazeley, M.; Harcourt, L.F.V.; Williams, P.; Inglis, J.C.; Rawlinson, S.R.; Brunton, R.H.; et al. Discussion. The new Eddystone Lighthouse. Minutes Proc. Inst. Civ. Eng. 1884, 75, 37–56. [Google Scholar] [CrossRef]
- Douglass, J.N. Note on the Eddystone Lighthouse. Minutes Proc. 1878, 53, 247–248. [Google Scholar] [CrossRef]
- Raby, A.; Bullock, G.N.; Banfi, D.; Rafiq, Y.; Cali, F. Wave loading on rock lighthouses. Proc. Inst. Civ. Eng. Marit. Eng. 2016, 169, 15–28. [Google Scholar] [CrossRef]
- Trinity House, Eddystone Lighthouse, (n.d.). Available online: https://www.trinityhouse.co.uk/lighthouses-and-lightvessels/eddystone-lighthouse (accessed on 21 February 2024).
- Douglass, W.T. The Bishop Rock Lighthouses. (Includes Plates). Minutes Proc. Inst. Civ. Eng. 1892, 108, 207–220. [Google Scholar] [CrossRef]
- Trinity House, Bishop Rock Lighthouse, (n.d.). Available online: https://www.trinityhouse.co.uk/lighthouses-and-lightvessels/bishop-rock-lighthouse (accessed on 21 February 2024).
- Stevenson, A. Account of the Skerryvore Lighthouse with Notes on the Illumination of Lighthouses; Adam and Charles Black: London, UK, 1848. [Google Scholar]
- Raby, A. STORMLAMP—STructural Behaviour of Rock Mounted Lighthouses at the Mercy of Impulsive Waves, (n.d.) EP/N022955/1. Available online: https://gow.epsrc.ukri.org/NGBOViewGrant.aspx?GrantRef=EP/N022947/1 (accessed on 26 March 2024).
- Douglass, J.N. The Wolf Rock Lighthouse. (Includes Plates). Minutes Proc. Inst. Civ. Eng. 1870, 30, 1–16. [Google Scholar] [CrossRef]
- Brownjohn, J.M.W.; Raby, A.; Bassitt, J.; Antonini, A.; Hudson, E.; Dobson, P. Experimental modal analysis of British rock lighthouses. Mar. Struct. 2018, 62, 1–22. [Google Scholar] [CrossRef]
- Pappas, A.; D’Ayala, D.; Antonini, A.; Brownjohn, J.M.W.; Raby, A. Numerical modelling of Fastnet Lighthouse based on experimental dynamic identification. In Proceedings of the ICACMS 2017 International Conference on Advances in Construction Materials and Systems, RILEM, Chennai, India, 3–8 September 2017. [Google Scholar]
- Au, S.-K.; Brownjohn, J.M.W.; Li, B.; Raby, A. Understanding and managing identification uncertainty of close modes in operational modal analysis. Mech. Syst. Signal Process. 2021, 147, 107018. [Google Scholar] [CrossRef]
- Zivanovic, S.; Pavic, A.; Reynolds, P. Modal testing and FE model tuning of a lively footbridge structure. Eng. Struct. 2006, 28, 857–868. [Google Scholar] [CrossRef]
- Pavic, A.; Reynolds, P. Modal testing and dynamic FE model correlation and updating of a prototype high-strength concrete floor. Cem. Concr. Compos. 2003, 25, 787–799. [Google Scholar] [CrossRef]
- Reynolds, P.; Pavic, A.; Carr, J. Experimental dynamic analysis of the Kingston Communications Stadium. Struct. Eng. 2007, 85, 33–39. [Google Scholar]
- Bouwkamp, J.G.; Stephen, R.M. Ambient and Forced Vibration Studies of a Multistory Pyramid-Shaped Building; Rome, Italy. 1974, pp. 260–269. Available online: https://www.iitk.ac.in/nicee/wcee/article/5_vol1_260.pdf (accessed on 15 April 2024).
- Da Rin, E.M. Dynamic structural testing of Torre Valdaliga Nord power plant 250m high multi-flue chimney. In Proceedings of the XXV CICIND Meeting, Venice, Spain, April 1986. [Google Scholar]
- Peeters, B. Reference based stochastic subspace identification for output-only modal analysis. Mech. Syst. Signal Process. 1999, 13, 855–878. [Google Scholar] [CrossRef]
- Brownjohn, J.M.W. Ambient vibration studies for system identification of tall buildings. Earthq. Eng. Struct. Dyn. 2003, 32, 71–95. [Google Scholar] [CrossRef]
- Ewins, D.J. Modal Testing: Theory and Practice; Research Studies Press Ltd.: Hertfordshire, UK; John Wiley and Sons Inc.: Taunton, UK, 1984. [Google Scholar]
- Formenti, D.L.; Richardson, M.H.; Formenti, D.L. Parameter estimation from frequency response measurements using rational fraction polynomials. In Proceedings of the 1st IMAC Conference, Orlando, FL, USA, 8–10 November 1982; pp. 167–181. [Google Scholar]
- Au, S.K. Operational Modal Analysis: Modeling, Bayesian Inference, Uncertainty Laws; Springer Nature: Singapore, 2017. [Google Scholar]
- De Wire, E. England’s Great Storm. Weatherwise 1996, 49, 34–38. [Google Scholar] [CrossRef]
- Antonini, A.; Brownjohn, J.M.W.; Dassanayake, D.; Raby, A.; Bassit, J.; Pappas, A.; D’Ayala, D. A Bayesian inverse dynamic approach for impulsive wave loading reconstruction: Theory, laboratory and field application. Coast. Eng. 2021, 168, 103920. [Google Scholar] [CrossRef]
- Raby, A.C.; Antonini, A.; Pappas, A.; Dassanayake, D.T.; Brownjohn, J.M.W.; D’Ayala, D. Wolf Rock lighthouse: Past developments and future survivability under wave loading. Philos. Trans. R. Soc. A Math. Phys. Eng. Sci. 2019, 377, 20190027. [Google Scholar] [CrossRef] [PubMed]
- Pappas, A.; D’Ayala, D.; Dassanayake, D.T.; Antonini, A.; Raby, A. Rocking of offshore lighthouses under extreme wave impacts: Limit analysis, analytic formulations and distinct element method. Eng. Struct. 2021, 228, 111534. [Google Scholar] [CrossRef]
- Khosroshahi, S.F.; Masina, M.; Antonini, A.; Ransley, E.; Brownjohn, J.M.W.; Dobson, P.; D’Ayala, D. A Multidisciplinary Computational Framework for Topology Optimisation of Offshore Helidecks. J. Mar. Sci. Eng. 2022, 10, 1180. [Google Scholar] [CrossRef]
- Galloway, D.D. Bulletin of British Earthquakes 2018; Report OR/19/002; UKRI: Edinburgh, Scotland, 2019. [Google Scholar]
- Antonini, A.; Raby, A.; Brownjohn, J.M.W.; Pappas, A.; D’Ayala, D. Survivability assessment of fastnet lighthouse. Coast. Eng. 2019, 150, 18–38. [Google Scholar] [CrossRef]
- Nord, T.S.; Øiseth, O.; Lourens, E.-M. Ice force identification on the Norströmsgrund lighthouse. Comput. Struct. 2016, 169, 24–39. [Google Scholar] [CrossRef]
- Guichard, J. La Jument, (n.d.). Available online: https://www.jean-guichard.com/en/photo/france/phares-de-france/la-jument-9 (accessed on 24 March 2024).
- Denarié, E.; Fady, N. Structural response of French offshore heritage lighthouses. Philos. Trans. R. Soc. A Math. Phys. Eng. Sci. 2019, 377, 20190011. [Google Scholar] [CrossRef] [PubMed]
- Filipot, J.-F.; Guimaraes, P.; Leckler, F.; Hortsmann, J.; Carrasco, R.; Leroy, E.; Fady, N.; Accensi, M.; Prevosto, M.; Duarte, R.; et al. La Jument lighthouse: A real-scale laboratory for the study of giant waves and their loading on marine structures. Philos. Trans. R. Soc. A Math. Phys. Eng. Sci. 2019, 377, 20190008. [Google Scholar] [CrossRef] [PubMed]
- Cheung, M.S.; Tadros, G.S.; Brown, T.; Dilger, W.H.; Ghali, A.; Lau, D.T. Field monitoring and research on performance of the Confederation Bridge. Can. J. Civ. Eng. 1997, 24, 951–962. [Google Scholar] [CrossRef]
Disclaimer/Publisher’s Note: The statements, opinions and data contained in all publications are solely those of the individual author(s) and contributor(s) and not of MDPI and/or the editor(s). MDPI and/or the editor(s) disclaim responsibility for any injury to people or property resulting from any ideas, methods, instructions or products referred to in the content. |
© 2024 by the authors. Licensee MDPI, Basel, Switzerland. This article is an open access article distributed under the terms and conditions of the Creative Commons Attribution (CC BY) license (https://creativecommons.org/licenses/by/4.0/).