Abstract
A sleeper, or more generally a “bearer”, moves vertically under a passing train load. The extent of this motion depends on the static and dynamic load of the train, the train speed, and the support conditions at the bearer and its neighbours. Excessive motion, typically from voiding see-sawing, low support stiffness or possibly excessive stiffness, or even too little stiffness, are all of interest to maintainers. Typically, problems arise around transition zones, switches and crossings, but plain track with poor support can also be a problem. Within the last decade, low-cost micro-electro-mechanical system (MEMS) accelerometers have been used to capture the time history of vertical motion for use in condition monitoring. Existing condition monitoring systems often overlook or sometimes even ignore the possibility of problematic data, which seem to be common in monitored locations. It is essential to understand whether such “bad” data require further attention. Three problematic sites are presented, focussing on examples where the acceleration was higher than expected or the computed displacement was not as expected. Potential causes include wheel defects, hammering of the ballast by a hanging bearer, or high acceleration at some structural resonant frequency. The present paper aims to show the challenges of using MEMS accelerometers to collect data for condition monitoring and offers insights into the sort of problematic data that may be collected from real sites.
1. Introduction
Some railway track infrastructure requires disproportionate maintenance expenditure. Examples include plain track with a history of poor track geometry, transition zones, such as from ballast to slab track, on to and off bridges, and over under-track crossings, and switches and crossings. Monitoring the track movement in such areas may provide information on the nature and cause of poor behaviour. From the track side, it is common to look at the vertical motion of railway bearers (sleepers) under load to look for support issues. This motion is affected by train axle loads, train speed, and properties of the ground beneath the ballast and any voids between the bearers and ballast. Defects such as “low track stiffness”, “variable track stiffness”, “variable total deflection”, “voiding”, and “inconsistent rail deflection” are mentioned in a paper from 2001 where a simple description of two-part stiffness for sleepers on ballast is proposed to represent the stiffness of a bearer on ballast [1]. The effect of voiding on the rate of deterioration of railway track is discussed in [2], where the voiding results in increased up and down movement at the bearers, but also has consequences over a wide range of frequencies and increases forces that significantly accelerate the rate of deterioration of the track geometry. In [3], modelling of the forces resulting from voiding in plain track were investigated with a multibody vehicle model running in a simulation on a track with a nonlinear support for voided sleepers. An increase in track forces was demonstrated, justifying the temporary speed restrictions imposed when voiding exceeds railway standards in the UK. Hence, the extent of vertical movement of bearers is often used as an indicator of track condition.
There have been attempts to model the behaviour of voided track with experimental validation using accelerometers on bearers, for example, in [4,5]. The results depend strongly on the distribution of the voiding under plain track. There have also been modelling efforts for switches and crossings [6,7], with and without defects, to understand the likely bearer acceleration and to learn to relate observations to faults. There is generally considerable disagreement between the acceleration predicted by a model and that observed on the real railway. Adjustments of the amount of voiding under each sleeper and the exact stiffness under each sleeper may allow an acceleration to be predicted for one bearer. The result depends on many factors and defines acceleration in a limited bandwidth. In a real railway, acceleration comes from other sources, such as damaged wheels, damaged rail, and unknown real ground conditions.
A simple means of recording the maximum downwards vertical movement of bearers from the track side is with purely mechanical devices that indicate the minimum gap between the bottom of a rail and the top of the ballast. A series of such indicators shows the maximum (downwards) vertical track movement at each bearer based on all trains that have passed. Continual recordings of the vertical displacement of bearers (when trains are passing) can be made with a linear variable differential transducer (LVDT) and a logging unit, either relative to the top of the ballast, or relative to a stake hammered through the ballast layer. These allow observation of how displacement varies in time, with train load or speed, or as weather conditions vary, providing more information from which problems might be identified compared to one-time mechanical void indicators. However, displacements obtained from LVDTs tend to be underestimated because the end of the LVDT in the ground also moves a little as a train load passes overhead [8].
Remote visual recording and processing can be used to reveal the bearer motion [9,10]. This method sees one bearer unless two or more targets can be in view at once. The camera needs to be mounted where it is largely free of vibrations as a train passes. The sampling rate (frame rate) is typically limited to 25 or 50 Hz for a webcam, or a few hundred frames per second for a more modern low-cost camera, so it has neither the bandwidth nor the resolution to see short duration events such as those caused by some wheel or rail defects. It is possible to use a high frame rate camera for a short time, but the equipment is rather expensive to leave by the track side and requires weather protection.
An increasingly common means of observing bearer vertical displacement is to use inertial sensors that can determine the displacement of a bearer without reference to another fixed point. A geophone previously typically used for monitoring ground movements during earthquakes was introduced for monitoring vertical (and lateral) motion of railway sleepers around 2005, and was first presented in 2007 with a comparison with remote visual recording [9]. The vertical velocity (the output of a geophone) of a bearer via a logging unit can be integrated with respect to time and additionally filtered to give vertical displacement. Used in groups, geophones have provided good results for displacement, and show the shape taken by the track as trains pass overhead if the train speed is high enough. Geophones are relatively expensive and as a mature technology have not significantly improved in the past two decades, apart from a small extension to the lower cut-off frequency with improvements in the internal electronic filter implementation. The cost has remained relatively high.
Bearer-mounted, vertically sensing MEMS accelerometers are increasingly being used instead of geophones as they have a much lower cost and provide as good a result, more-or-less, except for trains travelling slower than around 100 kph (60 mph) [11]. A wireless system using a MEMS accelerometer on sleepers, an LIS3LV02DL from STMicroelectronics (Geneva, Switzerland), was reported in 2014 [12]. This device is an early example of the use of a MEMS accelerometer on a railway sleeper (the accelerometer was still available to buy at the time of writing for around GBP 10 per unit but requires support electronics to provide a usable system). It is a three-axis unit with ±6 g range and up to 640 Hz bandwidth. The authors of [12] chose a sampling frequency of 160 Hz for 20 s duration, with the accelerometers being attached to sleepers “on the outer side of the track”, every 3 m along the track. Accelerations observed were only within the range of ±2.0 g, which is a rather low acceleration range, perhaps because of the limited sensor bandwidth or low train speed. The results for displacement (by double integration of acceleration samples) were “not good”, according to the authors. The authors blamed this on the sampling rate being too low to catch the higher-frequency acceleration. Double integration of the sensor noise and lack of a clear view of short-duration acceleration peaks led to unacceptable drift in displacement during the train passage. Some remediation was attempted by trying to force the displacement to return to zero for each individual wagon, leading to peak displacement of just under 5 mm in one example. Even so, there was a difference in vertical displacement for each wagon that was presented as genuine in the paper. It seems likely that those results were not reliable. Since that time, the use of MEMS accelerometers on bearers for obtaining vertical displacement has developed considerably. Progress with MEMS sensors was made in [13], where a comparison of geophones and MEMS accelerometers proved the latter to be excellent in the lab-based tests (where the acceleration was rather limited in range), and acceptable, but not as good as in the lab, on a railway sleeper.
Milne and colleagues [14] deployed MEMS accelerometers on over one hundred consecutive sleepers in one night and then moved the sensors overnight to extend the covered section, to investigate track stiffness via the harmonic content of the carriage passing frequency [13]. The peak-to-peak displacement (or the peak downwards motion from an estimated initial zero level) was also recorded. The accelerometers were ADXL345 devices (Analog Devices, Wilmington, MA, USA), sampling at up to 3200 Hz with a ±16 g range and the train speed was 55 to 65 ms−1 [15]. The use of accelerometers on transition zones is less well developed because the support stiffness is highly likely to vary significantly from one bearer to the next and there are other considerations, such as the existence of wheel impacts at crossings and possibly at switches. There is considerable work ongoing in this area, including reconstruction of vertical bearer displacements on switch and crossing panels in [6].
Double integration of acceleration to obtain displacement and the effects of accelerometer noise while at rest is discussed for a couple of early (2002) MEMS accelerometers in [16]. This paper shows that the displacement error as a result of accelerometer noise spectral density is in good agreement with the measurements of a stationary accelerometer. Taking data from a stationary accelerometer and feeding it through whatever processing is going to be used to give displacement will show the best results in calculating displacement error, in the presence of no acceleration. Ribeiro et al. present a very interesting analysis of double integration of acceleration to give displacement with the best accuracy [17], but ultimately the assumption of identically, independently distributed acceleration error with a normal distribution does not apply to accelerations gathered on railways. When an accelerometer moves, additional sources of error are introduced because of nonlinearity in the accelerometer (such as rectification error). These sources of error are much increased when the raw acceleration is large. Even though high acceleration is associated with high frequencies that are not of interest, the nonlinearity generates effects at low frequencies that are important in the movement estimation. Ultimately, nonlinearity associated with sensor saturation causes intolerable displacement errors and must be avoided. Hence, the accelerometer has to have a wide enough range to cover the observed acceleration on the bearer. Sources of high acceleration in the railway can be wheel defects, short-wavelength defects in the railhead, and bearers hitting the ballast as a void closes up. A wider acceleration range typically means that the sensor is not so accurate for the smaller frequency range of accelerations that are needed to obtain useful displacement results. A great deal of work has gone into reconstructing displacement at switches and crossings, based on a lot of data, in [6], although the assumption of zero displacement between bogies may be unrealistic or overly simplistic.
A simple place to start for automated processing of accelerometer data from railway sleepers is described in [13]. Double integration by Euler or trapezoidal integration followed by zero phase shift high-pass filtering is used to remove “drift”, ideally at one-half to one-third of the carriage passing frequency (the train speed divided by the carriage length). Low-pass filtering may be added to show displacement only up to 20 Hz (the 10th harmonic of the carriage passing frequency [13]), although after double integration this should not make much practical difference. An important branch of this work is looking for track stiffness without knowing the train loading [18,19]. Another paper on integration of acceleration for railway applications is [20], which also shows spectra of the accelerations and explains the meaning of the spectral peaks.
In the present study, data were collected from vertically sensing accelerometers at three railway locations: the switch area (see Section 2) and crossing area (see Section 3) of a switch and fixed crossing on a high-speed line in the UK; and around the swing-nose crossing of another switch on another high-speed line (see Section 4). Some of these sites have experienced problems with damage occurring faster than expected, leading to expensive remedial work that did not permanently resolve the problem. The first instrumented site has a voiding problem under a switch. Based on the one-sided nature of the accelerations, it appears that bearers are hitting the ballast with considerable momentum, leading to a rapid deceleration on impact and presumably accompanied by damage to the underside of the bearers and to the ballast. The associated crossing has smaller vertical movement than the switch but the accelerations for faster trains become very high with positive and negative spikes. The third site is very stiff and has caused problems by damaging attached bearer-mounted components that form part of the swing-nose crossing actuator. Strange behaviour has been noted from accelerometer results for particular train speeds and types—see Section 4.2. The emphasis of this paper is on the reality of the accelerations found in the field at “awkward” sites and gives insights into requirements for condition monitoring with bearer acceleration for railway switches and crossings. Examples from “awkward” situations show problems with reconstruction of vertical displacement, the diversity of results from different sensor locations, and information on the sensor range required.
2. Site 1: High-Speed Switch
A set of points on a high-speed line in the UK were instrumented around the switch (and crossing—see Section 3) with bearer-mounted geophones and accelerometers, and rail-mounted strain gauges [21]. Figure 1 shows the locations of vertically sensing, bearer-mounted accelerometers (marked with stars) from which the data used in this section (and the next) were collected. The bearer-mounted accelerometers were two types of MEMS sensor, a voltage-output and a current-output type. The voltage-output type has a range of about ±350 ms−2 and the current-output type has a range of about ±200 ms−2. These sensors work down to DC without phase shift or gain variations and cost a few hundred GBP each. They contain MEMS accelerometer integrated circuits internally with an analogue output of voltage or current created. The details of the MEMS sensing element inside each sensor are unknown, but a sensor could be made with a GBP 5 part or a GBP 100 part without significantly changing the cost of the unit as a whole. However, the difference in terms of displacement from acceleration when used on a railway bearer will likely be considerable.
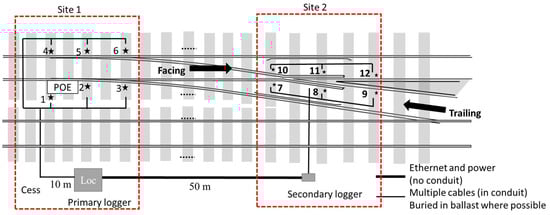
Figure 1.
Sensor placement layout for sites 1 and 2.
Current-output accelerometers (sensors 1, 2, 3 and 7, 8, 9) were located on the point-operating equipment (POE) side, and the voltage-output accelerometers (sensors 4, 5, 6 and 10, 11, 12) were on the other side. The accelerometers around the switch are outside the rails, and the ones near the crossing are close to the crossing. For comparison, geophones were placed on both sides adjacent to each accelerometer and additionally on the in-between bearers, but the geophone results are not discussed in this paper. The bearers are concrete on ballast on a normal subgrade. The railway traffic consisted of high-speed (54 ms−1, 125 mph, 200 kph) passenger trains with a few trains running at about half that speed, mostly freight, travelling in the opposite direction. Further details of the site are available in another paper [21].
Figure 2 shows the acceleration and reconstructed (double integrated and 0.5 Hz high-pass filtered) vertical displacement for three bearers for a slow train (63 mph, 102 kph). The upper row is close to the switch toe (sensor 4, marked in the top right corner of each graph) and the middle and lower rows are sensors 5 and 6, moving along the switch blade. Hence the bearers with accelerometers are about 1.2 m apart along the track. The side of the switch away from the point machine moves significantly more in the vertical direction than the side near the point machine. As this paper concerns problems with larger accelerations, the side of the switch away from the point machine is used for examples of acceleration and displacement. Nine carriages with similar bogie spacings and loading pass by, based on the bogie and wheelset pattern.
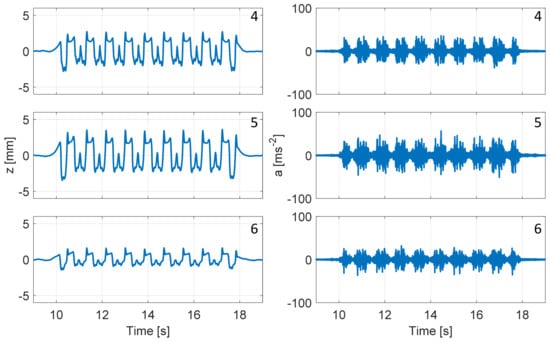
Figure 2.
Train over switch (63 mph, 102 kph): reconstructed vertical displacement (left) and acceleration (right).
The displacement reconstructions on the left-hand side of the figure show that the middle bearer moves vertically more than the earlier bearer, and much more than the later bearer. Reconstruction of vertical motion was confirmed by comparison with the geophone data. The bearer vertical displacement under load naturally tends to be downwards rather than upwards so high-pass filtering inevitably lifts the displacement over the majority of the train passage. The displacement is, then, more accurately described as a relative movement rather than an absolute one—the peak-to-peak motion over one of the more central carriages gives a fair idea of the bearer movement range. The root mean square (RMS) accelerations look to follow a similar pattern, being greatest for the middle bearer and smallest for the first bearer (the top row). The maximum acceleration of 56 ms−2 occurs for the central bearer, but generally the acceleration is within ±50 ms−2.
Attempts to set an absolute zero displacement level for the central carriages based on an estimation of the zero level can be found in [6,13], but for the purposes of this paper, the peak-to-peak movement near the middle of a train is taken as a measure of vertical movement, so the absolute zero displacement is not important. Uplift, where a bearer rises above its rest position, is believed to be a genuine effect based on acceleration and geophone data.
The frequency content of the displacement is mainly below 10 times the carriage passing frequency, i.e., about 32 Hz, depending on the train speed [18]. In contrast, the acceleration mostly has a higher frequency, varying in detail with each carriage. The double-integration relationship between acceleration and displacement naturally leads to a split in the dominant frequency content of displacement compared to acceleration.
Figure 3 shows a slightly slower but otherwise similar train, with a different acceleration. Note the change in acceleration scale.
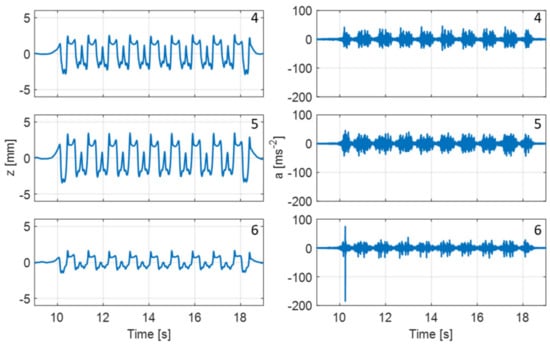
Figure 3.
Train over switch at 58 mph (94 kph): probable wheelflat; displacement (left), acceleration (right).
The acceleration at the third bearer shows a large negative peak with some positive acceleration on either side as the net velocity and displacement have to integrate to zero. This is coincident with the second wheelset of the leading bogie being above the bearer with sensor 6, and is most likely a wheelflat. This impulsive acceleration does not appear at the other bearers. The same wheelset produces a similarly coincident high acceleration for one of the bearers at the crossing (shown in the next section), so it is unlikely to be data error. The peak (negative) acceleration is −185 ms−2. A wheelflat is a typical source of short-duration high acceleration with little or no corresponding displacement. The peak acceleration for the whole train passage is not, in this case, a good indication of the condition of the switch and its support.
Figure 4 shows a faster train (110 mph, 177 kph), but out of a cluster of higher-speed train passages, this one is the slowest. Again, there are nine carriages with the same train type. Note the change in scale on the acceleration axes and that the accelerometers saturate at ±350 ms−2.
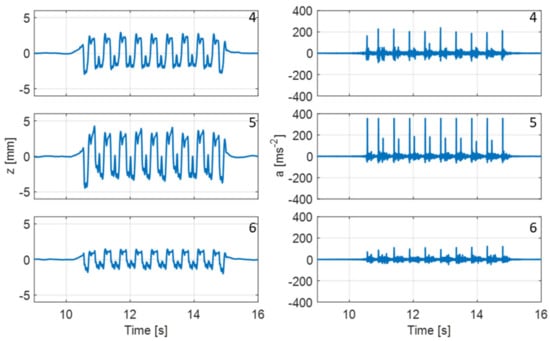
Figure 4.
Train over switch at 110 mph (177 kph): displacement (left) and acceleration (right).
Again, the displacements are largest for the middle bearer, and moderate and small for the other two. The displacements are a little larger than those seen for the previously shown train that was travelling at two-thirds the speed. The middle bearer displacements look a little distorted in that there is a downwards trend in the displacement for four consecutive wheelsets on closely spaced bogies.
The acceleration in the middle bearer reaches saturation, but a close examination of the acceleration data samples around the high values suggests that the cut-off acceleration is small but leads to the visible distortion in the displacement result. The peak-to-peak displacement estimated from a single carriage will probably be overestimated because of the form of distortion in the displacement estimate. The acceleration in the middle bearer shows impulsive positive peaks corresponding to the leading wheelset of a group of four close wheelsets and a lower impulsive positive spike for the third wheelset in the group of four. The other two bearers show a spike in acceleration for the leading wheelset of the group of four and a few spikes for the third wheelset. The acceleration outside of the impulsive parts is rather modest, only just going outside of ±50 ms−2, which is similar to the train travelling at two thirds of the speed.
A close examination of the acceleration, velocity, and displacement is consistent with the positive acceleration corresponding to the bearer hitting the ballast. For the middle bearer, the bearer hits the ballast but between two closely spaced bogies there is sufficient recovery that the bearer hits the ballast again but with less impact. The position of the impacts for the three bearers are not coincident (in time), so the spikes are not one bearer seeing the impact from a neighbouring bearer. Instead, each bearer has its own impact with the ballast. The timing also shows that the impacts cannot all be coincident with a wheelset being directly above the bearer at the time of the impact, leading to the conclusion that the impact of the middle bearer on ballast occurs just before the wheelset passes overhead. In other words, the gap between bearer and ballast closes up before the wheelset is over the bearer and the downwards motion continues after the impact.
Figure 5 shows the results from the fastest fast train, travelling at 126 mph (203 kph). Note that this train has eleven cars, but the carriages are essentially the same as for the nine-car trains.
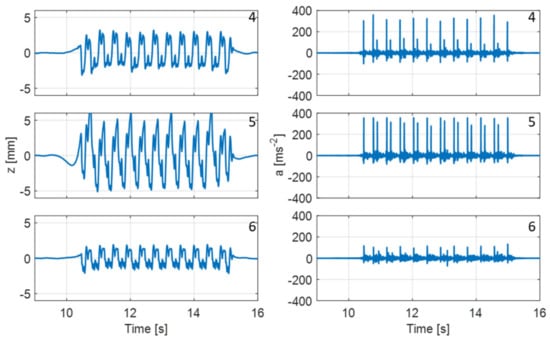
Figure 5.
Train over switch at 126 mph (203 kph): displacement (left) and acceleration (right).
The displacement from the middle bearer is highly distorted. The peak-to-peak motion is excessive compared to what is likely to be happening. The first bearer (top row) shows some minor distortion over the whole trace but for each carriage is probably usable. The fifth bearer (bottom row) displacement is not a problem. The train is running 20% faster than the previous one.
Once more, the impulsive positive acceleration peaks (are believed to) correspond to bearers hitting the ballast and the downwards motion being very suddenly arrested, but not entirely stopped. The peak acceleration corresponding to a leading wheelset (of a closely spaced set of four) is “losing” a lot of acceleration because of the saturation of sensor 6 (based on a close look at the individual data points and imagining what is missing). The second peaks do not saturate the accelerometer on any bearer. The effect on the displacement is a severe distortion leading to an overestimation of the peak-to-peak motion. Again, the acceleration between impulsive accelerations is largely below 50 ms−2, as for the other slower trains.
In summary, at the far side of the switch there are positive accelerations on the bearers corresponding to the approach of a leading wheelset of a bogie closing a void, and a second positive acceleration rising with increasing train speed increases, corresponding to the leading wheelset of a closely following bogie re-closing the void. The bearer hits the ballast with a considerable force, based on the mass of a bearer being slowed down with an acceleration exceeding 350 ms−2. Most of the acceleration has a modest ±50 ms−2 range, outside of a few impulsive accelerations. The place where this behaviour occurs is the sort of location where observing bearer displacement is important, but the fact that closing the void can cause a very high positive acceleration on a bearer requires the use of an accelerometer with a rather larger range than is necessary for the majority of the acceleration. An accelerometer with a larger range implies noisier displacement results as the normal accelerations use a relatively small part of the accelerometer range. However, by observing the acceleration itself, one can see impacts that are likely to be damaging to the bearer and the ballast, which is itself useful. The raw acceleration always needs to be checked as sensor saturation is probably going to lead to incorrect peak-to-peak displacements.
The high (but negative) acceleration spike is associated with a wheelflat on the second wheelset of one passing train. This wheelflat happens to land close to one instrumented bearer, resulting in high acceleration. It is impossible to know how high this acceleration might have gone if the wheelflat had directly hit over a bearer, but the acceleration found is of concern. Note that the train speed is about half of the line speed for this train, so it is assumed that the acceleration at the bearer would be significantly higher if the train had been travelling at the line speed. As the acceleration as measured falls below the saturation level, the reconstruction of vertical displacement is not affected in this case.
3. Site 2: High-Speed Crossing
A high-speed crossing was instrumented in a similar way to the switch in the previous section [21]. In fact, the switch and crossing form a pair, so data are available from the switch and crossing for the same trains. Five consecutive bearers were instrumented with geophones, the middle bearer being approximately under the load transition point of the crossing. The accelerometers were placed on bearers 1, 3, and 5. The accelerometers were located just to one side of the crossing metalwork, only a few hundred millimetres laterally from the track centreline, as shown in Figure 1. The results are similar from two sides of the bearer and only results from sensors 10, 11, and 12 are shown here (see Figure 1).
Figure 6 shows the vertical acceleration and displacement at the crossing for a nine-car train travelling at 63 mph (102 kph). This train is the same one that provided data at the switch in Figure 2. The middle row shows data from the middle bearer. The top and bottom rows correspond to bearers about 1.2 m in either direction. The slower trains pass over the bearers from the bottom row towards the top row. Faster trains go in the other direction.
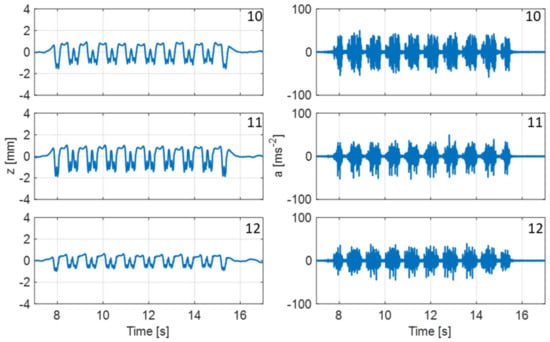
Figure 6.
Train over crossing at 63 mph (102 kph): reconstructed vertical displacement (left) and raw acceleration (right).
Compared to a limit of around 50 ms−2 for the switch, the acceleration at the crossing is slightly higher, but remaining below 60 ms−2. The acceleration for the middle bearer is not dissimilar to that seen previously at the switch, but the resulting reconstructed displacement is smaller. The accelerations for the first and last bearers are also larger than the corresponding accelerations at the switch, but the displacements are smaller.
The carriage passing frequency is around 1.18 Hz with the high-pass filtering cut-off set at 1.0 Hz. This is a considerably tighter filter than recommended in the introduction, but to avoid introducing phase errors, the high-pass filter is based on a brick wall filter implemented in the frequency domain, so no phase shift or change in gain is introduced at the carriage passing frequency. This train speed is pretty much at the lower limit of where the displacement can be obtained from the accelerometers.
Figure 7 shows the crossing data from the same slow train (58 mph, 94 kph) that showed a wheelflat at the switch in the previous section.
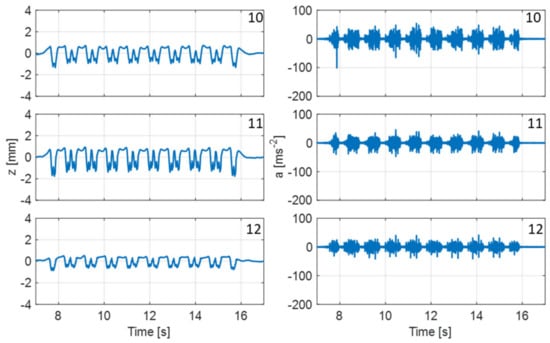
Figure 7.
Train over the crossing at 58 mph (94 kph): slower train with wheelflat on second wheelset.
The same wheelflat can be identified in the top row of bearer acceleration. It occurs just after the second wheelset has passed the first bearer. The negative acceleration is not so marked as it was at the switch and does not have much positive acceleration on either side. The interpretation is that the wheelflat hit the rail some tens of cm from the first bearer and this was felt less severely at the bearer than was the case for the switch. The acceleration from the wheelflat is well within the accelerometer range of ±350 ms−2, being −100 ms−2. The displacement reconstructions are working well in this case, despite the wheelflat. The displacements are similar to those from the previous similar-speed train while the accelerations are roughly similar (there is a change of acceleration scale) apart from the wheelflat.
Figure 8 shows the results from the slowest of the faster trains (110 mph, 177 kph) at the crossing.
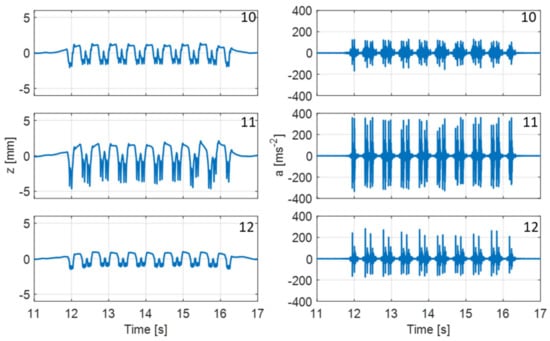
Figure 8.
Train over crossing at 110 mph (177 kph): reconstructed vertical displacement (left) and raw acceleration (right).
The slowest fast train (around 49 ms−1) causes minor saturation (not much peak missing) of the accelerometer at the middle bearer, i.e., the one closest to the load transfer point on the crossing. However, the displacement reconstruction is almost credible. The displacement in places is not credible across all carriage lengths, so the peak-to-peak displacement may be overestimated based on single carriages. The deep notches aligned with each wheelset are likely to be true even though they are not confirmed by geophone data as the geophones were badly saturated. Saturation of the acceleration is not capable of introducing the deep notches in the displacement, only a slower distortion with a wavelength similar to the carriage length. Based on the available data, the best explanation is that the crossing is oscillating around a fixed point located some distance from the bearer. This oscillation causes the middle bearer to experience rapid vertical movements in response to the passing wheelset loads. However, this is not seen for slower trains and there are no data for trains with intermediate speeds, so what is happening remains an open question. The increase in peak-to-peak displacement caused by the deep notches should be interpreted differently from a large peak-to-peak displacement caused by soft support, which would happen over a longer wavelength. Note that while the displacements are relatively smaller at the crossing than at the switch, the accelerations are significantly larger. Given that there is a load transition at the crossing, this may not be surprising. It is important for choosing the range of the accelerometer needed at a crossing.
Figure 9 shows a different train travelling at the same speed (110 mph) as the previous one (lower speed of cluster of high-speed trains) and with an identical train type.
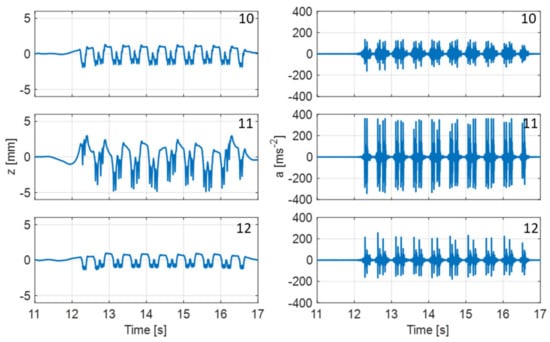
Figure 9.
Train over crossing at 110 mph (177 kph) (essentially same configuration as Figure 8 but different displacement result).
The accelerations are similar to those from the other train but the displacement reconstruction for the middle bearer is considerably worse than before. Given that the accelerometer is saturated, trouble should be expected, but the peak-to-peak displacement over even a single carriage is now larger. Therefore, checking the raw acceleration data for saturation is critical before displacement peak-to-peak is estimated. Note that there is an asymmetry in the accelerometer saturation as the sensor sees gravity, so in terms of displacement reconstruction it really saturates at +350 ms−2 and 370 ms−2. This asymmetry in saturation may contribute to displacement error by introducing a bias into the velocity and then shaping the displacement in a particular way.
Figure 10 shows the fastest train (126 mph, 180 kph) over the crossing. The accelerations for the first (top row) and fifth (bottom row) bearers still give usable displacement results but show large impulsive accelerations, especially the lower row. The mild saturation (not much lost area) at one place on bearer 3 does not greatly affect the displacement results, similar to the way in which a wheelflat might not cause a problem if the saturation does not cause too much loss of area. The middle bearer has extensive acceleration saturation, resulting in unusable displacement results. Measuring the peak-to-peak movement here is grossly overestimated. The displacement scale has been maintained as the excursions beyond the visible limits are of no value.
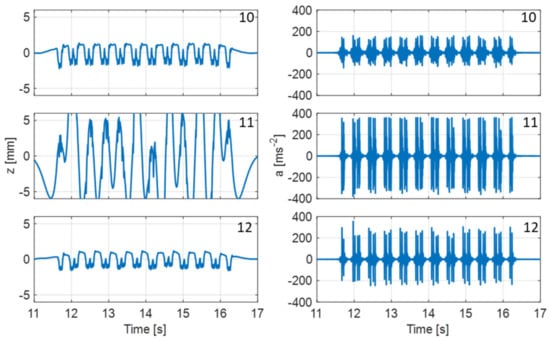
Figure 10.
Fastest train at the crossing: displacement (left) and acceleration (right).
In summary, the high-frequency components of the accelerations at the crossing are worse than at the switch. This might be expected as the crossing has a load transition point that is likely more of a gap than at the switch toe. However, the remaining acceleration is only a little larger (in terms of RMS). Only the middle bearer is a problem, but this is the most important bearer as it is nearest to the likely transition point from wing to nose or vice versa. It is not obvious if the higher acceleration is linked to the stiffness of the crossing support. The crossing behaviour is essentially not understood even from accelerometer and geophone data over five bearers.
The next section shows results from a third site—a troublesome swing-nose crossing on ballast within a concrete tray in a tunnel. This site has a higher line speed than sites 1 and 2 and a stiffer support.
4. Site 3: Swing-Nose Crossing
The third site is a swing-nose crossing with concrete bearers on a meagre layer of ballast laid on a concrete trough. The stiffness is rather high and the vertical bearer movements relatively small, of the order of millimetres, but the site has problems with excessive movement or force that damages components of the swing-nose crossing drive mounting. The line speed for the fast line and slow line are 230 kph (143 mph) and 100 kph (62 mph), respectively. Figure 11 shows a photograph of the location. The swing-nose crossing is actuated at two positions by one machine. The swing-nose crossing is used to reduce the load transfer forces by closing the gap found in a fixed crossing.
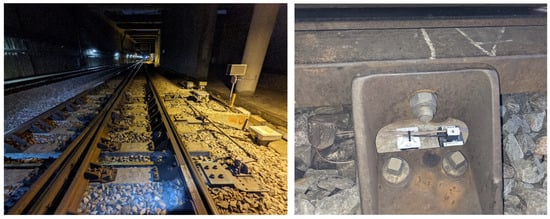
Figure 11.
Site 3: swing-nose crossing and example of the low-cost accelerometer installed on the bearers.
A plan view showing the location of the accelerometers (labelled 1 to 10) on the bearers is shown in Figure 12. Long bearers are shared by both routes. Sensors 1 to 8 are located on the bearers close to the rail seats on the fast line, while sensors 9 and 10 are placed close to the swing-nose crossing actuating machine on the slow line (placed there because of reported problems with the machine mounting). Class 395 and 373/4 trains form the majority of the traffic over this crossing.
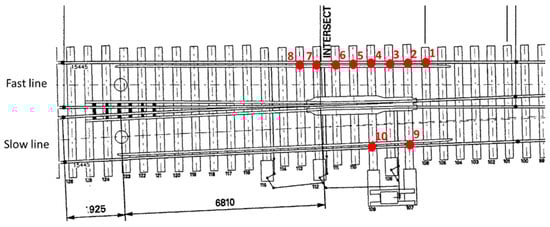
Figure 12.
Accelerometer layout around the swing-nose crossing.
Following the saturation problems at sites 1 and 2, the MEMS accelerometers used on site 3 are different. Here, the measuring range is larger at ±50 g and the bandwidth is 10 kHz. In contrast to the short-term data collection for sites 1 and 2, site 3 was instrumented with a view to collecting data over the longer term.
4.1. Results for Vertical Bearer Displacement and Acceleration
The results shown in this paper are based on data from sensors 5, 6, and 9. The remaining sensors show smaller movements and/or accelerations that are not important for looking at the use of MEMS accelerometers. Sensor locations 5 and 6 are close to the region of wheel load transfer for the slow and fast lines where the largest sleeper displacements as well as the largest accelerations were found. The fact that the maximum displacements and accelerations occur near the load transition region is not a surprise and this is probably already assumed to define the location for the placement of a single MEMS accelerometer on a bearer at a crossing. Sensor 9 was chosen because it shows an interesting resonance phenomenon that will be discussed in Section 4.2. Results are shown for a slow train (49 mph, 79 kph) with and without faults, and for a fast train (123 mph, 198 kph), classes 395 and 373/4.
Figure 13 shows reconstructed displacements and the raw accelerations at sensor locations 5, 6, and 9 (top to bottom of figure) for a train travelling at 49 mph (79 kph) on the slow route.
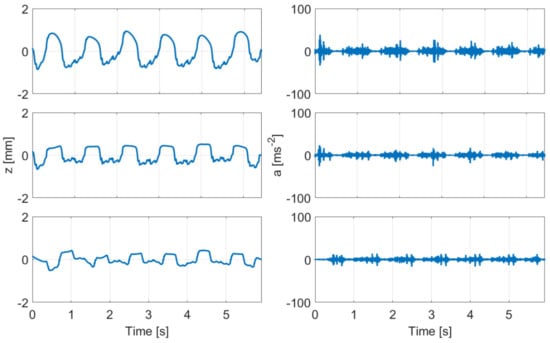
Figure 13.
Train on slow route (49 mph, 79 kph): reconstructed vertical displacement (left) and raw acceleration (right).
The peak-to-peak displacements are around 1.5, 1, and 0.5 mm at sensor locations 5, 6, and 9, respectively, and the acceleration is within the range of ±30 ms−2. The swing-nose crossing appears to be fulfilling its task of reducing transition load, compared to the more traditional crossing at site 2. Compared to similar speed trains from sites 1 and 2, the displacements and the accelerations are significantly smaller. The displacement reconstruction for sensor 5 (top row) does not look “right”—it looks like a phase error near the carriage passing frequency. Although the brick-wall filter cut-off frequency is close to the carriage passing frequency, the results are consistent for similar-speed trains and identical processing of the other sensors gives a more usual displacement pattern for their bearers. The results from sensor 5 for faster trains look more usual, so it looks as though sensor 5 may have a low frequency problem.
Figure 14 shows the results, using the same presentation pattern, for a train of the same type and speed as Figure 13, but the acceleration results are significantly different.
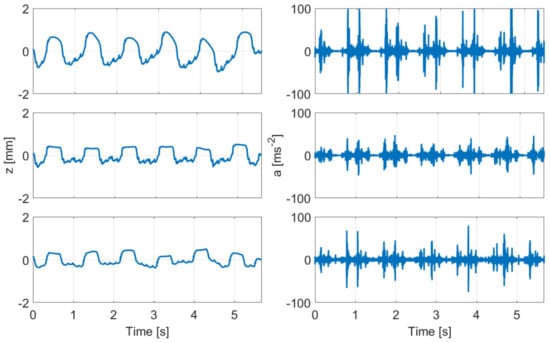
Figure 14.
Faulty train on slow route (49 mph, 79 kph): reconstructed vertical displacement (left) and raw acceleration (right).
The displacements are similar to those found in Figure 13, but much higher accelerations are observed corresponding to some wheelsets, especially at sensor location 5 (top row), where the acceleration just exceeds 100 ms−2, which is much more than that seen for the previous train with the same speed. It still remains well within the accelerometer range. This case has been labelled a “faulty train” on the grounds that other trains with a similar speed did not show this behaviour. However, it is also possible that the swing-nose crossing did not close fully, or some other cause independent of the train could be responsible for the increased accelerations.
Figure 15 shows results for a train speed of 123 mph (198 kph) for a class 395 train. Note the change in scale for the acceleration.
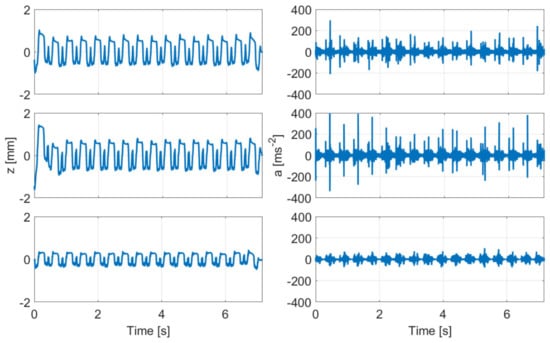
Figure 15.
Class 374 on a fast route (123 mph, 198 kph): reconstructed vertical displacement (left) and raw acceleration (right).
The higher carriage passing frequency (around 2.3 Hz) is partially responsible for the improvement in the appearance of the displacement. The peak-to-peak vertical bearer displacements at sensor locations 5 and 6 are around 1.5 mm. The acceleration is within ±400 ms−2, which is within the accelerometer range of ±500 ms−2. The acceleration is mainly larger impulses at the wheelsets, presumably as the load transfer occurs, for sensors 5 and 6. Notice that the accelerations for each wheelset are wide-ranging, a feature not unique to this particular train. The reason for the inhomogeneity is not known, but is perhaps indicating that the interaction between wheelsets and crossing includes a significant random element. The acceleration at sensor 9, which is nearer the swing-nose crossing machine, is relatively small.
Figure 16 shows the results for a train travelling at the same speed (123 mph, 198 kph), but this time for a class 395 train. The time scale is different because this train has fewer carriages than the previous one and the duration of the train passage is shorter.
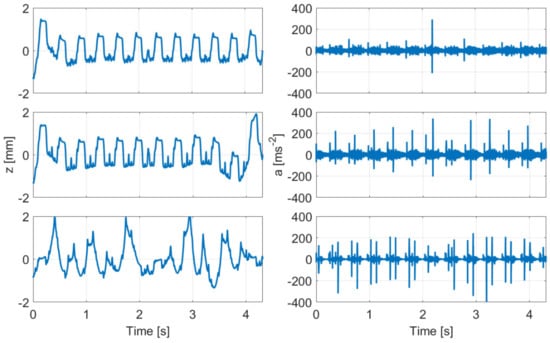
Figure 16.
Class 395 on a fast route (123 mph, 198 kph): reconstructed vertical displacement (left) and raw acceleration (right).
The peak-to-peak displacements at sensors 5 and 6 for are little changed, at around 1.5 mm. The accelerations at these two sensors are a little less stochastic, but of a similar character to the class 374 result. However, the sensor 9 displacements are not as expected and the accelerations contain much larger impulses than before. The peak-to-peak motion is much higher than for the class 374 train and it does not follow the carriage-repeating pattern typically found for a bearer. Instead, there is an apparently random pattern or motion with small dips corresponding to the wheelsets, but with the bearer at sensor 9 tending to rise when the other sensor locations are falling. Bearing in mind that the fast route is furthest away from sensor 9, this suggests that there is a lateral seesaw effect at the crossing such that the machine where the bearer is mounted is being thrown up into the air (only a few mm) as closely spaced bogies pass by, then gets dropped down again in-between widely spaced bogies (underneath each carriage). There have been problems with the switch machine mounting near sensor 9, and this behaviour may be linked to that problem. This behaviour is only found at particular train speeds, as will be illustrated in the next subsection.
4.2. Effects of Train Type and Speed
Displacement and acceleration result from sensor 9, where strange inverted displacement is found only at certain train speeds. In this subsection, the data (of which there is a large quantity for site 3) are examined more closely. Figure 17 shows the results at sensor 9 from a class 374 train with three different speeds.
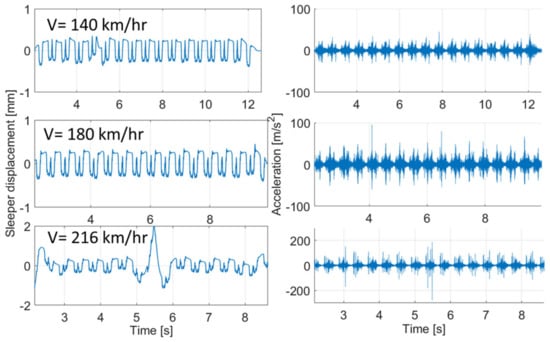
Figure 17.
Sensor 9 results for a class 374 train with three different speeds: bearer displacements (left); accelerations (right).
The bearer vertical acceleration increases with increasing train speed. Similar displacements are found for train speeds of 87 mph (140 kph) and 112 mph (180 kph). However, a significant large displacement can be seen just in the middle of the class 374 train when the train speed is 216 kph. This displacement is believed to be a genuine displacement as the acceleration is far from saturation and there is consistency between the results for the same class of train travelling at a similar speed. Something happens in the middle of the train. Specifically, the sensor 9 location rises up near the middle of the train. The falls on either side of this rise are actually the result of the processing filters trying to restore the zero level (the high-pass filtering) and are probably not true. Instead, the rise is probably in reality even larger while the negative motion is a result of the processing. This centre effect is similar to the sort of shapes seen previously in Figure 16, where this happened throughout the train.
Figure 18 shows the strange displacement phenomenon seen at sensor 9 for class 395 trains when the speed is 200 kph and the impulsive high acceleration spikes.
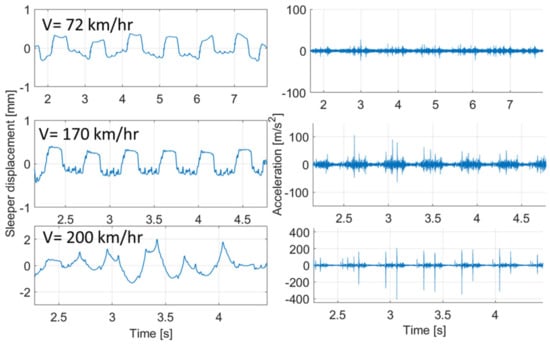
Figure 18.
Sensor 9 results for class 395 train with three different speeds: bearer displacements (left); accelerations (right).
The acceleration spikes do not generate the displacement result on their own. They are associated with the rapid change in direction at the peaks of the displacement. These accelerations can still be linked to wheelsets passing, but the sensor 9 location responds sometimes by moving in the opposite direction to the fast route (opposite) side of the crossing.
Figure 19 shows the peak-to-peak displacements, maximum accelerations, and RMS acceleration, at sensor 9 against different speeds for class 395 and 374 trains.
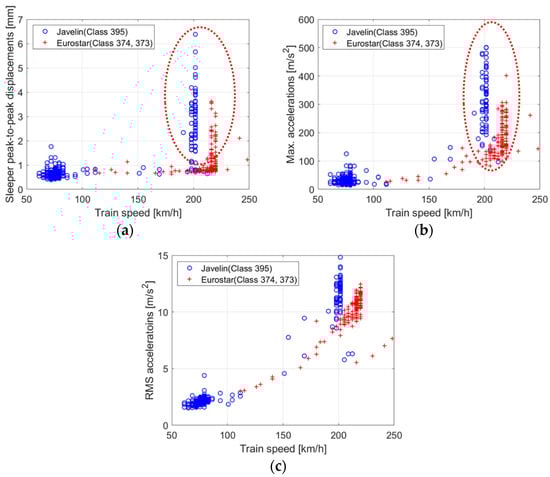
Figure 19.
Bearer results from sensor 9: (a) peak-to-peak displacement; (b) maximum acceleration; (c) RMS acceleration.
Unusually high displacements are found at a narrow range of speeds for each train class for peak-to-peak displacement and for maximum accelerations, highlighted with a red dashed ellipse. The ratio of the speeds where the displacement suddenly becomes larger is the same as the difference in length of the two cars. This is most likely a resonance phenomenon that only occurs in certain vehicle/track interaction combinations. The RMS accelerations tend to increase more linearly with speed in contrast to the behaviour of the peak-to-peak displacements and maximum accelerations. The peak-to-peak displacement number for sensor 9 is not a good indicator of the behaviour at the sensor 9 location. The overall displacement behaviour needs to be observed. Interpretation of peak acceleration or peak-to-peak displacement requires making an assumption that the displacement trace will be of the “normal” form. Abnormal displacements can also be seen, and may indicate a problem.
In conclusion, site 3 has smaller vertical bearer displacements and lower accelerations for slower trains compared to sites 1 and 2, but for higher speed trains the acceleration increases significantly. The RMS acceleration increases with train speed, but the displacement increases suddenly at a very narrow range of speeds, which is different for each class of train. The acceleration rises with train speed but also shows a sudden increase at a particular range of train speeds for each class of train. Beyond this speed, the displacement and accelerations return to lower levels. This behaviour has not been seen elsewhere, as far as the authors know, and is important. It means that the choice of accelerometer can be dictated at a certain site by particular behaviour that was not predicted in advance.
5. Discussion
In terms of reconstructed displacement, it is not surprising that saturation in an accelerometer degrades the displacement results, with significant, and even mild, saturation rendering the displacement results unusable. A single saturation event linked to a wheelflat may not cause too much disturbance, but any disturbance caused will be dominated by low-frequency error because of the reconstruction method. It will not introduce high-frequency disturbance into the displacement estimates, but just errors, particularly around the high-pass filter cut-off frequency, which inevitably should be at longer wavelengths than the carriage length. A lower high-pass filter cut-off frequency is required in order not to lose the information. Sometimes, when the train speed is a little too low, the shape of displacement becomes odd, so an assumption about repeated shapes for each carriage is no longer true and the high-pass filtering is taking out some information. Because of drift there is no choice. As a result, the reconstructed displacement becomes unreliable when the running train speed is too low, which, at the moment, is less than 60 kph.
On the other hand, accelerometer nonlinearity becomes a serious problem for displacement when the acceleration is large. Accelerations usually increase when the train speed increases. Therefore, the reconstructed displacement also suffers if the train speed is too high. A suggested way forwards for future research is to mount a lower-range accelerometer on a resilient mount so that the needed sensor range is reduced. This improves observation of the acceleration associated with displacement but the high acceleration is isolated from the accelerometer and does not disrupt the displacement reconstruction. Whether a mount that is sufficiently linear can be found, or symmetric nonlinearity can be tolerated, is not known.
In terms of choice of accelerometer and data acquisition set up, it has been found that both the measurement range and measured bandwidth are increasing over time. This may be due to increasing train speed, increasing axle load, more frequent passing trains, and the demand to observe more complex vehicle/track interaction dynamics measurements, which introduces more high-frequency content to the signal, for example, to accommodate S&Cs. As the train speed increases, there is an increase in acceleration—this is not surprising. However, the increase can be sudden and dramatic. A typical track model shows increasing vertical acceleration and displacement with increasing train speed, rising dramatically as the critical speed (based on the support stiffness) is reached. In Section 4, even more dramatic increases in acceleration and displacement with some unexplained resonant effects are found.
The typical MEMS accelerometer range for plain track is ±160 ms−2; however, the measurement ranges are different for sites 1, 2, and 3, even though the highest train speeds at the three sites are similar, i.e., around 200 kph. Based on the results from sites 1 and 2, the measurement range was ±360 ms−2 and for site 3 this was increased to ±500 ms−2, which was still not always enough. This may be due to different levels of track support stiffness or different types of S&C. Site 3 is a swing-nose crossing with better track support stiffness compared to sites 1 and 2, perhaps with the stiffness causing higher accelerations. Therefore, the choice of accelerometer sensor range is not only affected by train speed, but also varies from site to site. Specifying accelerometers is difficult and challenging.
In terms of the number of sensors, the use of a single accelerometer for condition monitoring at a crossing is becoming common. It is clearly necessary to place this single accelerometer on the bearer nearest to the load transfer location. If the crossing has a rolling motion (left up, right down and vice versa) in addition to a vertical motion, a single accelerometer will not capture this. Based on the results from sensor 9 on site 3 (resonant phenomenon), and also based on a previous result from site 1, where the switch undergoes different vertical motions on the near and far sides [21], it seems that using a single sensor risks losing important information at a switch or crossing. Furthermore, based on the results from site 3, the movement close to a point machine as a train passes is a separate point of failure that has to be investigated with its own sensor. It is also suggested to place sensors on both sides of the switch because of significant differences found in the measurement [21]. Therefore, use of a single accelerometer has high risk of losing important information and my not be appropriate for condition monitoring purposes.
In terms of the practical meanings for condition monitoring, conversion of acceleration data directly to peak-to-peak information for condition monitoring of railway switches and crossings means that saturation in the original accelerations will be missed. Furthermore, high impacts between ballast and bearer (a potential indication of voiding and a cause of ballast and bearer damage) can only be observed in accelerations and cannot be found in displacements. High impulsive accelerations in an upwards direction may indicate a bearer hitting the ballast (as suspected in Section 2); symmetric high-level bearer accelerations may indicate a significant issue at a crossing but without much effect on the displacement.
On the other hand, high acceleration does not always mean a bad track condition. Accelerations from site 3 are larger than those from sites 1 and 2, but site 3 has better track support stiffness and the displacements from site 3 are smaller than those at sites 1 and 2. Again, higher acceleration does not always give larger displacement; for example, site 2 has higher acceleration than site 1, but the displacements from site 2 are smaller than those from site 1. Furthermore, it is not recommended to reduce data to a single number such as peak-to-peak displacement within a bogie length, or an RMS value. Without looking at the original data, some important information may be lost such as the resonant effect seen at site 3.
6. Conclusions
Reconstructed displacements obtained from bearer-mounted MEMS accelerometers have been discussed for three problematic S&C sites that have similar train speeds and types passing. In general, currently-available MEMS accelerometers (lower noise density) can be used to reconstruct vertical displacement at speeds down to around 60 kph. Displacement reconstruction for slow trains and low accelerations is limited by noise in the accelerometer and it is best to use the lowest-range accelerometer possible. Fast trains need higher-range accelerometers, which can generate good displacement good results.
However, when acceleration is out of range, it distorts the reconstructed displacement because of saturation. Significantly out of range acceleration makes the reconstructed displacement unusable. MEMS accelerometers regularly recorded accelerations exceeding the saturation limit of 350 ms−2 at the first two sites and even exceeding 500 ms−2 occasionally at the third test site. The greater the range of the accelerometer, the greater the noise tends to be, limiting the lowest speed of train for which displacement reconstruction is viable. An accelerometer needs to remain linear over a wide dynamic range and over a wide range of frequencies—any proposed sensor needs to be tested in the field. Testing with an expected displacement pattern on a shaker table is not enough. A sensor that performs well in one context, such as on plain track, might be un-suitable in another context where accelerations are higher.
In practice, high accelerations occur from time to time, or in certain locations, with wheelflats and with bearer support problems. The behaviour in the presence of short-duration near-maximum accelerations is important for obtaining displacement. The raw accelerations should always be checked for saturation.
Regarding the use of the measurement data for monitoring the condition of S&Cs, there is a high risk of losing important information when the data are reduced to a single number, such as peak-to-peak displacement within a bogie, or an RMS value. Furthermore, small displacements and accelerations do not necessarily indicate that the track condition is good. It is important to look at both acceleration and displacement. Site 1 has the lowest acceleration but has the worst support stiffness. Very high positive accelerations were seen on site 1, which suggest high impact between the bearer and ballast, and this is not only an indication of voided sleepers but may also be a cause of track deterioration.
Using a single accelerometer around the load transfer location at S&C is likely to see the highest acceleration, but bearers were seen with different vertical movements at each end at a switch that could only be detected with two accelerometers on a single bearer. A strongly resonant phenomenon was found near the point machine and tip of the swing-nose crossing at site 3, which has not been described in the previous literature. This phenomenon occurs away from the load transfer location and would not be observed by a single sensor at the load transfer region.
Each of the three awkward sites reveals a limitation with using accelerometer data to observe the condition of the track. Condition monitoring based on acceleration data collected from such sites is a rich source of continuing research.
Author Contributions
Conceptualization, M.E. and M.O.; methodology, M.E.; software, P.W.; validation, M.E.; formal analysis, J.-Y.S. and P.W.; investigation, M.E. and M.O.; resources, M.O.; data curation, M.E.; writing—original draft preparation, J.-Y.S.; writing—review and editing, J.-Y.S., P.W. and M.E.; visualization, J.-Y.S. and P.W.; supervision, C.R.; project administration, C.R.; funding acquisition, C.R. All authors have read and agreed to the published version of the manuscript.
Funding
Financial support came from Innovate UK grant number 104427 “AIR5” and Innovate UK grant number 10037542.
Data Availability Statement
The data presented in this study are available on request from the corresponding author.
Acknowledgments
The authors acknowledge the help provided by project partners, MoniRail Ltd., Network Rail, Network Rail High Speed (NRHS), Hitachi Europe, and Smart Component Technologies Ltd. The authors would also like to thank David Whitehead and Mathew Rippin for their support on installation of the equipment on NRHS track and Paul Davis and his team from Analog Devices for support with the sensors.
Conflicts of Interest
The authors declare no conflict of interest.
References
- Sussmann, T.R.; Ebersöhn, W.; Selig, E.T. Fundamental nonlinear track load-deflection behavior for condition evaluation. Transp. Res. Rec. J. Transp. Res. Board 2001, 1742, 61–67. [Google Scholar] [CrossRef]
- Lundqvist, A.; Dahlberg, T. Load impact on railway track due to unsupported sleepers. Proc. IMechE Part F J. Rail Rapid Transit 2005, 219, 67–77. [Google Scholar] [CrossRef]
- Bezin, Y.; Iwnicki, S.D.; Cavalletti, M.; De Vries, E.; Shahzad, F.; Evans, G. An investigation of sleeper voids using a flexible track model integrated with railway multi-body dynamics. Proc. Inst. Mech. Eng. Part F J. Rail Rapid Transit 2009, 226, 597–607. [Google Scholar] [CrossRef]
- Sysin, M.; Nabochenko, O.; Kovalchuk, V. Experimental investigation of the dynamic behavior of railway track with sleeper voids. Rail. Eng. Sci. 2020, 28, 290–304. [Google Scholar] [CrossRef]
- Sysin, M.; Przybylowicz, M.; Nabochenko, O.; Kou, L. Identification of sleeper support conditions using mechanical model supported data-driven approach. Sensors 2021, 21, 3609. [Google Scholar] [CrossRef] [PubMed]
- Milošević, M.D.; Pålsson, B.A.; Nissen, A.; Nielsen, J.C.; Johansson, H. Reconstruction of sleeper displacement from measured accelerations for model-based condition monitoring of railway crossing panels. Mech. Syst. Signal Process. 2023, 192, 110225. [Google Scholar] [CrossRef]
- Pålsson, B.A.; Vilhelmson, H.; Ossberger, U.; Sehner, M.; Milosevic, M.D.; Loy, H.; Nielsen, J.C. Dynamic vehicle–track interaction and loading in a railway crossing panel—Calibration of a structural track model to comprehensive field measurements. Veh. Syst. Dyn. 2024, 1–27. [Google Scholar] [CrossRef]
- Joh, S.-H.; Magno, K.; Hwang, S.H. Dynamic Deflection of a Railroad Sleeper from the Coupled Measurements of Acceleration and Strain. Sensors 2018, 18, 2182. [Google Scholar] [CrossRef]
- Bowness, D.; Lock, A.C.; Powrie, W.; Priest, J.A.; Richards, D.J. Monitoring the dynamic displacements of railway track. Proc. IMechE Part F J. Rail Rapid Transit 2007, 221, 13–22. [Google Scholar] [CrossRef]
- Wang, H.; Markine, V. Dynamic behaviour of the track in transitions zones considering the differential settlement. J. Sound Vib. 2019, 459, 114863. [Google Scholar] [CrossRef]
- Milne, D.; Le Pen, L.; Watson, G.; Thompson, D.; Powrie, W.; Hayward, M.; Morley, S. Proving MEMS technologies for smarter railway infrastructure. Procedia Eng. 2016, 143, 1077–1084. [Google Scholar] [CrossRef]
- Brajovic, L.M.; Malovic, M.; Popovic, Z.; Lazerevic, L. Wireless system for sleeper vibrations measurement. Commun. Sci. Lett. Univ. Zilina 2014, 16, 21–26. [Google Scholar] [CrossRef]
- Milne, D.; LePen, L.; Thompson, D.; Powrie, W. Automated processing of railway track deflection signals obtained from velocity and acceleration measurements. Proc. IMechE Part F J. Rail Rapid Transp. 2018, 232, 2097–2110. [Google Scholar] [CrossRef]
- Milne, D.; LePen, L.; Powrie, W.; Watson, G. Measuring the performance of railway track through large scale trackside sensor deployments. In Advances in Transportation Geotechnics IV: Proceedings of the 4th International Conference on Transportation Geotechnics Volume 2; Tutumluer, E., Nazarian, S., Al-Qadi, I., Qamhia, I.I.A., Eds.; Springer International Publishing: Berlin/Heidelberg, Germany, 2022; pp. 731–741. [Google Scholar] [CrossRef]
- Milne, D.; Harkness, J.; Le Pen, L.; Powrie, W. The influence of variation in track level and support system stiffness over longer lengths of track for track performance and vehicle track interaction. Veh. Syst. Dyn. 2021, 59, 245–268. [Google Scholar] [CrossRef]
- Thong, Y.K.; Woolfson, M.S.; Crowe, J.A.; Hayes-Gill, B.R.; Challis, R.E. Dependence of inertial measurements of distance on accelerometer noise. Meas. Sci. Technol. 2022, 13, 1163–1172. [Google Scholar] [CrossRef]
- Ribeiro, J.G.T.; de Castro, J.T.P.; Meggiolaro, M.A. An algorithm to minimize errors in displacement measurements via double integration of noisy acceleration signals. J. Braz. Soc. Mech. Sci. Eng. 2021, 43, 385. [Google Scholar] [CrossRef]
- Milne, D.; Le Pen, L.; Thompson, D.J.; Powrie, W. Properties of train load frequencies and their applications. J. Sound Vib. 2017, 397, 123–140. [Google Scholar] [CrossRef]
- Le Pen, L.; Milne, D.; Thompson, D.; Powrie, W. Evaluating railway track support stiffness from trackside measurements in the absence of wheel load data. Can. Geotech. J. 2016, 53, 1156–1166. [Google Scholar] [CrossRef]
- Lamas-Lopez, F.; Cui, Y.J.; D’Aguiar, S.C.; Calon, N. Assessment of integration method for displacement determination using field accelerometer and geophone data. J. Zheliang Univ.-Sci. A Appl. Phys. Eng. 2017, 18, 553–566. [Google Scholar] [CrossRef]
- Shih, J.Y.; Weston, P.; Entezami, M.; Roberts, C. Dynamic characteristics of a switch and crossing on the West Coast main line in the UK. Rail. Eng. Sci. 2022, 30, 183–203. [Google Scholar] [CrossRef]
Disclaimer/Publisher’s Note: The statements, opinions and data contained in all publications are solely those of the individual author(s) and contributor(s) and not of MDPI and/or the editor(s). MDPI and/or the editor(s) disclaim responsibility for any injury to people or property resulting from any ideas, methods, instructions or products referred to in the content. |
© 2024 by the authors. Licensee MDPI, Basel, Switzerland. This article is an open access article distributed under the terms and conditions of the Creative Commons Attribution (CC BY) license (https://creativecommons.org/licenses/by/4.0/).